The modulation of neural gain facilitates a transition between functional segregation and integration in the brain
- Stanford University, United States
- The University of Sydney, Australia
- QIMR Berghofer Medical Research Institute, Australia
- Metro North Mental Health Service, Australia
Figures
Figure 1
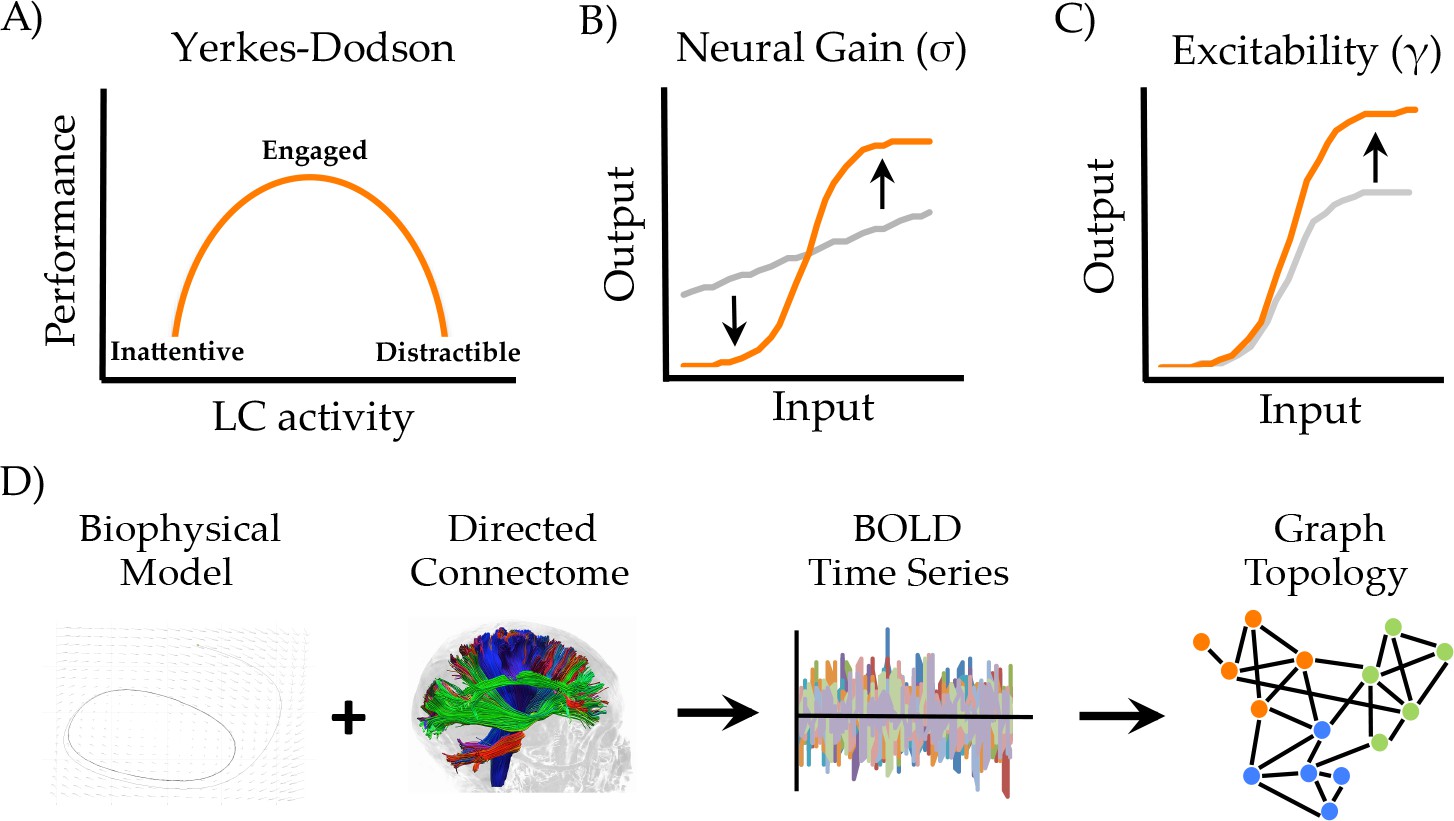
Manipulating neural gain.
(a) the Yerkes-Dodson relationship linking activity in the locus coeruleus nucleus to cognitive performance; (b) neural gain is modeled by a parameter (σ) that increases the maximum slope of the transfer function between incoming and outgoing activity within a brain region; (c) excitability is modeled by a parameter (γ) that amplifies the level of output; (d) the approach presently used to estimate network topology from the biophysical model.
Figure 2 with 4 supplements
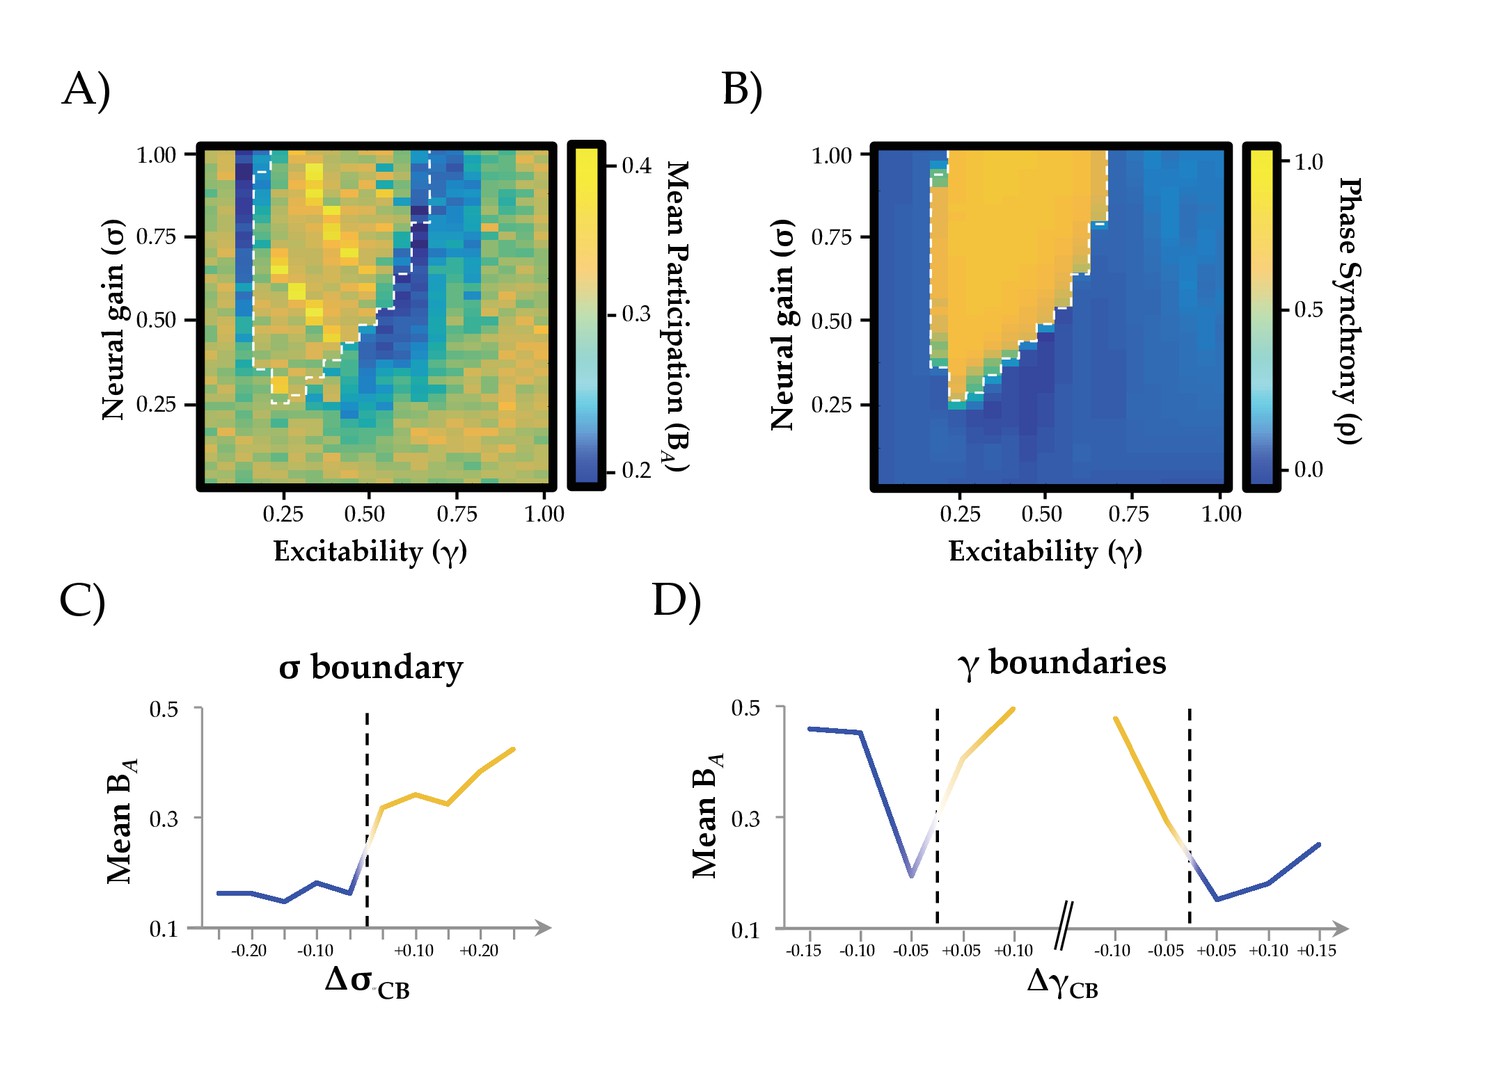
Network Integration and Phase Synchrony.
(a) mean participation as a function of σ and γ; (b) phase synchrony (ρ) as a function of σ and γ; (c) mean participation (BA) aligned to the critical point (represented here as a dotted line) as a function of increasing σ; (d) BA aligned to the critical point as a function of increasing γ – the left and right dotted lines depicts the synchrony change at low and high γ, respectively. The y-axis in (c) and (d) represents the distance in parameter space aligned to the critical point/bifurcation for either σ (ΔσCB; mean across 0.2 ≤ γ ≤0.6) or γ (ΔγCB; mean across 0.3 ≤ σ ≤1.0). Lines are colored according to the state of phase synchrony on either side of the bifurcation (blue: low synchrony; yellow: high synchrony).
Figure 2—figure supplement 1
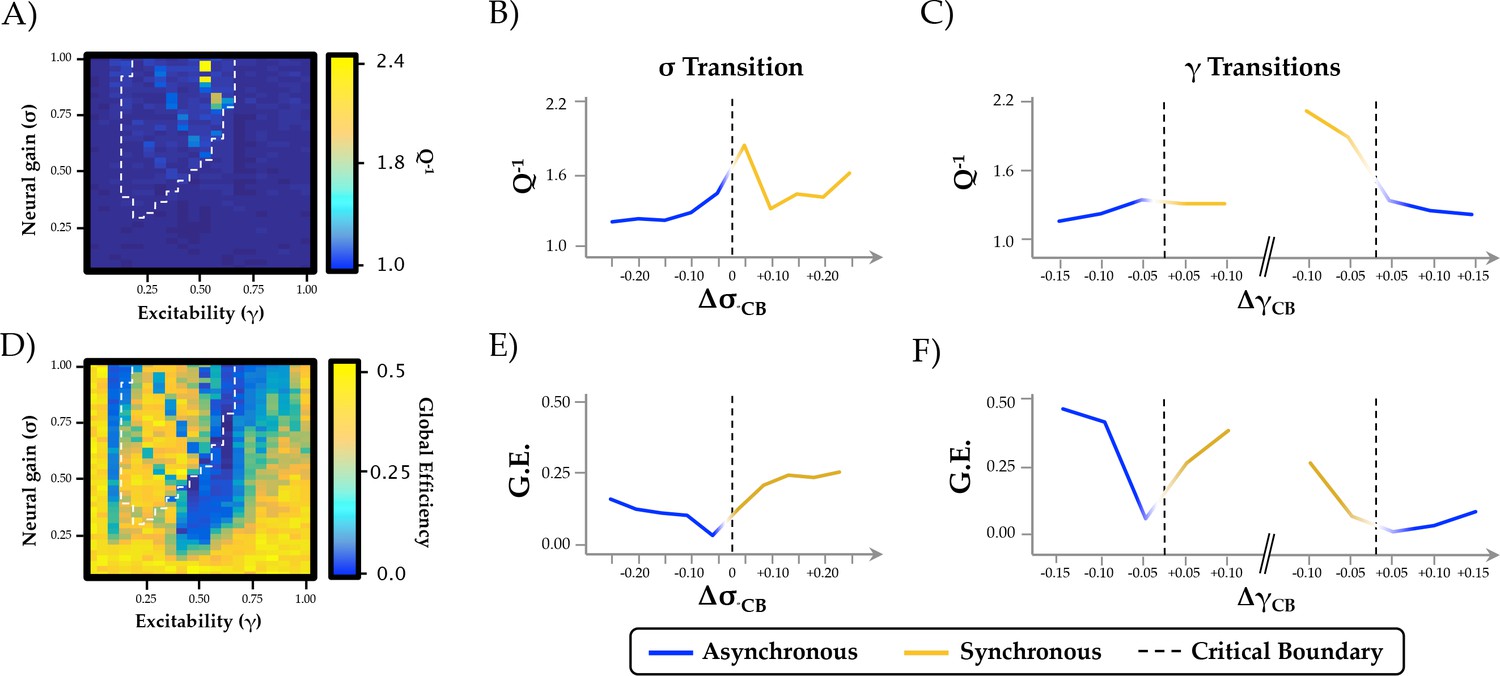
Relationship between phase regimen boundary and alternative measures of network integration.
(a-c) the inverse modularity (Q−1) was maximal following the σ boundary (ΔσCP; mean across 0.2 ≤ γ ≤0.6) and the immediately prior to the abrupt phase transition at high γ (ΔγCP; mean across 0.3 ≤ σ ≤1.0); (d-f) global efficiency (G.E.) was maximally variable with increasing σ and across the critical boundary at high γ.
Figure 2—figure supplement 2
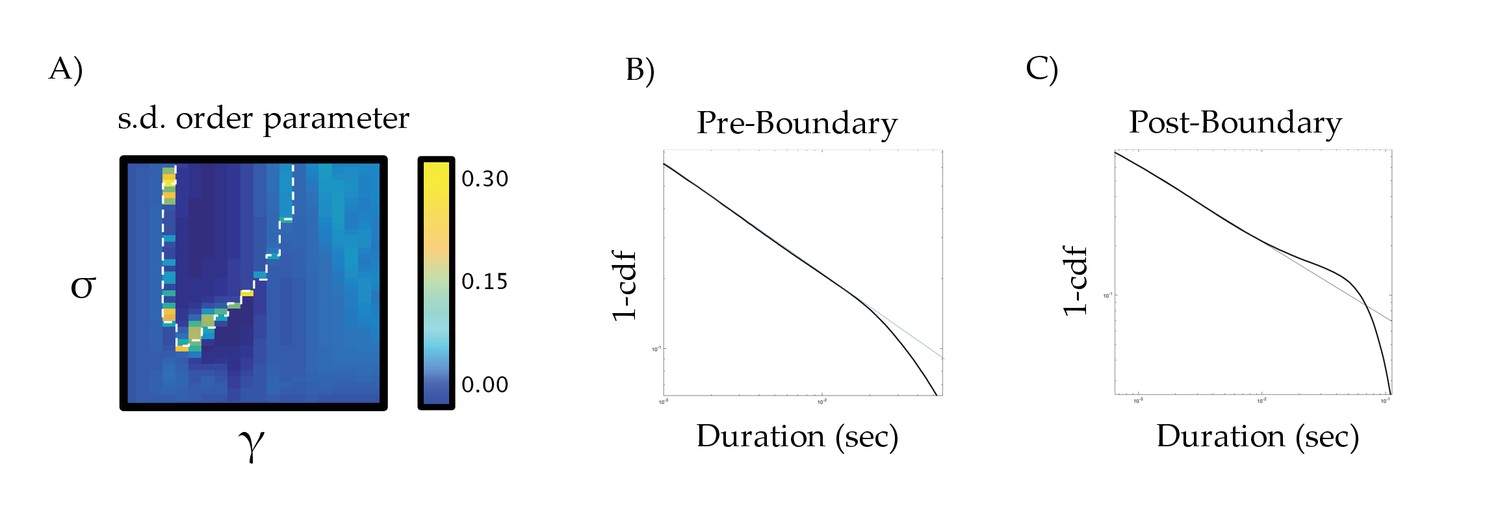
Standard deviation of the order parameter across the parameter space.
(a) standard deviation of order parameter across the parameter space; (b) fluctuation scaling pre-boundary (σ = 0.375 and γ = 0.50); and (c) post-boundary (σ = 0.50 and γ = 0.575) – the thin blue line denotes a Pareto (i.e., power law) scaling effect.
Figure 2—figure supplement 3
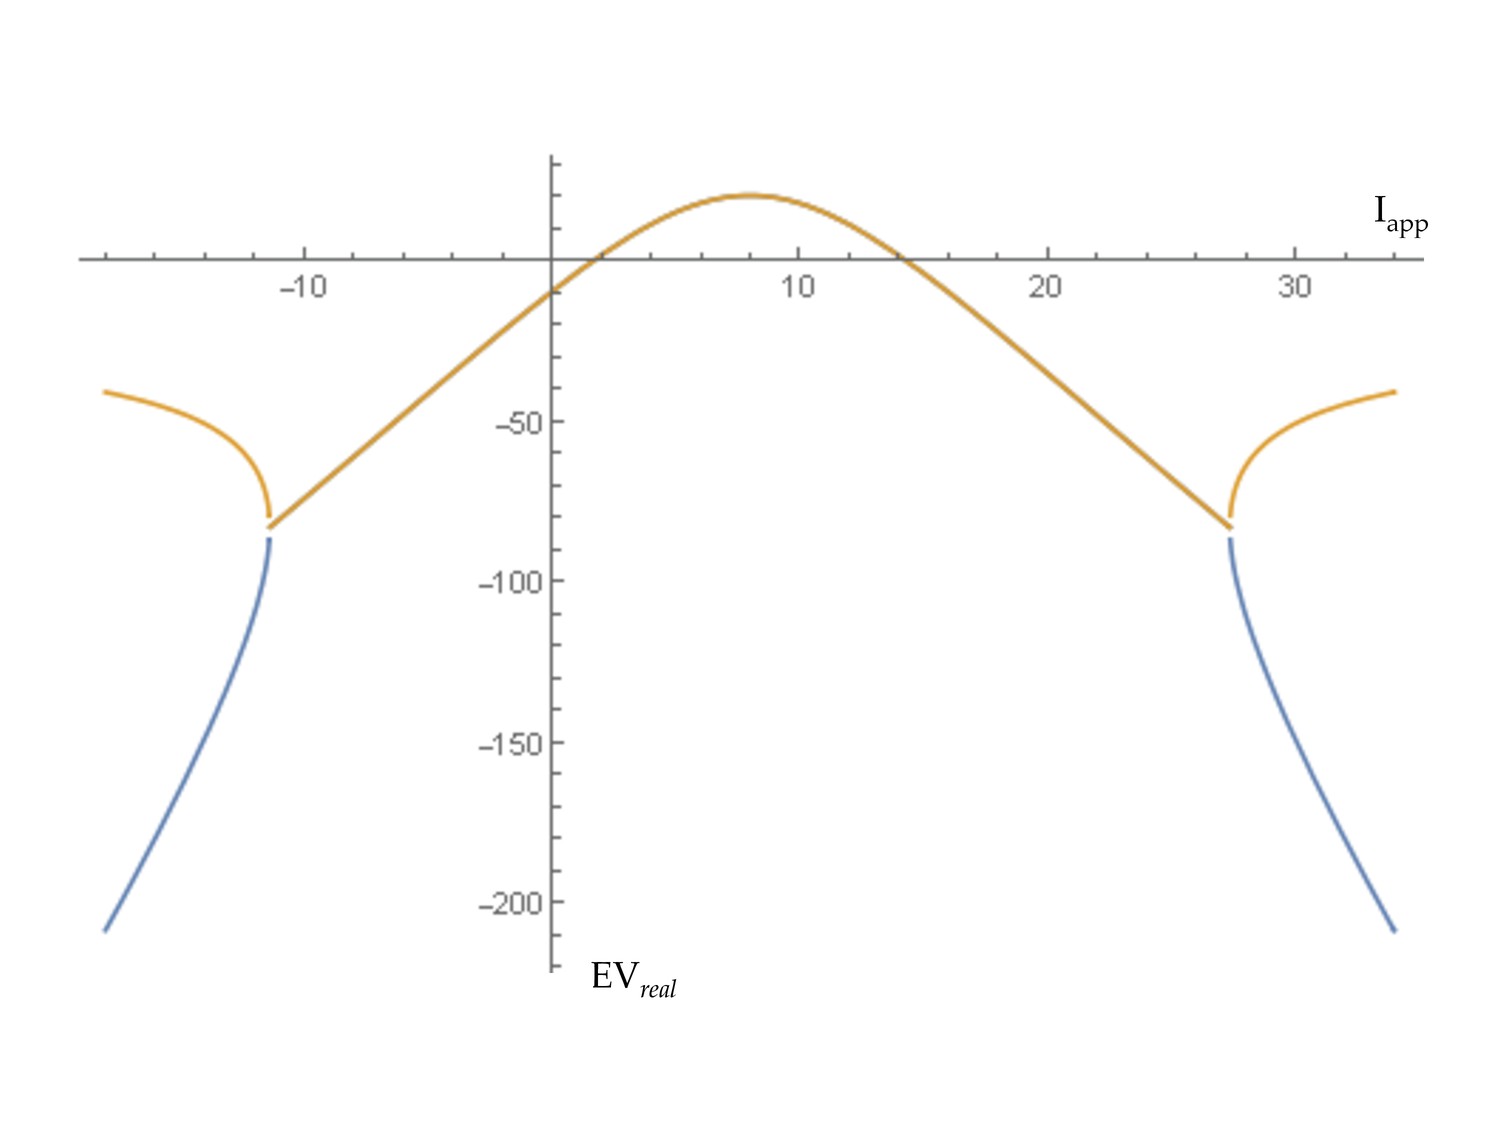
Transition to self-sustained oscillations in a single brain region.
For the generic 2D oscillator model this shows the real parts of eigenvalues at equilibrium as the level of input (Iapp) to a region is increased. A transition to self-sustained oscillations in a local region occurs where this curve crosses zero. That regime is bounded by supercritical Hopf bifurcations at Iapp = 2.0 and Iapp = 14.
Figure 2—figure supplement 4
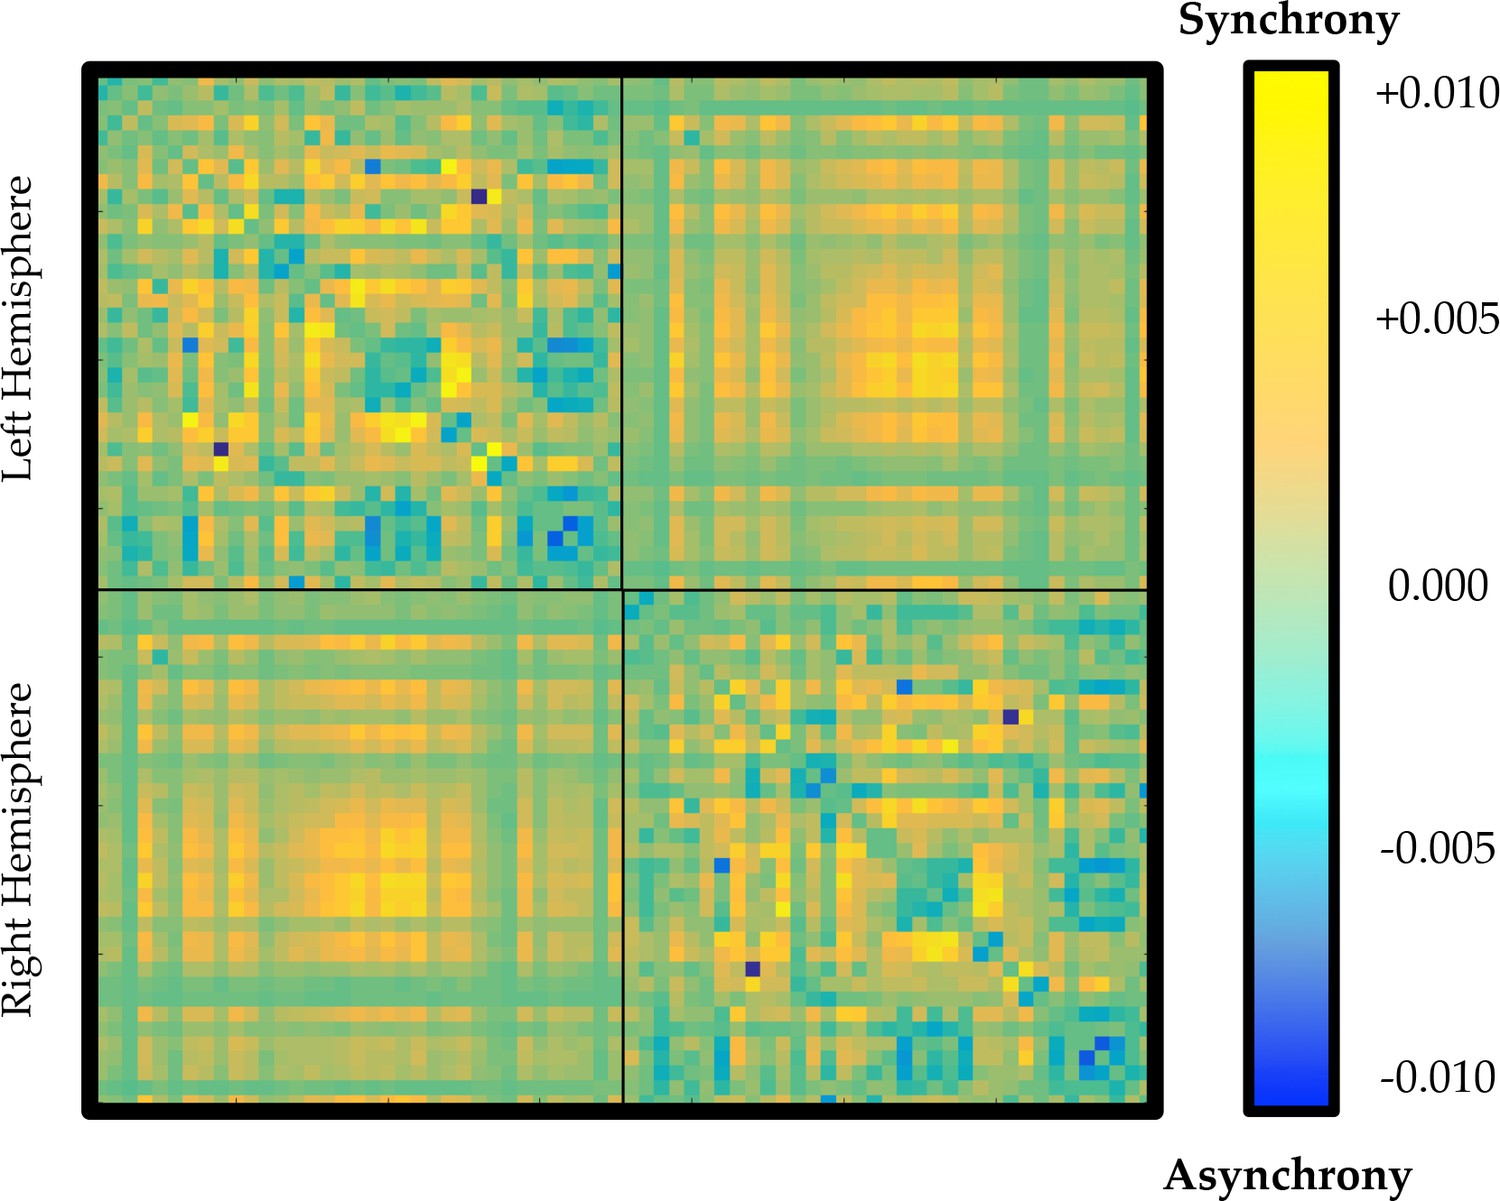
Average time-averaged connectivity matrix in regions of the parameter space associated with high (yellow) or low (blue) ordered phase synchrony.
https://doi.org/10.7554/eLife.31130.007
Figure 3
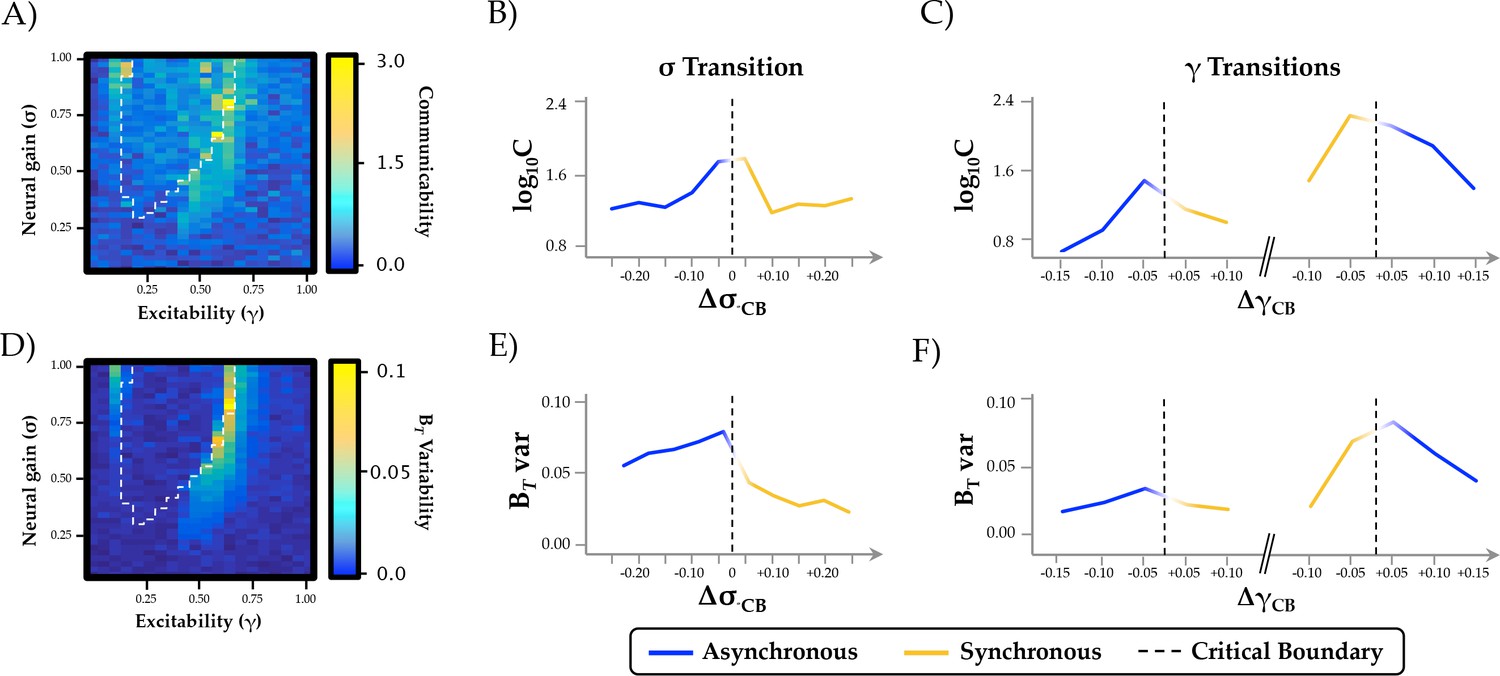
Topological and temporal relationships with phase regimen boundary.
(a-c) network communicability was maximal following the σ boundary (ΔσCP; mean across 0.2 ≤ γ ≤0.6) and the immediately prior to the abrupt phase transition at high γ (ΔγCP; mean across 0.3 ≤ σ ≤1.0); (d-f) time-resolved between-module participation (BT) was maximally variable with increasing σ and across the critical boundary at high γ.
Figure 4 with 2 supplements
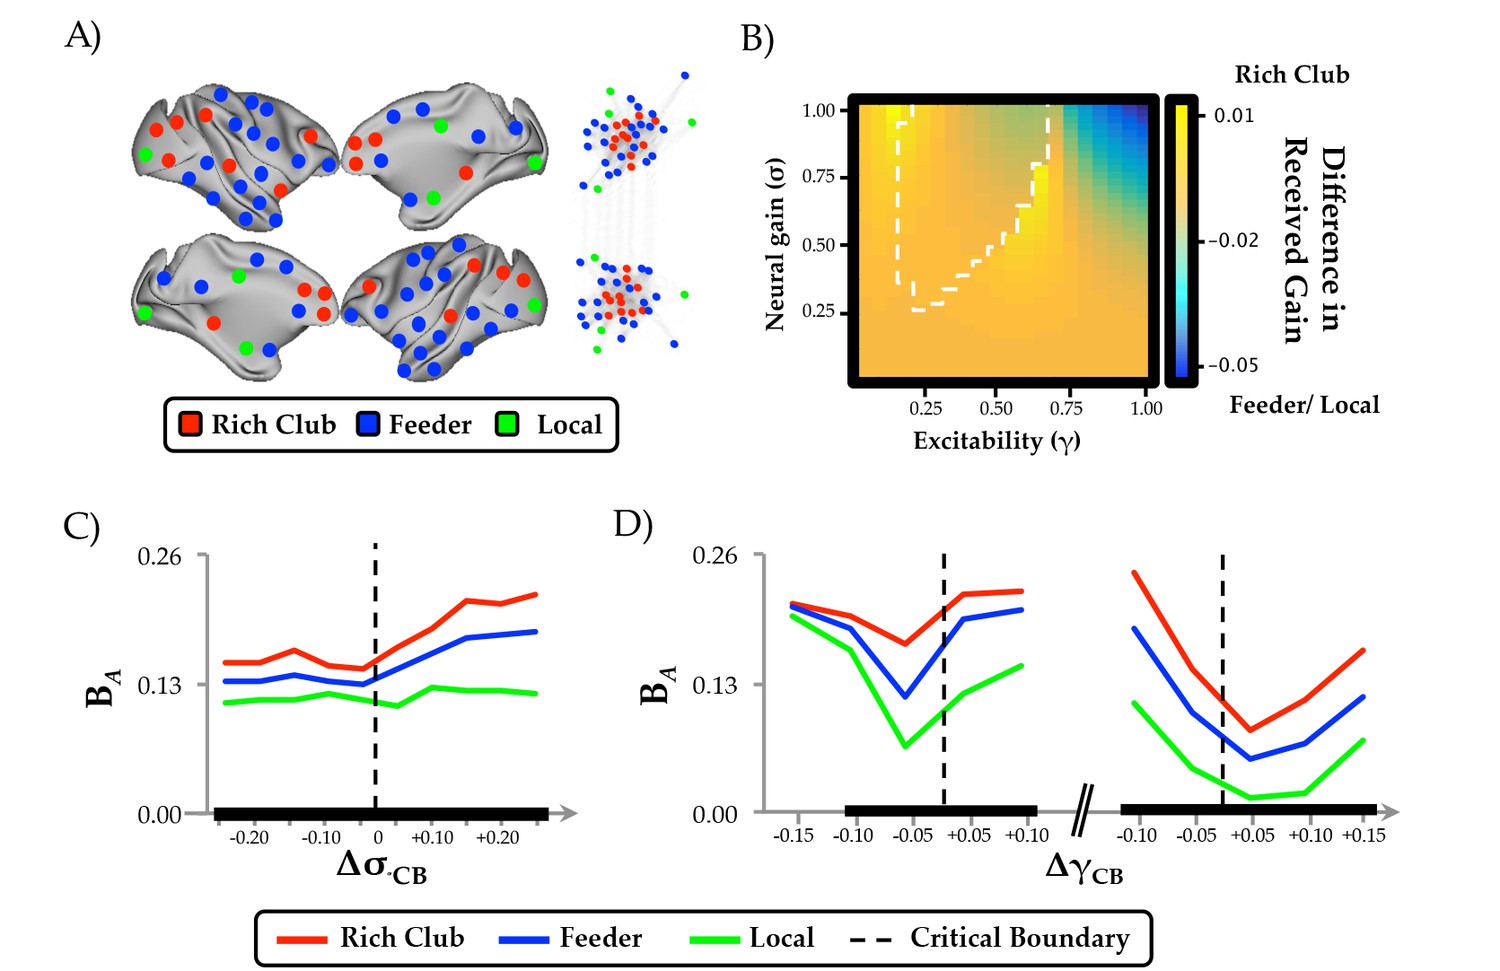
Regional clustering results.
(a) regions from the CoCoMac data organized according to rich club (red), feeder (blue) or local (green) status, along with a force-directed plot of the top 10% of connections (aligned by hemisphere), colored according to structural hub connectivity status; (b) the rich club cluster demonstrated an increase in realized mean gain (the relative output as a function of its’ unique topology) at the bifurcation boundary, compared to feeder and local nodes, which showed higher realized gain at high levels of σ and γ; (c) the three clusters of regions also demonstrated differential responses to neural gain; and (d) excitability. The black lines in (c) and (d) denote significant differences in BA between the two groups.
Figure 4—figure supplement 1
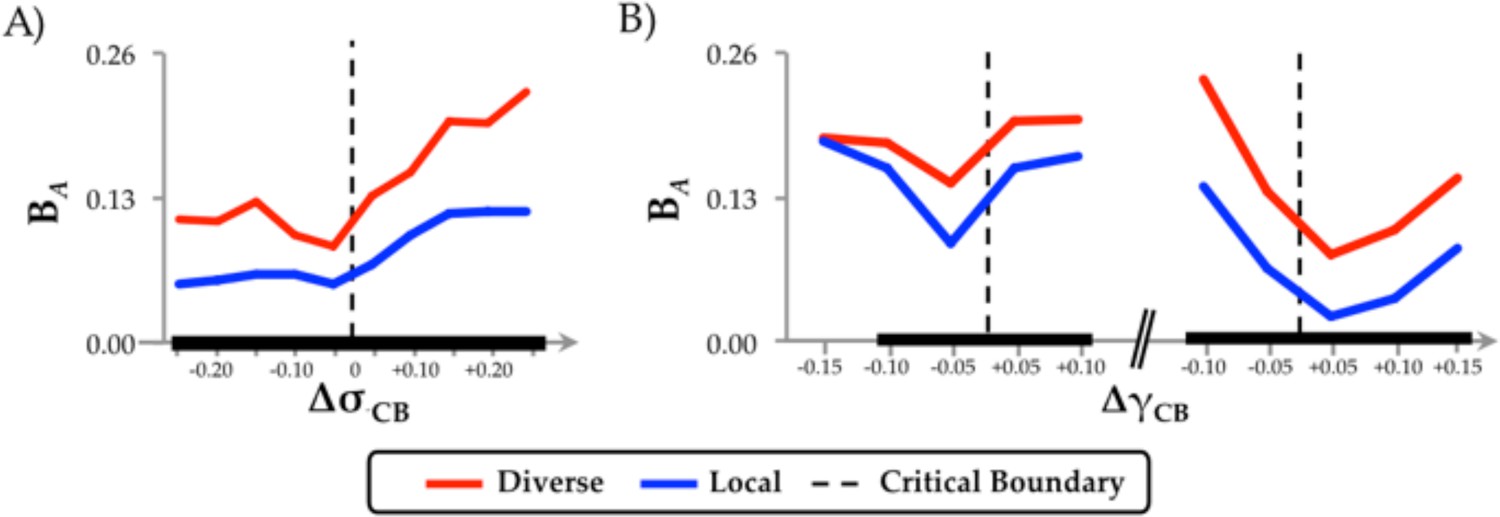
Diverse Club.
(a) regional differences in integration (BA) as a function of changes in neural gain; and (b) excitability, separated into regions within or outside the diverse club.
Figure 4—figure supplement 2
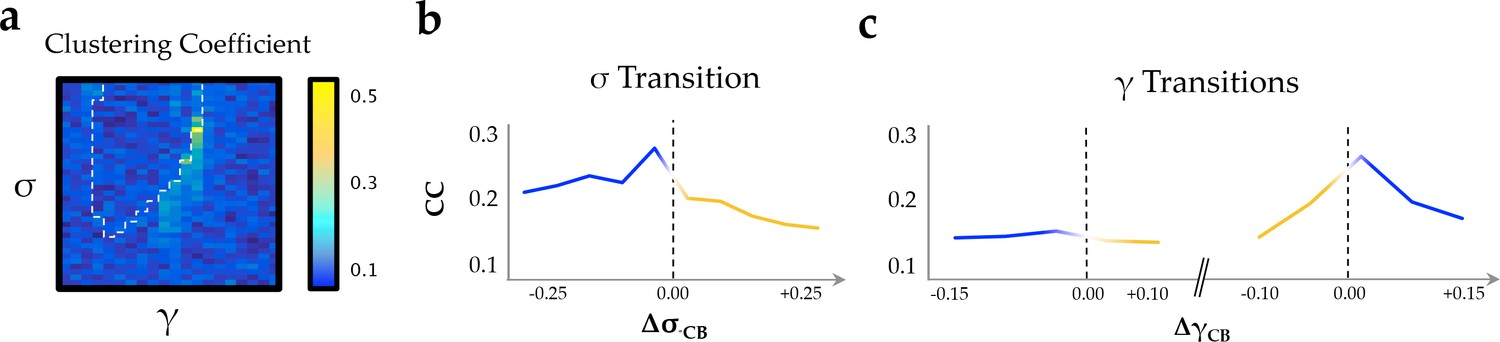
Clustering coefficient.
(a) clustering coefficient across the parameter space; (b) as a function of changes in neural gain; and (c) excitability.
Author response image 1
Author response image 2
Additional files
-
Transparent reporting form
- https://doi.org/10.7554/eLife.31130.012
Download links
A two-part list of links to download the article, or parts of the article, in various formats.
Downloads (link to download the article as PDF)
Open citations (links to open the citations from this article in various online reference manager services)
Cite this article (links to download the citations from this article in formats compatible with various reference manager tools)
The modulation of neural gain facilitates a transition between functional segregation and integration in the brain
eLife 7:e31130.
https://doi.org/10.7554/eLife.31130


