Inverted formin 2 regulates intracellular trafficking, placentation, and pregnancy outcome
- Cincinnati Children’s Hospital Medical Center, United States
- University of Cincinnati College of Medicine, United States
- University of Cincinnati College of Medicine, Cincinnati Children’s Hospital Medical Center, United States
- Vanderbilt University, United States
- University Hospitals Cleveland Medical Center, United States
Figures
Figure 1 with 1 supplement
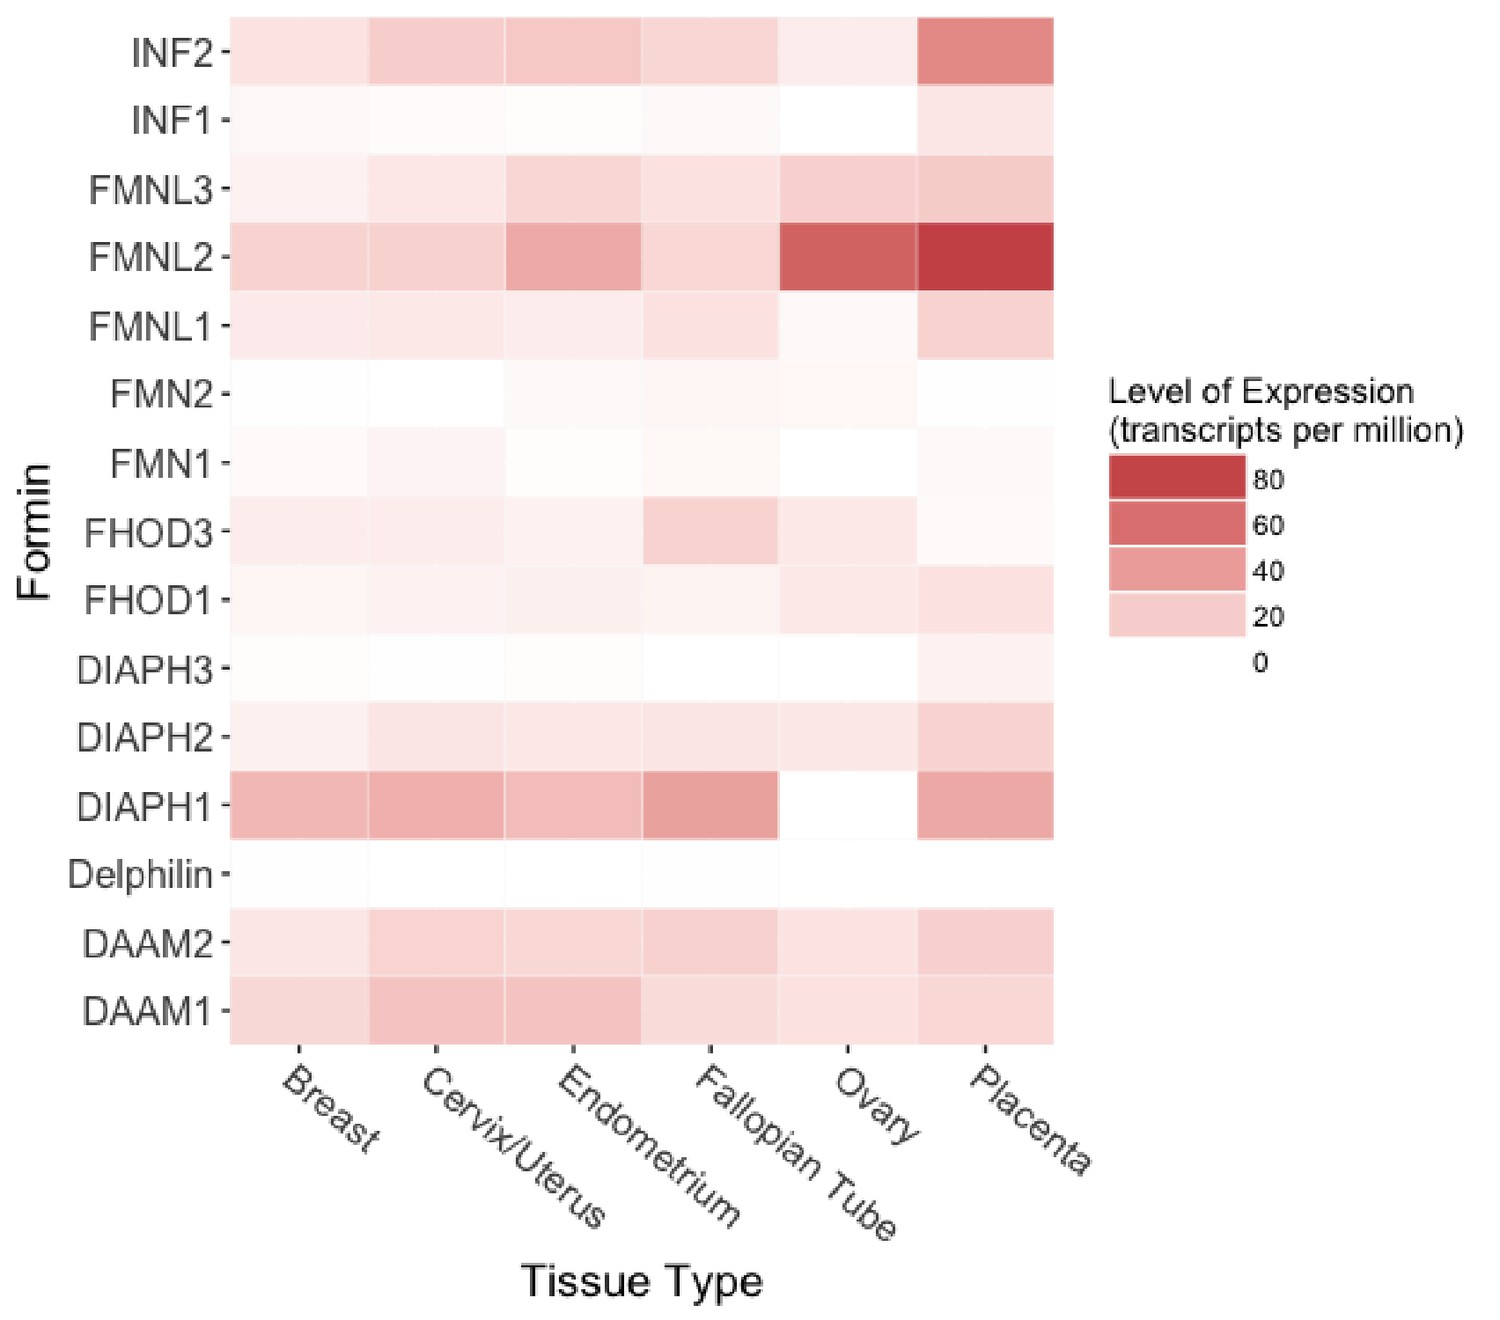
Protein expression of formin family members in human female reproductive tissues.
Expression levels range from 0.1 to 82.3 transcripts per million (TPM) across the six tissues. Raw data obtained from the Human Protein Atlas database (Uhlén et al., 2015).
Figure 1—figure supplement 1
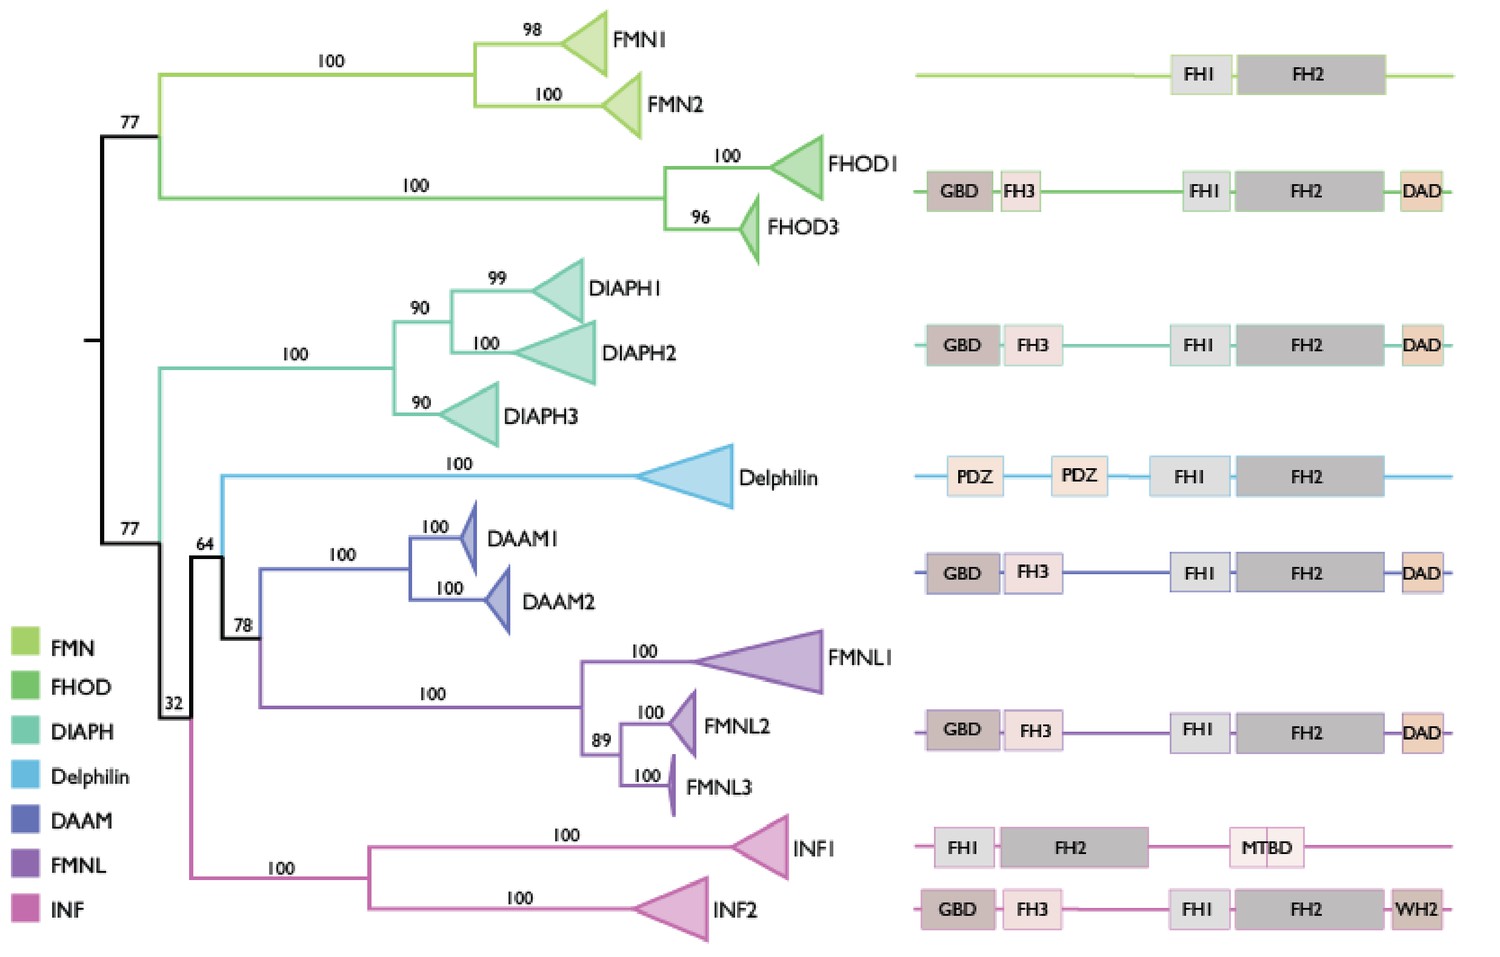
Phylogeny of the FH2 domains of 15 formin orthologs across representative primate and model mammal species.
Individual branches showing sequences from each species for each formin gene are collapsed, such that only the relationships among the 15 formin ortholog groups are shown. The formin domain architecture for each ortholog group or set of groups is based on previously described structure and classification (Chalkia et al., 2008; Schönichen and Geyer, 2010).
Figure 2 with 2 supplements
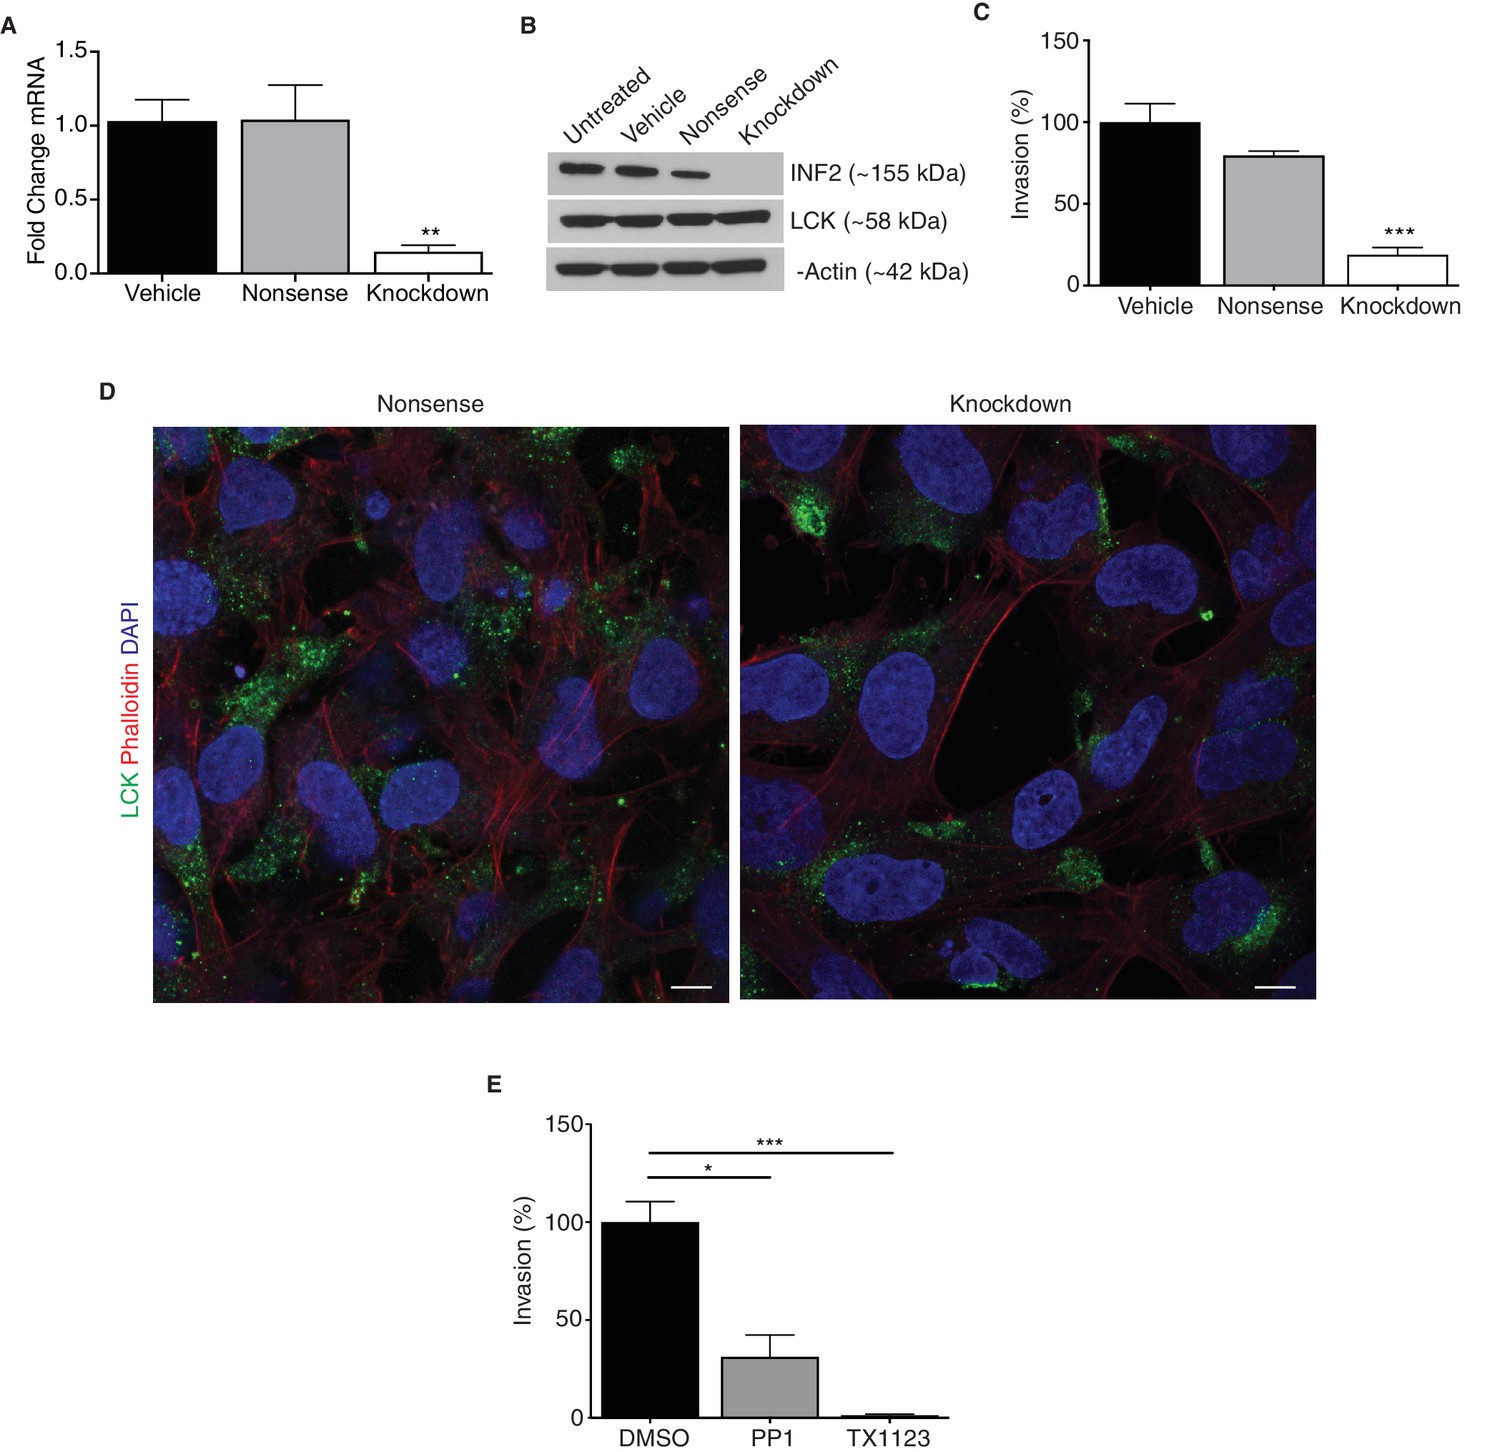
INF2 is necessary for proper EVT invasion and intracellular targeting of LCK.
siRNA targeting INF2 efficiently reduced expression in HTR-8/SVneo trophoblasts by qPCR (A) (n = 4; 1.0 ± 0.14 vs 1.05 ± 0.23 vs 0.15 ± 0.04; **p<0.01) and Western blot analysis (B). (C) INF2 reduction in HTR-8/SVneo cells significantly impeded invasion of these cells through Matrigel (n = 3; 100 ± 11.3 vs 79.44 ± 2.83 vs 18.85 ± 4.46%; ***p<0.001, analyzed by 1-way ANOVA). (D) Consistent with results published in Jurkat T lymphocytes, INF2 reduction restricted LCK to the perinuclear region in cultured EVTs as opposed to cytoplasmic distribution in nonsense siRNA treated EVTs (scale bar: 10 μm). (E) Treatment with the LCK/FYN-specific inhibitor PP1 or the SRC inhibitor TX1123 also significantly restricted the ability of these cells to invade (n = 3; 100 ± 10.49 vs 31.23 ± 11.09 vs 1.34 ± 0.51%; *p<0.05, ***p<0.001). All data represent the mean ±SEM and were analyzed by unpaired 2-tailed t test, unless otherwise noted.
Figure 2—figure supplement 1
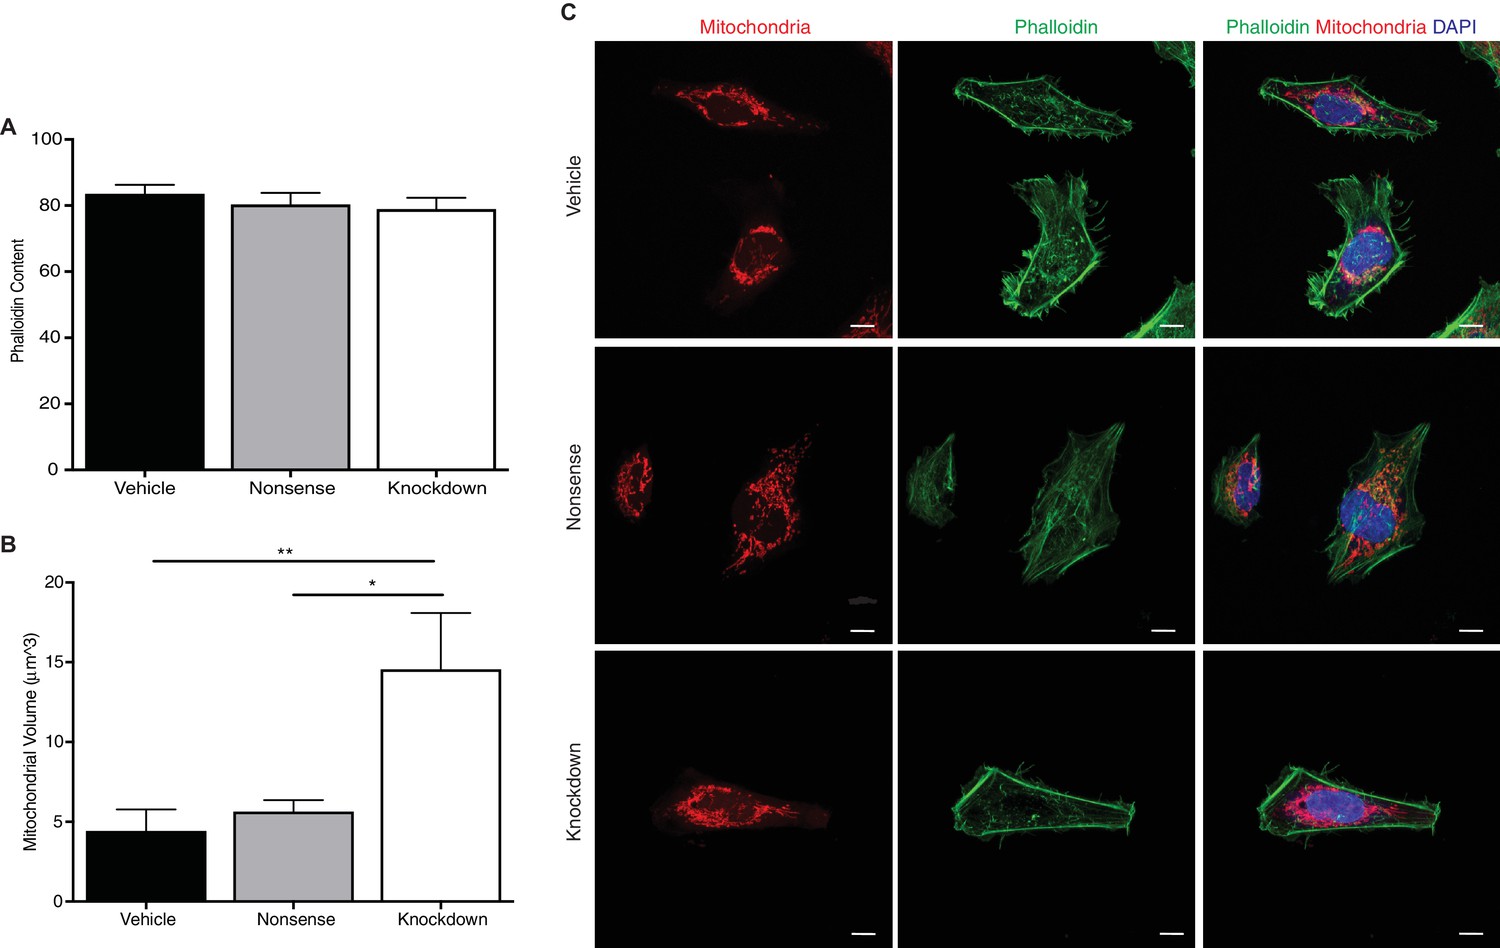
Reduction of INF2 does not alter overall cytoplasmic phalloidin but significantly increases mitochondrial volume in EVTs.
F-actin content of HTR-8/SVneo trophoblasts was not significantly changed by siRNA knockdown of INF2 (A) and (C) (n = 15; 83.55 ± 2.68 vs 80.34 ± 3.43 vs 78.95 ± 3.42, analyzed by 1-way ANOVA). Consistent with results published in U2OS cells, INF2 reduction significantly increased mitochondrial size (B) and (C) (n = 15; 4.446 ± 1.44 vs 5.65 ± 0.82 vs 14.57 ± 3.52; **p<0.01, calculated by Tukey’s multiple comparison test; scale bar: 10 μm). All data represent the mean ±SEM and were analyzed by unpaired 2-tailed t test, unless otherwise noted.
Figure 2—figure supplement 2
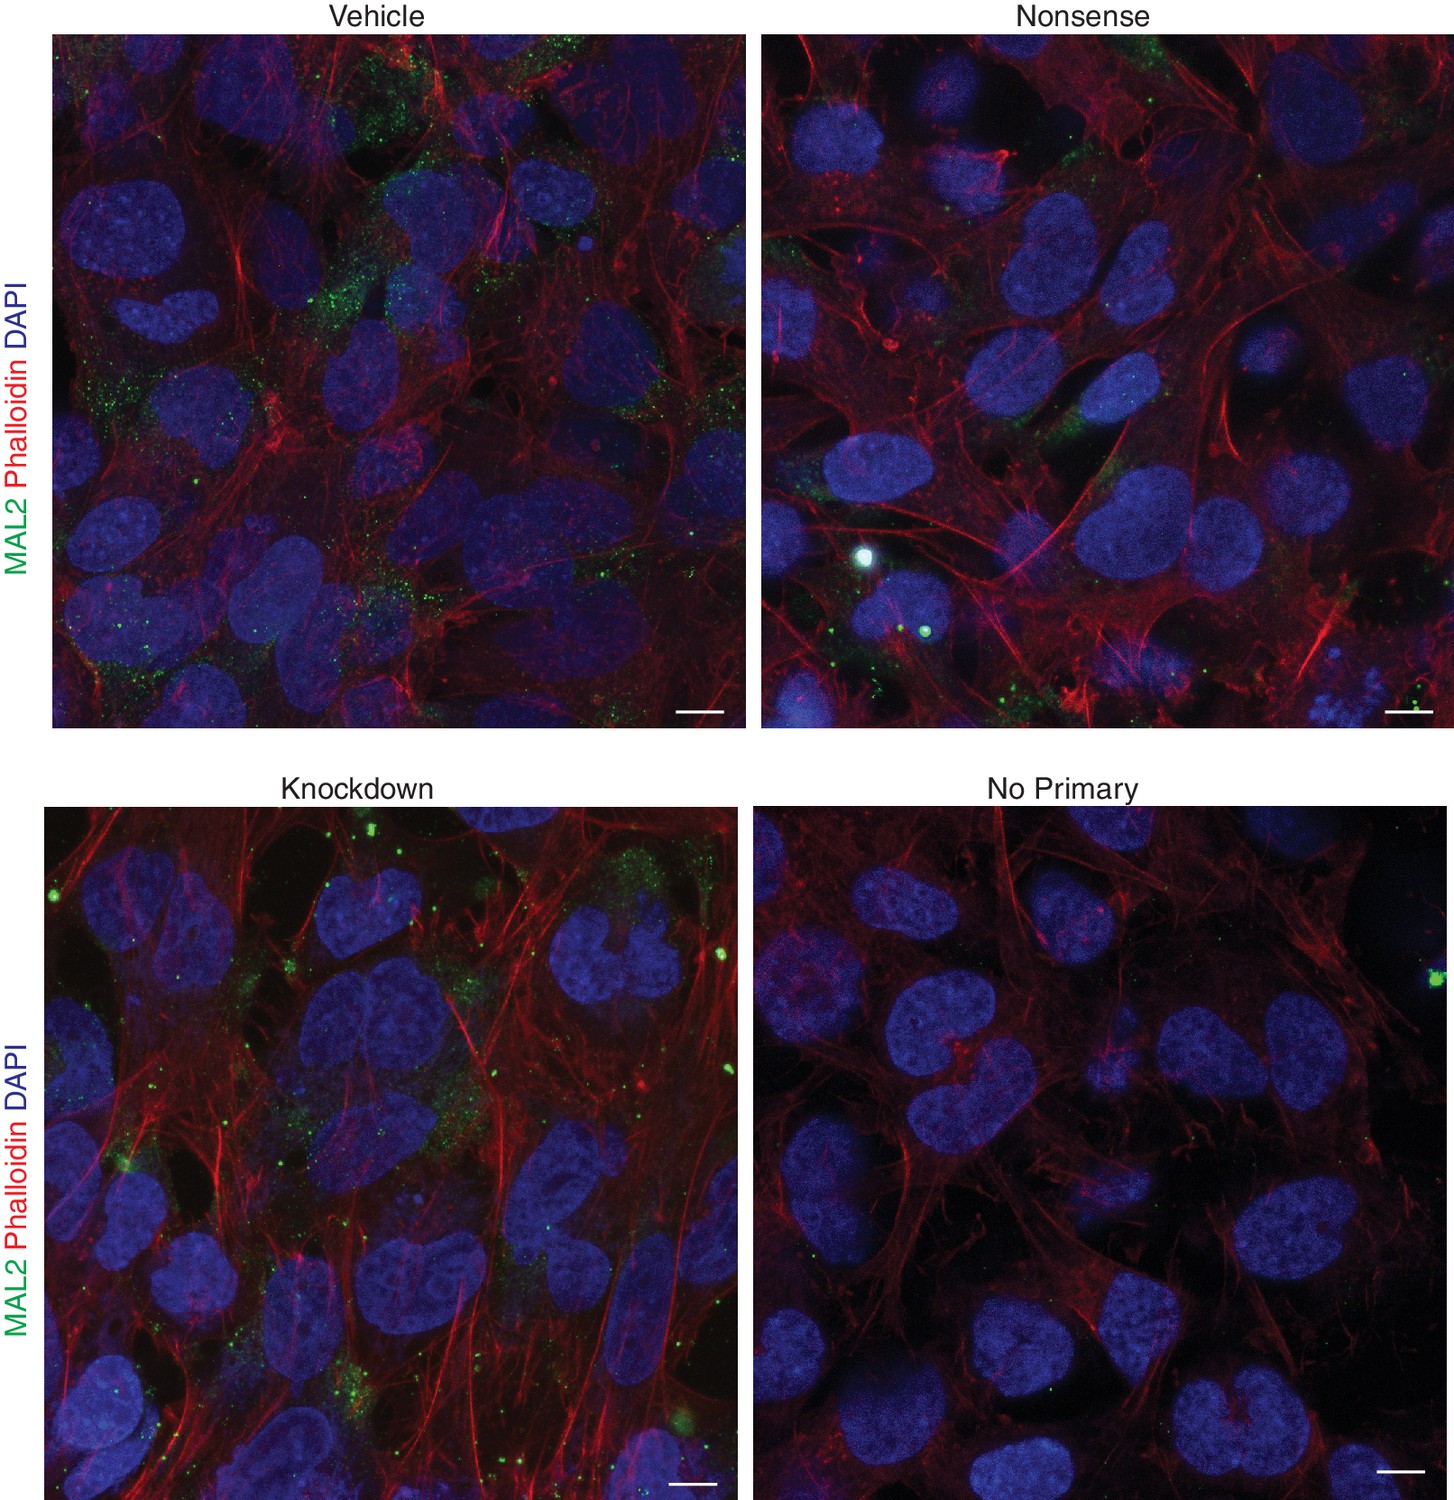
Effect of INF2 deficiency on MAL2 localization in an in vitro model of human extravillous trophoblast.
MAL2 is distributed throughout the cytoplasm in vehicle-, nonsense siRNA-, and knockdown siRNA-treated HTR-8/SVneo cells, similar to what has been reported in hepatoma HepG2 cells (scale bar: 10 μm).
Figure 3

Inf2 is highly expressed in the mouse placenta and co-localizes with trophoblast markers.
(A) Timecourse of Inf2 mRNA levels in C57Bl/6J mice at E13.5, E15.5, and E18.5 (n = 2, 5, 5; 1.01 ± 0.12 vs 3.21 ± 0.62 vs 0.96 ± 0.45; *p<0.05 by 1-way ANOVA). (B) IHC of E15.5 placentas reveal dense, specific staining of Inf2 throughout the Inf2+/+ labyrinth, junctional zone, and decidua with no positive staining in the Inf2−/− placenta (scale bar: 500 μm). (C) Consistent with our in vitro data, at E15.5, Lck is localized throughout trophoblast cells in the Inf2+/+ placenta while it is mostly perinuclear in Inf2−/− placentas (scale bar: 50 μm). (D) Inf2 does not co-localize with endothelial cell marker endomucin, but co-localizes with the pan-trophoblast marker cytokeratin-7 and the TGC marker proliferin in Inf2+/+ E15.5 placentas (scale bar: 50 μm). All data represent the mean ±SEM.
Figure 4 with 1 supplement
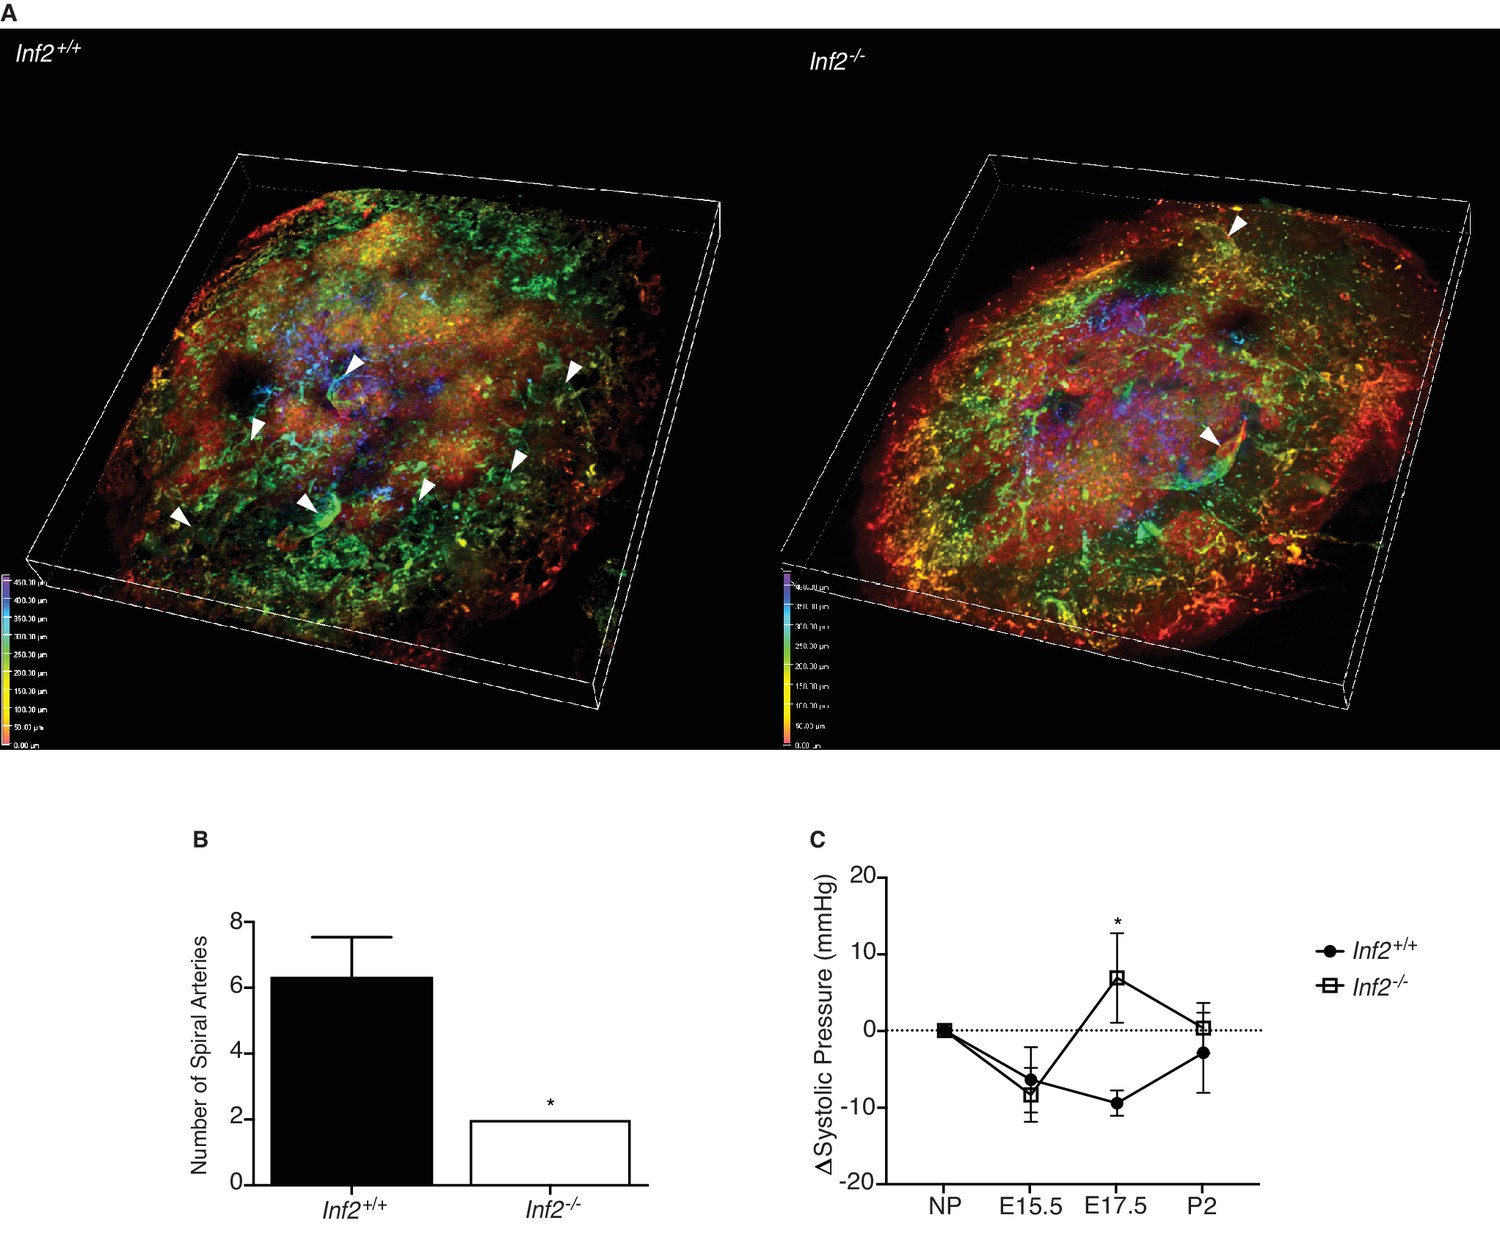
Loss of Inf2 alters maternal spiral artery remodeling, resulting in systemic hypertension late in pregnancy.
(A) Lectin-tagged maternal spiral arteries (arrowheads) were visualized in E19.0 placentas after clearing. Positive staining was depth coded in the 3D image based on position in Z (0.00 μm in red, 50.00 μm in orange, 150.00 μm in yellow, 250.00 μm in green, 350.00 μm in cyan, 400.00 μm in indigo, and 450.00 μm in violet). (B) The number of fully extended spiral arteries was quantified and found to be significantly reduced in Inf2−/− placentas compared to wildtype placentas (n = 3; 6.33 ± 1.2 vs 2 ± 0; *p<0.05). (C) Calculated as change (Δ) from the non-pregnant state (NP; n = 9, 8; 0.00 ± 0.00 mmHg), the systolic blood pressure of both Inf2+/+ and Inf2−/− females decreased at E15.5 (-6.422 ± 4.262 vs −8.395 ± 3.523 mmHg). At E17.5, blood pressure was significantly elevated in Inf2−/− females, while Inf2+/+ blood pressure remained unchanged (−9.468 ± 1.650 vs 6.871 ± 5.834 mmHg; *p<0.05). By P2, both Inf2+/+ and Inf2−/− systolic blood pressure returned to pre-pregnancy levels (−2.902 ± 5.222 vs 0.331 ± 3.266 mmHg). All data represent the mean ±SEM and were analyzed by unpaired 2-tailed t test, unless otherwise noted.
Figure 4—figure supplement 1

Effect of Inf2 deficiency on angiogenic factors in serum.
Despite a trend of higher placental growth factor-2 (Plgf-2) in Inf2−/− maternal serum at E15.5 (n = 8, 7; 8.909 ± 1.143 vs 13.246 ± 2.856), there were no significant differences detected at E15.5 or E18.5 (n = 9, 7; 8.359 ± 1.258 vs 8.255 ± 2.244). Similarly, no differences were seen in serum vascular endothelial growth factor receptor type 1 (FMS-like tyrosine kinase 1, Flt1) levels at E15.5 (n = 8, 7; 29129 ± 5743 vs 30148 v 5502) or E18.5 (n = 9, 8; 47775 ± 2655 vs 49190 ± 8401) in Inf2+/+ or Inf2−/− females. All data represent the mean ±SEM and were analyzed by unpaired 2-tailed t test, unless otherwise noted.
Figure 5 with 3 supplements
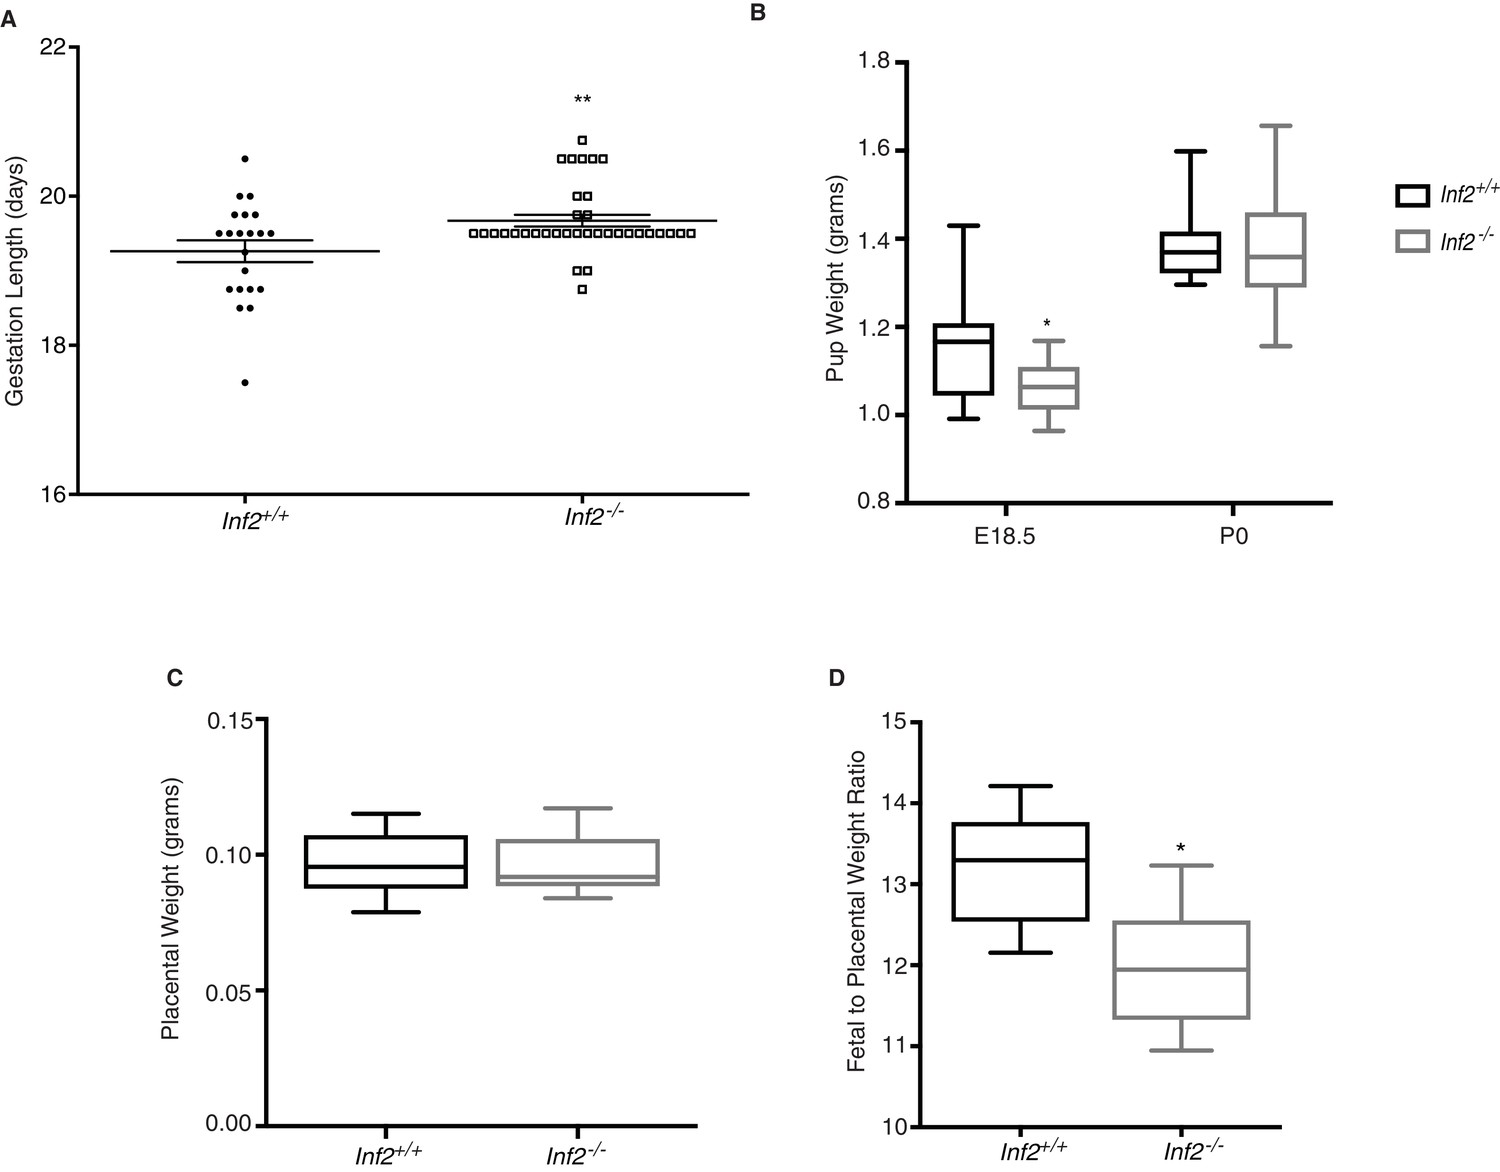
Murine Inf2 is important for regulating gestation length and fetal growth.
(A) Gestation lengths measured from visualization of a copulatory plug (n = 21, 35 dams; 19.26 ± 0.15 vs 19.67 ± 0.08 days; **p<0.01). (B) Pup weights at E18.5 were significantly reduced in Inf2−/− dams (n = 15, 13; 1.152 ± 0.03 vs 1.062 ± 0.018 grams; *p<0.05) while no difference in pup weight was measured at time of birth (P0; n = 10, 32; 1.358 ± 0.013 vs 1.359 ± 0.01 grams). (C) No significant differences in placental weight at E18.5 were detected (n = 13; 0.096 ± 0.003 vs 0.096 ± 0.003 grams). (D) The ratio of fetal weight to placental weight was significantly reduced in Inf2−/− dams (n = 6; 13.18 ± 0.298 vs 11.947 ± 0.326; *p<0.05). Data are presented as a boxplot (median, interquartile range, minimum, and maximum). All data represent the mean ±SEM and were analyzed by unpaired 2-tailed t test, unless otherwise noted.
Figure 5—figure supplement 1
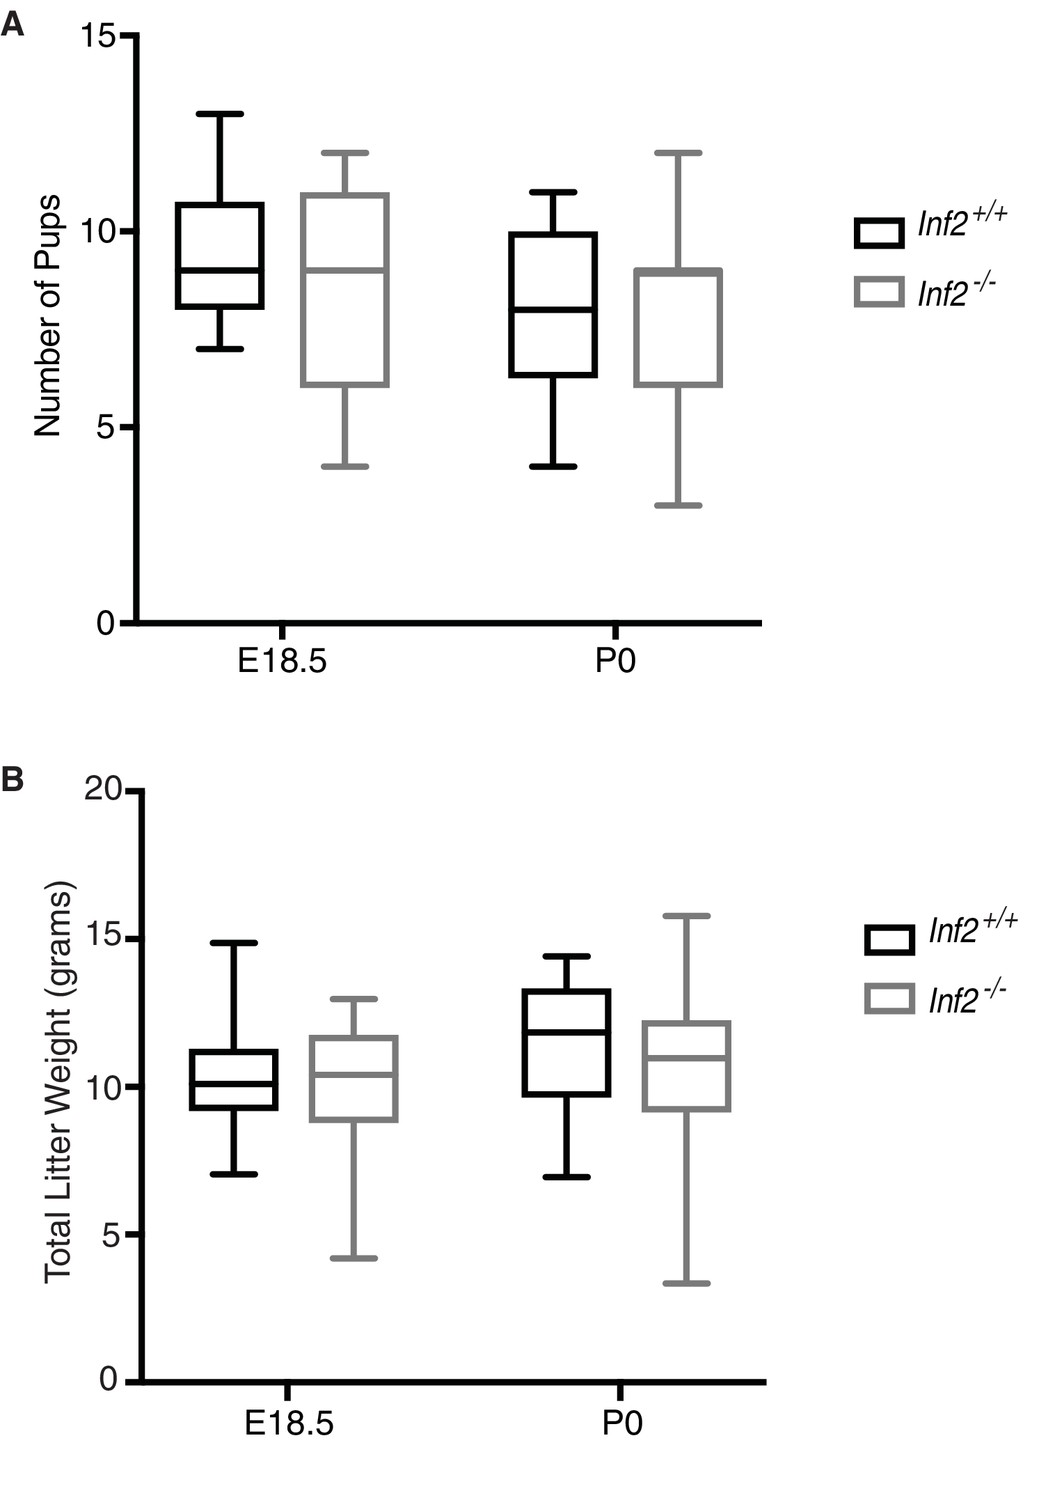
Effects of loss of Inf2 on number of pups from live births and total litter weight.
(A) Number of pups from live births were not different between genotypes (E18.5, n = 15, 13; P0, n = 20, 35; 9 ± 0.44 vs 8 ± 0.59; 8 ± 0.47 vs 8 ± 0.40). (B) Total litter weight did not differ between genotypes (E18.5, n = 15, 14; 10.278 ± 0.465 vs 9.712 ± 0.721; P0, n = 10, 20, 11.412 ± 0.746 vs 10.201 ± 0.739). Data are presented as a boxplot (median, interquartile range, minimum, and maximum). All data represent the mean ±SEM and were analyzed by unpaired 2-tailed t test, unless otherwise noted.
Figure 5—figure supplement 2
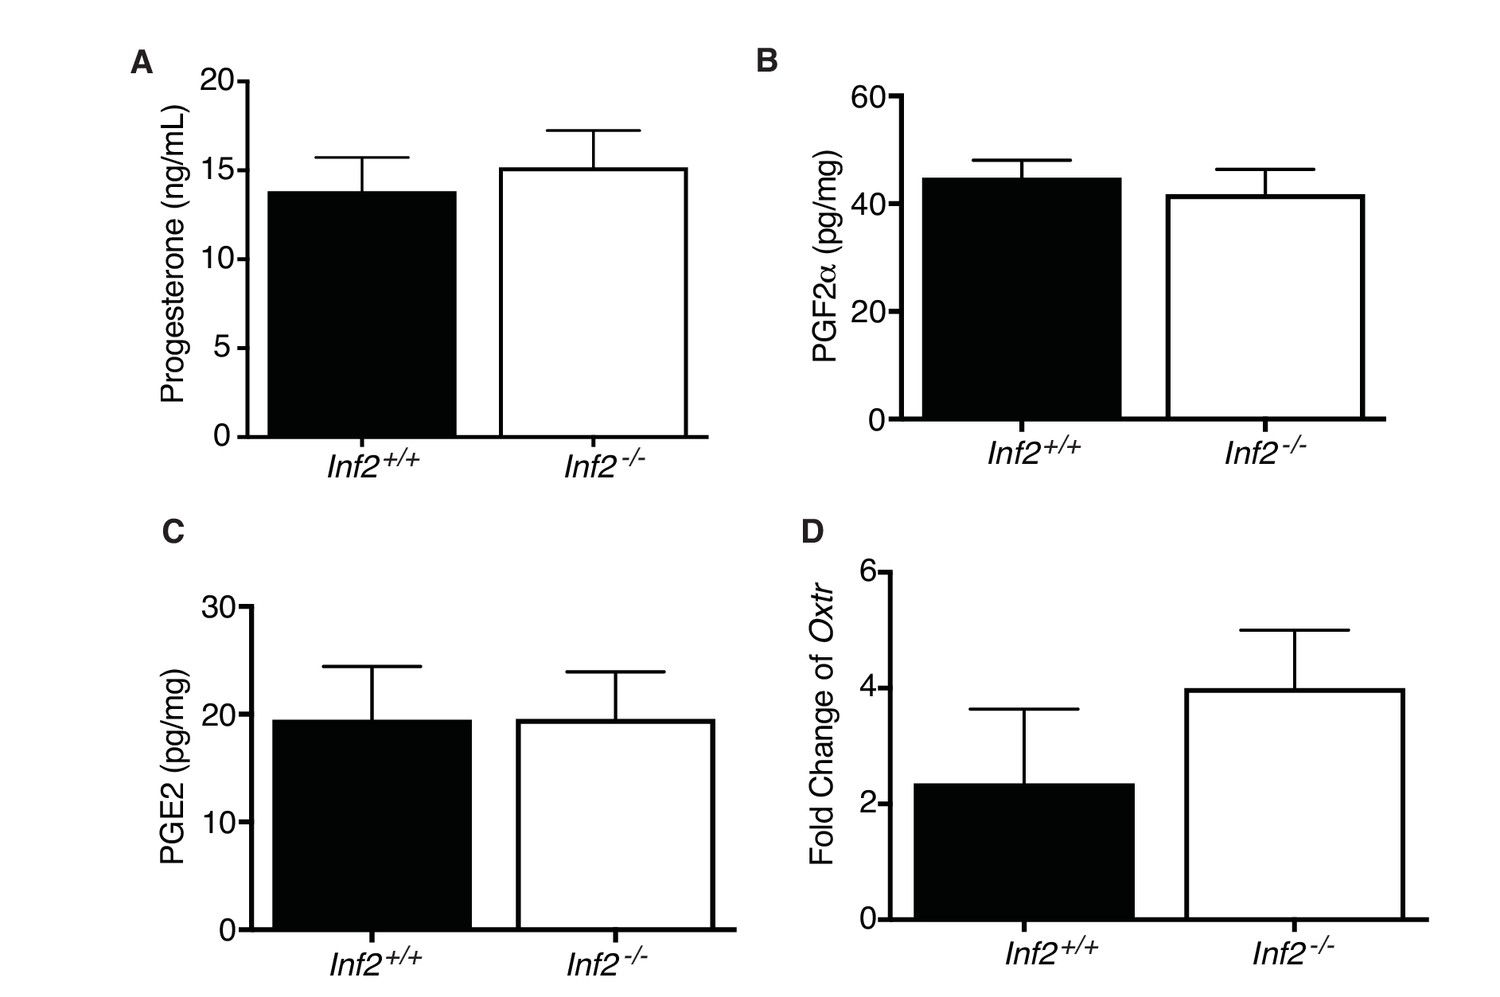
Effect of Inf2 deficiency on systemic and local indicators of labor.
No differences were detected in maternal serum progesterone (A) (n= 7, 8; 13.82± 1.91vs15.16± 2.08), uterine prostaglandin F2α (B) (n= 8, 12; 44.76± 3.25vs41.77± 4.62) and E2 (C) (n= 10; 19.48± 4.94vs19.56± 4.38), and uterine oxytocin receptor mRNA (D) (n = 5, normalized to E13.5 uterus; 2.35 ± 1.28 vs 4 ± 1) measured in Inf2+/+ and Inf2−/− dams at E18.5. All data represent the mean ±SEM and were analyzed by unpaired 2-tailed t test, unless otherwise noted.
Figure 5—figure supplement 3
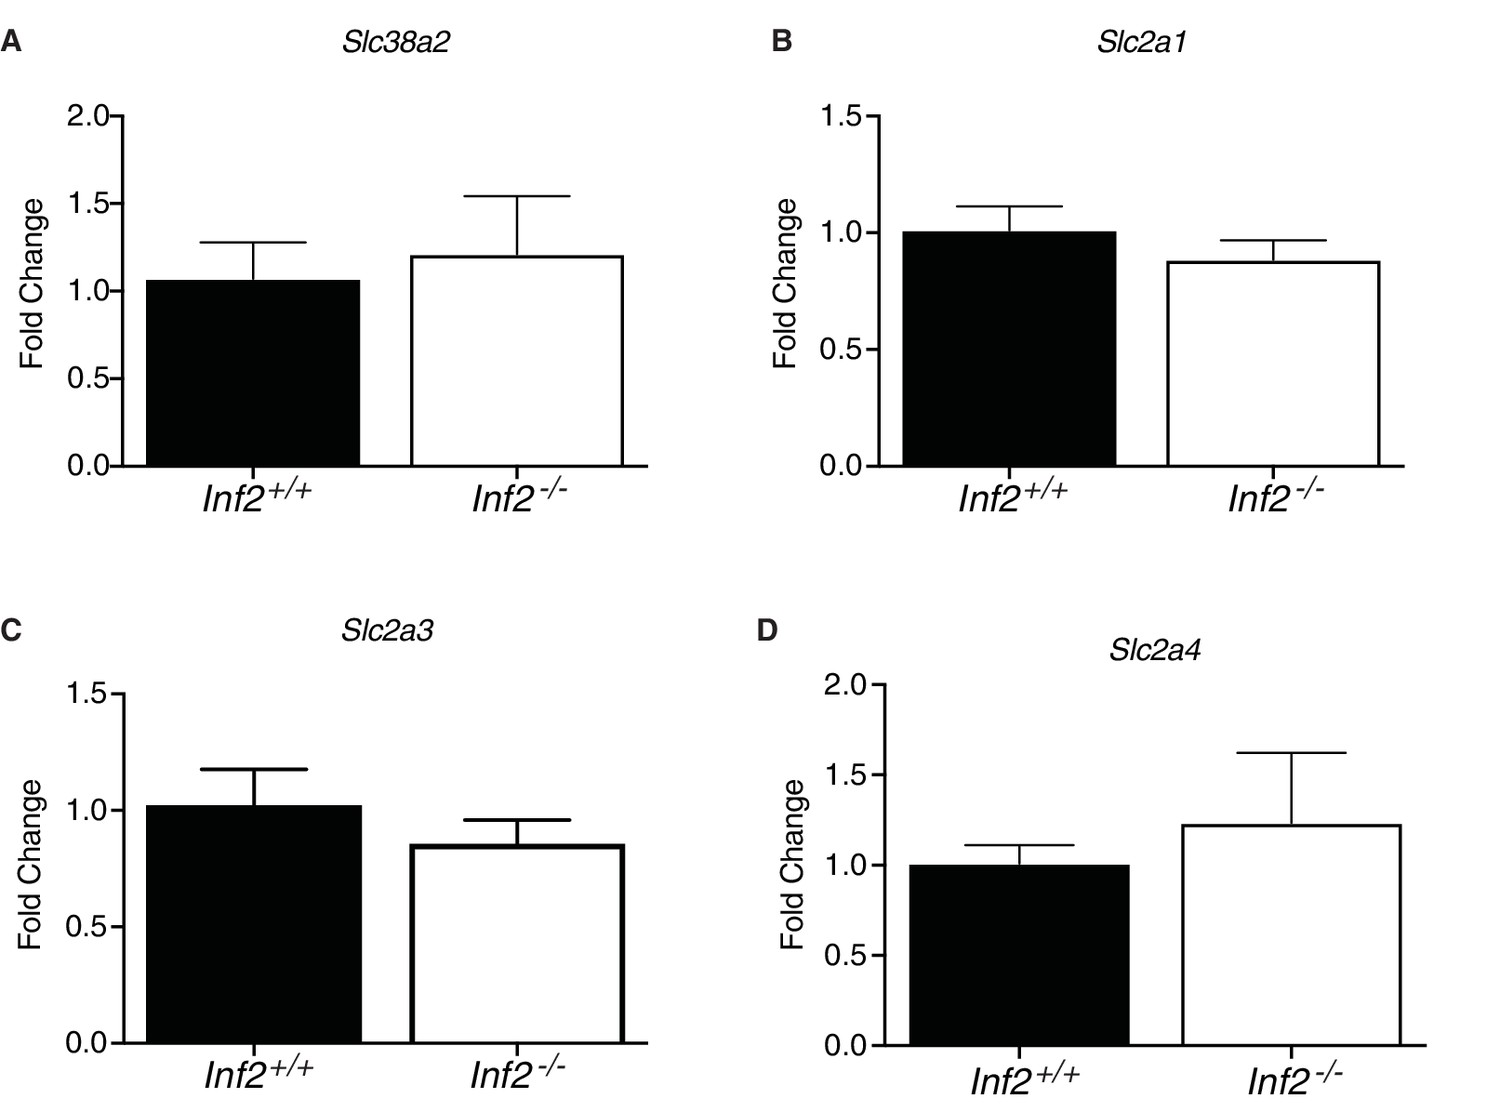
Effect of Inf2 deficiency on placental nutrient transporter mRNA.
No differences were measured in Inf2+/+ or Inf2−/− E18.5 placental mRNA expression of nutrient transporters Snat2 (A) (Slc38a2; n = 5; 1.0 ± 0.16 vs 0.80 ± 0.06) or Glut1 (B) (Slc2a1; n = 3, 4; 1.0 ± 0.10 vs 0.88 ± 0.08), 3 (C) (Slc2a3; n = 3, 4; 1.0 ± 0.15 vs 0.86 ± 0.10), and 4 (D) (Slc2a4; n = 3, 4; 1.0 ± 0.10 vs 1.23 ± 0.39). All data represent the mean ±SEM and were analyzed by unpaired 2-tailed t test, unless otherwise noted.
Figure 6 with 1 supplement
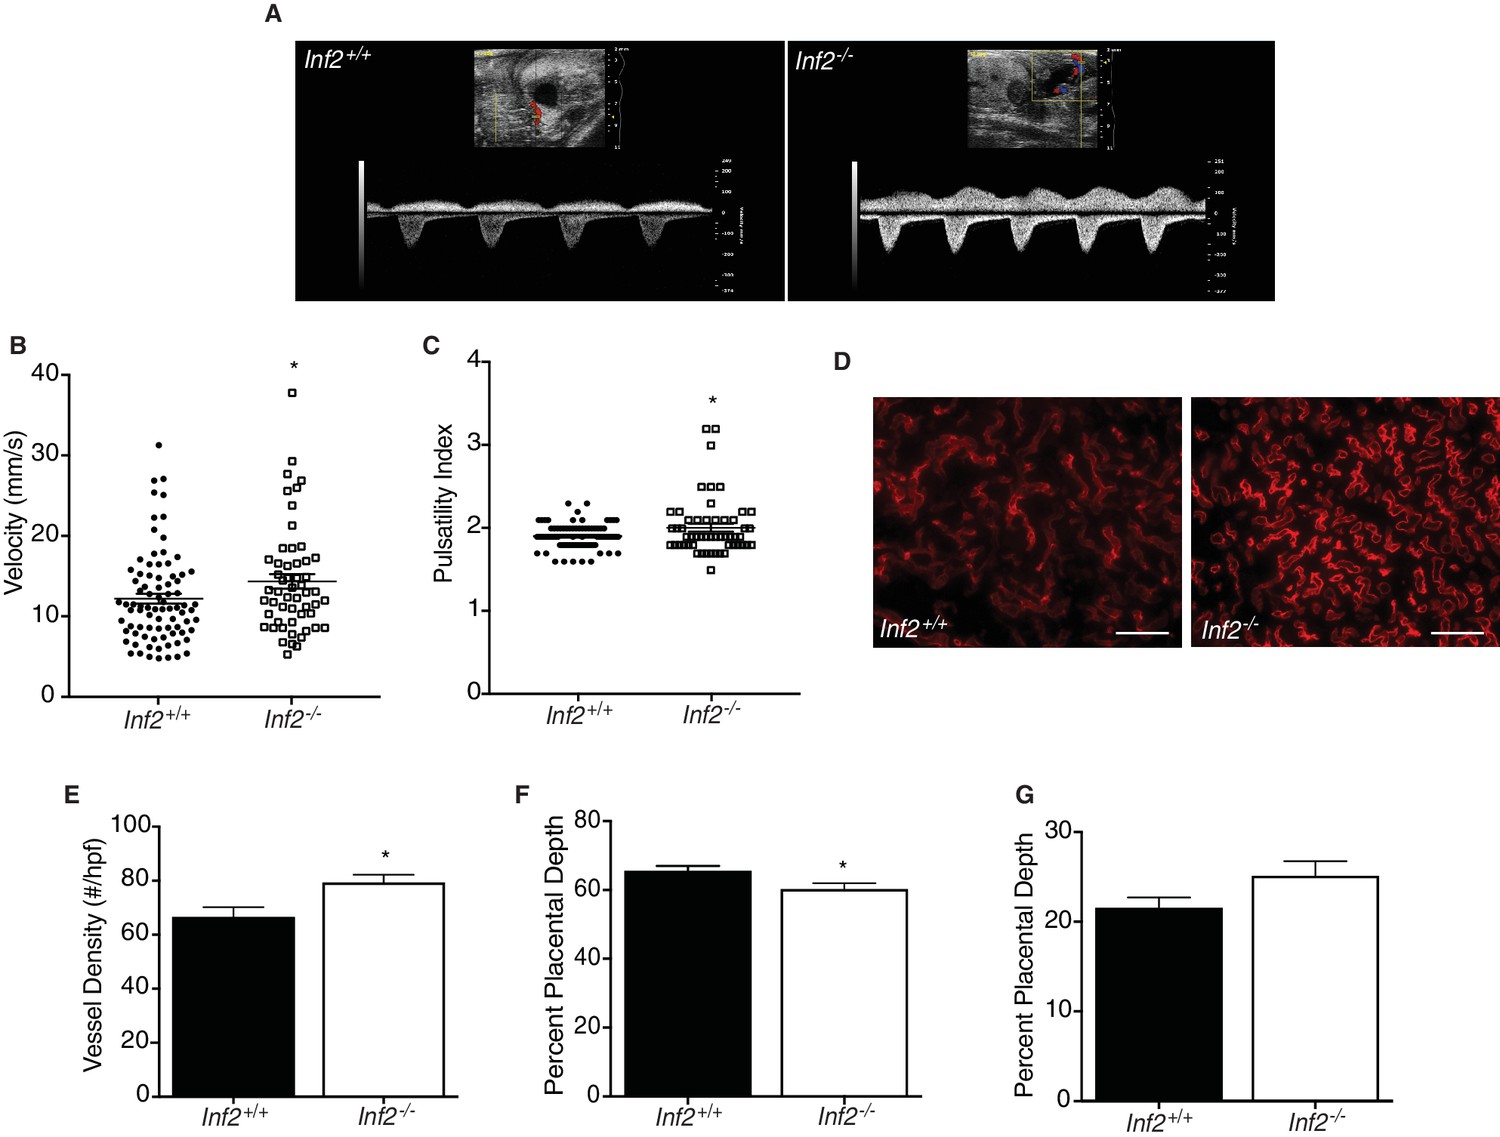
Loss of Inf2 alters placental vascularization, impeding function and umbilical blood flow.
(A) Umbilical Doppler images from Inf2+/+ and Inf2−/− fetuses highlighting differences in arterial and venous waveforms at E18.5. End diastolic velocity (B) (12.03 ± 0.619 vs 14.15 ± 0.902 mm/s) and pulsatility index (C) (1.907 ± 0.016 vs 2.007 ± 0.047) are significantly increased in Inf2−/− fetuses (n = 83, 54 fetuses; *p<0.05). (D) Representative images from endomucin-labeled Inf2+/+ and Inf2−/− E18.5 placentas depict differences in vessel density (scale bar: 50 μm), quantified in (E) (n = 2–3 placentas per dam, 5 and 7 dams; 66.53 ± 3.65 vs 79.4 ± 2.83 number/high powered field; *p<0.05). (F) The percent of total placenta depth consisting of the labyrinth was significantly reduced at E18.5 (n = 3 placentas per dam, five dams per genotype; 65.72 ± 1.26 vs 60.38 ± 1.58%; *p<0.05) while no differences were measured in the junctional zone (G) (n = 3 placentas per dam, five dams per genotype; 21.6 ± 1.09 vs 25.15 ± 1.60%). All data represent the mean ±SEM and were analyzed by unpaired 2-tailed t test, unless otherwise noted.
Figure 6—figure supplement 1
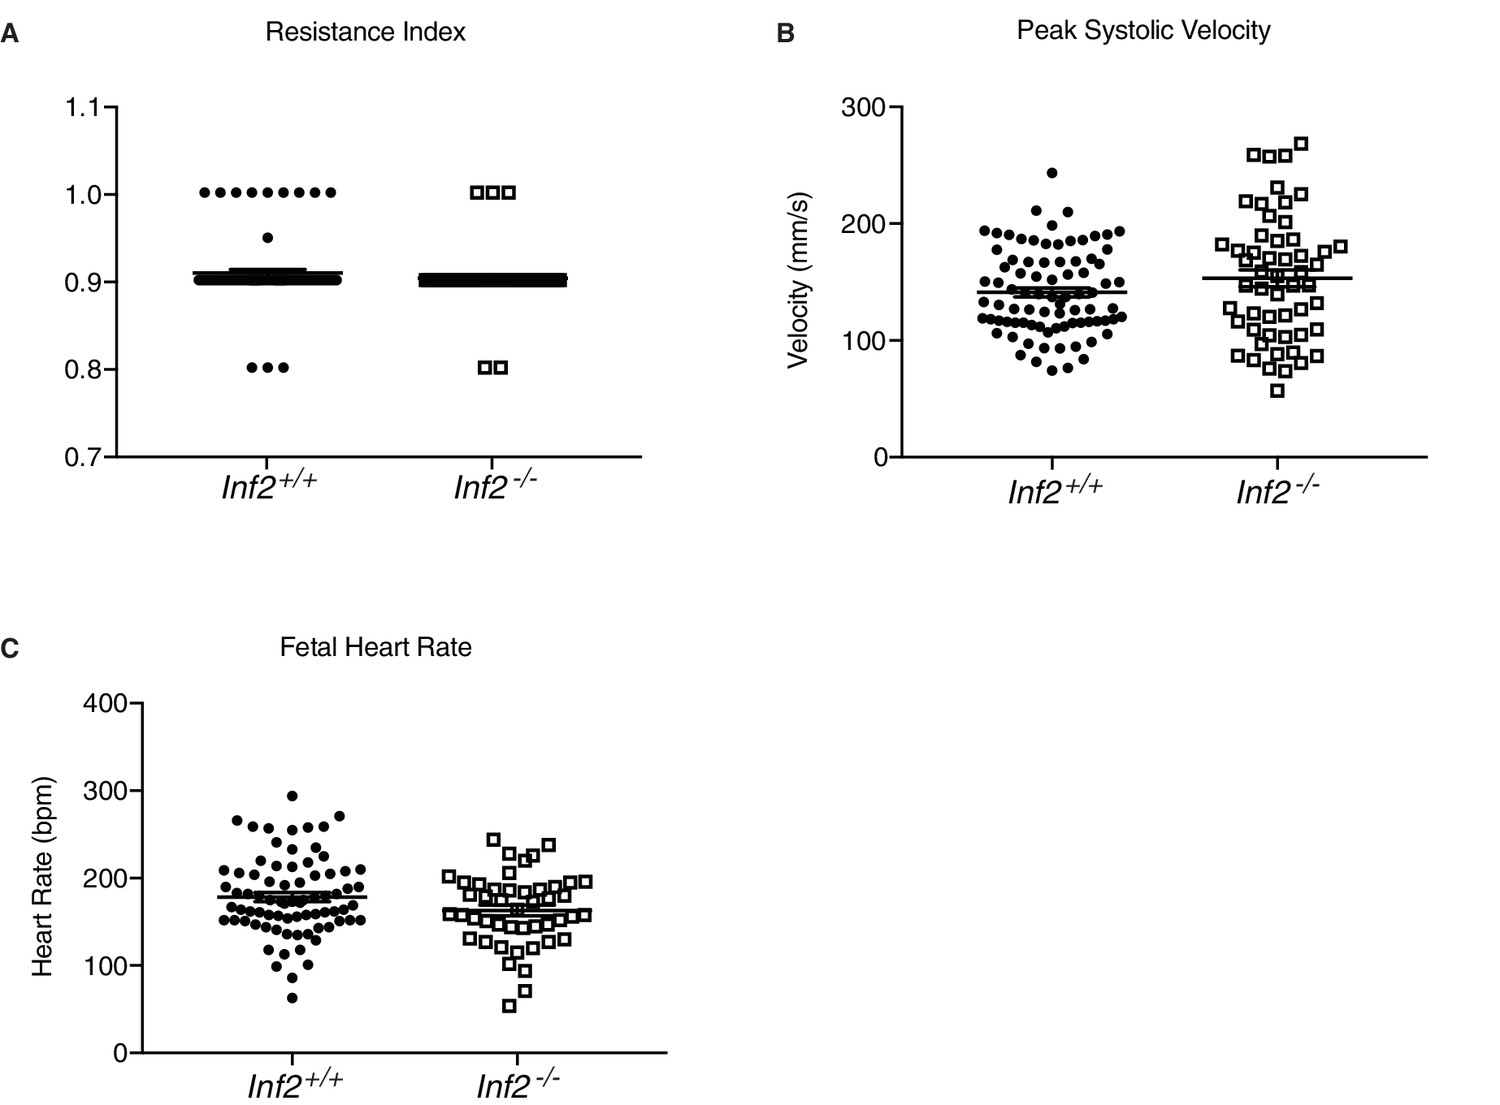
Results of Inf2 loss on fetal health.
No differences in resistance index (A) (n = 83, 54 fetuses; 0.908 ± 0.004 vs 0.902 ± 0.004), peak systolic velocity (B) (n = 83, 54 fetuses; 138.3 ± 3.96 vs 150.4 ± 7.31), or fetal heart rate (C) (n = 77, 46 fetuses; 176.6 ± 5.14 vs 161.3 ± 6.09) were measured in Inf2+/+ or Inf2−/− umbilical Doppler at E18.5. All data represent the mean ±SEM and were analyzed by unpaired 2-tailed t test, unless otherwise noted.
Figure 7
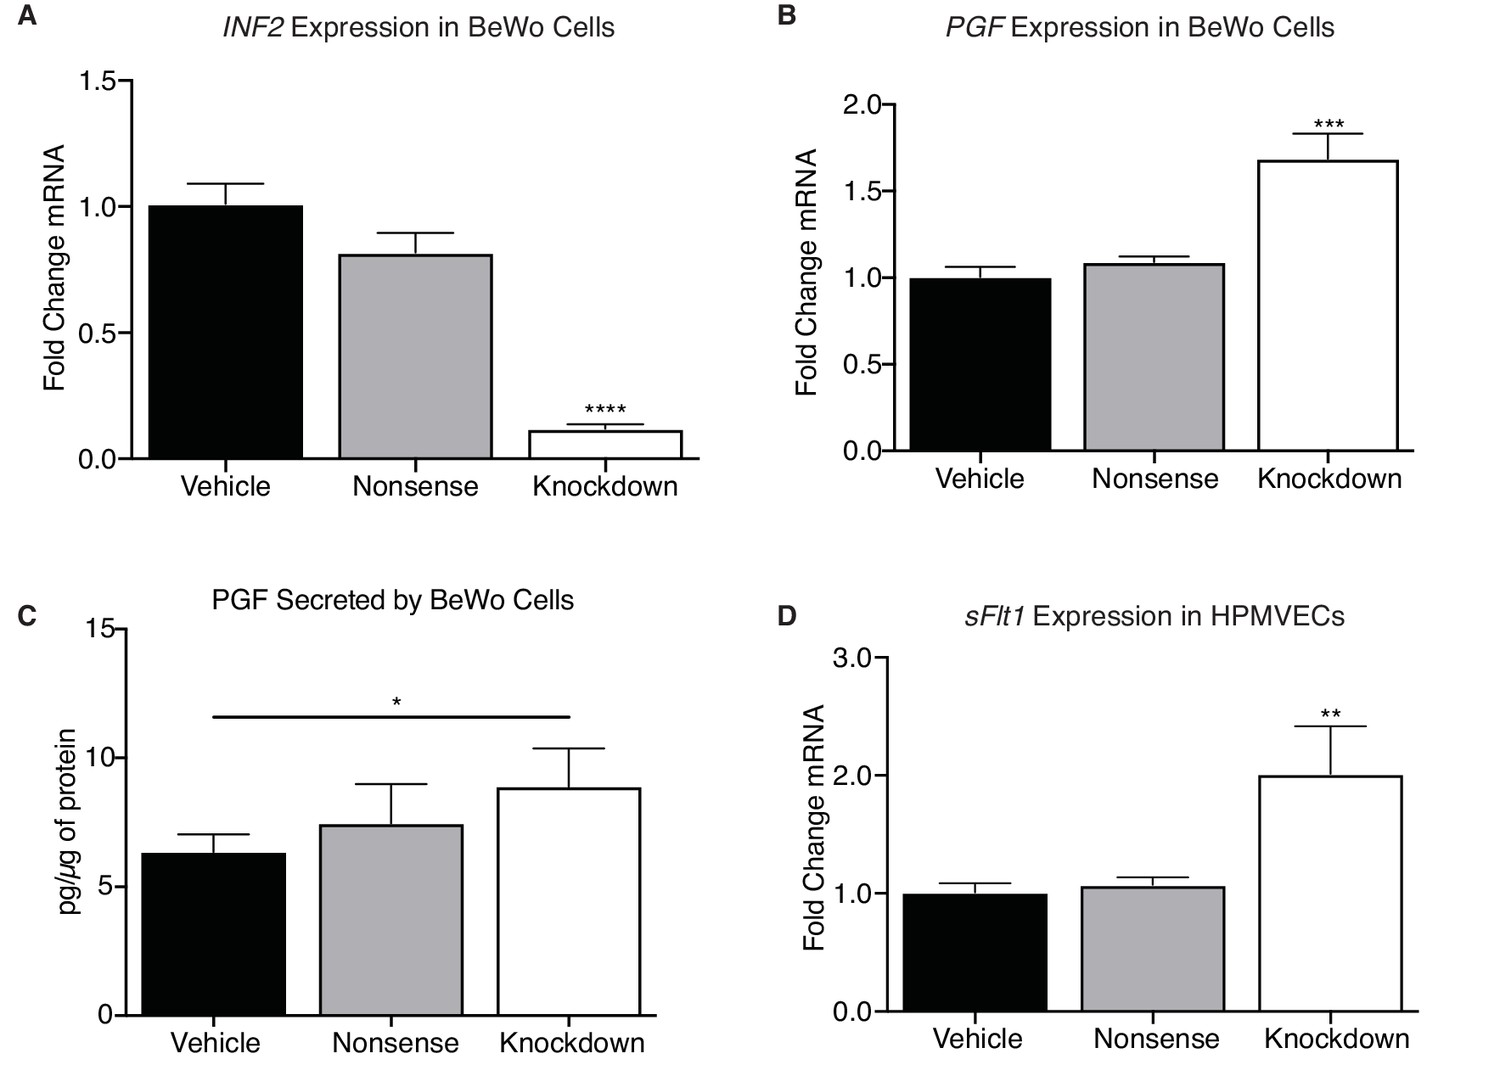
INF2 is necessary for regulating angiogenic factor expression.
(A) Knockdown of INF2 in the BeWo cells (n = 4, 5, 5; 1.0 ± 0.08 vs 0.82 ± 0.08 vs 0.12 ± 0.02; ****p<0.0001, analyzed by 1-way ANOVA) significantly increased PGF mRNA (B) (n = 4, 5, 5; 1.0 ± 0.06 vs 1.09 ± 0.03 vs 1.69 ± 0.14; ***p<0.001, analyzed by 1-way ANOVA). This increase in mRNA corresponded with an increase in secreted PGF by INF2-deficient BeWo cells compared to vehicle-treated cells (D) (n = 7; 6.353 ± 0.68 vs 7.462 ± 1.53 vs 8.888 ± 1.485 pg/μg protein; *p<0.05, analyzed by paired 1-tailed t test). Treatment with nonsense siRNA did not significantly alter secretion of PGF compared to vehicle. Conditioned media from INF2-deficient BeWo cells induced a significant increase in sFLT1 mRNA (D) (n = 4, 5, 3; 1.0 ± 0.15 vs 1.07 ± 0.06 vs 2.01 ± 0.40; **p<0.01, analyzed by 1-way ANOVA). All data represent the mean ±SEM and were analyzed by unpaired 2-tailed t test, unless otherwise noted.
Figure 8

Proposed model of INF2-mediated trophoblast invasion and spiral artery remodeling.
Intracellular transport along microtubule tracks is facilitated by the binding of INF2 to MAL2-coated vesicles or lipid rafts. By binding microtubules and active CDC42, INF2 regulates formation of actin filaments, driving transport of vesicles (Antón et al., 2008; Antón et al., 2011; Ness et al., 2013). LCK cargo is transported to the plasma membrane, causing cytoskeletal changes necessary for EVT invasion and, consequently, spiral artery remodeling (Moffett-King, 2002). In the absence of INF2, LCK is restricted to the perinuclear region of the trophoblast, preventing activation of the signaling cascade necessary for formation of invasive actin-rich structures. Failure of invasion impedes spiral artery remodeling, leading to disease. Figure based on (Moffett-King, 2002). Reprinted with permission from Macmillan Publishers Ltd: Nature Reviews Immunology (Moffett-King, 2002), copyright 2002.
Videos
Video 1
Inf2+/+ placenta at E19.0.
https://doi.org/10.7554/eLife.31150.012
Video 2
Inf2-/- placenta at E19.0.
https://doi.org/10.7554/eLife.31150.013Tables
Table 1
Tests of Natural Selection of the INF and INF2 clades.
https://doi.org/10.7554/eLife.31150.005| Clade | H0 lnL* | H1 lnL† | 2ΔL‡ | P value§ | ω ratio in background branches in H1 model# | ω ratio in foreground branches in H1 model¶ |
|---|---|---|---|---|---|---|
| INF | −35554.9 | −3.5554.74 | 0.32 | N.S. | 0.12226 | 0.12995 |
| INF2 | −35554.9 | −35554.56 | 0.68 | N.S. | 0.12422 | 0.11077 |
-
*Log likelihood score of H0 model, which assumes a single ω ratio across the phylogeny of the formin family;
†Log likelihood score of H1 model, which assumes a single ω ratio for the foreground clade (INF or INF2) and another ω ratio for the rest of the branches of the formin phylogeny;
-
‡Difference in log likelihood scores between the H0 and H1 models;
§P value of χ2 test of statistical significance between the the H0 and H1 models;
-
#dn/ds (=ω) ratio of background (all branches except those of the INF or INF2 clade) branches of the formin phylogeny under the H1 model;
¶dn/ds (=ω) ratio of foreground (INF or INF2) branches of the formin phylogeny under the H1 model
Key resources table
| Reagent type | Designation | Source or reference | Identifiers |
|---|---|---|---|
| Gene (H. sapiens) | INF2 | N/A | N/A |
| Gene (M. musculus) | Inf2 | N/A | N/A |
| Strain | C57BL/6 | Jackson Laboratories | RRID:IMSR_JAX:000664 |
| Inf2−/−; Inf2 KO | KOMP | RRID:MGI:5759294 | |
| Genetic reagent (H. sapiens) | Nonsense siRNA | Millipore Sigma SIC001 | N/A |
| Knockdown siRNA | ThermoFisher Scientific 4392420 | N/A | |
| Cell line (H. sapiens) | HTR-8/SVneo | Charles Graham; ATCC | RRID:CVCL_7162 |
| BeWo | ATCC | RRID:CVCL_0044 | |
| HPMVEC | Helen Jones | N/A | |
| Antibody | Rabbit polyclonal anti-MAL2 | Abcam | RRID:AB_1280985 |
| Rabbit polyclonal anti-Lck | Abcam ab208787 | N/A | |
| Rabbit polyclonal anti-INF2 | MilliporeSigma | RRID:AB_1078325 | |
| Goat polyclonal anti-Endomucin | R&D Systems | RRID:AB_2100035 | |
| Gloat polyclonal anti-Proliferin | R&D Systems | RRID:AB_2284428 | |
| Rabbit polyclonal anti-LCK | Abcam | RRID:AB_2249950 | |
| MitoTracker Red CMXRos | ThermoFisher Scientific M7512 | N/A | |
| Rabbit polyconal anti-INF2 | MilliporeSigma | RRID:AB_11203139 | |
| Primers | Mouse Inf2 qPCR primers | Forward: CGAGTAGTTGACCACCGAGG Reverse: ACAGCACTCTGCACCATCTC | N/A |
| Mouse Rps20 qPCR primers | Forward: GCTGGAGAAGGTTTGTGCG Reverse:AGTGATTCTCAAAGTCTTGGTAGGC | N/A | |
| Mouse Oxtr qPCR primers | Forward: ACGGGTCAGTAGTGTCAAGC Reverse: TAATGCTCGTCTCTCCAGGC | N/A | |
| Mouse Slc38a2 qPCR primers | Forward: ACCTTTGGTGATCAAGGCAT Reverse: AGGACCAGATAGTCACCGTT | N/A | |
| Mouse Slc2a1 qPCR primers | Forward: TGCAGTTCGGCTATAACACT Reverse: GTAGCGGTGGTTCCATGTTT | N/A | |
| Mouse Slc2a3 qPCR primers | Forward: CTTTGGCAGACGCAACTCTA Reverse: GCTATCTTGGCGAATCCCAT | N/A | |
| Mouse Slc2a4 qPCR primers | Forward: ACTGGACCTGTAACTTCAT Reverse: GCAAATAGAAGGAAGACGTA | N/A | |
| Mouse Pgf qPCR primers | Forward: GACCTATTCTGGAGACGACA Reverse: GGTTCCTCAGTCTGTGAGTT | N/A | |
| Mouse sFlt1 qPCR primers | Forward: TGACGGTCATAGAAGGAACA Reverse: TAGTTGGGATAGGGAGCCA | N/A | |
| Human INF2 qPCR primers | Forward: CACATCCAACGTGATGGTGAAG Reverse: GGAGAGCTCGTTCATGACAATG | N/A | |
| Human ACTB qPCR primers | Forward: CGCGAGAAGATGAACCAG Reverse: TAGCACAGCCTGGATAGCAA | N/A | |
| Human PGF qPCR primers | Forward: GAGGAGAGAGAAGCAGAGA Reverse: GTGACGGTAATAAATACACGAG | N/A | |
| Human sFLT1 qPCR primers | Forward: AGAAGGGCTCTGTGGAAAGT Reverse: ACACAGGTGCATGTTAGAGTG | N/A | |
| Commercial assay or kit | Mouse Angiogenesis/Growth Factor Magnetic Bead Panel | MilliporeSigma MAGPMAG-24K | N/A |
| Mouse Soluble Cytokine Receptor Magnetic Bead Panel | MilliporeSigma MSCRMAG-42K | N/A | |
| Progesterone Mouse/Rat ELISA | BioVendor RTC008R | N/A | |
| PGE2 EIA Kit | Oxford Biomedical Research EA02 | N/A | |
| PGF2a EIA Kit | Oxford Biomedical Research EA05 | N/A | |
| Human PLGF Quantikine ELISA Kit | R and D Systems DPG00 | N/A | |
| Chemical compound, drug | PP1 | Cayman Chemical 14244 CAS: 172889-26-8 | N/A |
| TX1123 | MilliporeSigma 655200 CAS: 157397-06-3 | N/A | |
| Software, algorithm | MAFFT, v7.310 | (Katoh and Standley, 2013) | RRID:SCR_011811 |
| SeaView | (Gouy et al., 2010) | RRID:SCR_015059 | |
| RAxML, v8.2.9 | (Stamatakis, 2014) | RRID:SCR_006086 | |
| PROTGAMMAAUTO | (Jones et al., 1992) | N/A | |
| FigTree, v1.4.3 | (Rambaut, 2007) | RRID:SCR_008515 |
Additional files
-
Transparent reporting form
- https://doi.org/10.7554/eLife.31150.022
Download links
A two-part list of links to download the article, or parts of the article, in various formats.
Downloads (link to download the article as PDF)
Open citations (links to open the citations from this article in various online reference manager services)
Cite this article (links to download the citations from this article in formats compatible with various reference manager tools)
Inverted formin 2 regulates intracellular trafficking, placentation, and pregnancy outcome
eLife 7:e31150.
https://doi.org/10.7554/eLife.31150


