Figures
Figure 1 with 1 supplement
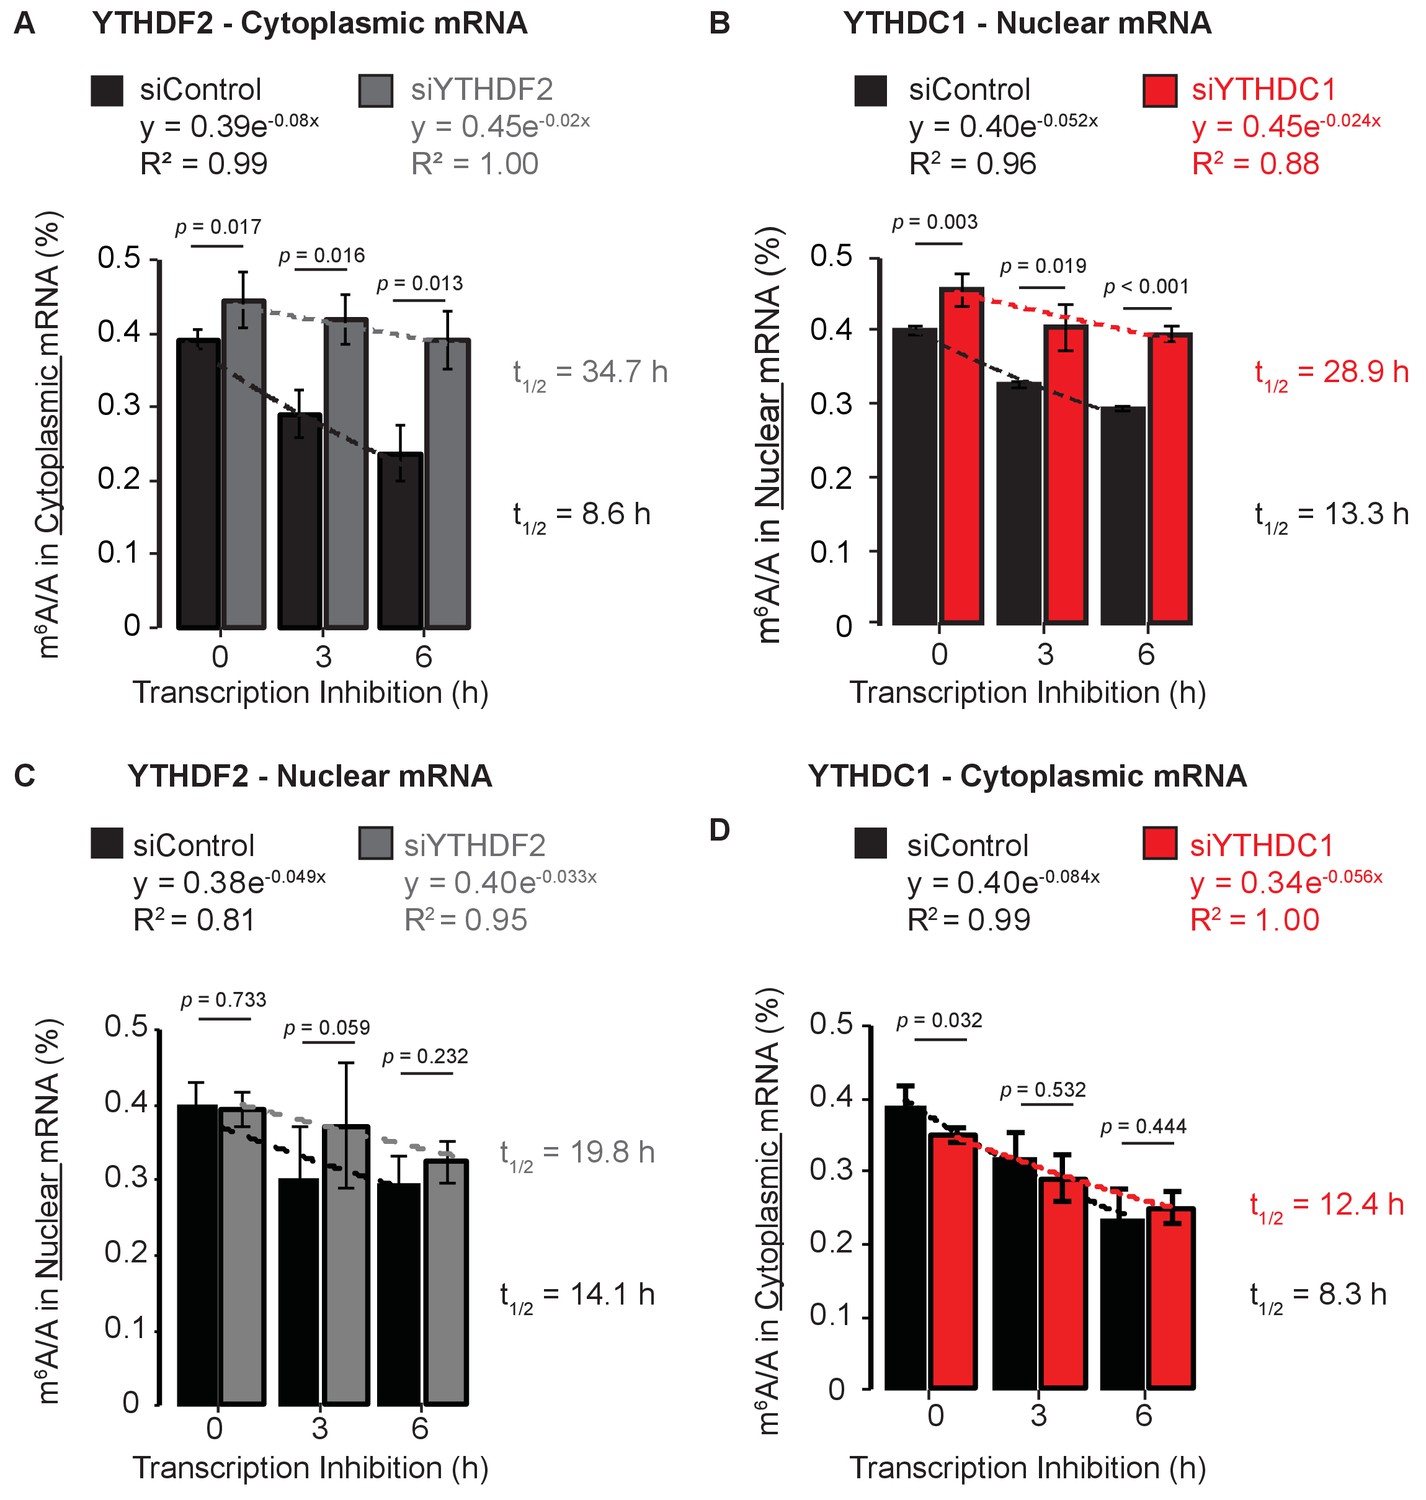
Methylated mRNAs are selectively cleared from the cytoplasm by YTHDF2 and from the nucleus by YTHDC1.
(A) m6A methylation in cytoplasmic mRNA analyzed at 0, 3, and 6 hr after transcription inhibition. Error bars represent mean ± standard deviation, n = 4, two-sided t-test with equal variance. Curves fit to exponential decay. (B) m6A methylation in nuclear mRNA analyzed at 0, 3, and 6 hr after transcription inhibition. Error bars represent mean ± standard deviation, n = 4, two-sided t-test with equal variance. Curves fit to exponential decay. (C) m6A methylation in nuclear mRNA analyzed at 0, 3, and 6 hr after transcription inhibition. Error bars represent mean ± standard deviation, n = 4, two-sided t-test with equal variance. Curves fit to exponential decay. (D) m6A methylation in cytoplasmic mRNA analyzed at 0, 3, and 6 hr after transcription inhibition. Error bars represent mean ± standard deviation, n = 4, two-sided t-test with equal variance. Curves fit to exponential decay.
-
Figure 1—source data 1
Methylated mRNAs are selectively cleared from the cytoplasm by YTHDF2 and from the nucleus by YTHDC1.
- https://doi.org/10.7554/eLife.31311.005
Figure 1—figure supplement 1
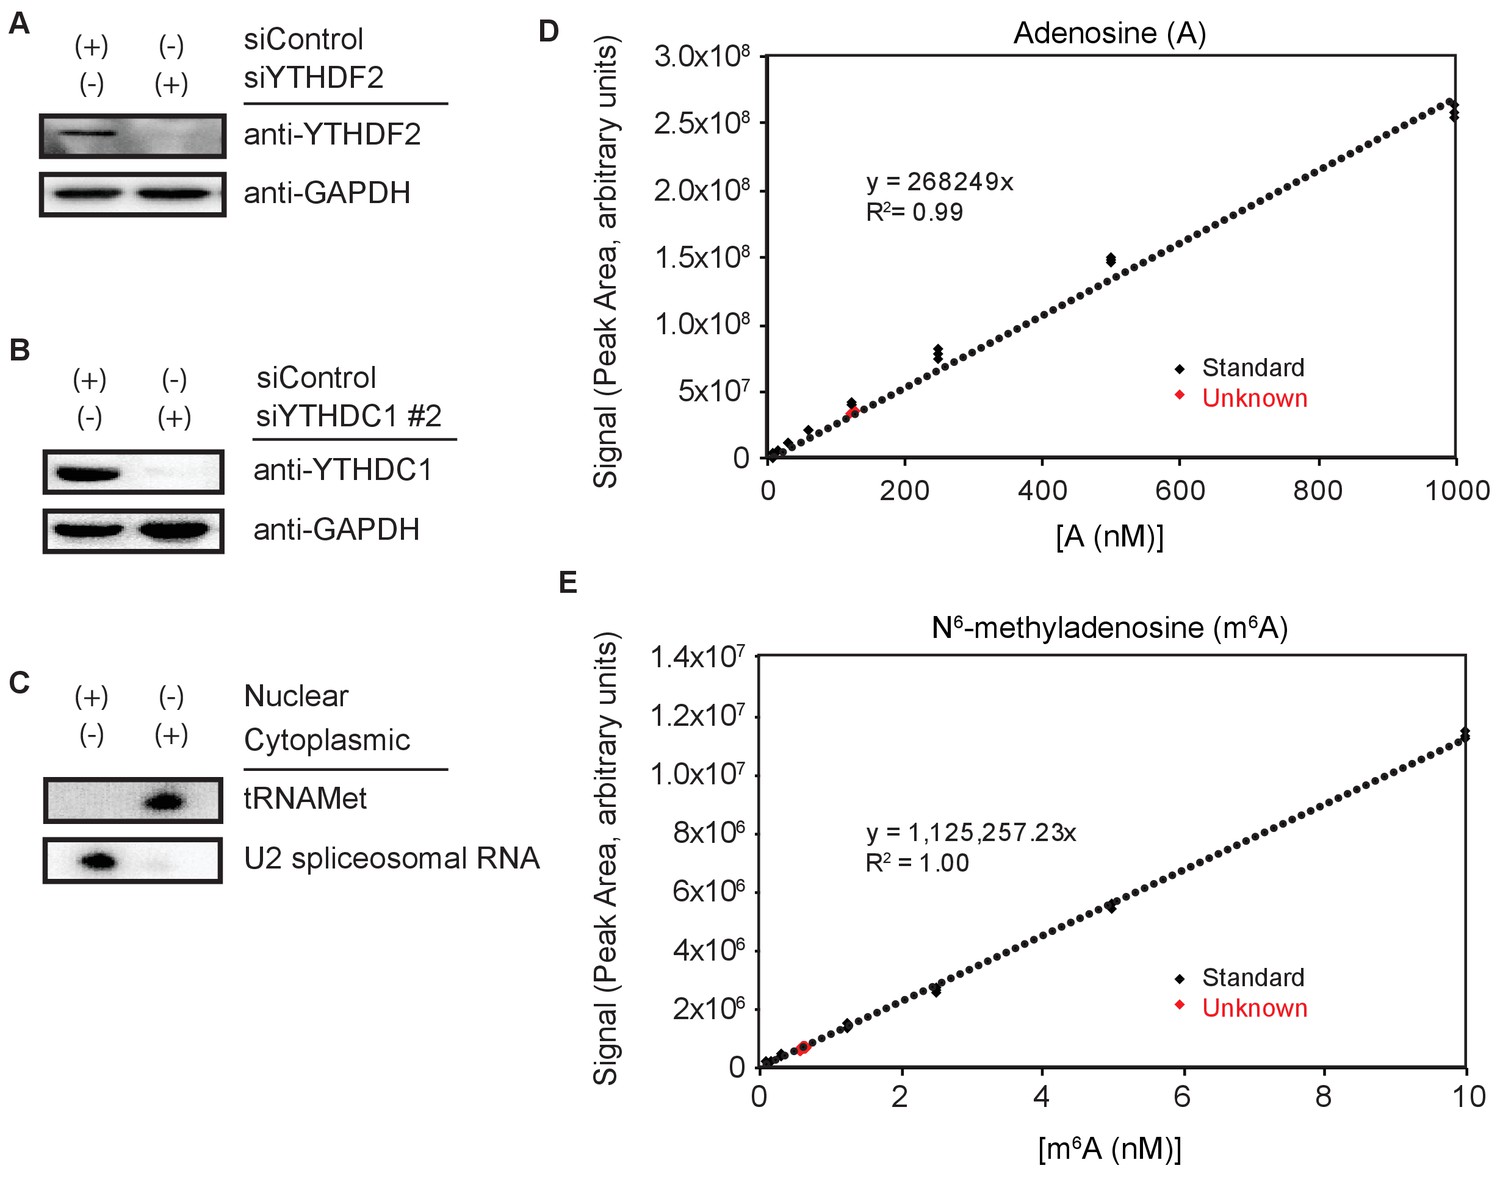
Representative western blots for siRNA knockdown efficiency and northern blot nuclear and cytoplasmic RNA isolation.
Calibration and unknown determination for LC-MS/MS quantification of m6A/A. (A) Representative western blot for YTHDF2 knockdown efficiency. (B) Representative Western blot for YTHDC1 knockdown efficiency. (C) Northern blot of nuclear and cytoplasmic RNA. (D,E) Representative data from LC-MS/MS for A and m6A. Standards curves (black) are generated, and unknown concentrations (red) are calculated.
-
Figure 1—figure supplement 1—source data 1
Calibration of LC-MS/MS.
- https://doi.org/10.7554/eLife.31311.004
Figure 2 with 1 supplement

YTHDC1 mediates subcellular localization of methylated mRNAs.
(A) Quantification of m6A methylation in total (T), nuclear (N), and cytoplasmic (C) mRNA. Error bars represent mean ± standard deviation, n = 4, two-sided t-test with equal variance. (B) Representative western blot of YTHDF2 and members of the mRNA export pathway following knockdown of YTHDC1. (C) Representative analysis of polyA imaging. Nuclei were defined using DAPI signal. Cytoplasmic regions were defined by subtracting nuclear signal from total signal, as defined by DIC imaging. (D) Quantification of polyA signal density. n = 25, two-sided t-test. (E,F) Quantification of m6A methylation in nuclear and cytoplasmic mRNA. Error bars represent mean ± standard deviation, n = 4, two-sided t-test with equal variance.
-
Figure 2—source data 1
YTHDC1 mediates subcellular localization of methylated mRNAs.
- https://doi.org/10.7554/eLife.31311.008
Figure 2—figure supplement 1
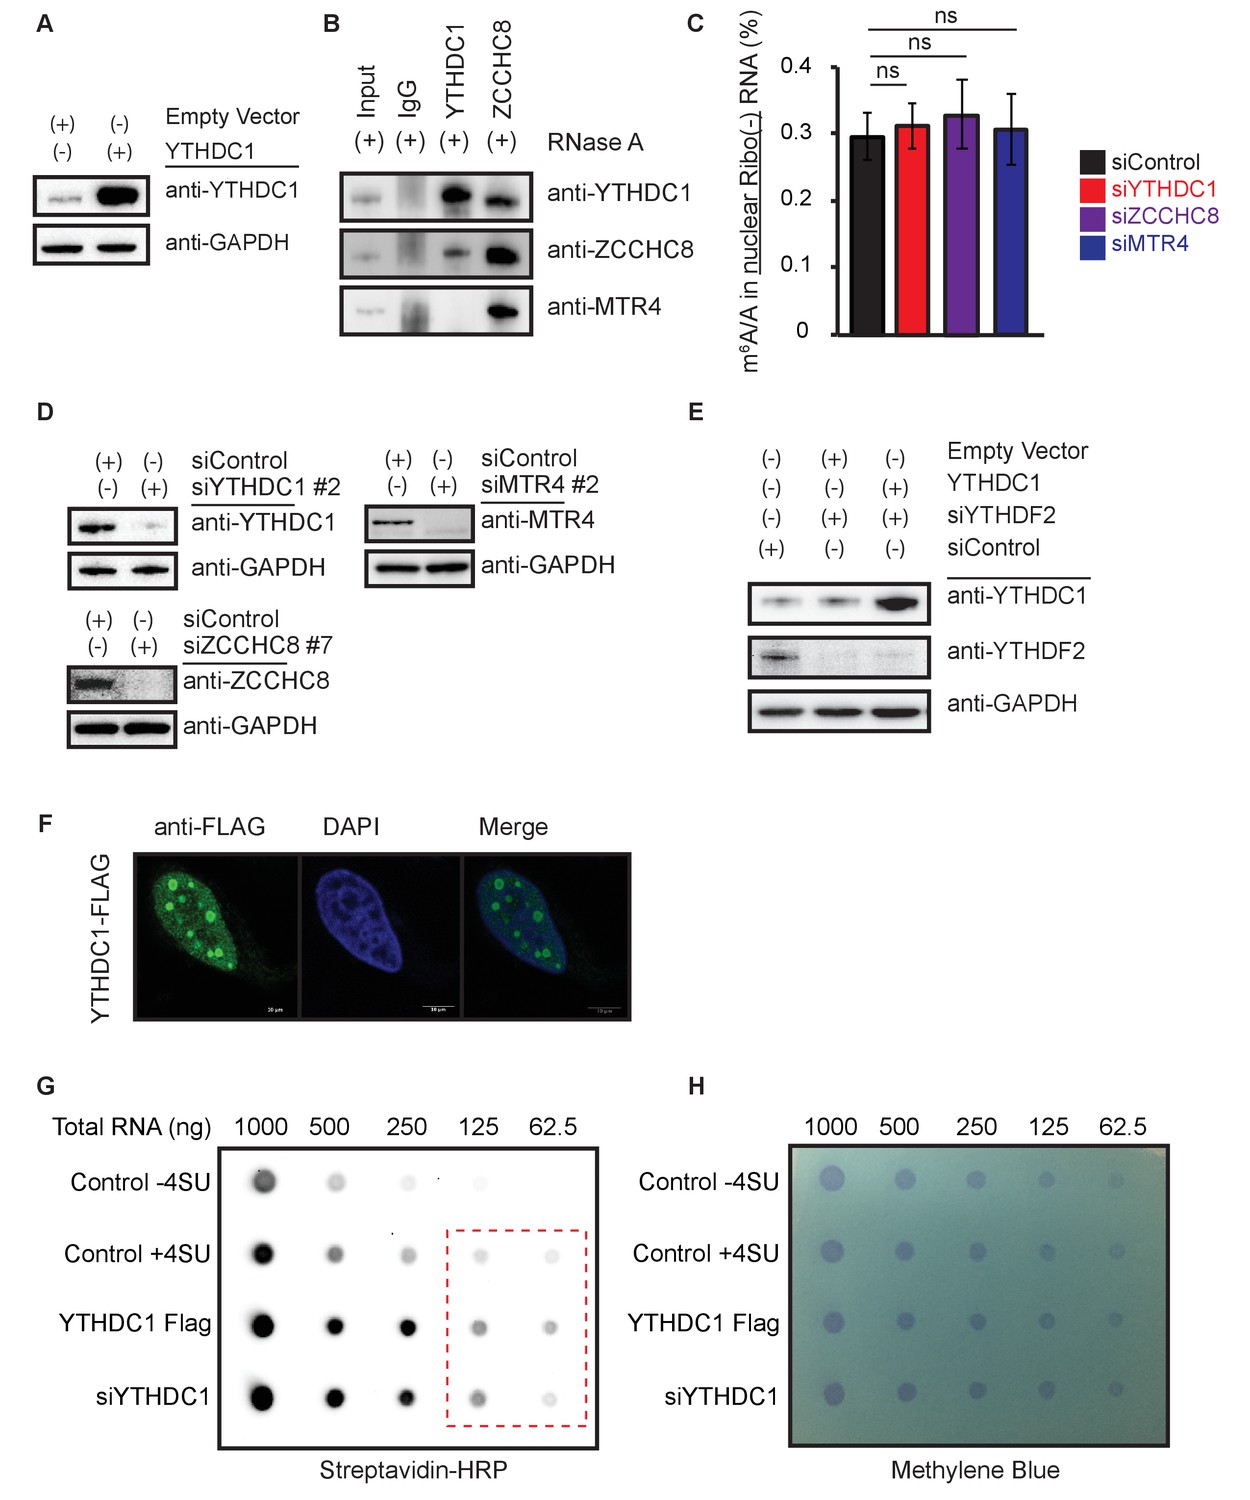
YTHDC1 does not contribute to nuclear mRNA decay or transcription.
(A) Representative western blot for YTHDC1 overexpression. (B) Representative western blot for YTHDC1 overexpression in a YTHDF2 knockdown background. (C) Interactions between YTHDC1 and components of the NEXT/PAXT machinery. (D) m6A/A ratios in pre-mRNA following knockdown of YTHDC1 and NEXT/PAXT components. (E) Representative western blots of knockdown samples for panel (D). (F) Representative immunofluorescence of YTHDC1–FLAG in HeLa cells. (G) Dot-blot of nascent RNA. HeLa cells were labeled for 1 hr with 4-thio-uridine (4SU), conjugated to biotin and exposed with Streptavidin–HRP. (H) Methylene blue staining of (G) (loading control).
Figure 3 with 2 supplements

Knockdown of YTHDC1 affects the subcellular distribution of target mRNAs.
(A) Left: Cumulative distribution of log2 fold changes in RNA expression following knockdown of YTHDC1 in total mRNA. P-value calculated using the Mann-Whitney-Wilcoxon Test. Right: Boxplot representation of RNA-seq fold changes. Whiskers represent three times the interquartile range. P-value calculated using Welch’s T-test. (B) Left: Cumulative distribution of log2 fold changes in RNA expression following knockdown of YTHDC1 in nuclear mRNA. P-value calculated using the Mann-Whitney-Wilcoxon Test. Right: Boxplot representation of RNA-seq fold changes. Whiskers represent three times the interquartile range. P-value calculated using Welch’s T-test. (C) Left: Cumulative distribution of log2 fold changes in RNA expression following knockdown of YTHDC1 in cytoplasmic mRNA. P-value calculated using the Mann-Whitney-Wilcoxon Test. Right: Boxplot representation of RNA-seq fold changes. Whiskers represent three times the interquartile range. P-value calculated using Welch’s T-test. Data represent biological replicates using unique siRNAs against YTHDC1.
-
Figure 3—source data 1
Knockdown of YTHDC1 affects the subcellular distribution of target mRNAs.
- https://doi.org/10.7554/eLife.31311.013
Figure 3—figure supplement 1
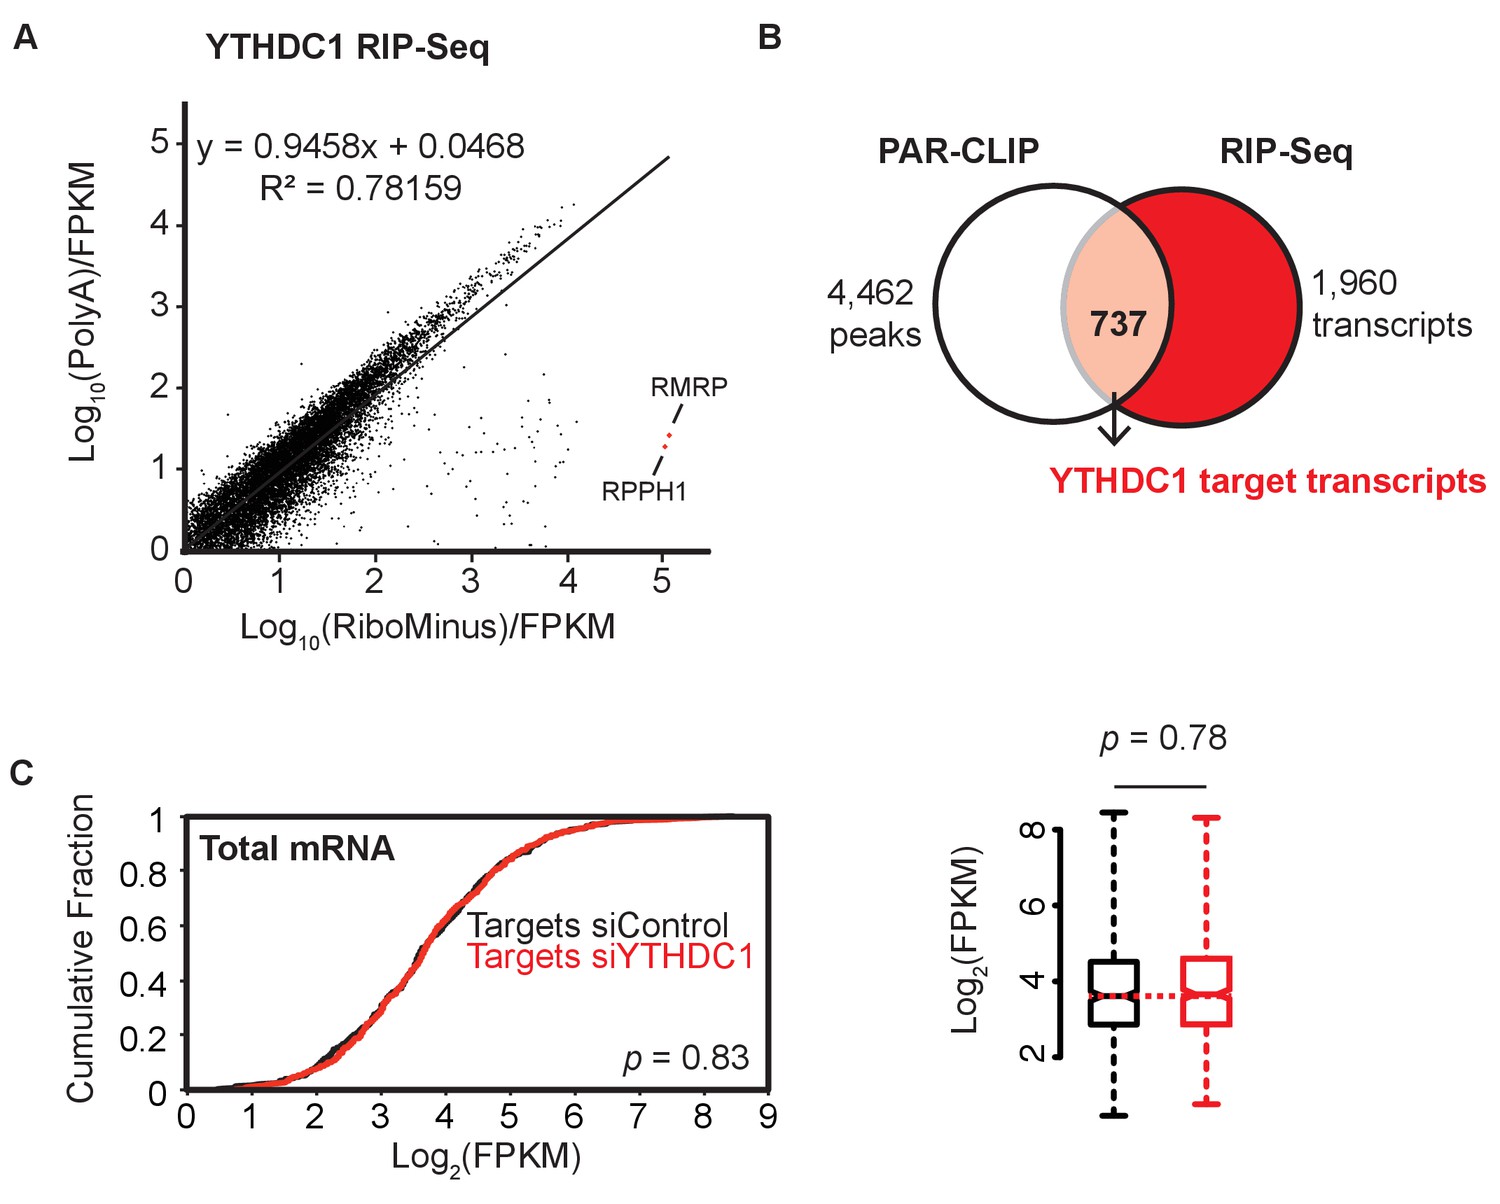
Identification of YTHDC1 mRNA targets; target expression is unchanged following knockdown of YTHDC1.
(A) Comparison of YTHDC1 RIP-seq data sets. (B) Selection of YTHDC1 target mRNAs from PAR-CLIP and RIP-seq data. (C) Expression of YTHDC1 target mRNAs under control and YTHDC1 knockdown conditions. Left: Cumulative fraction of RNA expression. P-values calculated using the Mann-Whitney-Wilcoxon Test. Right: Boxplot representation of RNA expression. Whiskers represent three times the interquartile range. P-value calculated using Welch’s T-test.
Figure 3—figure supplement 2
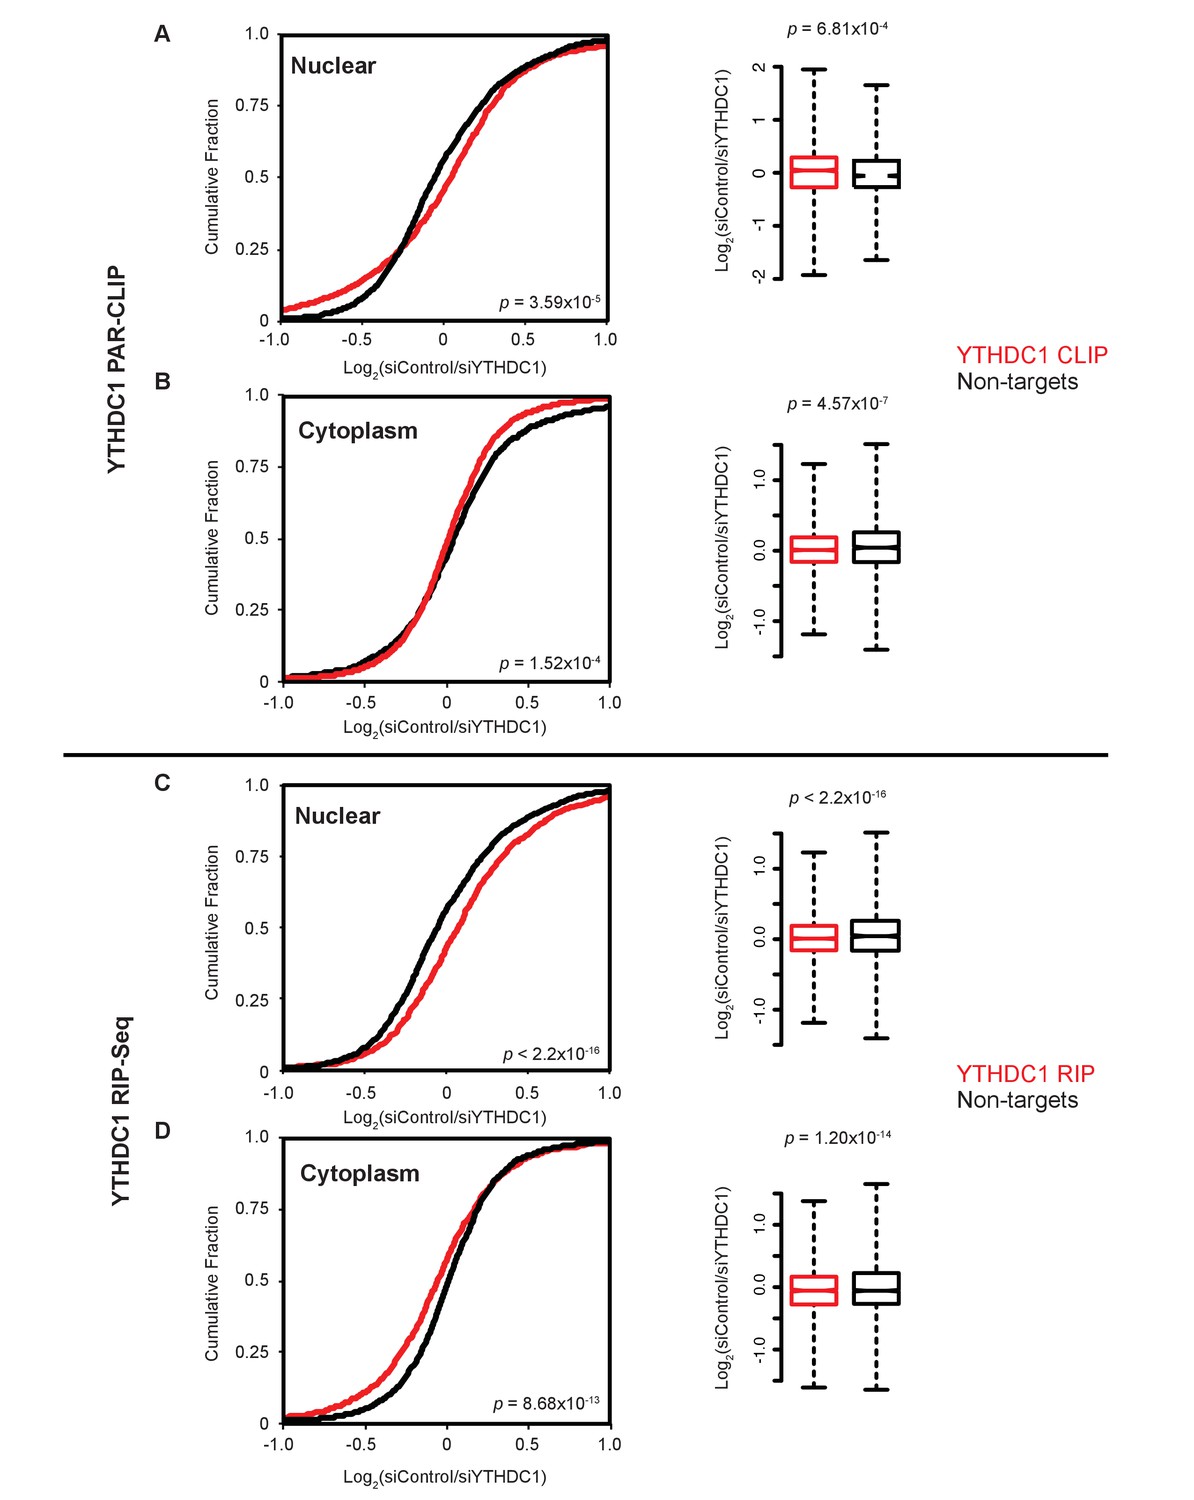
Subcellular abundances of YTHDC1 PAR-CLIP and RIP-seq targets are affected by YTHDC1.
(A) Left: Cumulative distribution of log2 fold changes in RNA expression following knockdown of YTHDC1 in nuclear mRNA. P-value calculated using the Mann-Whitney-Wilcoxon Test. Right: Boxplot representation of RNA-seq fold changes. Whiskers represent three times the interquartile range. P-value calculated using Welch’s T-test. (B) Left: Cumulative distribution of log2 fold changes in RNA expression following knockdown of YTHDC1 in cytoplasmic mRNA. P-value calculated using the Mann-Whitney-Wilcoxon Test. Right: Boxplot representation of RNA-seq fold changes. Whiskers represent three times the interquartile range. P-value calculated using Welch’s T-test. (C) Left: Cumulative distribution of log2 fold changes in RNA expression following knockdown of YTHDC1 in nuclear mRNA. P-value calculated using the Mann-Whitney-Wilcoxon Test. Right: Boxplot representation of RNA-seq fold changes. Whiskers represent three times the interquartile range. P-value calculated using Welch’s T-test. (D) Left: Cumulative distribution of log2 fold changes in RNA expression following knockdown of YTHDC1 in cytoplasmic mRNA. P-value calculated using the Mann-Whitney-Wilcoxon Test. Right: Boxplot representation of RNA-seq fold changes. Whiskers represent three times the interquartile range. P-value calculated using Welch’s T-test.
-
Figure 3—figure supplement 2—source data 1
Subcellular abundances of YTHDC1 PAR-CLIP and RIP-seq targets are affected by YTHDC1.
- https://doi.org/10.7554/eLife.31311.012
Figure 4 with 3 supplements

YTHDC1 mediates nuclear to cytoplasmic transport of nascent mRNA.
(A,B) RT-qPCR of nascent mRNA in the nucleus (A) and cytoplasm (B). Error bars represent mean ± standard deviation, n = 6 (three biological replicates x two technical replicates), two-sided t-test with equal variance. (C) Translation of reporter mRNA in response to binding by the full-length YTHDC1. Error bars represent mean ± standard deviation, n = 4. (D) Nuclear and cytoplasmic RT-qPCR of reporter mRNA 4 hr after induction of reporter transcript. Error bars represent mean ± standard deviation, n = 4, two-sided t-test with equal variance. (E) Translation of reporter mRNA in response to binding by the YTHDC1 C-terminus. Error bars represent mean ± standard deviation, n = 4, two-sided t-test with equal variance. (F) Nuclear and cytoplasmic RT-qPCR of reporter mRNA 4 hr after induction of reporter transcript. Error bars represent mean ± standard deviation, n = 4, two-sided t-test with equal variance.
-
Figure 4—source data 1
YTHDC1 mediates nuclear to cytoplasmic transport of nascent mRNA.
- https://doi.org/10.7554/eLife.31311.018
Figure 4—figure supplement 1
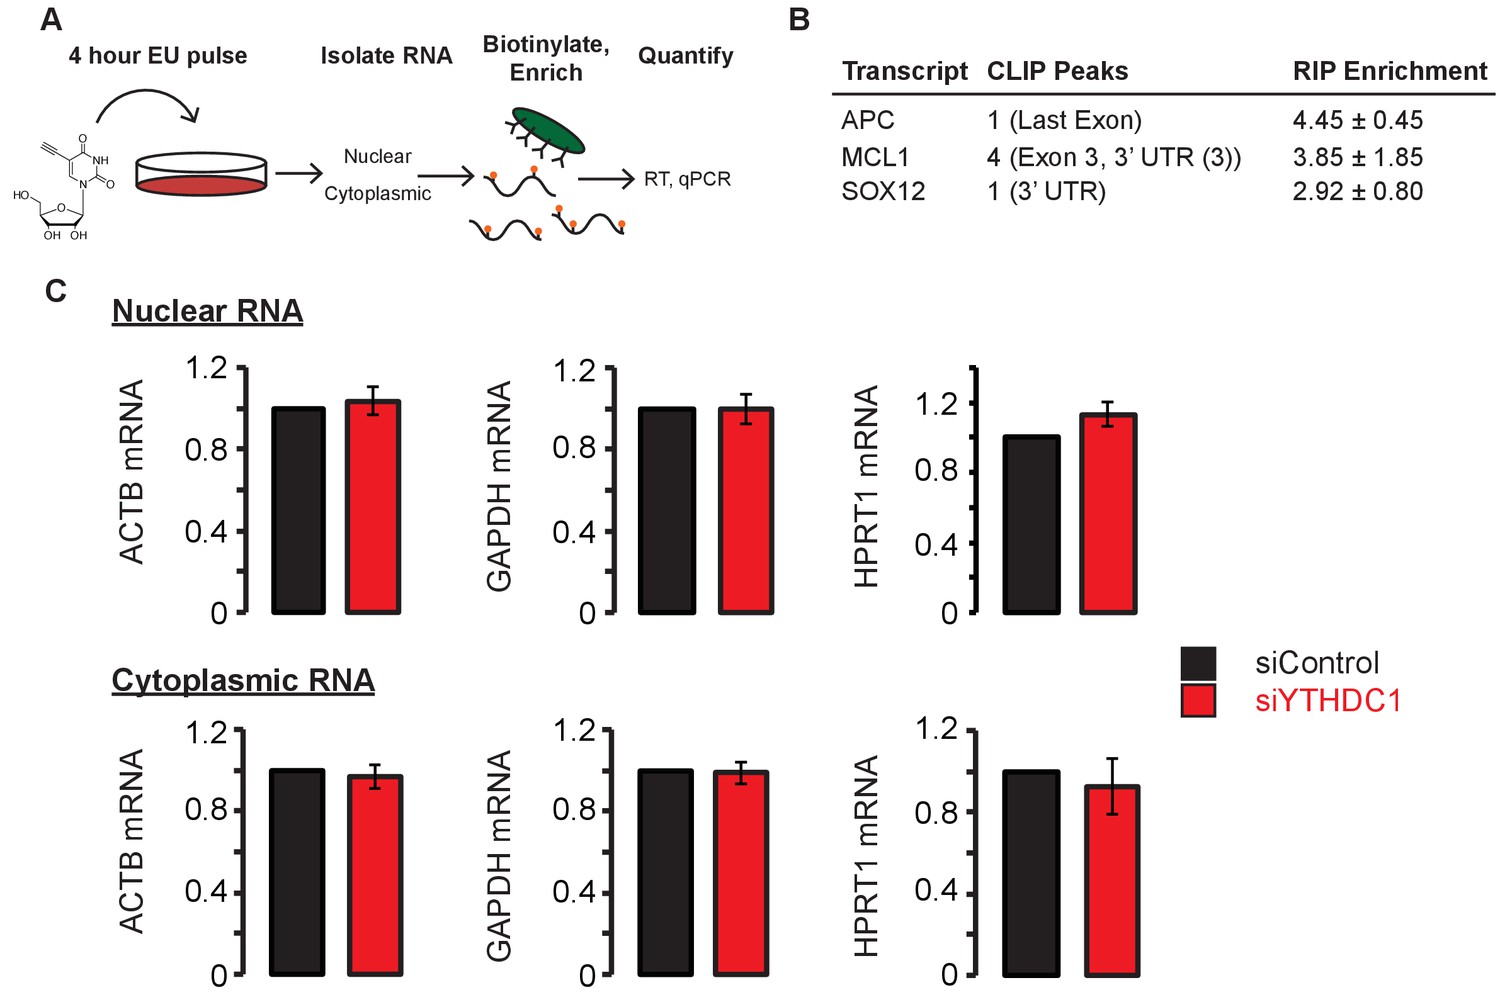
Nascent mRNA localization by metabolic labeling with 5-ethynyl-uridine (EU).
(A) Schematic for nascent RNA labeling of HeLa cells. (B) Selection of YTHDC1 target transcripts based on PAR-CLIP and RIP-seq data. (C) Nuclear and cytoplasmic levels of nascent mRNA of non-target transcripts. Error bars represent mean ± standard deviation, n = 6 (three biological replicates x two technical replicates), two-sided t-test with equal variance. Differences between siControl and siYTHDC1 were not significant (p>0.05 in all cases).
Figure 4—figure supplement 2
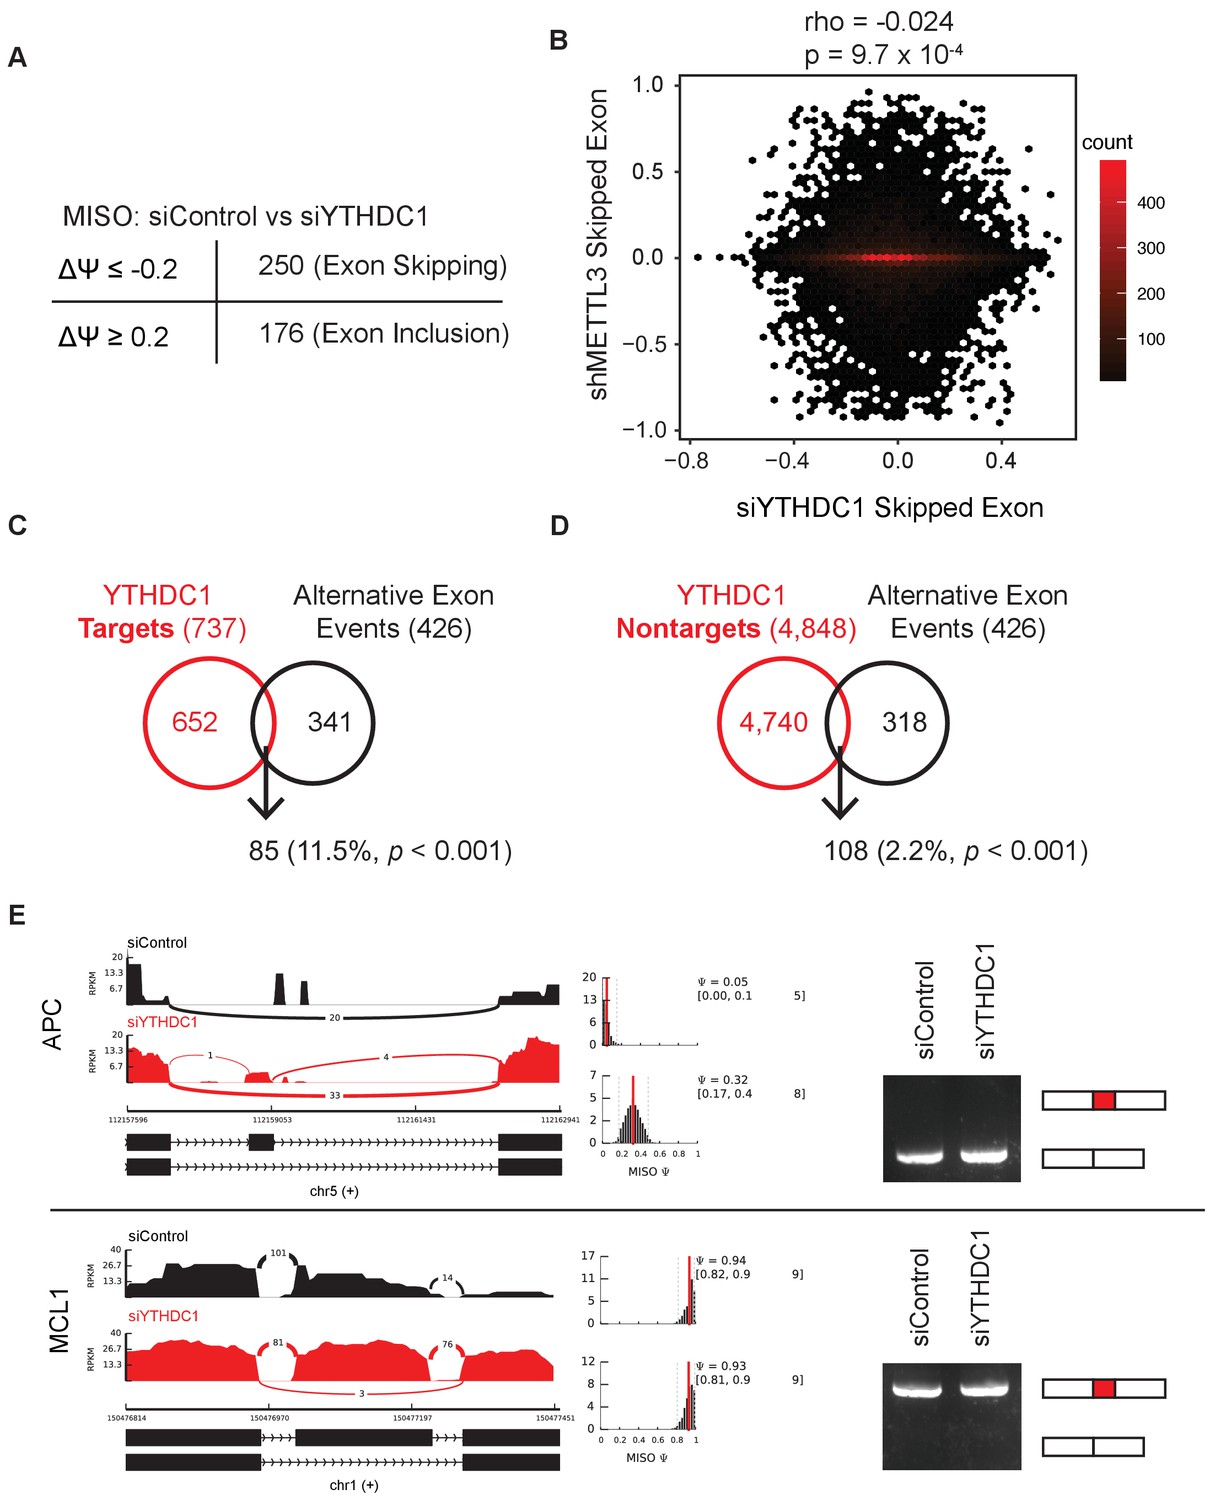
YTHDC1 affects alternative pre-mRNA splicing independent of roles in mRNA binding and export.
(A) Analysis of paired-end RNA-seq data using MISO (Katz et al., 2010). Example code can be found in the Materials and Methods section. (B) Comparison of YTHDC1-dependent skipped exons with METTL3-dependent skipped exons (data from Alarcón et al., 2015). (C) Comparison of YTHDC1 target mRNAs and mRNAs with alternative isoform usage upon YTHDC1 knockdown by RNA-seq. I-value calculated using Fisher’s Exact Test. (D) Comparison of YTHDC1 non-target mRNAs and mRNAs with alternative isoform usage upon YTHDC1 knockdown by RNA-seq. P-value calculated using Fisher’s Exact Test. (E) Sashimi plot and RT-PCR of YTHDC1 target mRNAs APC and MCL1 under control and YTHDC1-knockdown conditions.
Figure 4—figure supplement 3

YTHDC1 reporter system.
(A) Construction of the Luciferase reporter system, as previously reported (Wang et al., 2014a). (B) Modular structure of YTHDC1. Low complexity regions annotated according to SMART (Letunic et al., 2015). (C) Cellular localization of YTHDC1 effector constructs. (D) Translation of reporter mRNA in response to binding by YTHDC1–W377A. Error bars represent mean ± standard deviation, n = 4. (E) Translation of reporter mRNA in response to binding by the YTHDC1 N-terminus. Error bars represent mean ± standard deviation, n = 4. (F) Nuclear and cytoplasmic RT-qPCR of reporter mRNA 4 hr after induction of reporter transcript. Error bars represent mean ± standard deviation, n = 4, *p < 0.05.
Figure 5 with 4 supplements
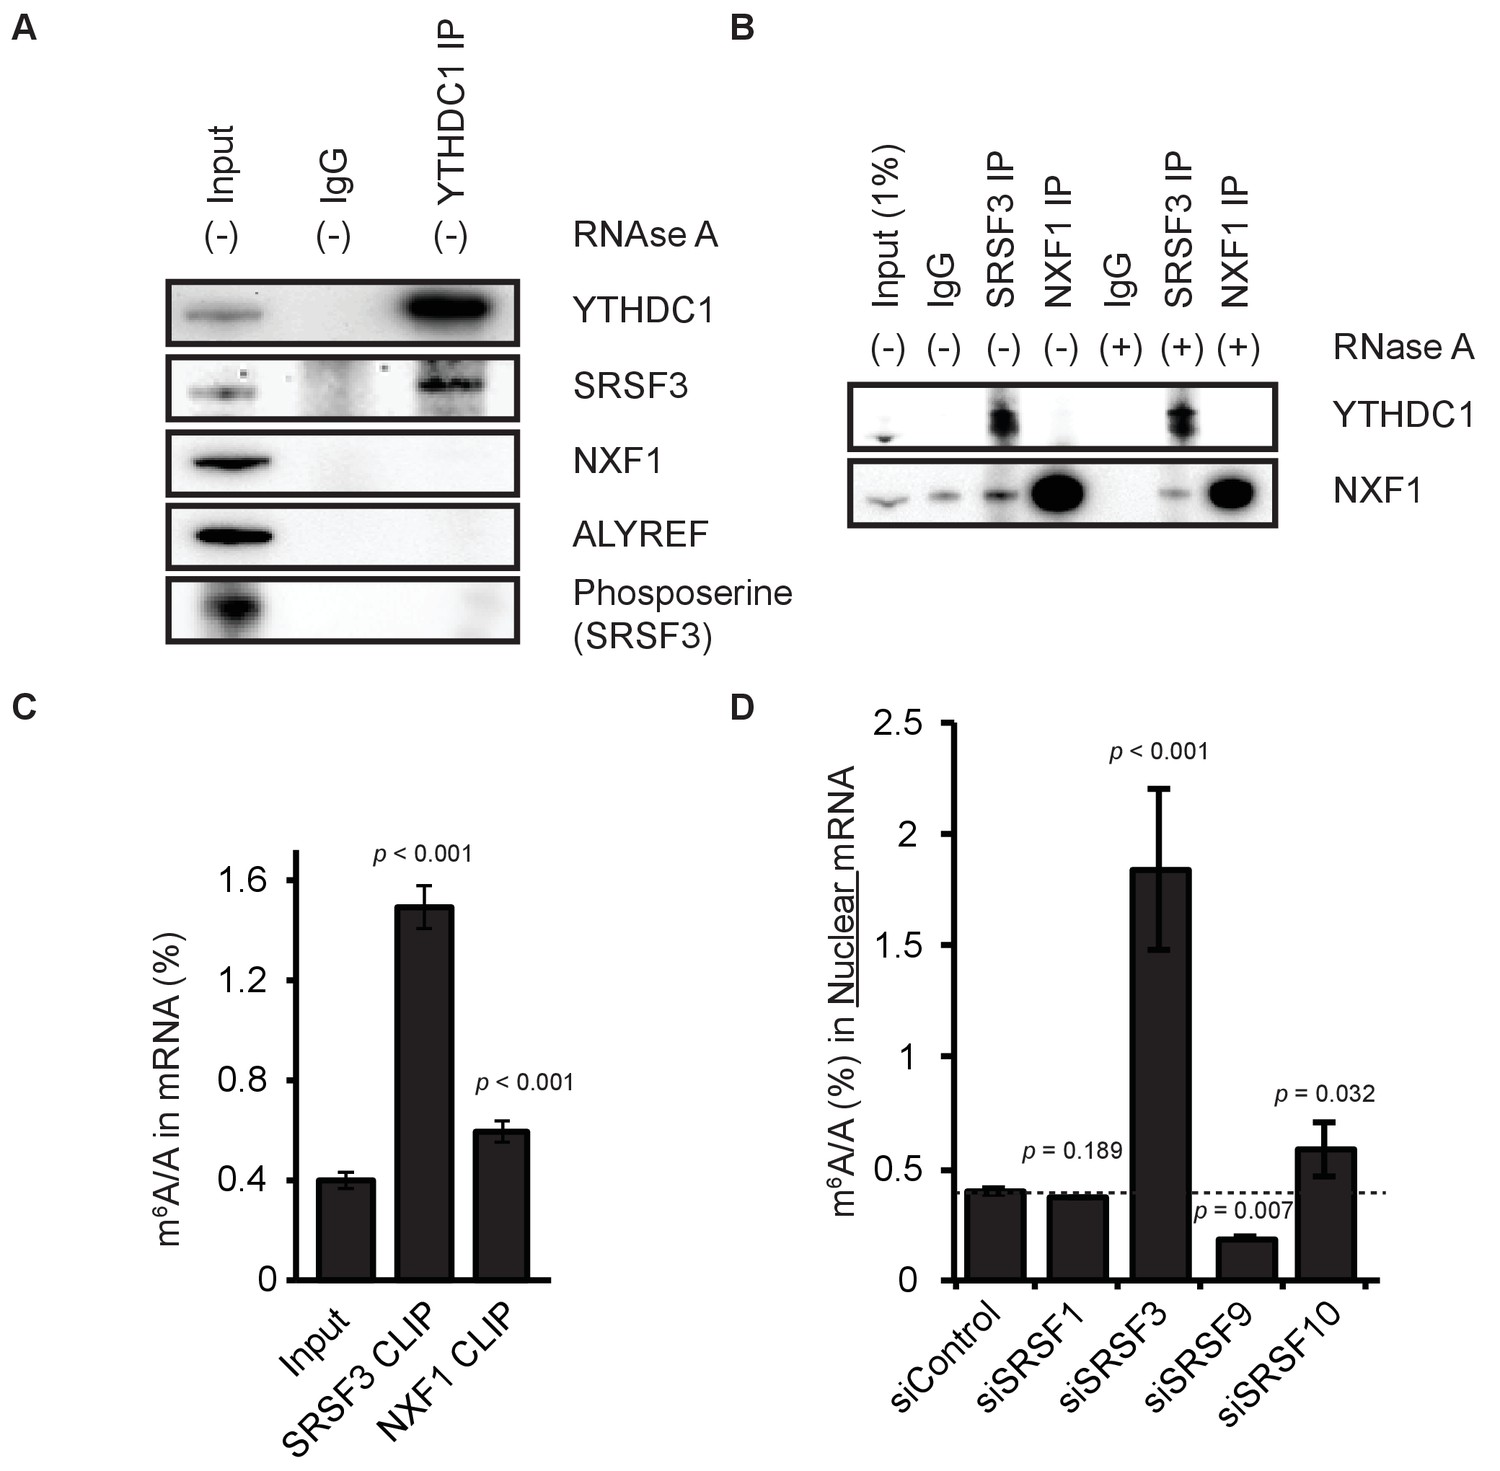
YTHDC1 mediates export of m6A-modified mRNA through SRSF3 and NXF1.
(A) Immunoprecipitation (IP) of endogenous YTHDC1 from HeLa cell lysate. (B) IP of endogenous SRSF3 and NXF1 from HeLa cell lysate. (C) LC-MS/MS of mRNA cross-linked to SRSF3 and NXF1. Error bars represent mean ± standard deviation, n = 4, two-sided t-test with equal variance. (D) Quantification of m6A in nuclear mRNA following knockdown of SR proteins. Error bars represent mean ± standard deviation, n = 4, two-sided t-test with equal variance.
-
Figure 5—source data 1
YTHDC1 mediates export of m6A-modified mRNA through SRSF3 and NXF1.
- https://doi.org/10.7554/eLife.31311.025
Figure 5—figure supplement 1
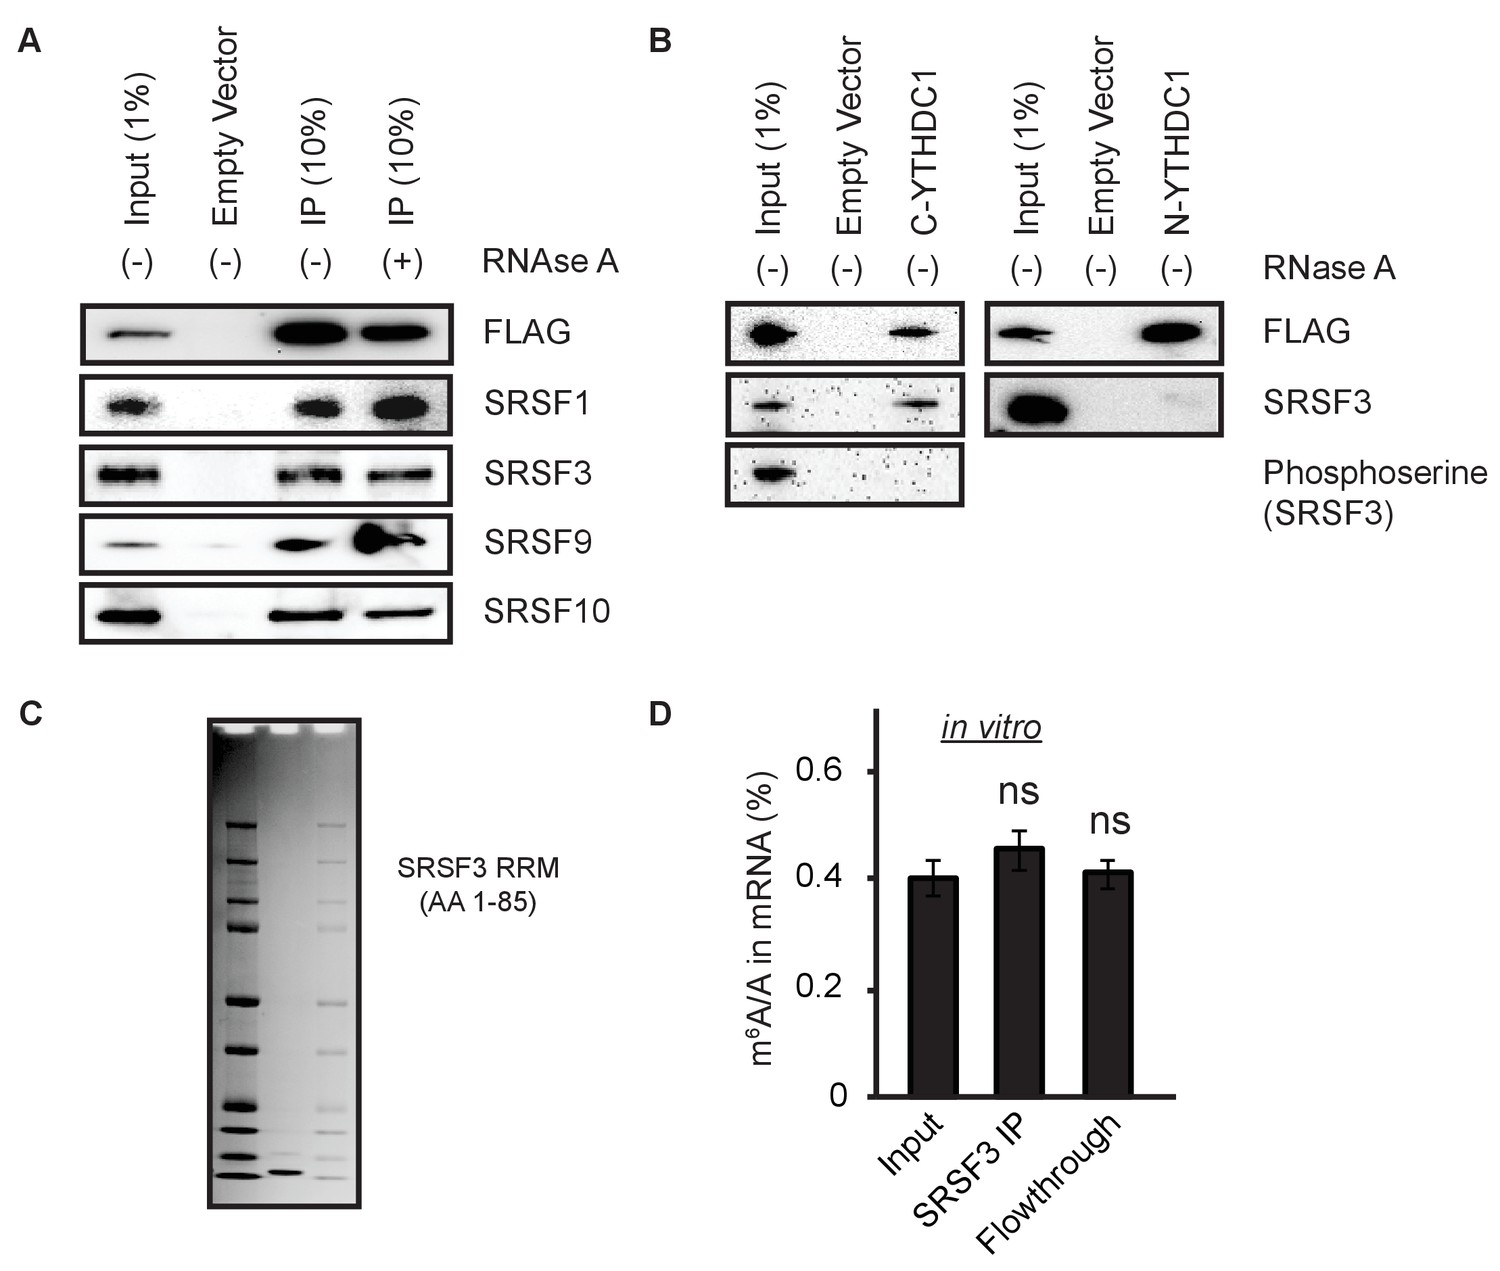
YTHDC1 interacts with export-competent SRSF3.
(A) Immunoprecipitation (IP) of YTHDC1-FLAG with members of the SR protein family. (B) IP of YTHDC1 C- and N-terminal regions with phosphorylated SRSF3. (C) Coomassie stain of His-SRSF3-RRM purified from Escherichia coli. (D) In vitro IP of HeLa mRNA with His-SRSF3-RRM. Error bars represent mean ± standard deviation, n = 4 (two biological x two technical replicates), two-sided t-test of equal variance.
Figure 5—figure supplement 2
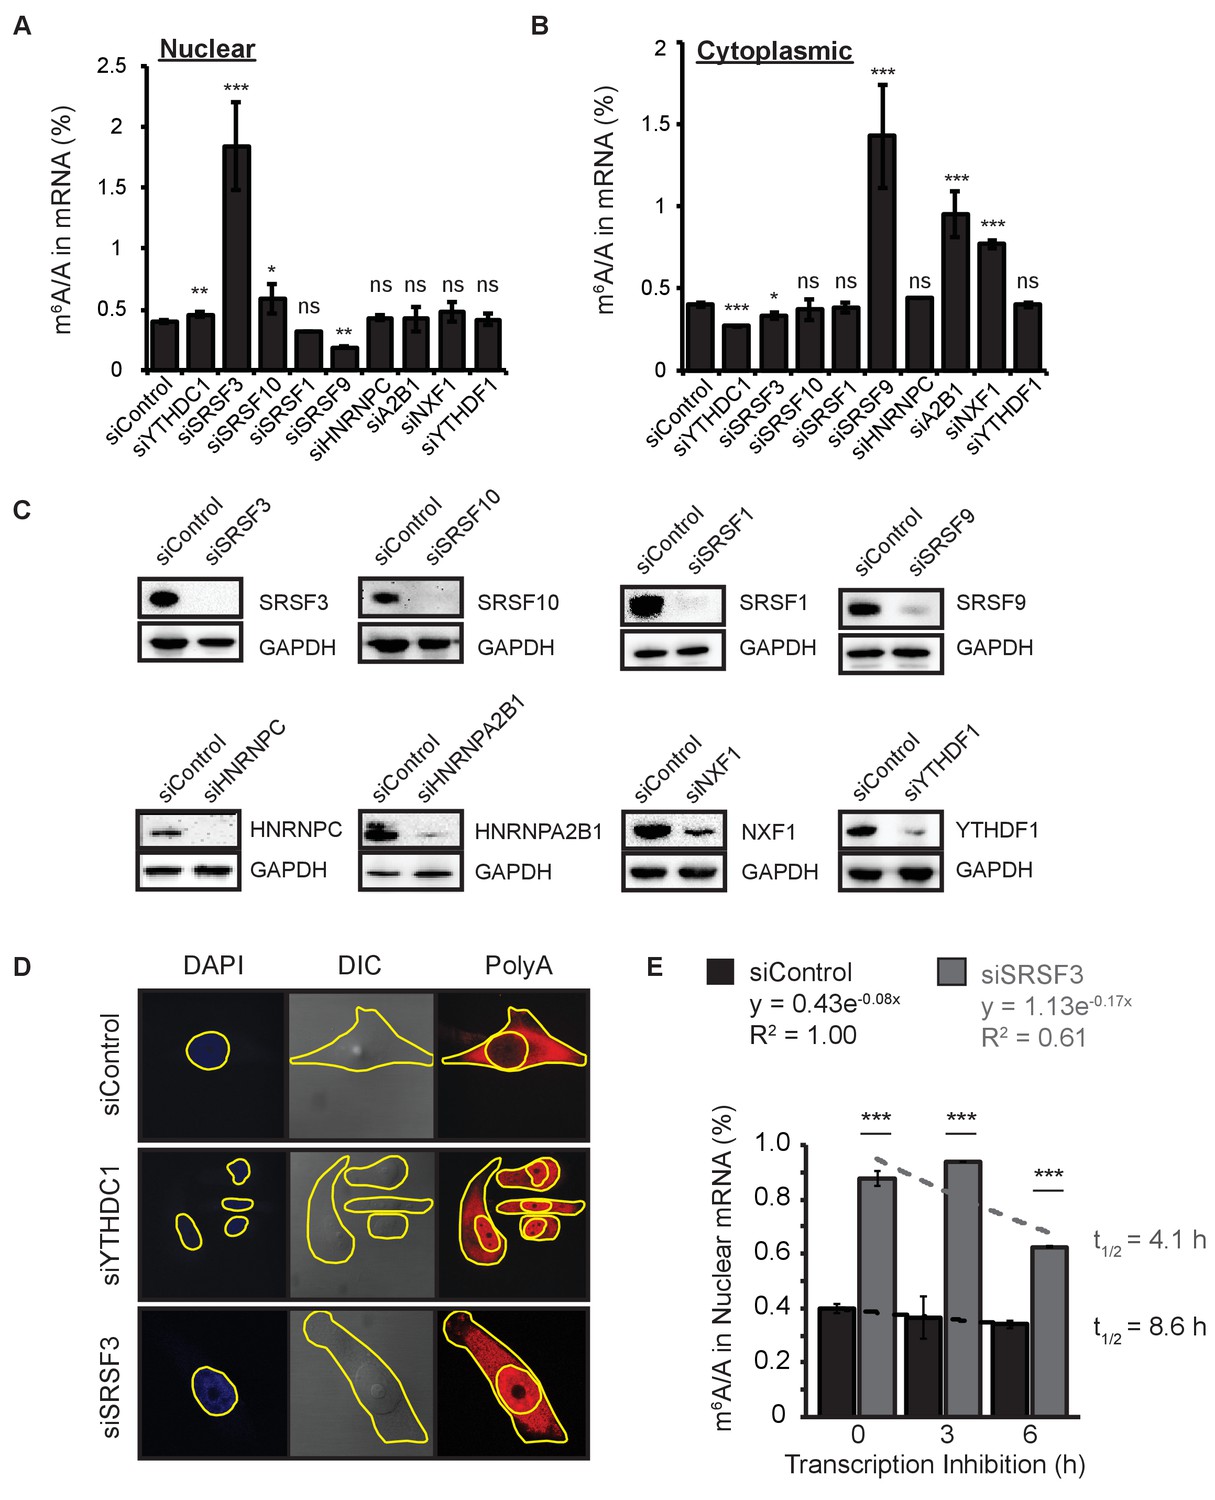
Roles of SRSF3 and other SR proteins in the export of m6A-methylated mRNAs.
(A,B) Full data from Figure 5D. Error bars represent mean ± standard deviation, n = 4, *p<0.05, **p<0.01, ***p<0.001, two sided t-test with equal variance. (C) Representative western blots for siRNA knockdown performed for Figure 5D. (D) PolyA imaging of HeLa cells following treatment with siControl, siYTHDC1, or siSRSF3. Yellow outlines the nuclear regions (defined by DAPI signal) and the cytoplasmic regions (defined by DIC). (E) m6A methylation in nuclear mRNA analyzed at 0, 3, and 6 hr after transcription inhibition. Error bars represent mean ± standard deviation, n = 4, *p<0.05, **p<0.01, ***p<0.001, two-sided t-test with equal variance. Curves fit to exponential decay.
Figure 5—figure supplement 3
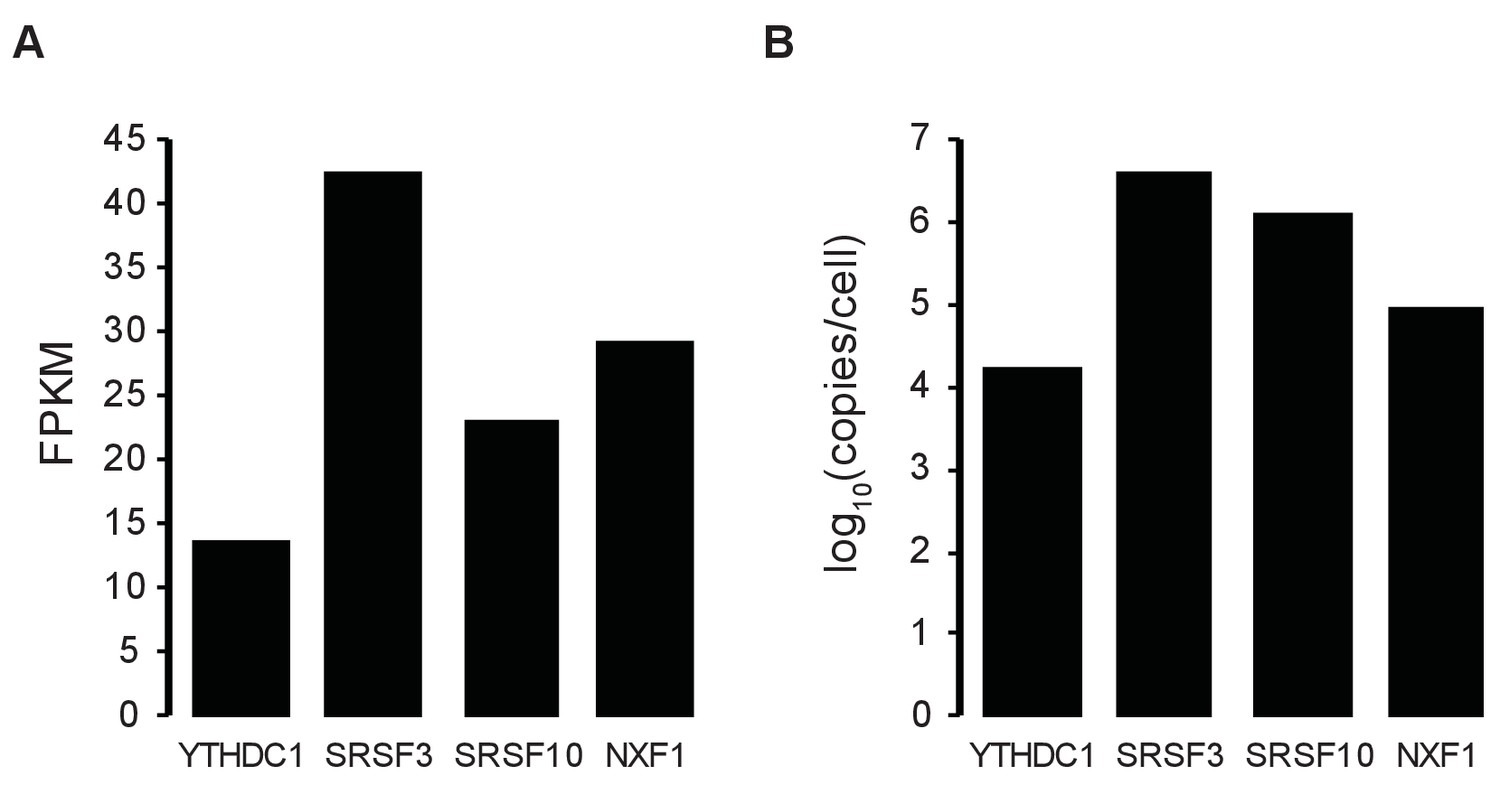
Estimate of relative protein stoichiometry.
(A) Fragments per kilobase of transcript per million (FPKM) from total RNA-seq (average of two biological replicates). (B) Estimate of protein copies per cell in HeLa cells (Nagaraj et al., 2011).
Figure 5—figure supplement 4

Subcellular distribution of YTHDC1 target mRNAs as a function of YTHDC1, SRSF3, and m6A.
(A) Representative western blot for simultaneous siRNA knockdown of METTL3 and METTL14 in HeLa cells. (B) RT-PCR of nuclear RNA following knockdown of YTHDC1, SRSF3, and METTL3/14 in HeLa cells. Error bars represent mean ± standard deviation, n = 4, *p<0.05, **p<0.01, ***p<0.001, two-sided t-test with equal variance. (C) RT-PCR of cytoplasmic RNA following knockdown of YTHDC1, SRSF3, and METTL3/14 in HeLa cells. Error bars represent mean ± standard deviation, n = 4, *p<0.05, **p<0.01, ***p<0.001, two-sided t-test with equal variance.
-
Figure 5—figure supplement 4—source data 1
Subcellular distribution of YTHDC1 target mRNAs as a function of YTHDC1, SRSF3, and m6A.
- https://doi.org/10.7554/eLife.31311.024
Figure 6
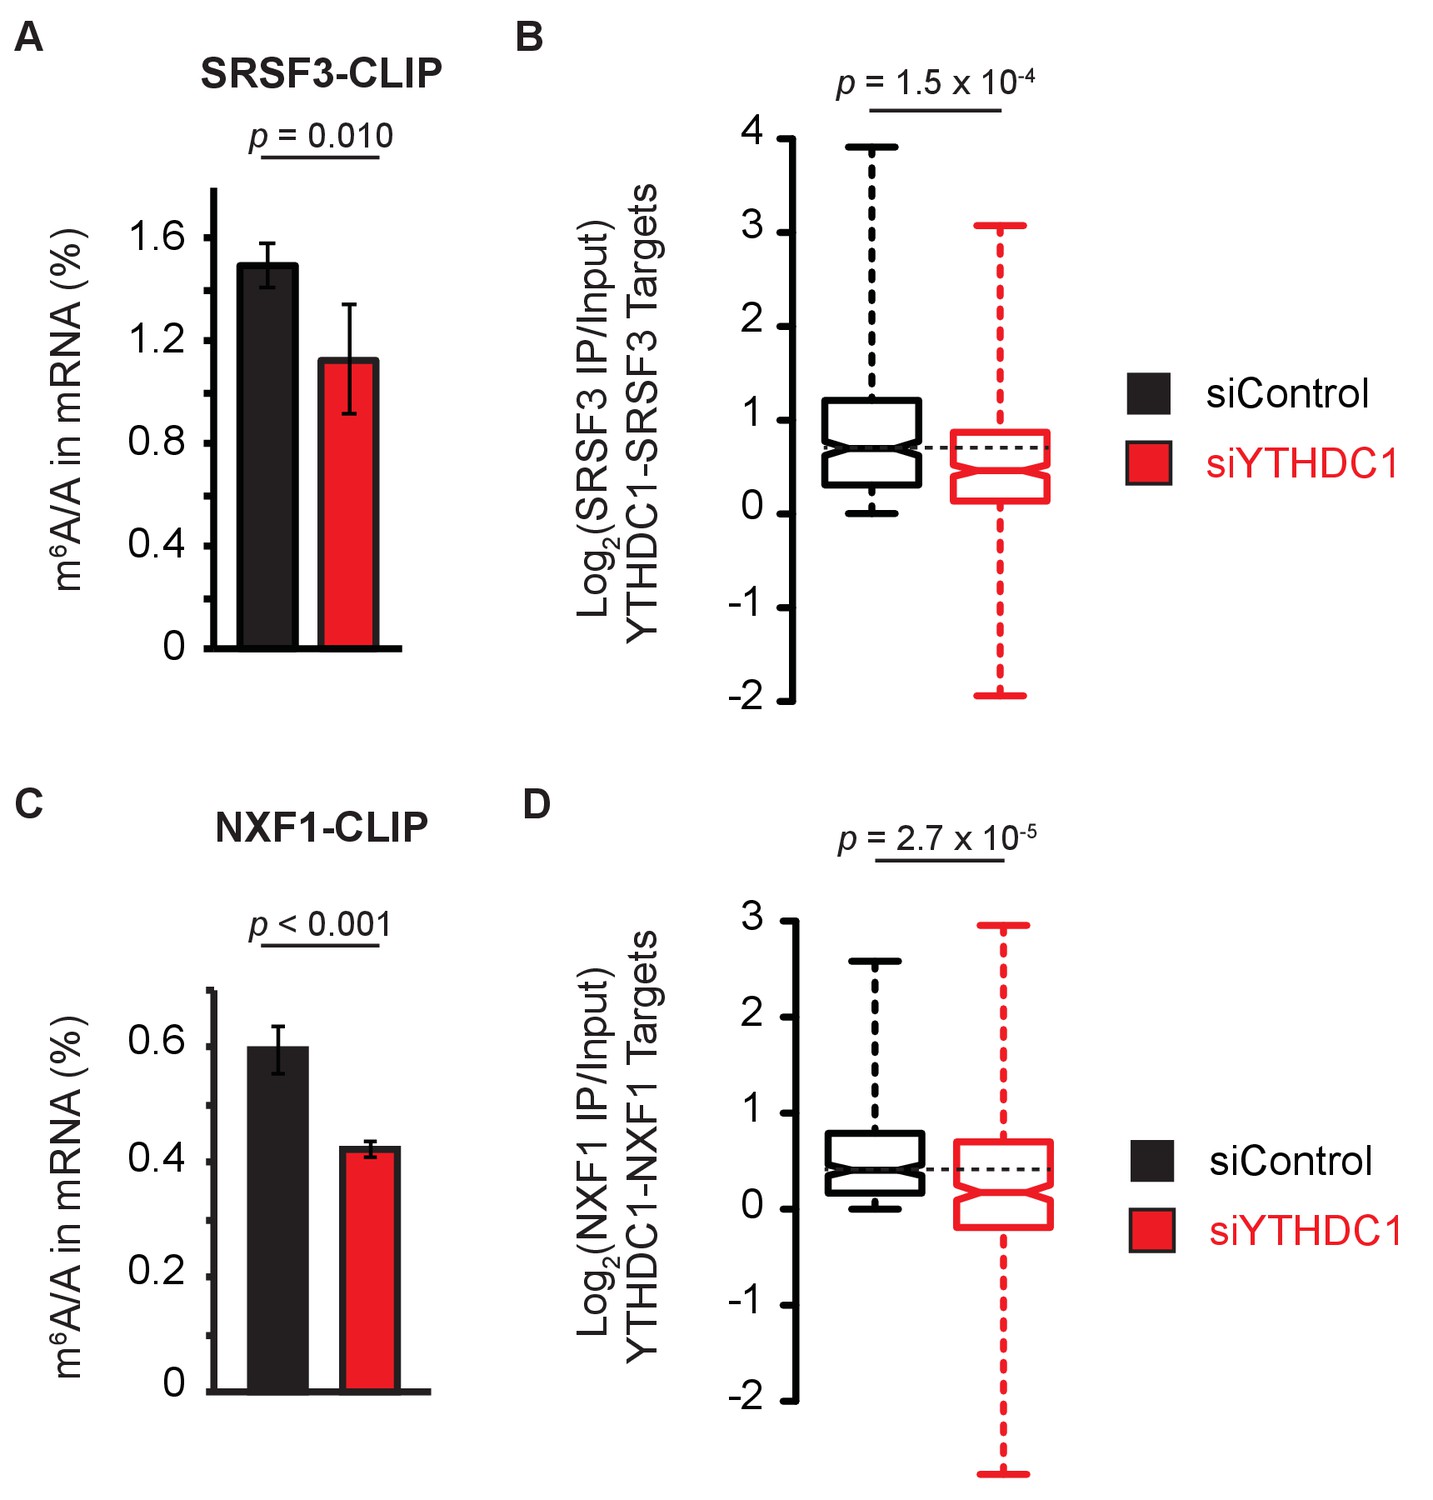
YTHDC1 facilitates RNA binding by mRNA export machinery.
(A) LC-MS/MS of mRNA cross-linked to SRSF3. Error bars represent mean ± standard deviation, n = 4, two-sided t-test with equal variance. (B) Target enrichment by SRSF3. Whiskers represent three times the interquartile range. Data were analyzed across two independent experiments representing biological replicates. P-value calculated using Welch’s T-test. Whiskers represent three times the interquartile range. (C) LC-MS/MS of mRNA cross-linked to NXF1. Error bars represent mean ± standard deviation, n = 4, two-sided t-test with equal variance. (D) Target enrichment by NXF1. Whiskers represent three times the interquartile range. Data were analyzed across two independent experiments representing biological replicates. P-value calculated using Welch’s T-test. Whiskers represent three times the interquartile range.
-
Figure 6—source data 1
YTHDC1 facilitates RNA binding by mRNA export machinery.
- https://doi.org/10.7554/eLife.31311.027
Figure 7 with 1 supplement
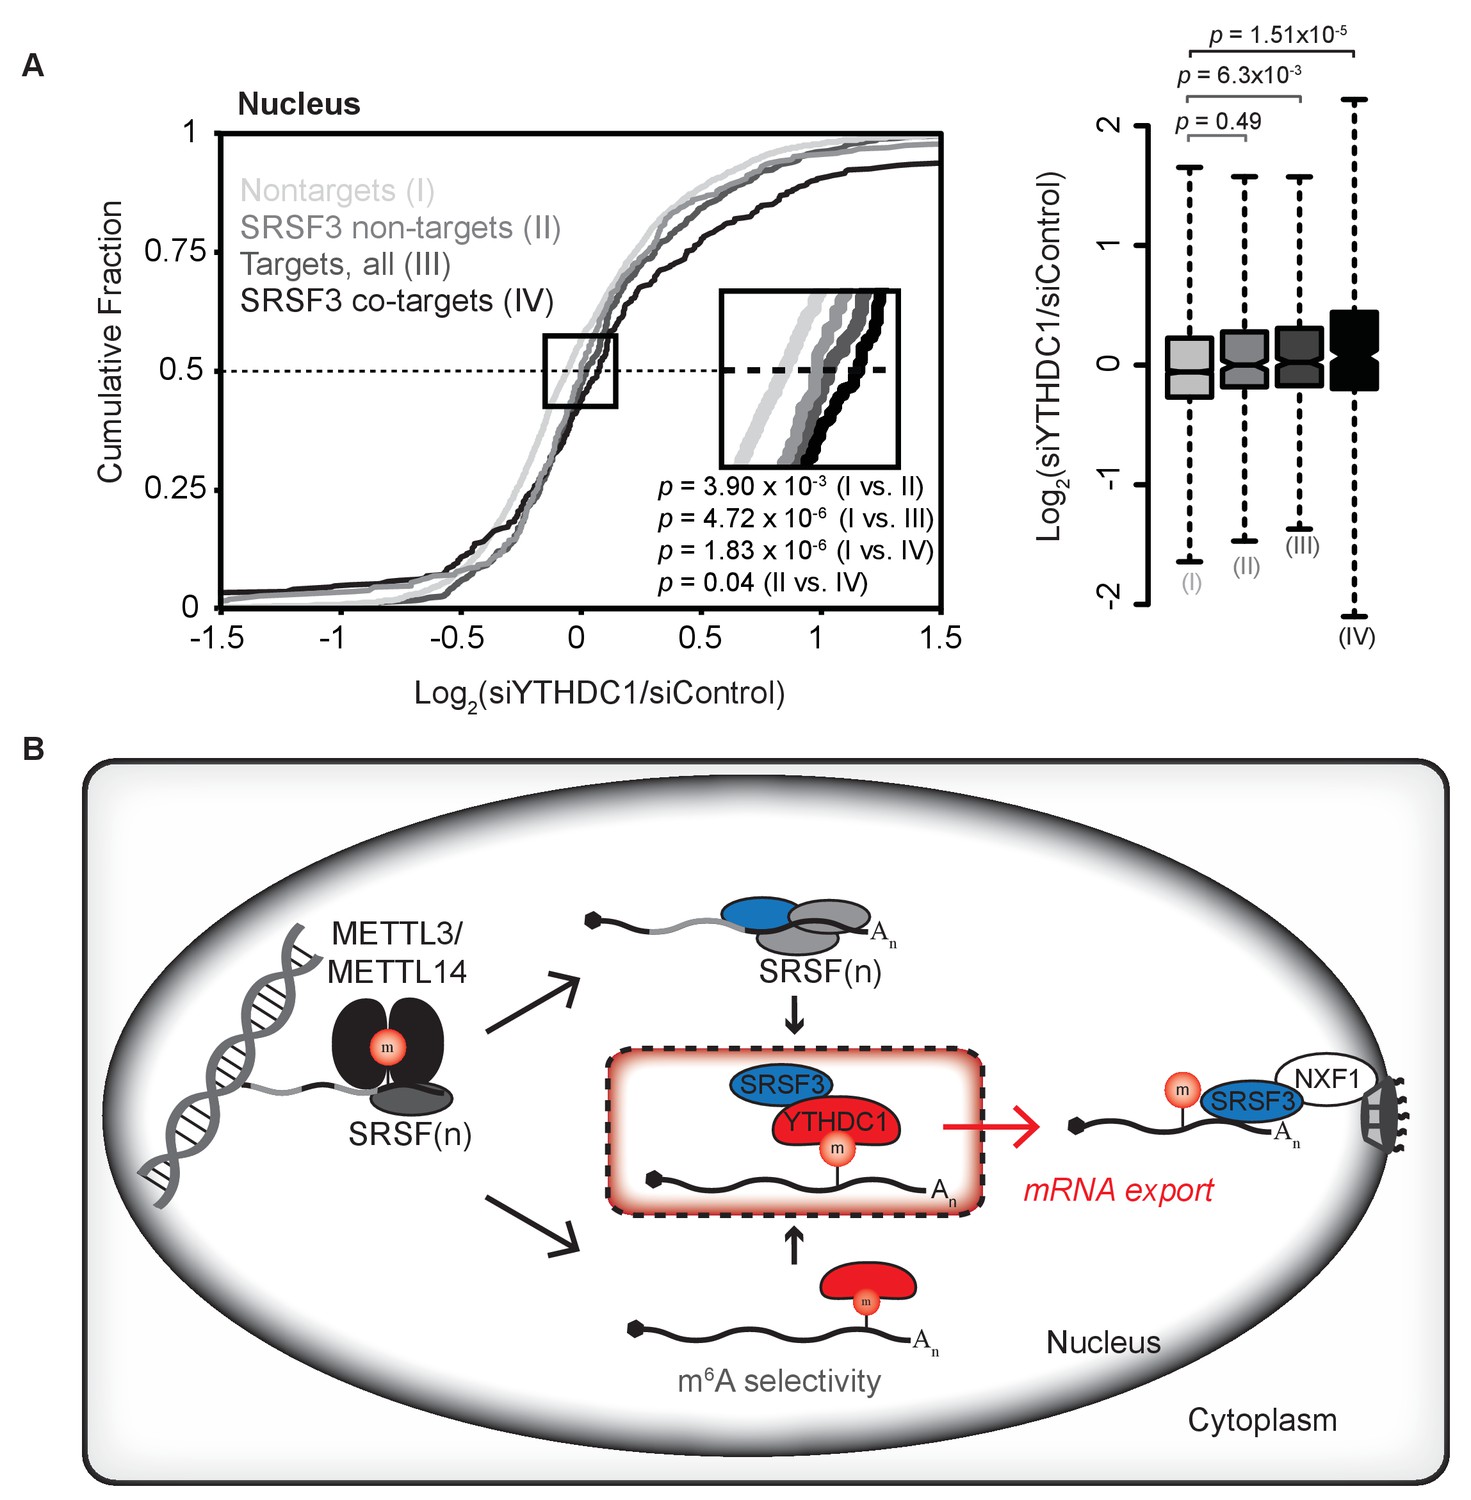
Association with SRSF3 is required for facilitated export by YTHDC1.
(A) Nuclear abundance of transcripts based on binding by YTHDC1 and/or SRSF3. Cumulative fractions: Mann-Whitney-Wilcoxon Test. Box plot: Welch’s T-Test. Whiskers represent three times the interquartile range. (B) Model of selective export of methylated mRNAs by YTHDC1.
-
Figure 7—source data 1
Association with SRSF3 is required for facilitated export by YTHDC1.
- https://doi.org/10.7554/eLife.31311.030
Figure 7—figure supplement 1
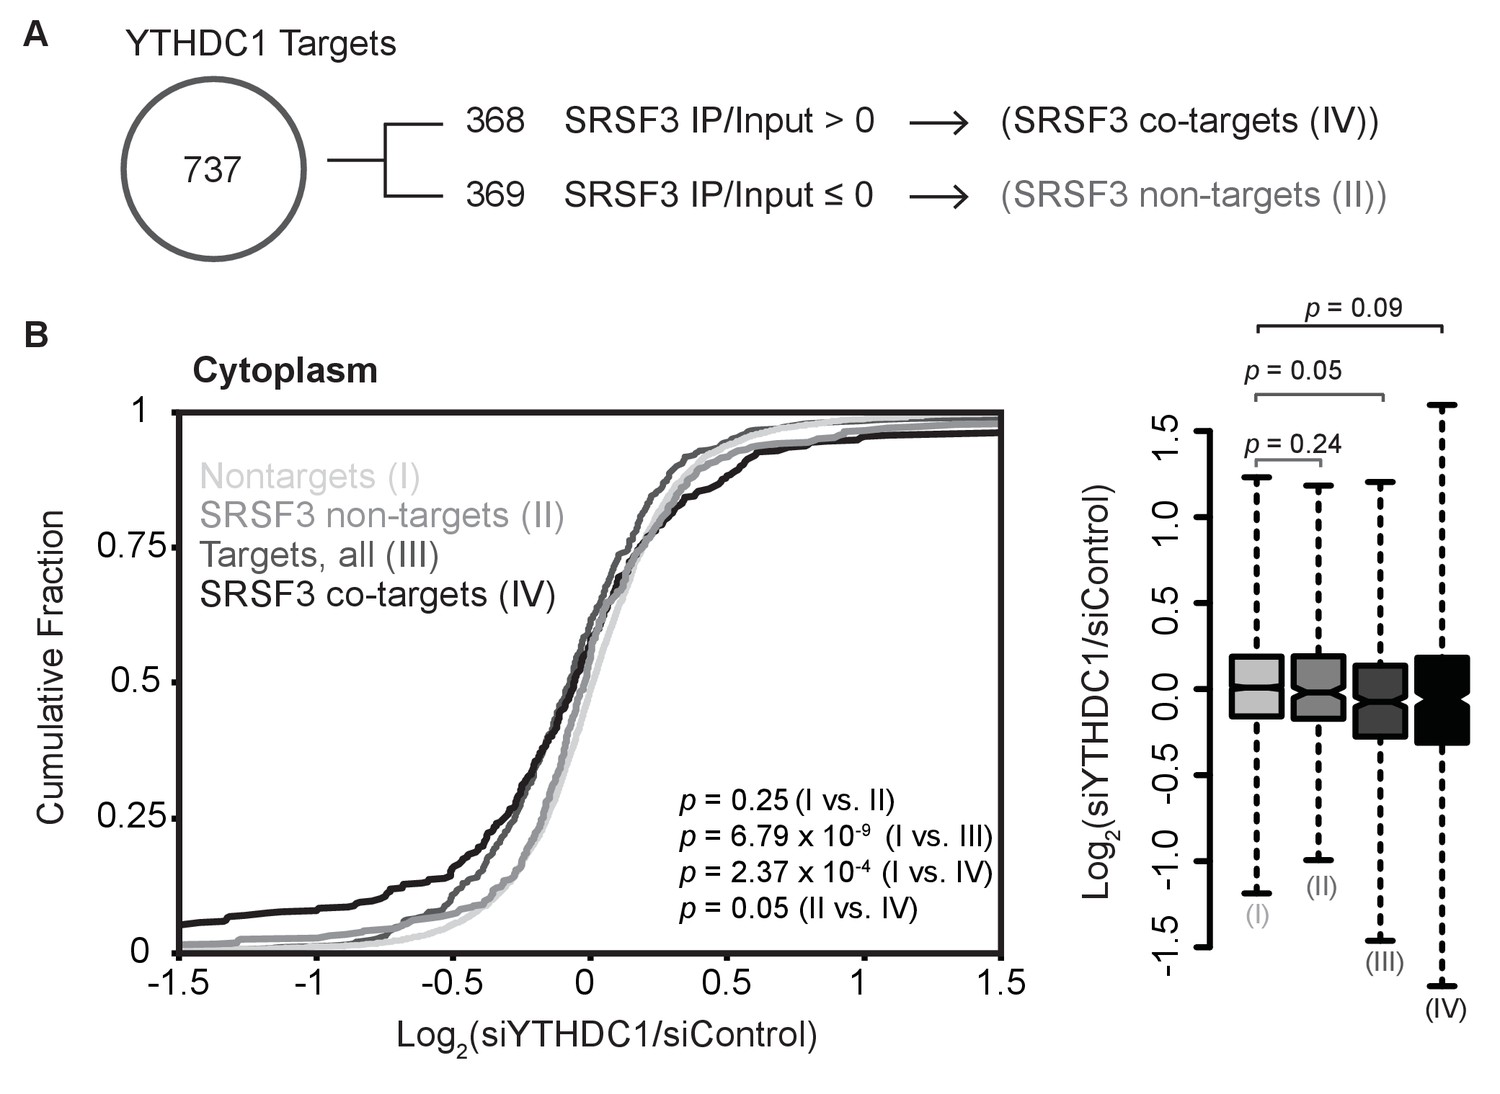
Definition of transcript groups based on YTHDC1 and SRSF3 binding, and effect on cytoplasmic abundance.
(A) Definition of transcript groups based on YTHDC1 target binding by SRSF3. (B) Cytoplasmic abundance of transcripts based on binding by YTHDC1 and/or SRSF3. Cumulative fractions: Mann-Whitney-Wilcoxon Test. Box plot: Welch’s T-Test. Whiskers represent three times the interquartile range.
Additional files
-
Supplementary file 1
Summary of high-throughput sequencing experiments.
- https://doi.org/10.7554/eLife.31311.031
-
Transparent reporting form
- https://doi.org/10.7554/eLife.31311.032
Download links
A two-part list of links to download the article, or parts of the article, in various formats.
Downloads (link to download the article as PDF)
Open citations (links to open the citations from this article in various online reference manager services)
Cite this article (links to download the citations from this article in formats compatible with various reference manager tools)
YTHDC1 mediates nuclear export of N6-methyladenosine methylated mRNAs
eLife 6:e31311.
https://doi.org/10.7554/eLife.31311


