The formation of the light-sensing compartment of cone photoreceptors coincides with a transcriptional switch
- Friedrich Miescher Institute for Biomedical Research, Switzerland
- University of Basel, Switzerland
- Swiss Insitute of Bioinformatics, Switzerland
Figures
Figure 1 with 2 supplements

Outer segments of photoreceptors appear at P6.
(A) Ultrastructure of photoreceptor compartments (outer segments in cyan; connecting cilium in blue) at different postnatal days. Each panel shows a single image from an image stack obtained by serial block-face electron microscopy, magnified from a region marked in Figure 1—figure supplement 1. Scale bar 1 μm. (B) Opsin expression in the retinas of Chrnb4-GFP mice at different postnatal days. Each image shows a maximum intensity projection of a 7 μm stack of confocal microscopy images obtained from a retinal vibratome section. Cones stained with antibodies against GFP (grey) and a mix of antibodies against s- and m/l-opsin (cyan). Scale bar 10 μm. (C) Magnification of regions marked in (B). Upper row: opsin staining. Middle row: GFP staining. Lower row: GPF and opsin staining. Scale bar 5 μm. (D) Quantification of outer segments shown in (A) (n = 1 mouse per day, 1 eye per mouse) and (C) (n = 3 mice per day, 1 eye per mouse). Error bars show means ± s.d.
Figure 1—figure supplement 1
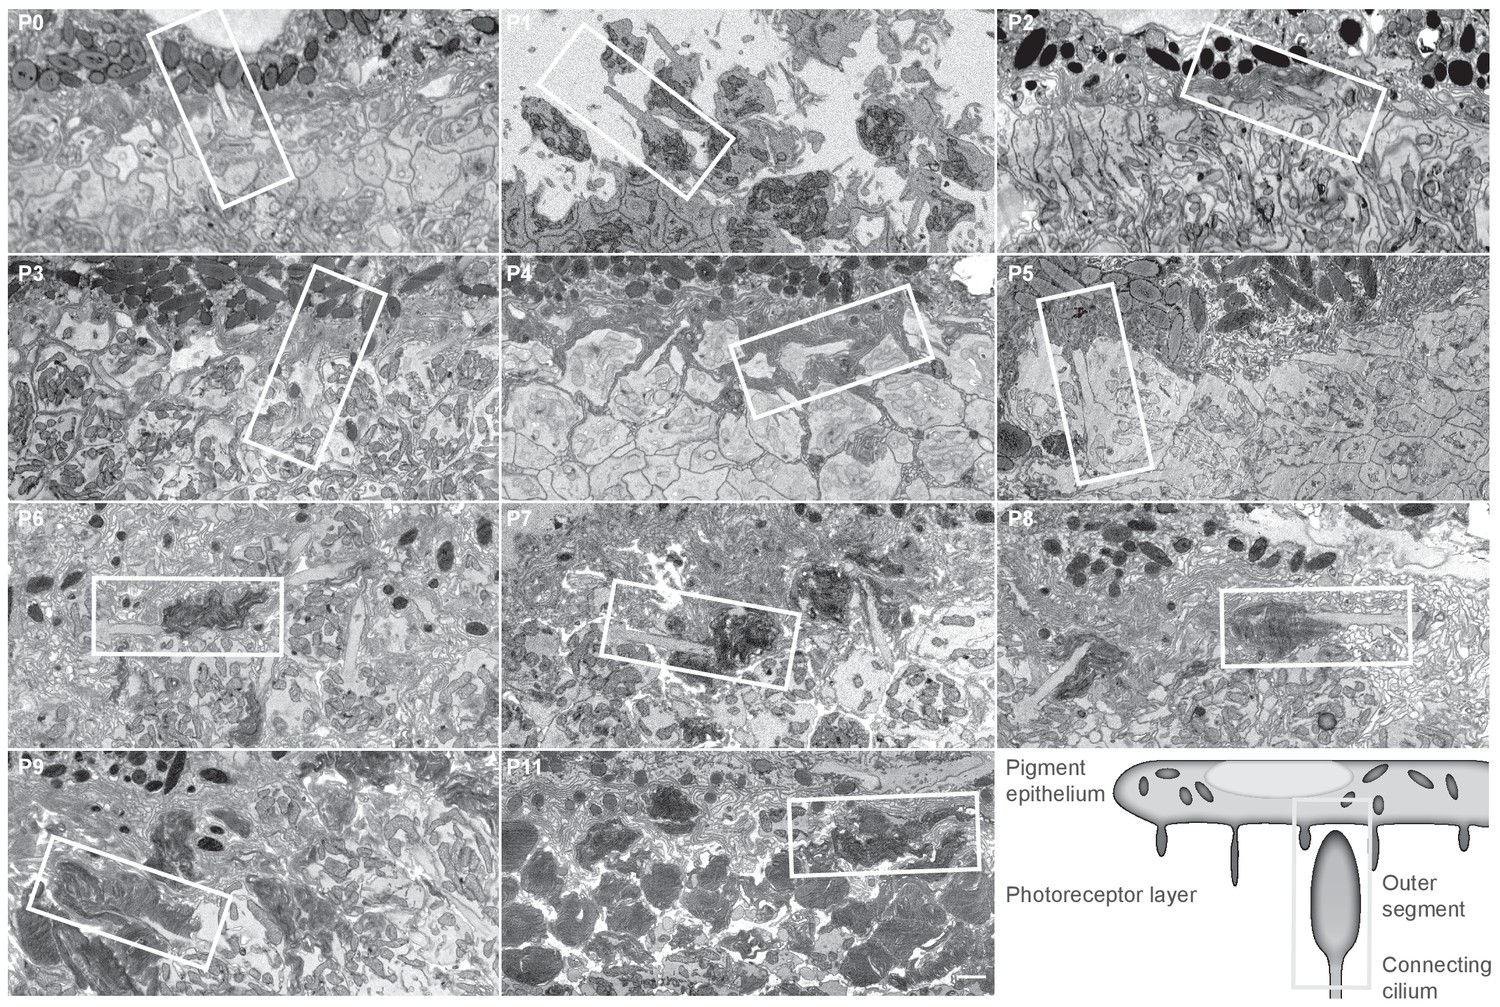
The ultrastructure of photoreceptors at different postnatal days.
Each panel shows a single image from a serial block-face electron microscopy image stack at the indicated postnatal day. Pigment epithelium is attached at all time points except P1. Scale bar 1 μm. The white boxes indicate regions that are shown in Figure 1A.
Figure 1—figure supplement 2

The identity of GFP-labeled cells in the retina of Chrnb4-GFP mice.
(A) The distribution of GFP-positive cells across the different layers of the retina at different developmental days. The proportion of GFP-positive cells in the ganglion cell layer and in the photoreceptor cell layer relative to the total number of GFP-positive cells is shown. The quantification was performed on confocal microscopy images taken from retinal vibratome sections (n = 3 mice per day). Error bars show means ± s.d. (B) The proportion of cells in the photoreceptor layer that are positive for both GFP and cone opsin, relative to the total number of GFP-positive cells (dark grey) and relative to the total number of cone opsin-positive cells (light grey) is shown at different postnatal days. The quantifications were based on confocal microscopy images of retinal whole mounts stained against GFP and a mix of s- and m-/l-opsin (n = 1 mouse per day). Before P5, opsin signal was weak and confined to the cell bodies and inner segments. This opsin signal likely reflects S-opsin, because S-opsin is expressed from P0 onwards, while M/L-opsin only starts being expressed at P6.
Figure 2 with 2 supplements
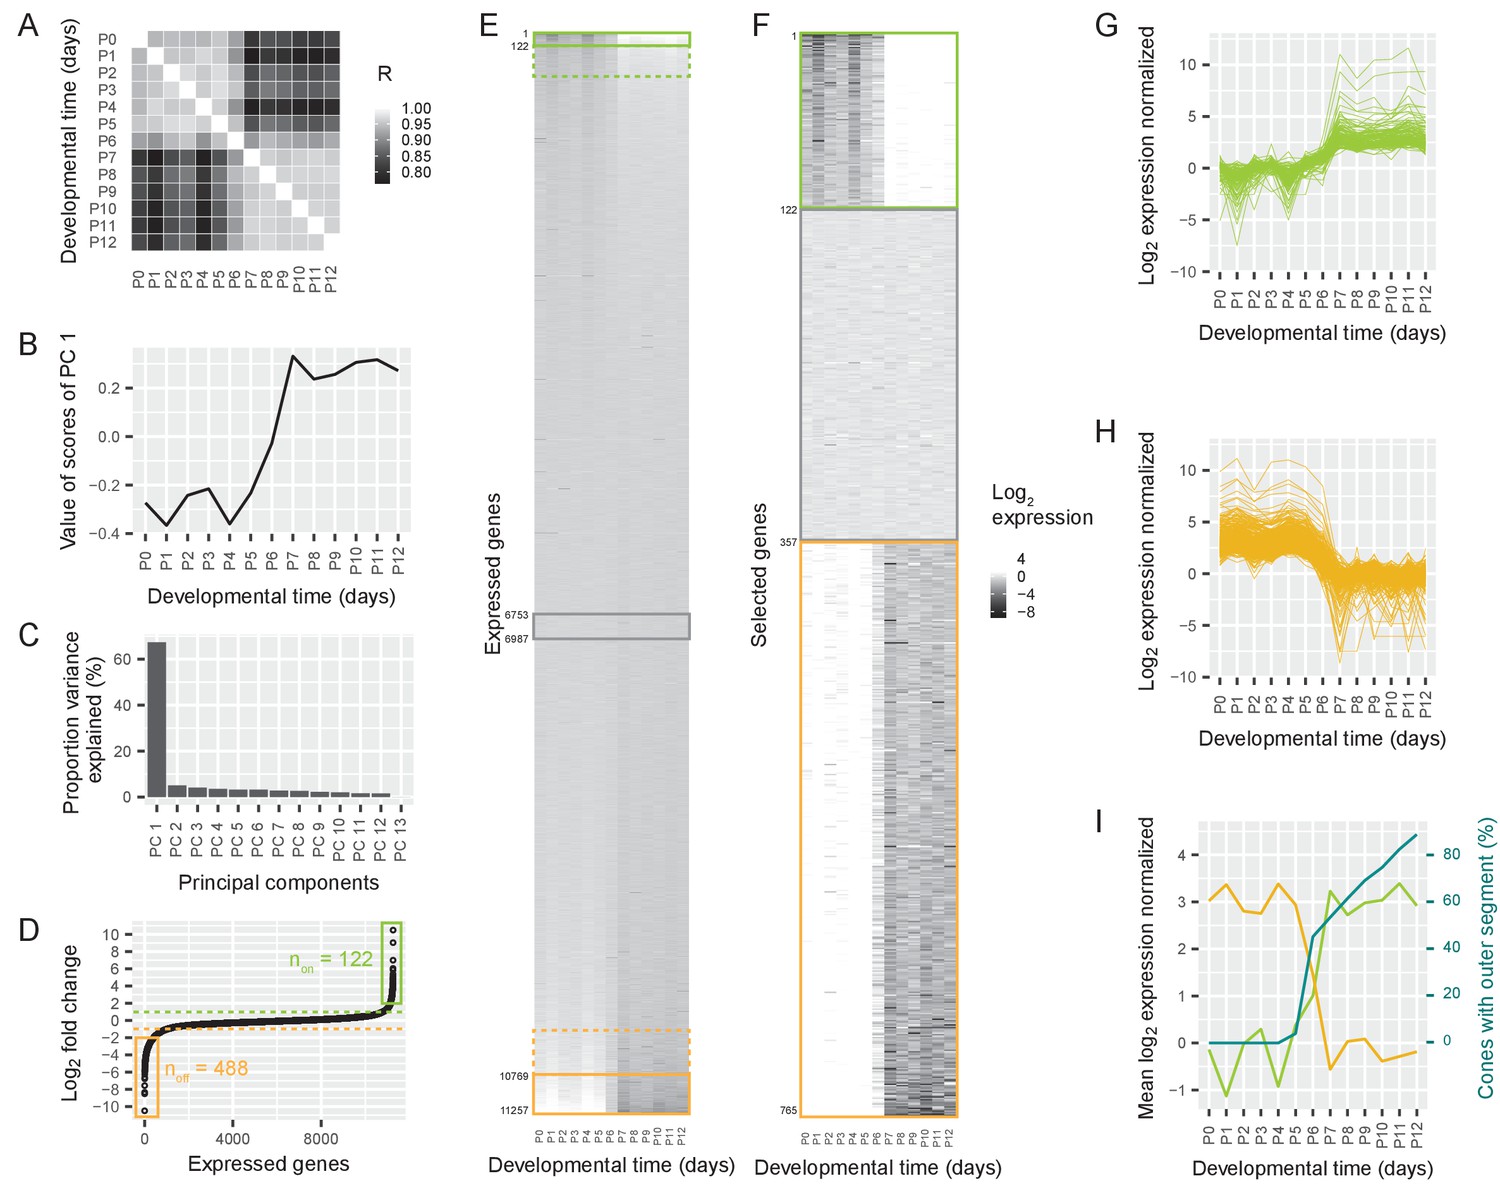
Switch in gene expression in cone photoreceptors at P6.
(A) Pearson correlations between the log2-transformed numbers of RNAseq reads per gene in cones isolated at different postnatal days from Chrnb4-GFP mice, three replicates per time point. R = Pearson correlation coefficient. (B) The values of the first principal component, representing a common time course. (C) The proportion of variance explained by different principal components. (D) Ordered log2 fold changes in expression of all 11,257 expressed genes in isolated cones. Fold changes are the difference in expression levels before (mean expression P0-P5) and after (mean expression P7-P12) the switch. Fold changes are ordered from smallest to largest value. Switch-on (non) and switch-off (noff) genes with absolute log2 fold changes higher than 2 (= log2 fold changes higher than 2 or lower than −2) are marked with a box. Switch-on and switch-off genes with absolute log2 fold changes higher than 1 are above or below the dashed lines. (E–F) Heat maps showing expression levels for all expressed genes (E) and selected genes (F) from P0-P12. Rows show genes ranked by log2 fold change. Green and orange boxes correspond to regions marked in (D). The grey box marks constant genes with absolute log2 fold changes less than 0.01. (E) Expression levels of all expressed genes. (F). Expression levels of switch-on and switch-off genes that have absolute log2 fold changes greater than 2, as well as constant genes. (G–H) Time course of normalized log2 fold changes for switch-on genes (G) and switch-off genes (H) that have absolute log2 fold changes greater than 2. The data are normalized to the mean expression before the switch (P0–P5) (G) or after the switch (P7–P12) (H). (I) Mean log2 fold changes of switch-on and switch-off genes with absolute log2 fold changes greater than 2 and percentage of outer segments (replotted from Figure 1D).
Figure 2—figure supplement 1
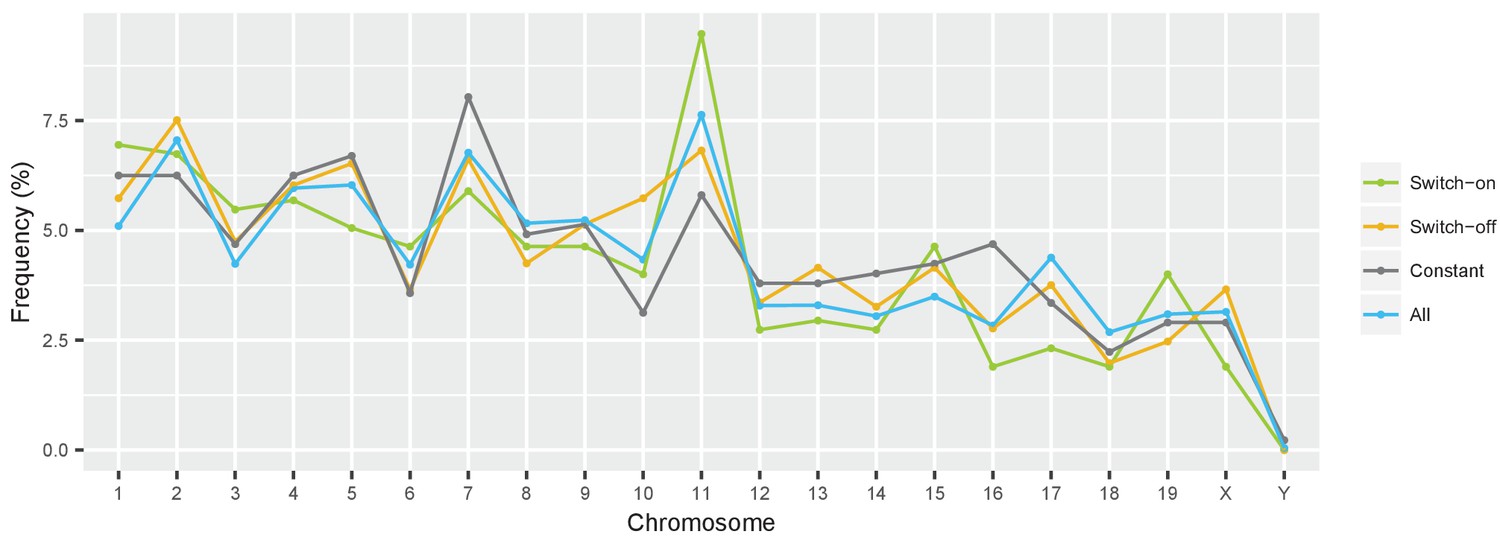
Switch genes are evenly distributed over the genome.
Frequency of cone-expressed genes across different chromosomes in the mouse genome, shown for different groups of genes: all expressed genes (blue); constantly expressed genes with absolute fold changes of |log2 fold change| < 0.01 (grey); and switch genes with | log2 fold change |>1 (green and orange).
Figure 2—figure supplement 2
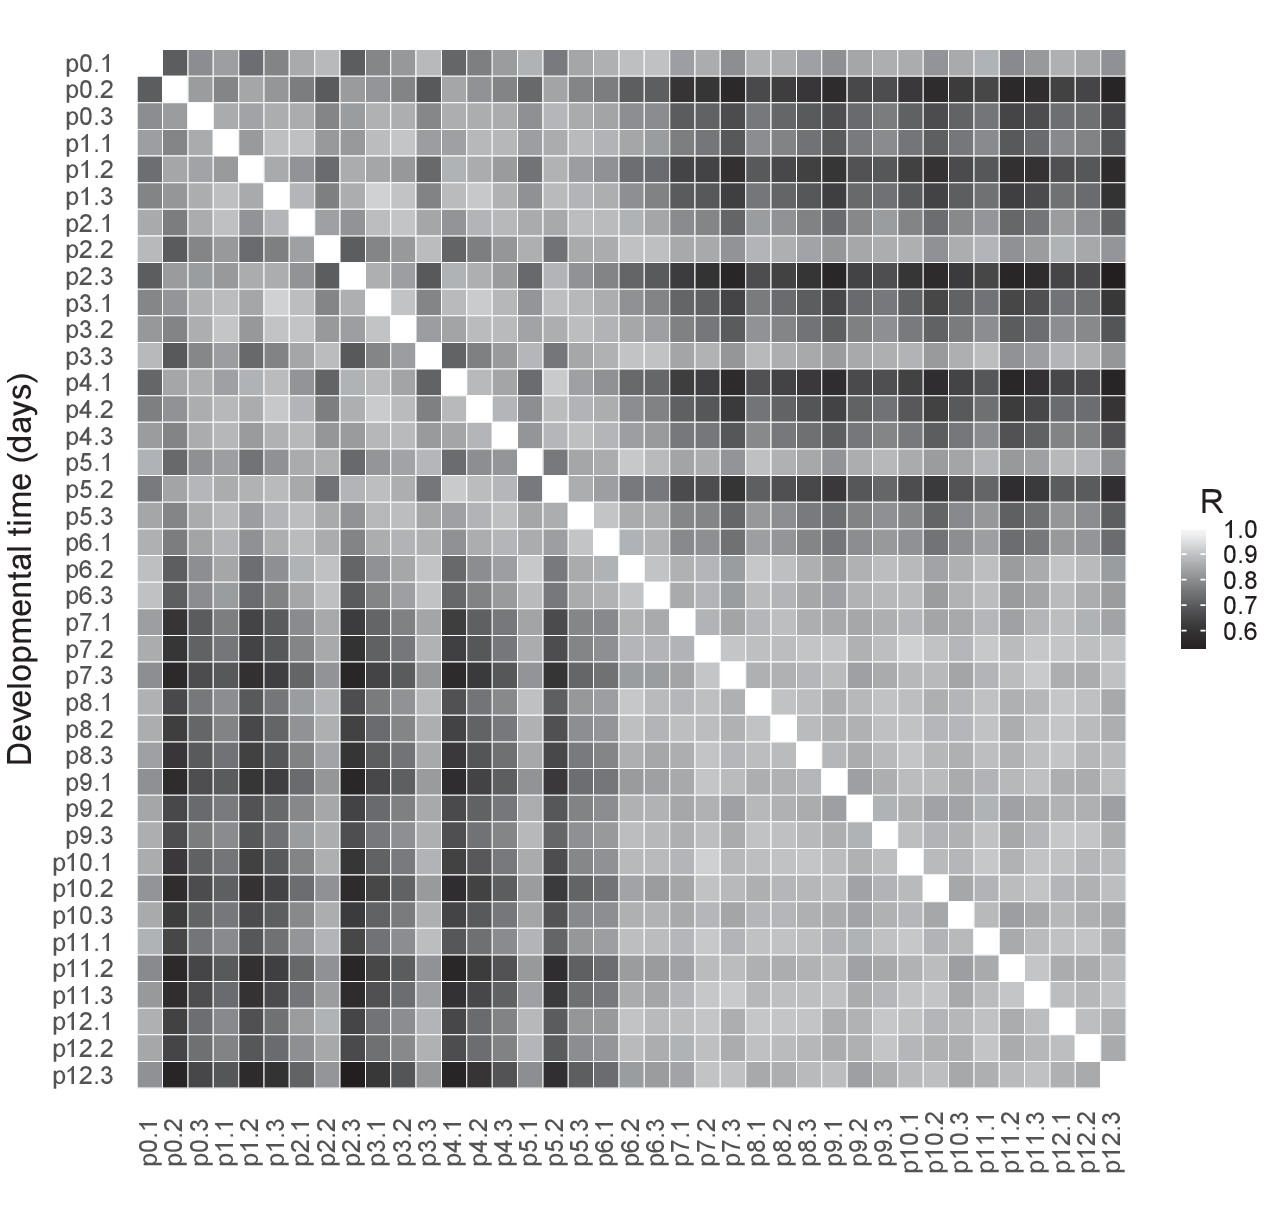
RNAseq quality control.
Pearson correlations between the log2-transformed numbers of RNAseq reads per gene in cones isolated at different postnatal days from Chrnb4-GFP mice, all replicates per time point. R = Pearson correlation coefficient.
Figure 3 with 1 supplement
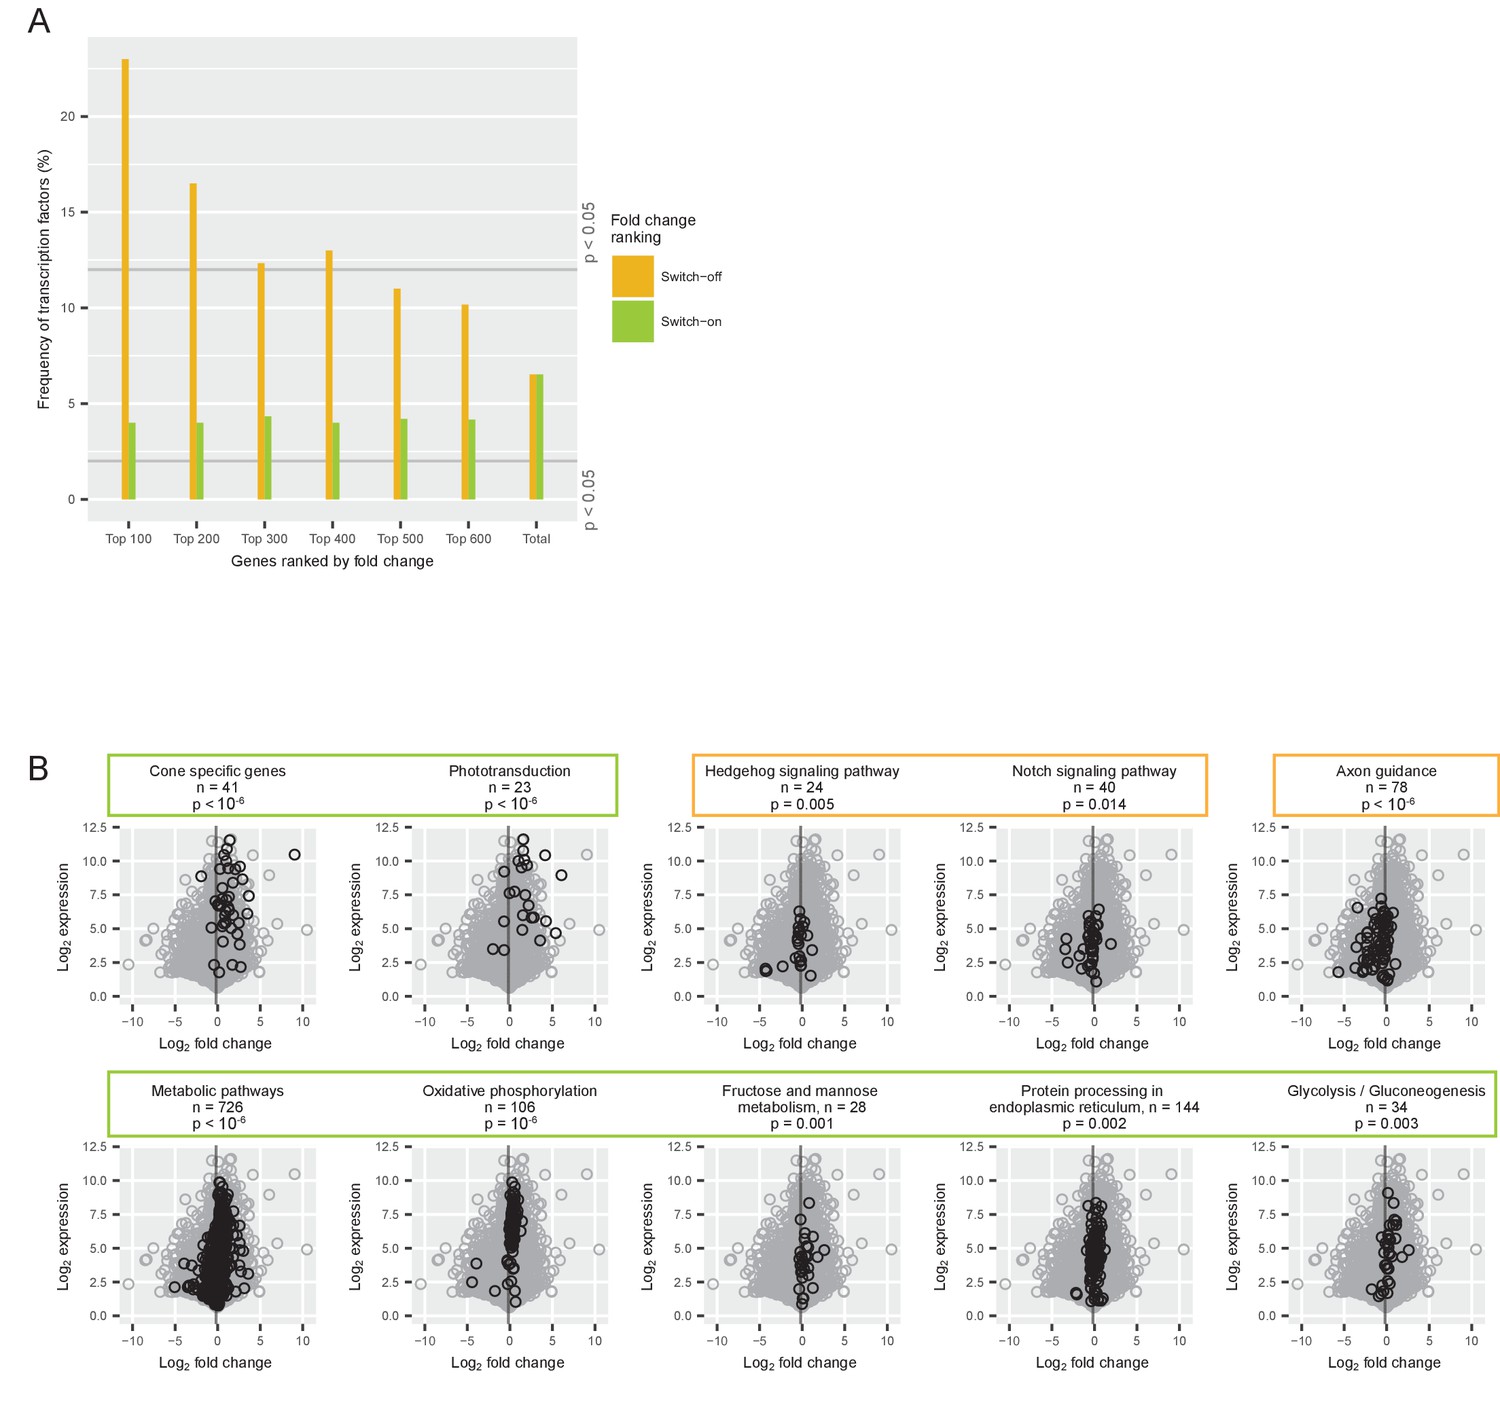
Gene classes and pathways involved in the switch.
(A) Proportion of transcription factors among different groups of switch-on (green) and switch-off (orange) genes. All expressed genes were ordered by their log2 fold changes between P0-P5 and P7-P12 and the 100, 200, 300, 400, 500 and 600 most strongly on- or off-switching genes were grouped. The last group ‘total’ contains all expressed genes (for conceptual consistency there are two separate bars but there is no difference between the orange and the green bar). The grey lines mark the frequency of transcription factors that is significantly higher or lower than expected (permutation analysis). (B) Comparison of log2 fold changes and log2 maximum expression levels during P0-P12 of all expressed genes (grey) with genes associated with a particular pathway (black): pathways needed for cone function, signaling pathways, axon guidance pathway, and metabolic pathways. The grey line marks the mean fold change of all expressed genes (−0.18). P-values from permutation analyses; n is the number of genes associated with each pathway. Orange boxes mark pathways that switch off, and green boxes mark pathways that switch on.
Figure 3—figure supplement 1
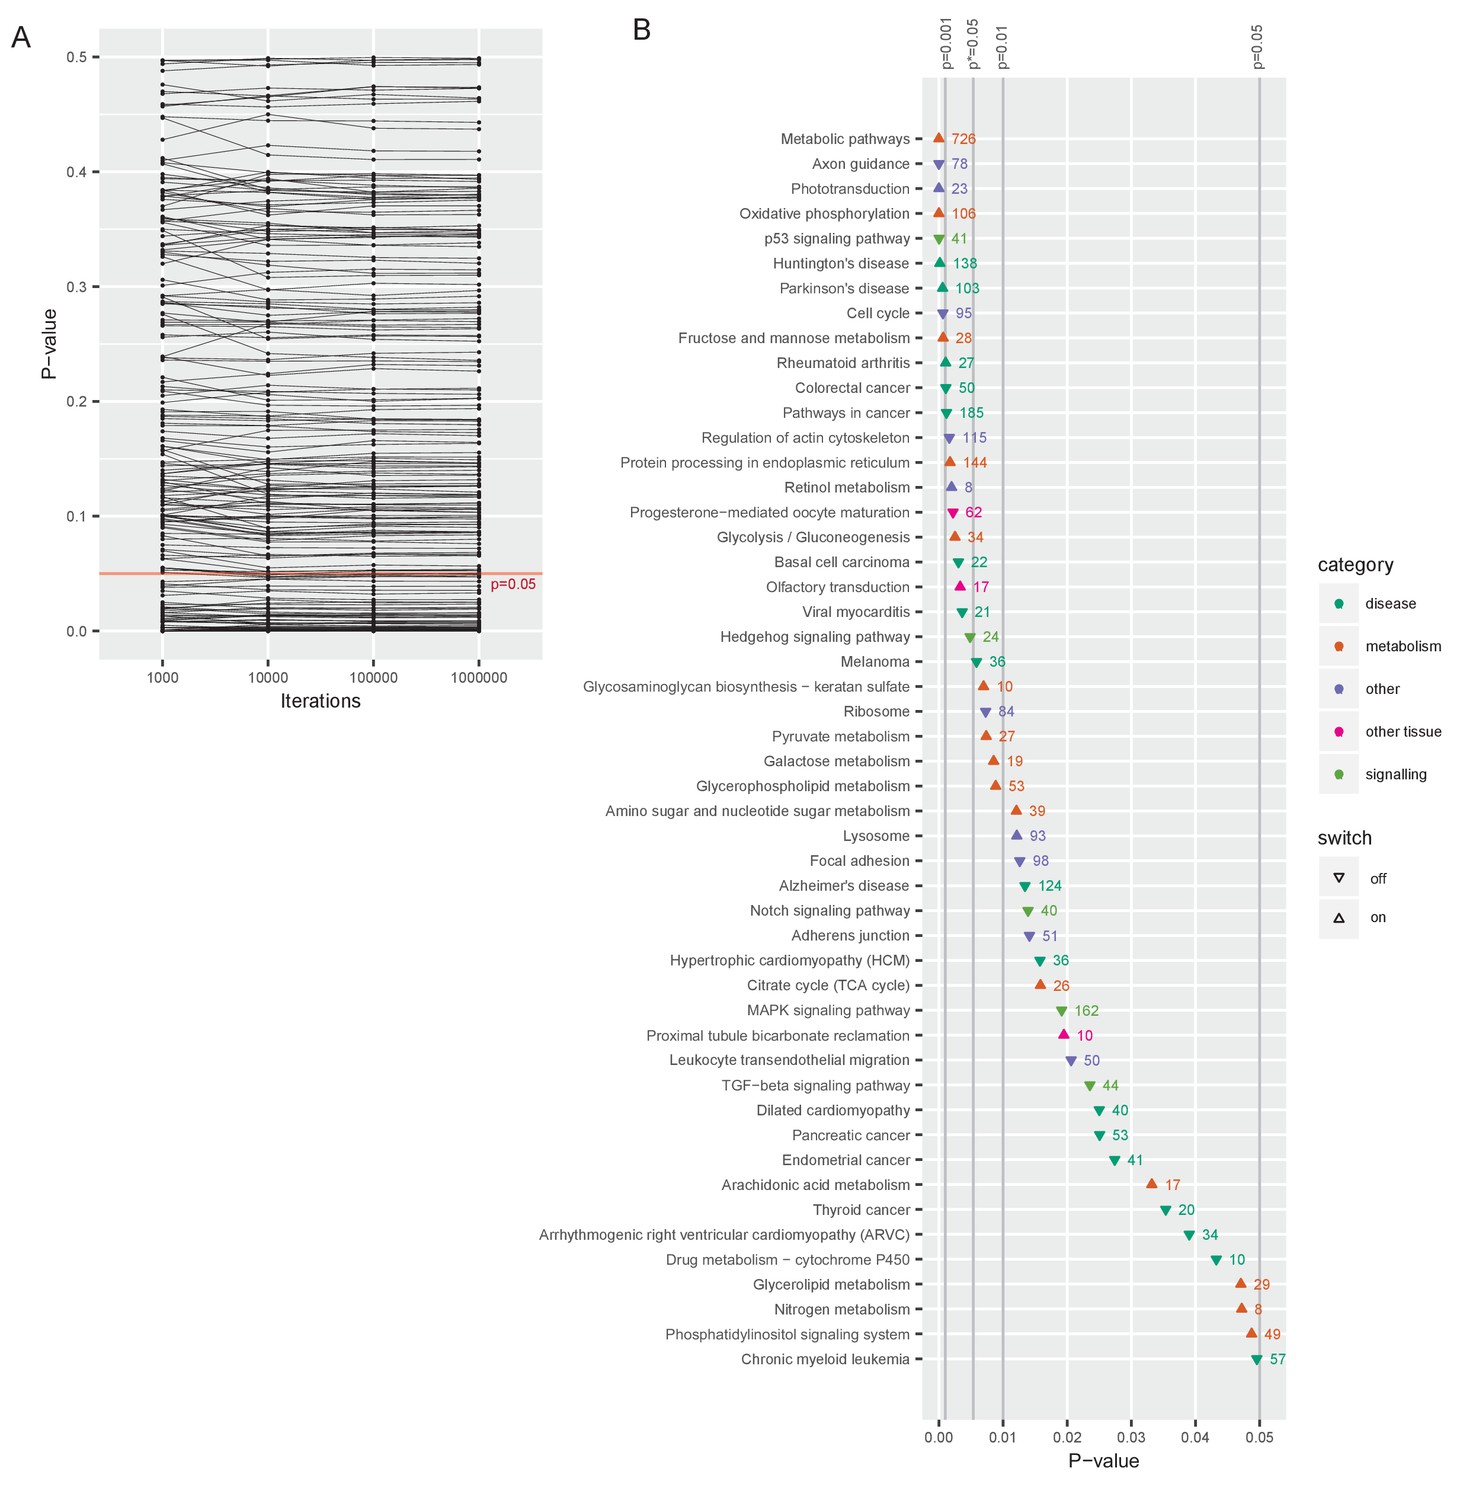
Gene classes and pathways involved in the switch.
(A) Changes in p-value as the number of random draws (iterations) in the permutation analyses increases. Each dot represents one pathway. (B) All significantly up- or downregulated pathways are ordered by p-value (at 1 million iterations), and color-coded by category, p* is the p-value adjusted by the Benjamini and Hochberg method (Benjamini and Hochberg, 1995).
Figure 4 with 1 supplement
Transcriptional regulation of the switch.
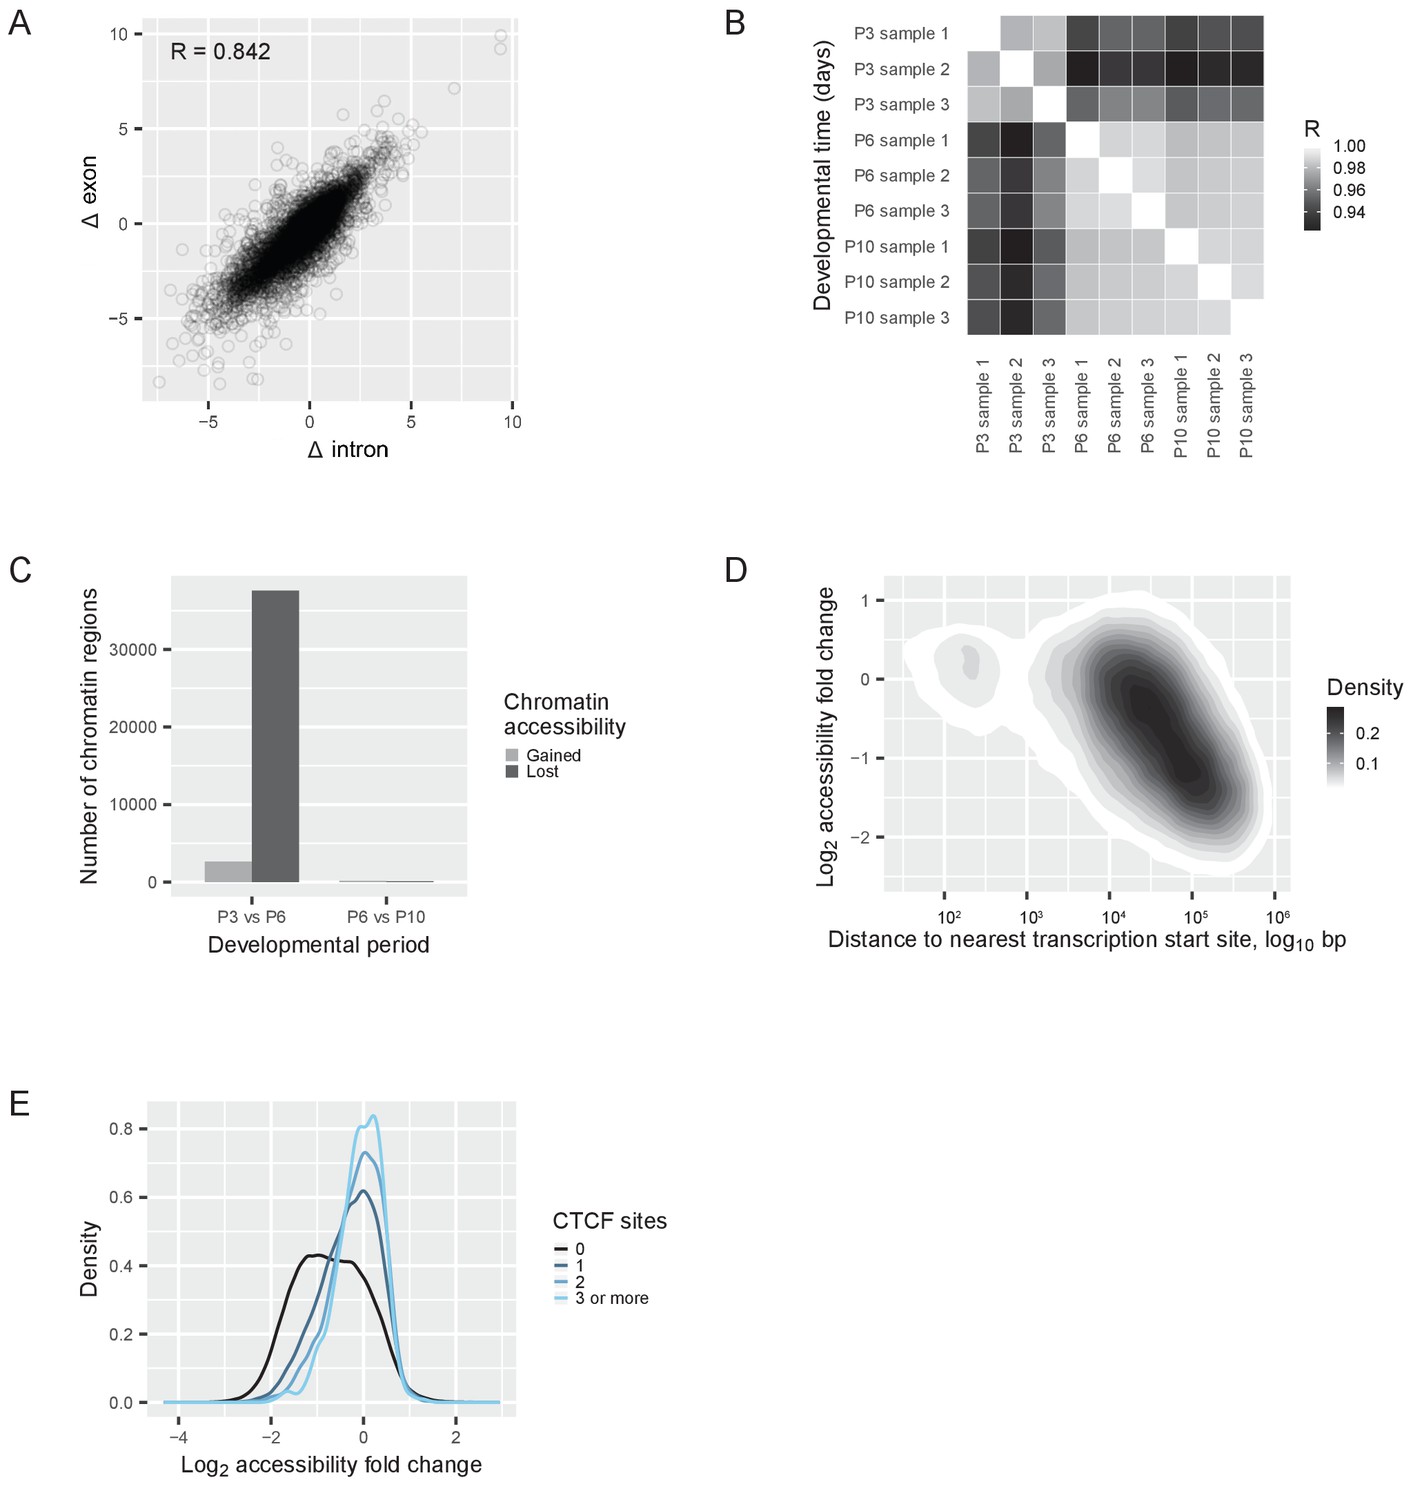
(A) RNAseq reads quantified with an exon-intron split analysis (Gaidatzis et al., 2015a) to differentiate transcriptional and post-transcriptional regulation of the switch. Correlation of log2 fold changes (Δ) in reads obtained from exons (from both pre-mRNA and mature mRNA) with reads obtained from introns (only from pre-mRNA). R = Pearson correlation coefficient. (B) ATACseq samples: Pearson correlations between the numbers of reads at each peak (a ‘peak’ is a region of accessible chromatin) across different developmental days. R = Pearson correlation coefficient. (C) Changes of chromatin accessibility before (P3 vs. P6) and after (P6 vs. P10) the switch. The number of chromatin regions gaining (gray) or losing (black) accessibility is shown. The threshold was an absolute log2 fold change of more than one and a false discovery rate less than 0.01. (D) Changes of chromatin accessibility in identified peaks between P3 and P6 depending on the distance to the nearest transcription start site. The density of regions of accessible chromatin as a function of distance and log2 fold change of accessibility is shown. Density is indicated according to the gray scale on the right. (E) Changes of chromatin accessibility between P3 and P6 depending on the presence of CTCF binding sites. The number of binding sites for the protein CTCF was predicted for each region of accessible chromatin, and the regions of accessible chromatin were separated into four groups: regions without CTCF binding sites (black); regions containing 1 binding site (dark blue); regions containing 2 binding sites (blue); and regions containing 3 or more binding sites (light blue). The density of regions of accessible chromatin was plotted as a function of the log2 fold changes of chromatin accessibility, for each group separately.
Figure 4—figure supplement 1
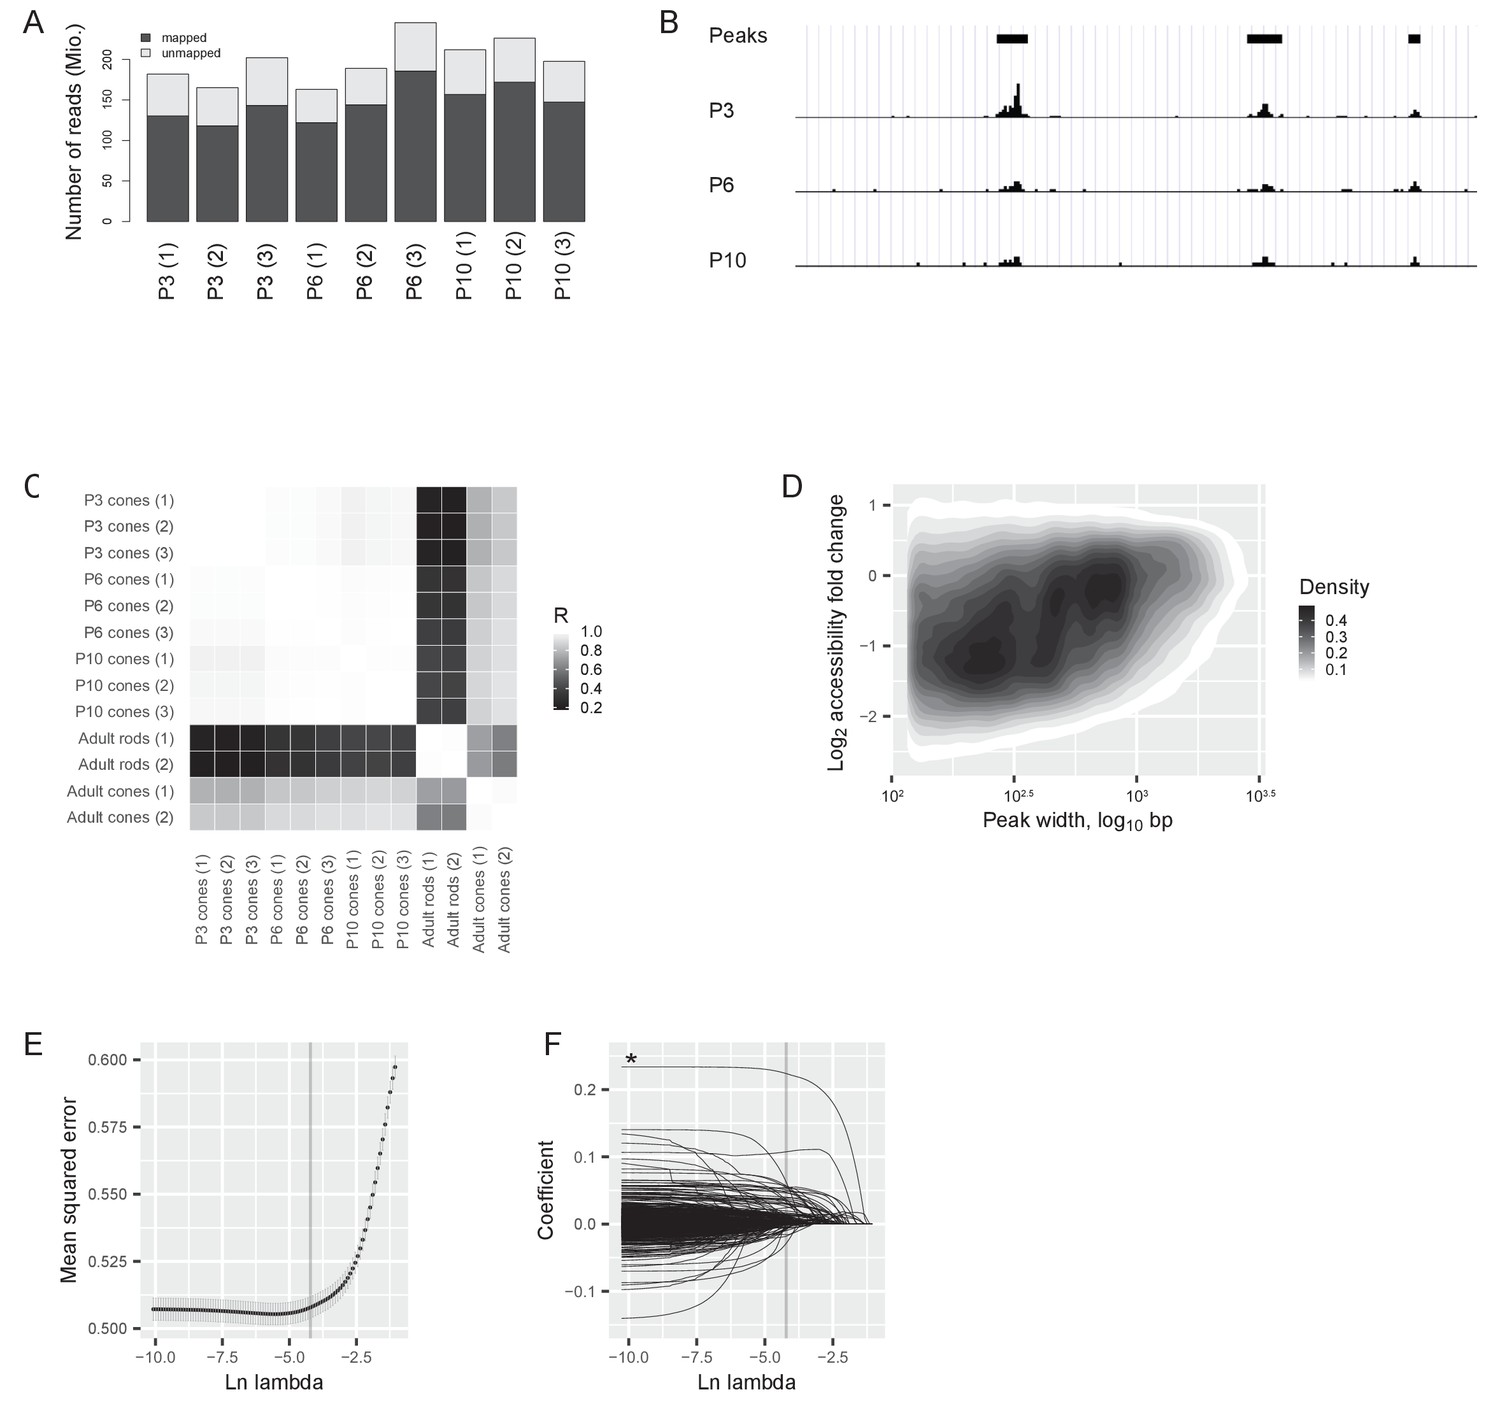
ATACseq quality control and modelling.
(A) Total number (in millions) of mapped and unmapped reads for each sample. (B) Example of reads at P3, P6, and P10 at a 27 kb intergenic region on chromosome 1. Identified peaks (using an algorithm from Zhang et al. [Zhang et al., 2008]) are marked with a black bar on the top. The first and second peak (from the left) lose accessibility before the switch (between P3 and P6) by 3- and 2-fold, respectively. They do not change significantly after the switch (between P6 and P10). The third peak’s accessibility changes neither before nor after the switch. (C) ATACseq samples: Pearson correlation between the log2-transformed numbers of reads at each region of accessible chromatin in developing cones compared to adult rods and cones. Data for adult rods and cones are taken from published ATACseq data (Mo et al., 2016), R = Pearson correlation coefficient. (D) Chromatin accessibility changes between P3 and P6 depending on the length of the region (in base pairs (bp), shown as the width of the peaks in panel B). The density of regions of accessible chromatin as a function of peak width and log2 fold change of accessibility is shown. (E) Selection of lambda for the elastic net model by 5-fold cross-validation of lambda values (Materials and methods). Mean cross-validated errors ± s.d. are shown. The grey line shows the highest lambda value at which the mean squared error was within one standard deviation of the minimal error. (F) Model coefficients for each predictor at different values of lambda. The grey line shows the chosen lambda value from (E). The asterisk marks the predictor with the highest coefficient (CTCF binding site).
Figure 5
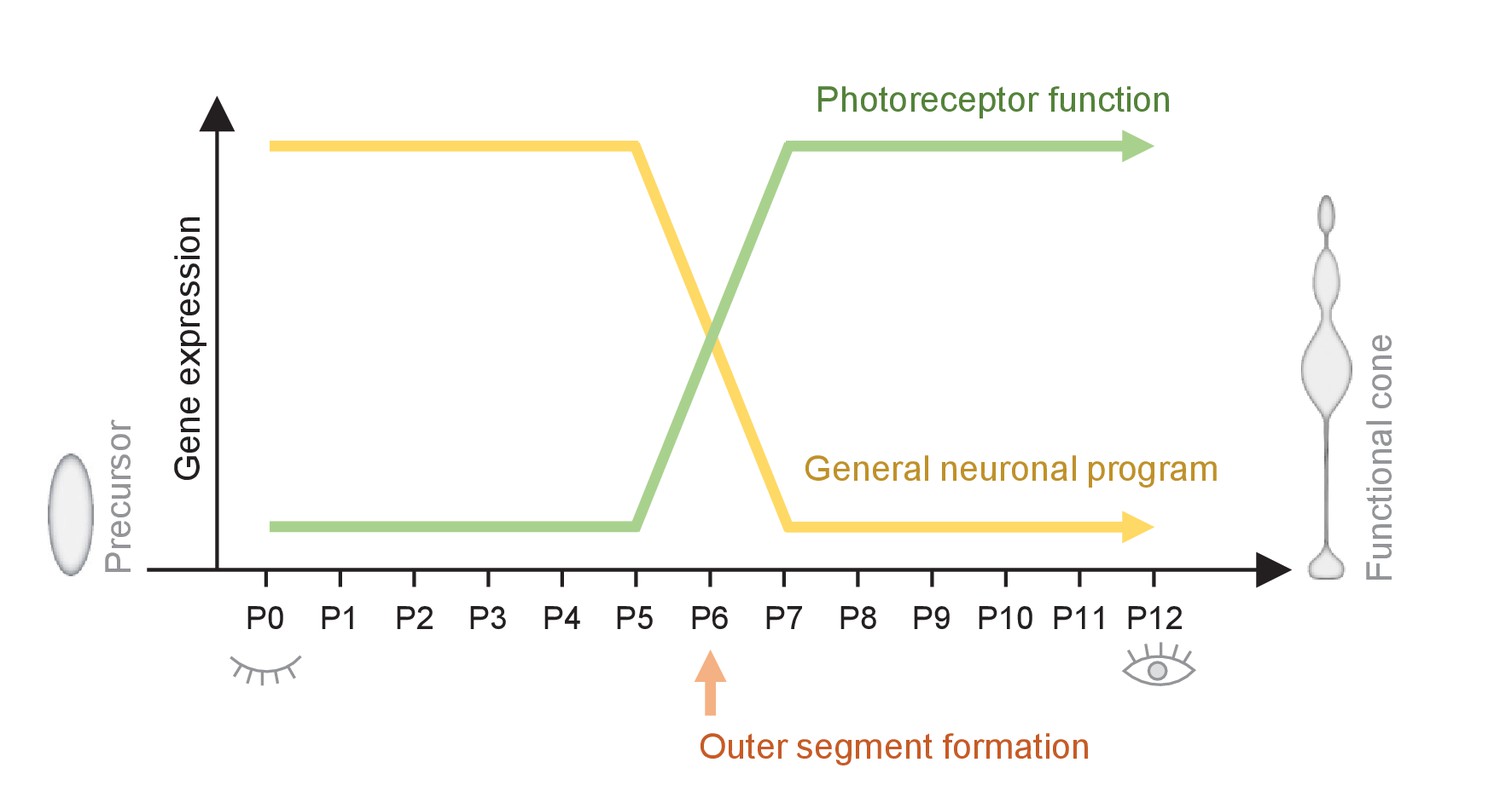
Summary of the switch that happens during maturation from a cone precursor to a functional cone.
Changes in cone morphology and gene expression are synchronized and locked to P6. At P6, outer segments form and pathways essential for establishing a functional cone switch on, while components of general neuronal development switch off.
Additional files
-
Supplementary file 1
(a) Gene expression switch of cone-specific genes.
List of genes defined as cone-specific (based on a cell type transcriptome study [Siegert et al., 2012]), ordered by fold change. (b) Transcription factors that switch off. List of transcription factors that switch off (log2 fold change >1), ordered by fold change. Only genes expressed above threshold (Materials and methods) are shown. (c) Mean percent change of switch pathways. Mean change in percent of all significantly up- or downregulated pathways. Pathways are ordered by p-value (at 1 million iterations).
- https://doi.org/10.7554/eLife.31437.013
-
Transparent reporting form
- https://doi.org/10.7554/eLife.31437.014
Download links
A two-part list of links to download the article, or parts of the article, in various formats.
Downloads (link to download the article as PDF)
Open citations (links to open the citations from this article in various online reference manager services)
Cite this article (links to download the citations from this article in formats compatible with various reference manager tools)
The formation of the light-sensing compartment of cone photoreceptors coincides with a transcriptional switch
eLife 6:e31437.
https://doi.org/10.7554/eLife.31437


