Coordination of robust single cell rhythms in the Arabidopsis circadian clock via spatial waves of gene expression
- University of Liverpool, United Kingdom
- University of Cambridge, United Kingdom
- Ritsumeikan University, Japan
- Hungarian Academy of Sciences, Hungary
- University of Szeged, Hungary
- Norwich Research Park, United Kingdom
- Microsoft Research, United Kingdom
Figures
Figure 1 with 6 supplements
Quantitative time-lapse microscopy reveals single cell clock dynamics across the plant.
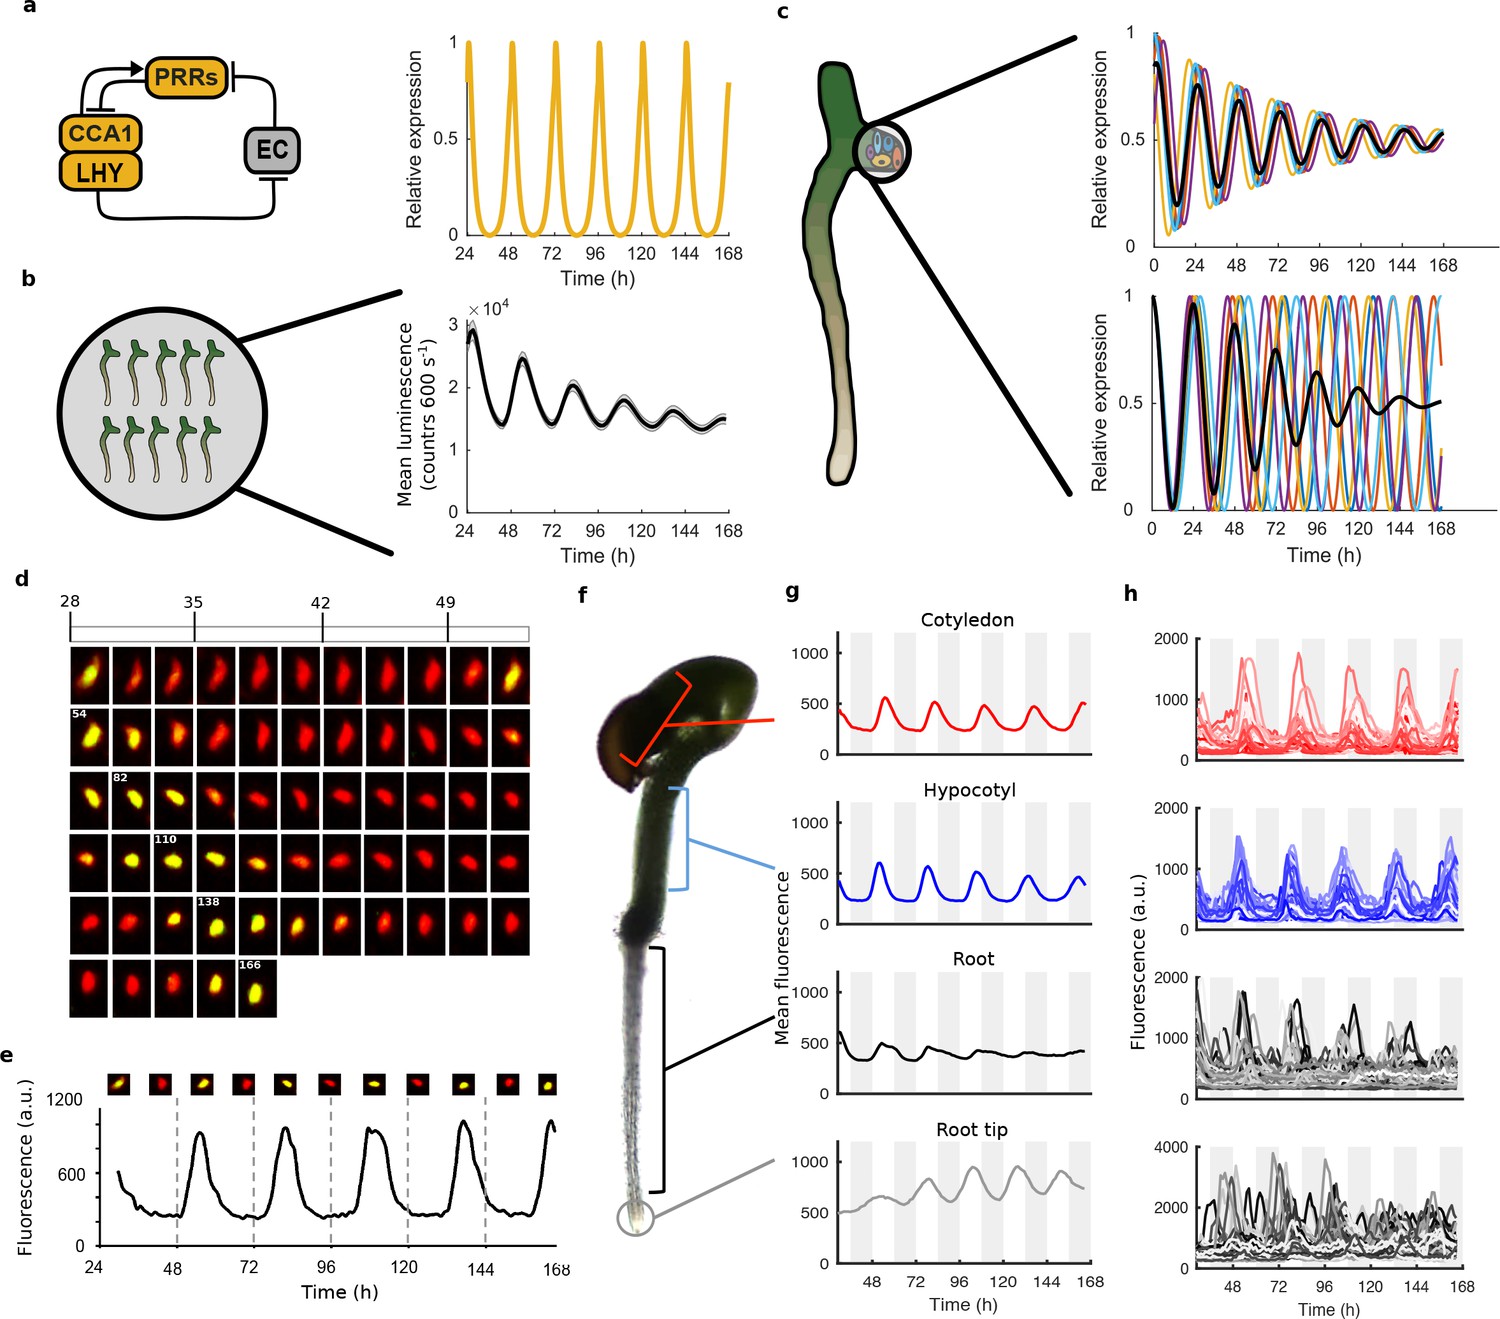
(a), Current models of the clock (Pokhilko et al., 2012) predict undamped oscillations. (b), CCA1:LUC expression bulk averaged over multiple seedlings shows damping clock oscillations (mean ± s.e.m.; n = 32 seedlings). (c), The reason for damping could be due to damping rhythms in individual cells (top) or due to desynchronisation between cells (bottom). (d), Images show a representative nuclei from the cotyledon of a cca1-11 CCA1::CCA1-YFP; 35S::H2B-RFP seedling that had been grown in LD cycles before being released into continuous light free running conditions for several days. The red channel represents when H2B fluoresce and the yellow CCA1. Times of peak expression are indicated on images. (e), Expression levels of CCA1-YFP from the representative nuclei shown in (d). Images of the nuclei are also shown for the peaks and troughs in the CCA1-YFP oscillation. (f), Representative seedling identifying the different sections imaged. (g), Mean traces of single cell CCA1-YFP for over 5 days of constant light in different regions of the plant showing damping rhythms in the root, but not the root tip. (h), CCA1-YFP traces from individual cell in each section for the same 5 days.
-
Figure 1—source data 1
The percentage of rhythmic cells for WT experiment.
Columns 2–4 identify rhythmic cells using three different methods described in BioDare. Column two uses FFT-NLLS (Fast Fourier Transform Non Linear Least Squares), with Goodness of Fit (GOF) parameter of 0.9. Column three uses Spectrum Resampling (SR) with GOF of 1 and Column four uses mFourFit with GOF of 1. See Materials and methods for details. Column five shows percentage of cell traces that were identified as rhythmic by all three methods and where periods from each method were within 2.5 hr of each other (as described in the Materials and methods). These data were taken forward for further analysis.
- https://doi.org/10.7554/eLife.31700.010
-
Figure 1—source data 2
The percentage of rhythmic cells for repeat WT experiment.
Columns 2–4 identify rhythmic cells using three different methods described in BioDare. Column two uses FFT-NLLS (Fast Fourier Transform Non Linear Least Squares), with Goodness of Fit (GOF) parameter of 0.9. Column three uses Spectrum Resampling (SR) with GOF of 1 and Column four uses mFourFit with GOF of 1. See Materials and methods for details. Column five shows percentage of cell traces that were identified as rhythmic by all three methods and where periods from each method were within 2.5 hr of each other (as described in the Materials and methods). These data were taken forward for further analysis.
- https://doi.org/10.7554/eLife.31700.011
Figure 1—figure supplement 1
The CCA1-YFP protein is functional and rescues the cca1-11 mutation.
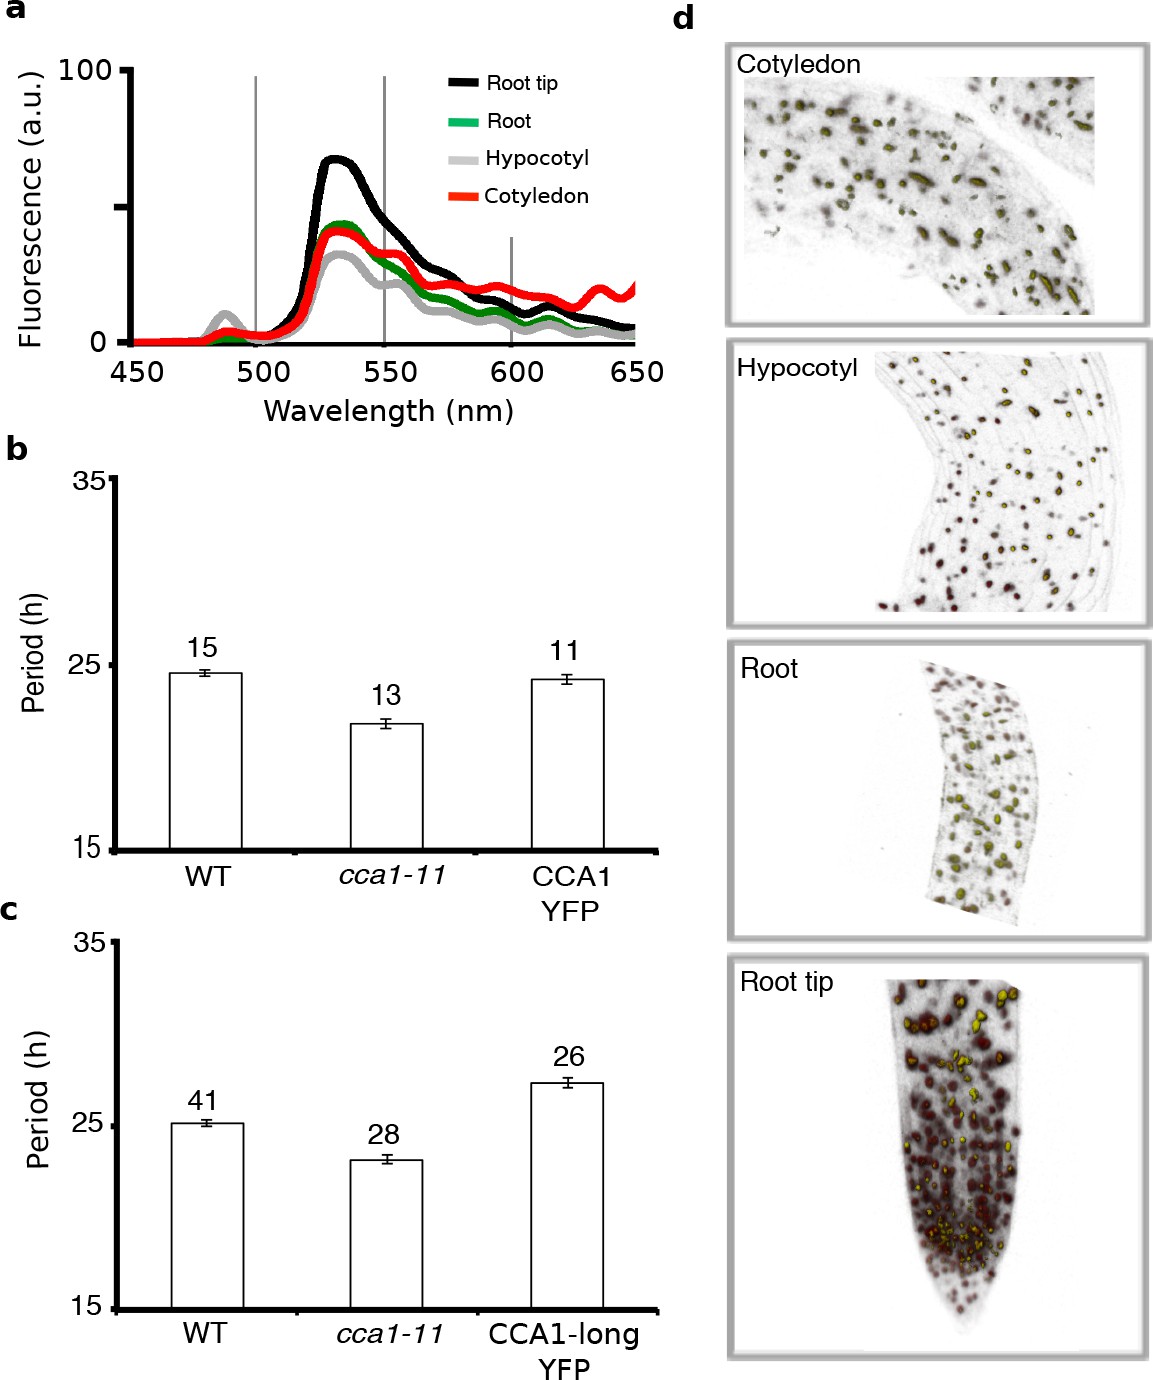
(a) The emission spectra from 450 to 650 nm for the CCA1-YFP in each tissue is consistent with the known YFP emission spectrum. The black line represents the root tip, green the root, grey the hypocotyl and red the cotyledon. (b, c), Transformation of the cca1-11 mutant with CCA1::CCA1-YFP construct has rescued the short period clock phenotype of cca1 in the WT CCA1-YFP construct (a), and produced a long period line in the CCA1-long CCA1-YFP construct (b) (mean ± s.e.m.; n represents groups of seedlings). Note the CCA1-long construct is still driven by the CCA1 promoter and likely results in a longer period oscillation than the native CCA1 because of the genomic context of the transgene. (d), Orthographic projection of a z stack of a cca1-11 CCA1::CCA1-YFP construct with intervals of 2 µm across 60 slices. CCA1-YFP is expressed in the nucleus of the root tip, root, hypocotyl and cotyledon.
Figure 1—figure supplement 2

Confocal imaging and processing pipeline.
Blank images at the end of a time-lapse run are removed in ImageJ (NIH). Data are then split into brightfield, RFP and YFP wavelengths and unwanted wavelengths are cropped to reduce dimensionality. Data size was reduced to create one channel per fluorophore. All channels were then loaded into Imaris (Bitplane) and merged before median smoothing and tracking individual cells across time. Mean intensity data for YFP, RFP are extracted, along with information on x, y and z. Quality control labels identify parts of the pipeline methodology where the data are quality control checked. See Materials and methods for details.
Figure 1—figure supplement 3
Mean and single cell oscillations of CCA1 nuclear localisation for repeat WT experiments.
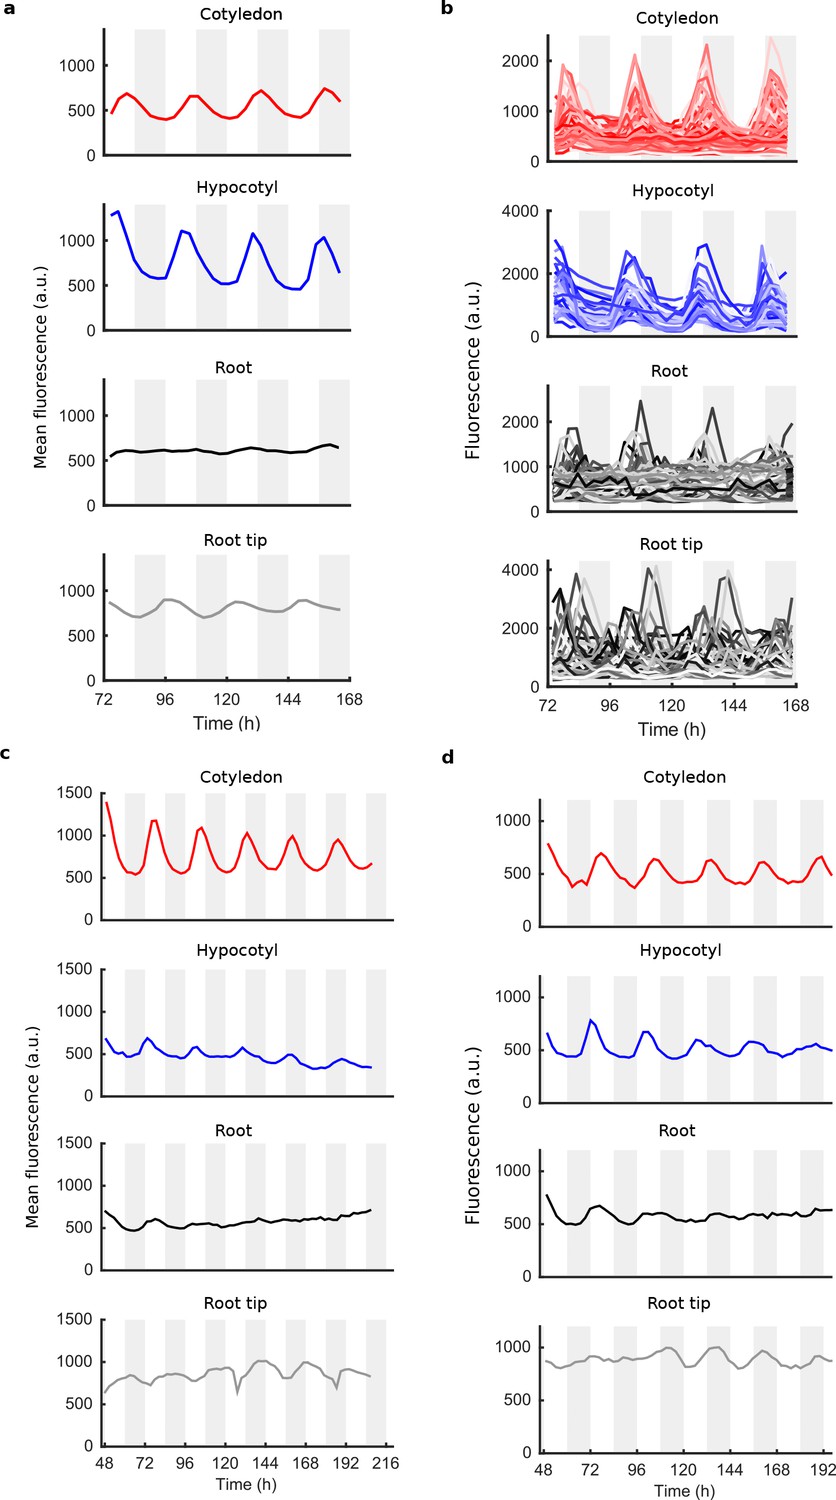
(a), Mean traces of single cell CCA1-YFP for WT repeat seedling; root tip (grey), root (black), hypocotyl (blue) and cotyledon (red). (b), All individual cell traces in each tissue type from (a). (c, d), Mean traces of single cell CCA1-YFP for two further WT repeat seedlings. Section colouring is as in (a).
Figure 1—figure supplement 4
Mean and single cell oscillations of CCA1 nuclear localisation for CCA1-long experiments.
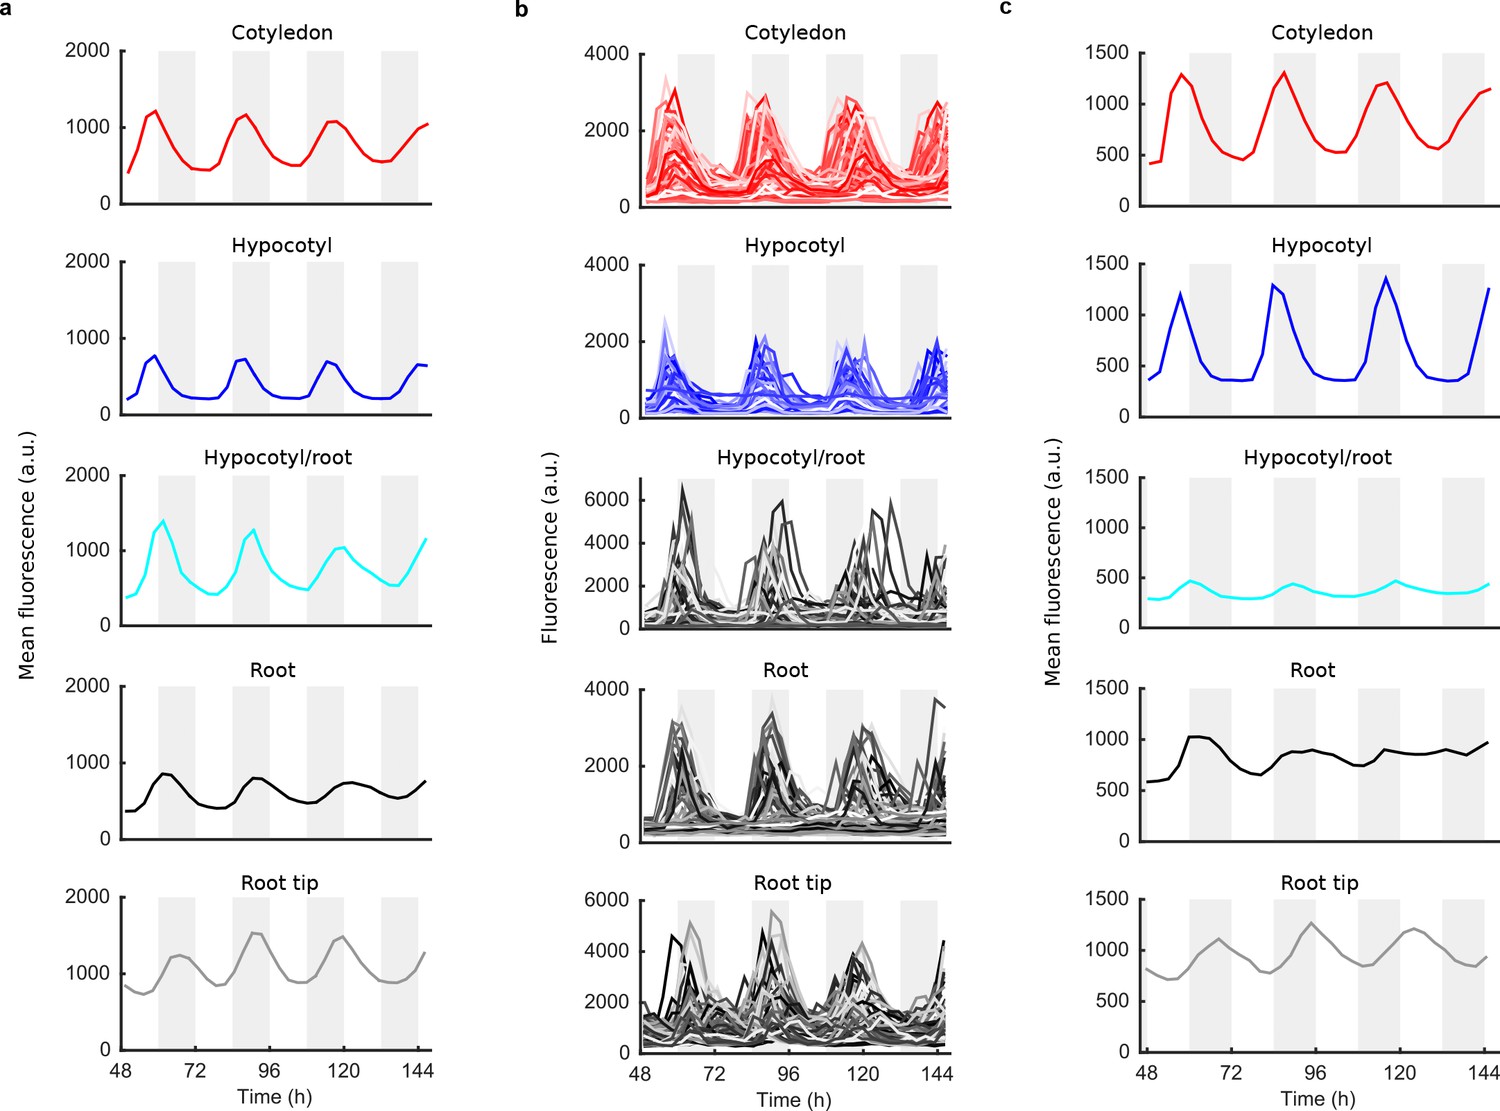
(a), Mean traces of single cell CCA1-YFP for CCA1-long seedling; root tip (grey), root (black), root/hypocotyl section (cyan), hypocotyl (blue) and cotyledon (red) (b), Individual cell traces in each tissue type from (a). Mean CCA1-YFP oscillations for a CCA1-long repeat seedling. Section colouring is as in (a).
Figure 1—figure supplement 5

Individual cell oscillations of CCA1-YFP reveal tissue specificity in robustness of oscillations.
50 cells from the root tip (top left), root (bottom left), hypocotyl (top right), and cotyledon (bottom right) were randomly selected and plotted. Individual traces are background subtracted and then mean normalised. Five cells are plotted on each axis. The most robust and synchronised oscillations were observed in the hypocotyl and the cotyledon, with more desynchronised oscillations in the root and root tip.
Figure 1—figure supplement 6
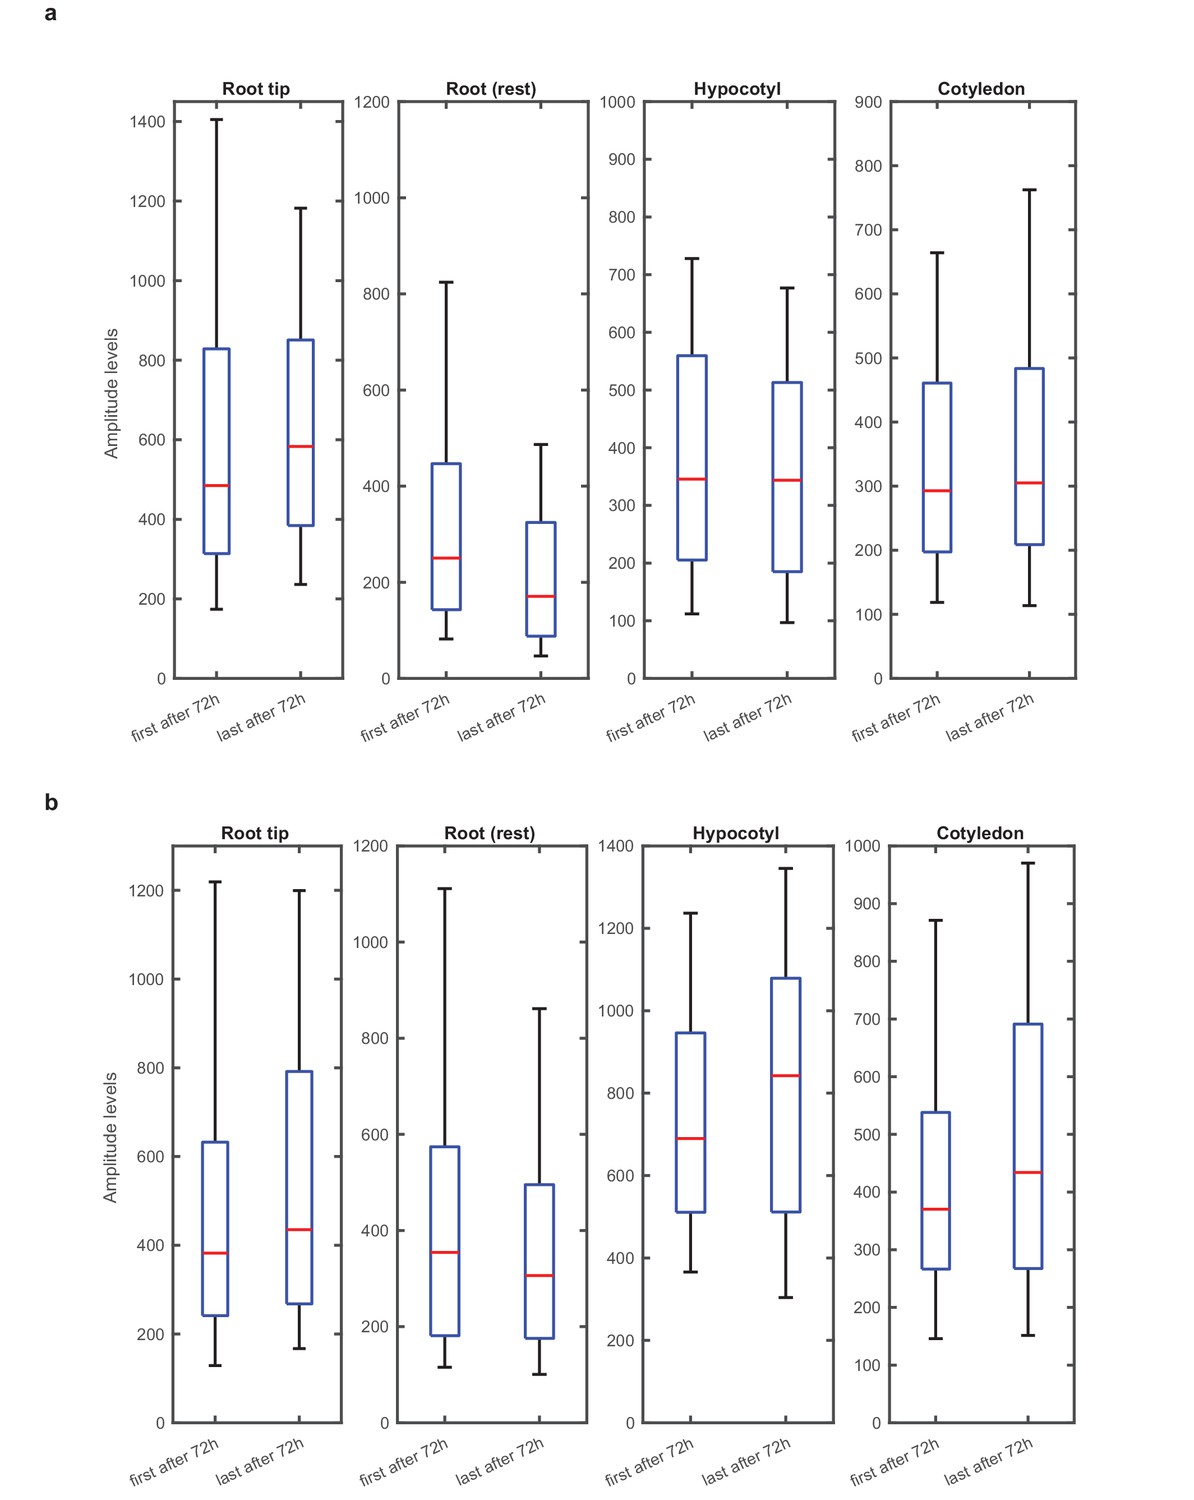
Single cell rhythms have stable amplitudes across the plant.
(a), Amplitude of single cell rhythms for first oscillation after 72 hr (in constant light) compared to amplitude of single cell oscillations for last oscillation before end of movie (165 hr), for root tip (n = 205), root (n = 115), hypocotyl (n = 164) and cotyledon (n = 100). (b), Amplitude of oscillations comparison for repeat WT experiment for root tip (n = 179), root (n = 124), hypocotyl (n = 52) and cotyledon (n = 94). Amplitude of single cell rhythms for first oscillation after 72 hr (in constant light) compared to amplitude of single cell oscillations for last oscillation before end of movie (167 hr). To enable estimation of amplitudes, only rhythmic cells that had at least three peaks detected during the movie were analysed. Also, if the number of peaks and troughs identified by the analysis differed by more than one, the cell was discarded from the analysis (n = number of analysed cells).
Figure 2 with 3 supplements
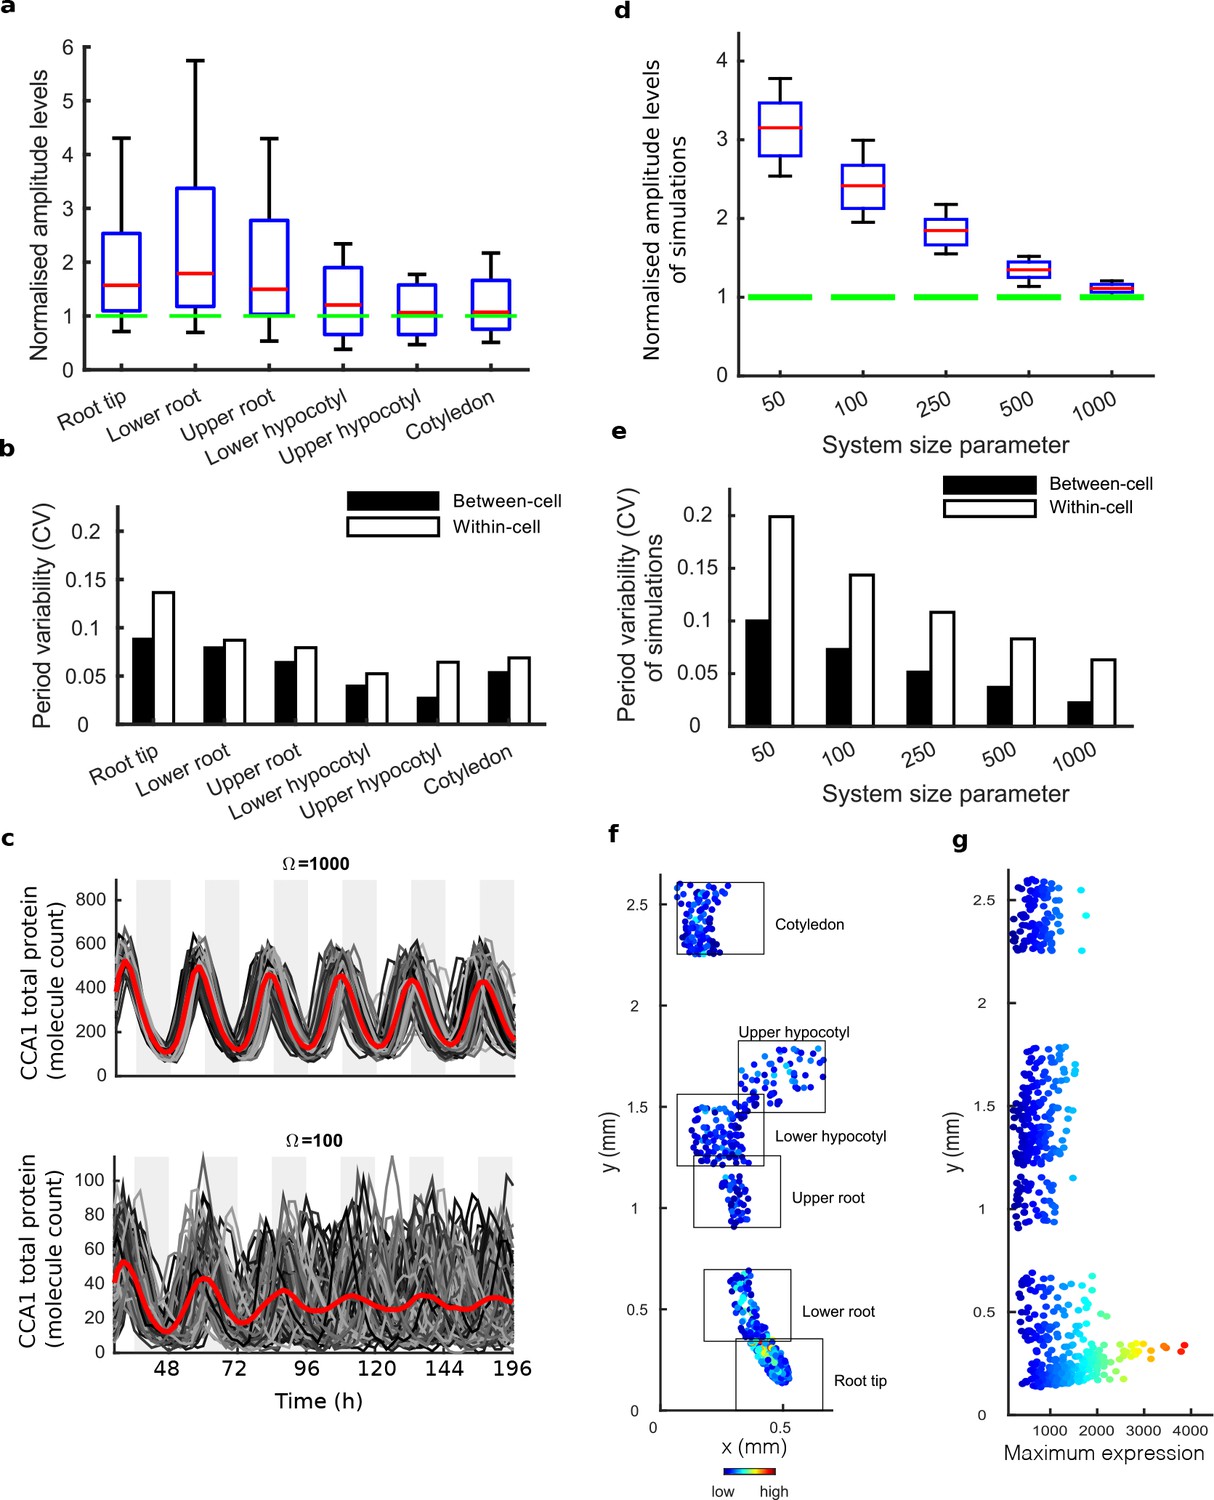
Single cell analysis reveals tissue level differences in robustness of the clock.
(a), Rhythmic cell amplitudes in the imaged sections normalised to the amplitude of the mean trace (green line). Whiskers represent 9th and 91st percentile. (b), Between-cell and within-cell period variability in each imaged section. (c), Stochastic model CCA1 total molecule count for Ω = 1000 (top) and Ω = 100 (bottom) for 100 simulated runs (grey) plotted from 29 to 168 hr in constant light (comparable to the data in Figure 1). Means of all simulated runs are shown in red. Ω represents the system size. (d), Rhythmic simulated run amplitudes for different system sizes (Ω) normalised to the mean simulation (green line). (e), Between and within cell variability of each simulation with different system size. (f), Scatterplot of the rhythmic cells in all imaged plant sections stitched together. Colour indicates the maximum expression. (g), Scatterplot of the maximum expression values vs. longitudinal position on the plant measured from the root tip. Colour legend is the same as (f). For root tip, n = 242; lower root, n = 84; upper root, n = 46; lower hypocotyl, n = 114; upper hypocotyl, n = 53; cotyledon, n = 103 (n = number of rhythmic cells).
Figure 2—figure supplement 1
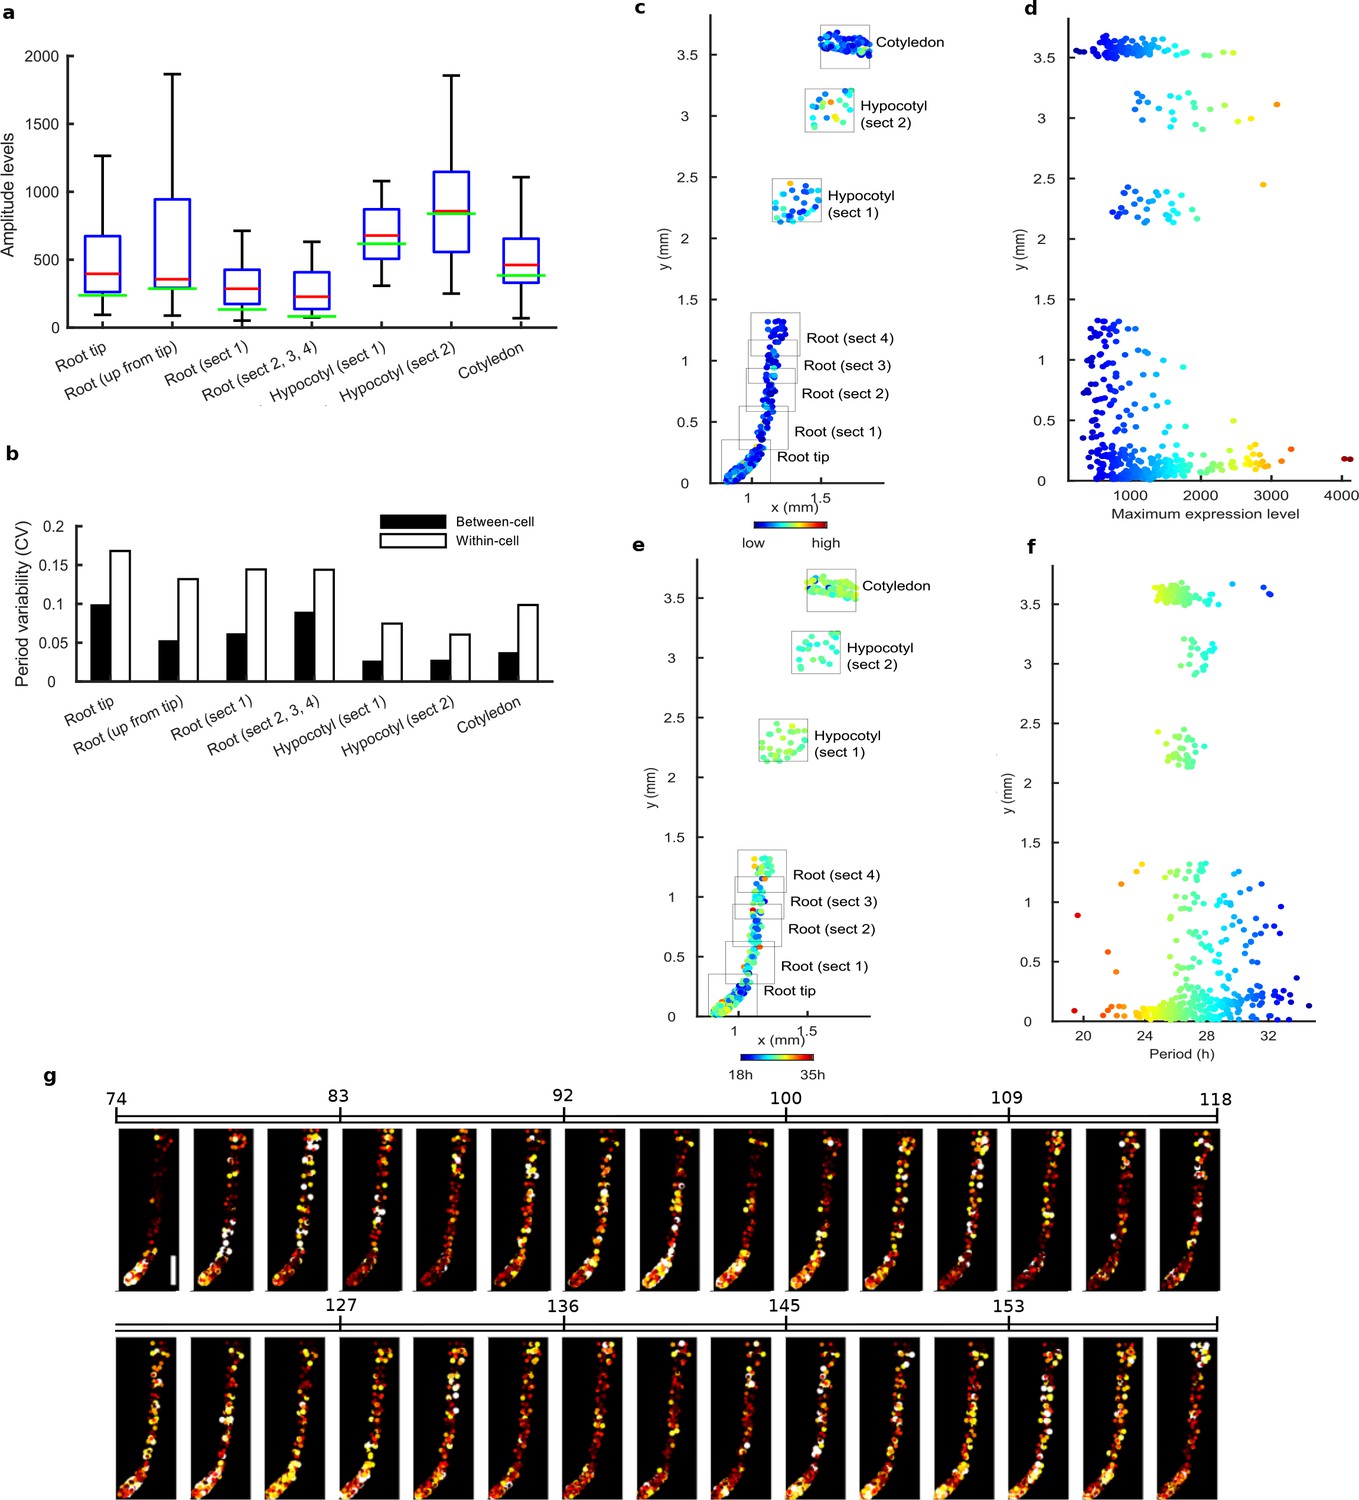
Tissue level differences in robustness synchronisation, and period of single cell clock oscillations in repeat WT experiment.
(a), Rhythmic cell amplitudes per section imaged with amplitude of the mean trace overlaid (green line). Whiskers represent 9th and 91st percentile. (b), Between-cell and within-cell period variability in each section. (c), Scatterplot of the rhythmic cells in all imaged plant sections stitched together. Colour indicates the maximum expression value. (d), Scatterplot of the maximum expression values vs. longitudinal position on the plant measured from the root tip. Colour legend is same as (c). (e), Scatterplot of the rhythmic cells in stitched plant sections. Colour indicates the oscillation period. (f), Scatterplot of the period values vs. longitudinal position on the plant measured from the root tip. Colour legend is same as in (e). (g), Sequential montage of the normalised CCA1-YFP expression of rhythmic cells from WT CCA1-YFP repeat. Both colour intensity and spot size indicate expression level. By colour, red indicates low and yellow high intensity. Scale bar represents 0.25 mm. For root tip, n = 200 root (up from tip), n = 46 root (section 1), n = 25 root (sections 2,3,4), n = 70 hypocotyl (section 1), n = 31, hypocotyl (section 2), n = 22; cotyledon, n = 100), n = the number of rhythmic cells.
Figure 2—figure supplement 2
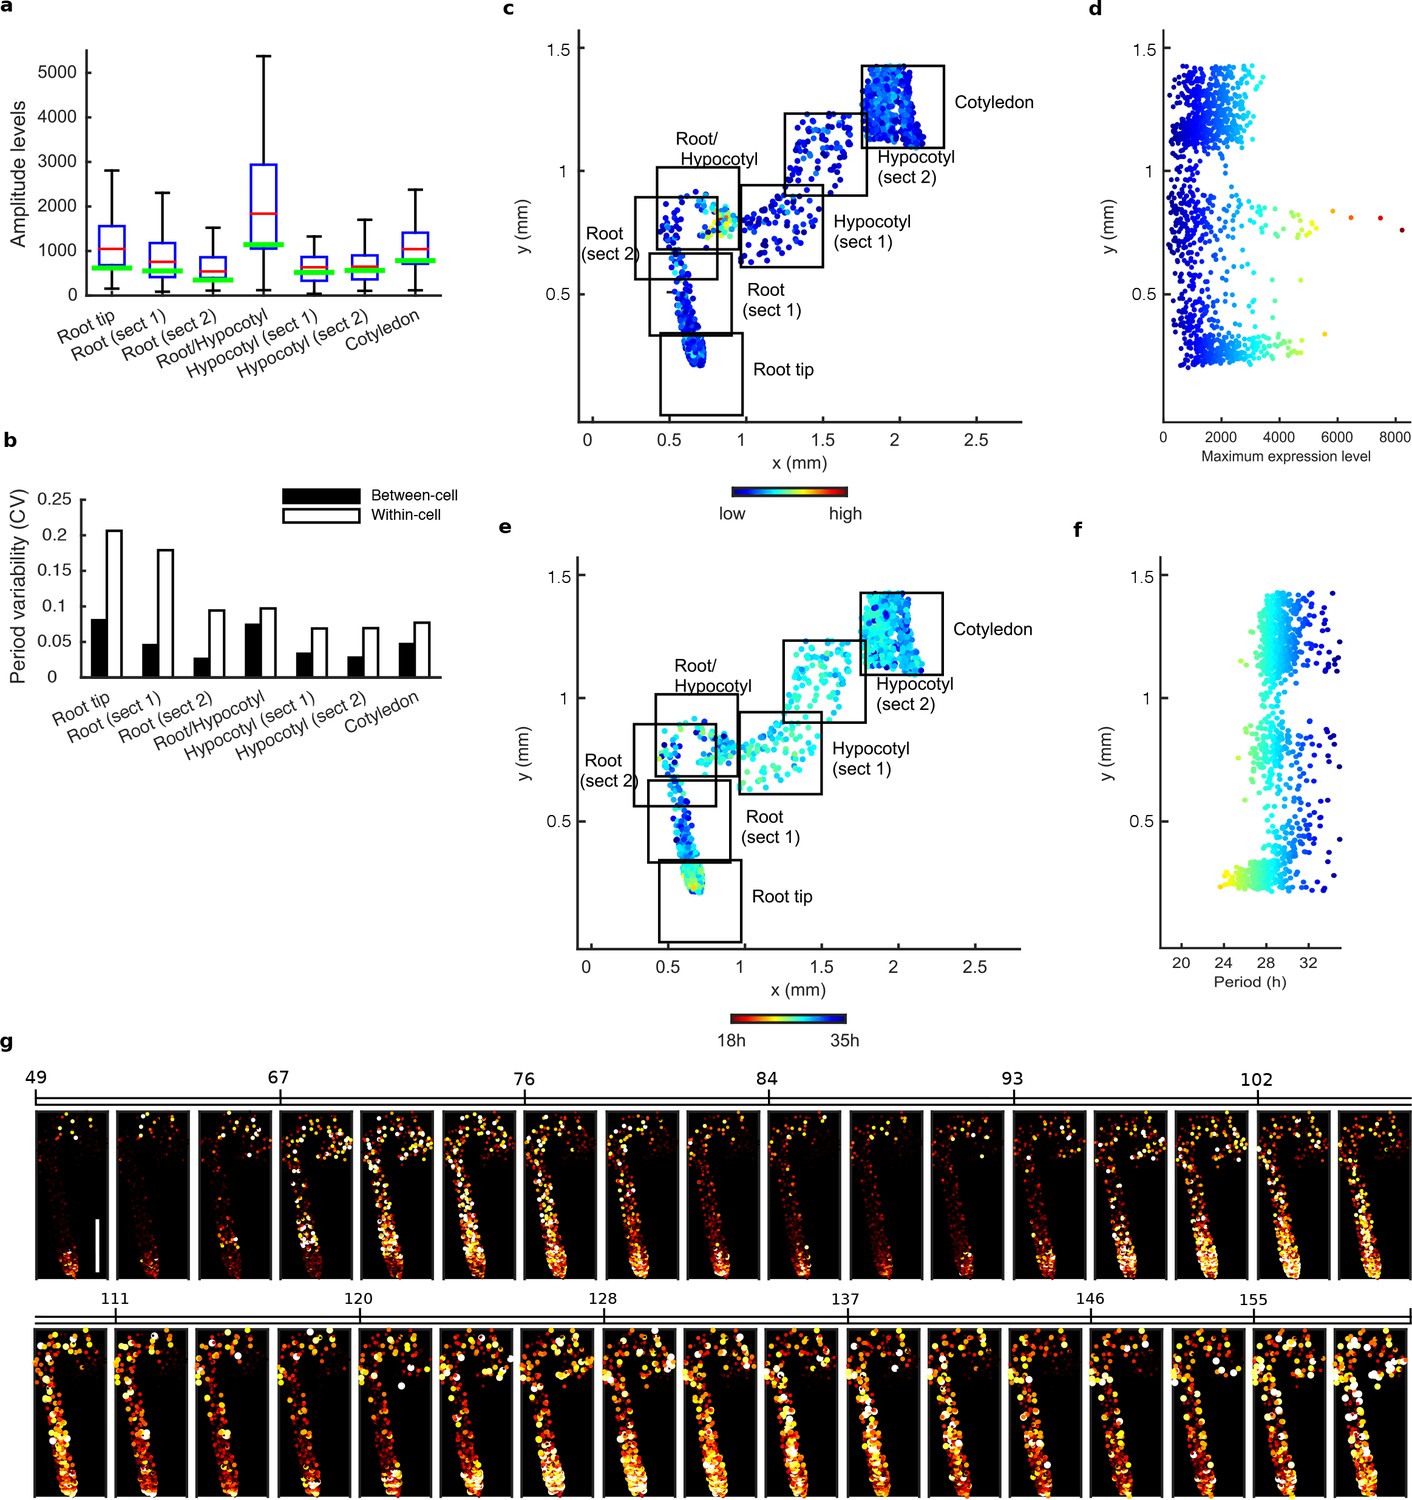
Tissue level differences in robustness, synchronisation, and period of single cell clock oscillations in CCA1-long experiment.
(a), Rhythmic cell amplitudes per section imaged with amplitude of the mean trace per section overlaid (green line). Whiskers represent 9th and 91st percentile. (b), Between-cell and within-cell period variability in each section. (c), Scatterplot of the rhythmic cells in all imaged plant sections stitched together. Colour indicates the maximum expression level per cell. (d), Scatterplot of the maximum expression values vs. longitudinal position on the plant measured from the root tip. Colour legend is same as (c). (e), Scatterplot of the rhythmic cells in all imaged plant sections stitched together. Colour indicates the oscillation period. (f), Scatterplot of the period values vs. longitudinal position on the plant measured from the root tip. Colour legend is same as in (e). (g), Sequential montage of the normalised CCA1-YFP expression of rhythmic cells from CCA1-long line. Both colour intensity and spot size indicate expression level. By colour, red indicates low and yellow high intensity. Scale bar represents 0.25 mm. For root tip, n = 223; root (section 1), n = 111; root (section 2), n = 36; root/hypocotyl, n = 58; hypocotyl (section 1), n = 79; hypocotyl (section 2), n = 88; cotyledon, n = 434), n = the number of rhythmic cells.
Figure 2—figure supplement 3
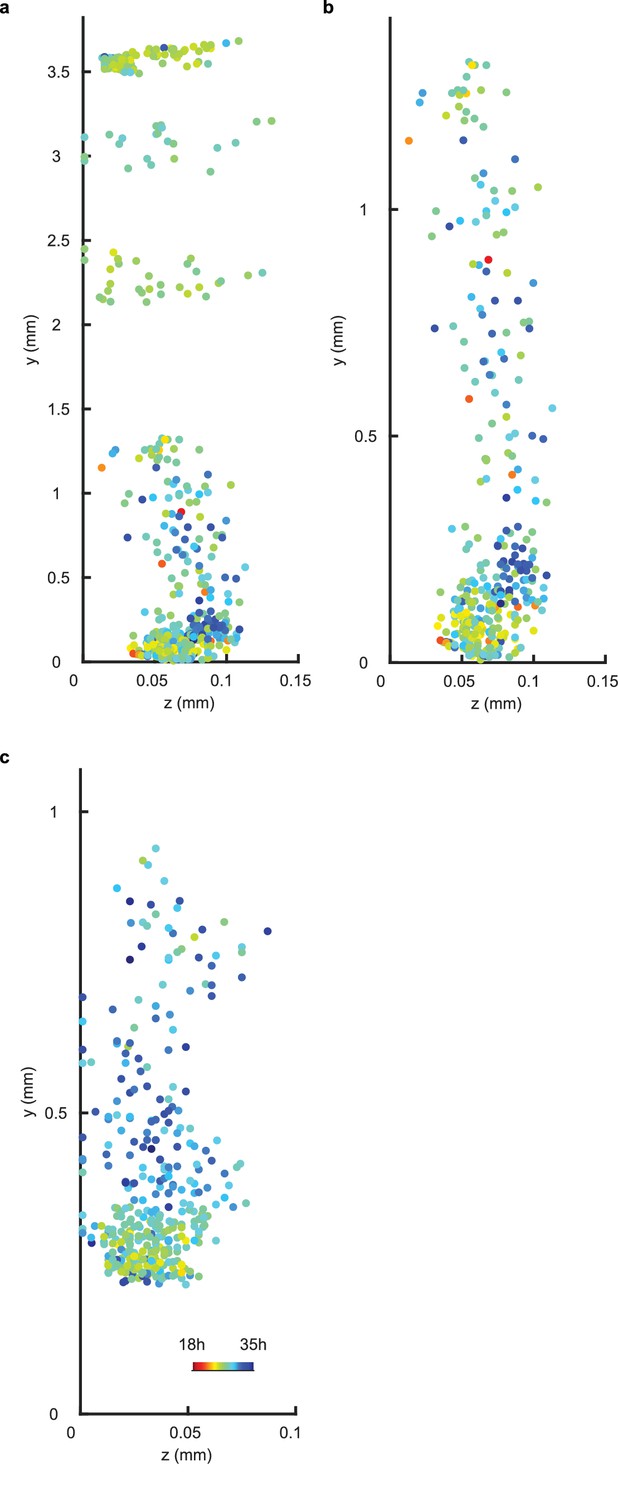
Periods display no spatial structure in z direction for WT repeat and CCA1-long experiments.
(a–b), Scatterplot in the y-z direction of rhythmic cells for repeat WT experiment in all imaged plant sections (a) or in the root and root tip sections only (b). (c), Scatterplot in the y-z direction of rhythmic cells in the root and root tip sections only for CCA1-long experiment. Whole plant data were not plotted for CCA1-long experiment due to overlap of plant sections in the y-direction. Colour indicates the oscillation period.
Figure 3 with 4 supplements
Single cell period differences and cell-to-cell coupling generate spatial waves of clock gene expression.
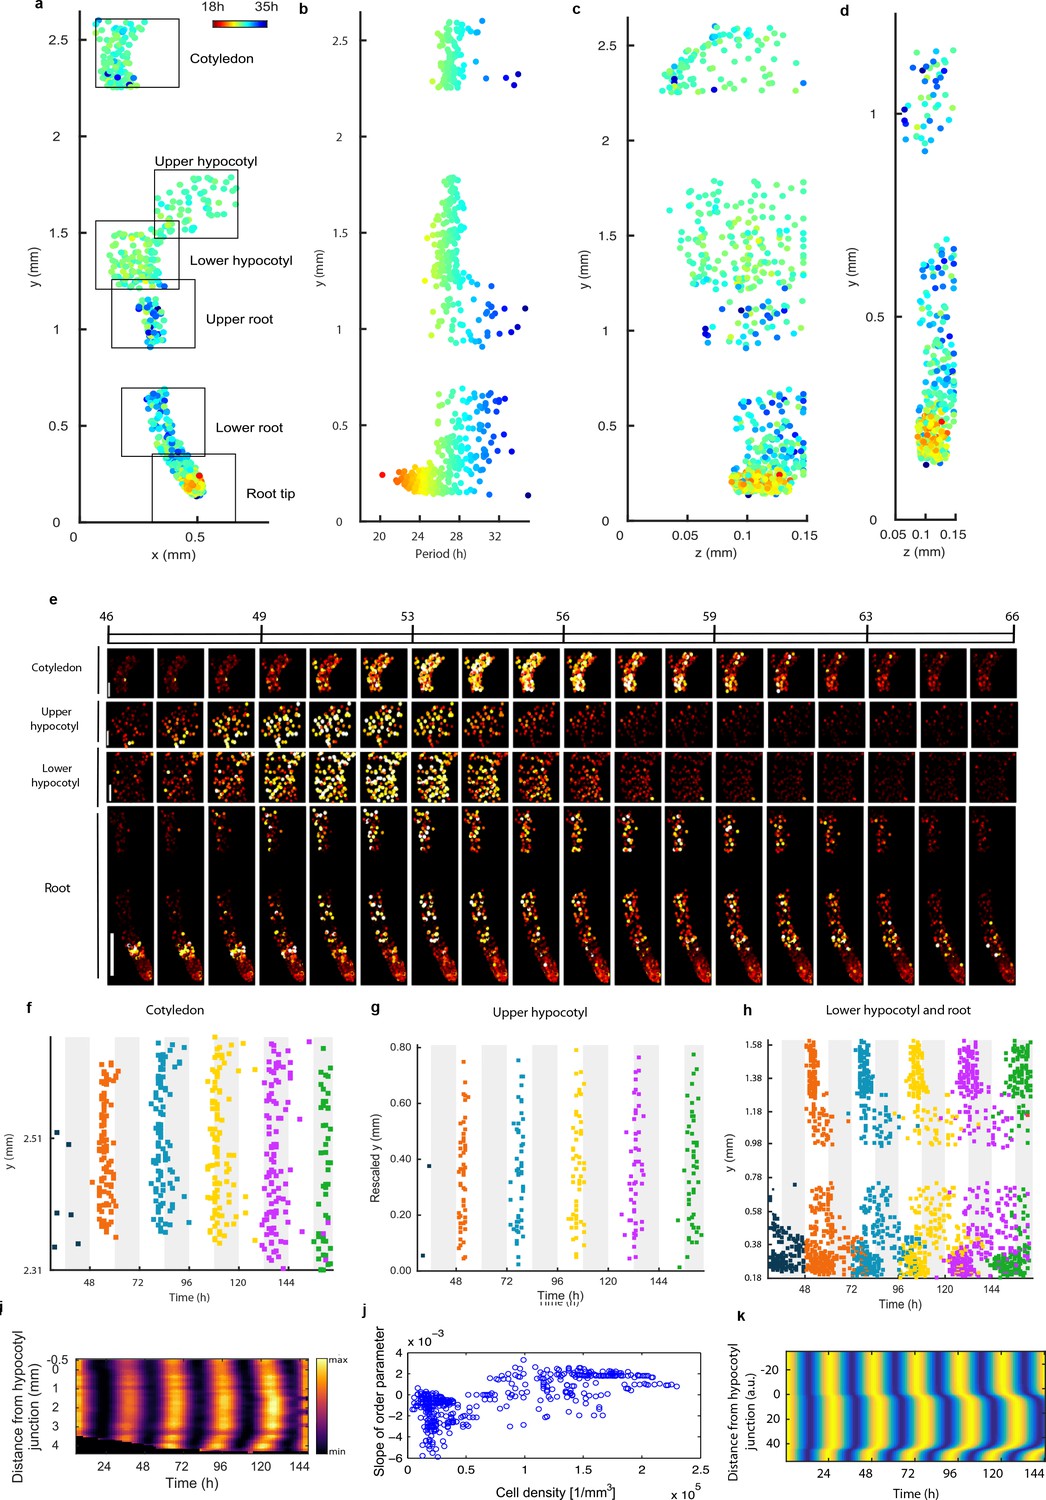
(a), Scatterplot of the rhythmic cells in all imaged plant sections stitched together in x-y direction. Colour indicates the oscillation period. (b), Period values vs. longitudinal position on the plant measured from the root tip. Colour legend is the same as (a). (c), (d), Scatterplot in the y-z direction of rhythmic cells in all imaged plant sections (c) or in the root and root tip sections only (d). Colour legend is the same as (a). (e), Montage of the normalised CCA1-YFP expression of rhythmic cells from the root (bottom panel, first image taken after 46.1 hr in LL), lower hypocotyl (taken after 46.6 hr in LL), upper hypocotyl (taken after 46.7 hr) and cotyledon (top panel, taken after 46.9 hr in LL). Each frame is approximately 1.1 hr apart. Scale bar represents 0.25 mm for root panel and 0.1 mm for other panels. Both colour intensity and spot size indicate expression level. By colour, red indicates low and yellow high intensity. (f–h), Space-time plots of peak times of rhythmic cells across sections: cotyledon (f) upper hypocotyl (g), lower hypocotyl and root (all sections) (h). (i), Representative space-time plot of normalised PRR9:LUC expression across longitudinal sections of a seedling (N = 2, n = 7). N represents the number of independent experiments, n the total number of individual seedlings. Seedlings were imaged under constant red and blue light (Methods). (j), Slopes of the order parameter are plotted against cell densities. A positive slope indicates that the level of synchrony increases in time due to cell-cell interactions. (k), Space-time plot of simulated total normalised CCA1 expression across longitudinal sections of the seedling.
Figure 3—figure supplement 1
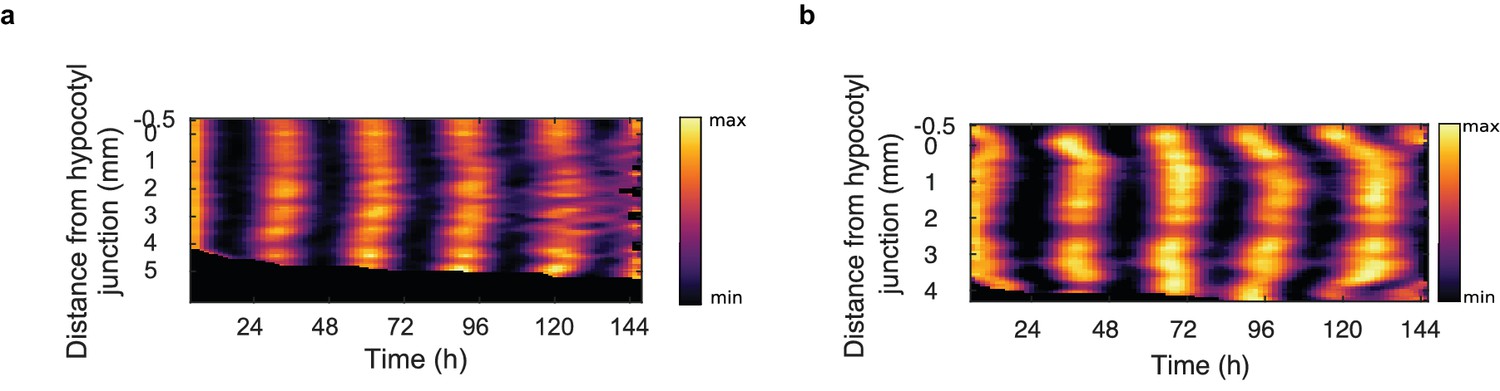
Spatial waves of clock gene expression are seen in clock luciferase reporter lines.
(a), Representative space-time plot of normalised CCA1:LUC (N = 2, n = 10) expression across longitudinal sections of the root. Seedlings were imaged under constant red and blue light. (b), Representative space-time plot of normalised GI:LUC (N = 2, n = 25) expression across longitudinal sections of the root. Seedlings were imaged under constant blue light. N represents the number of independent experiments, n the total number of individual seedlings.
Figure 3—figure supplement 2
Synchronisation analysis based on the order parameter.
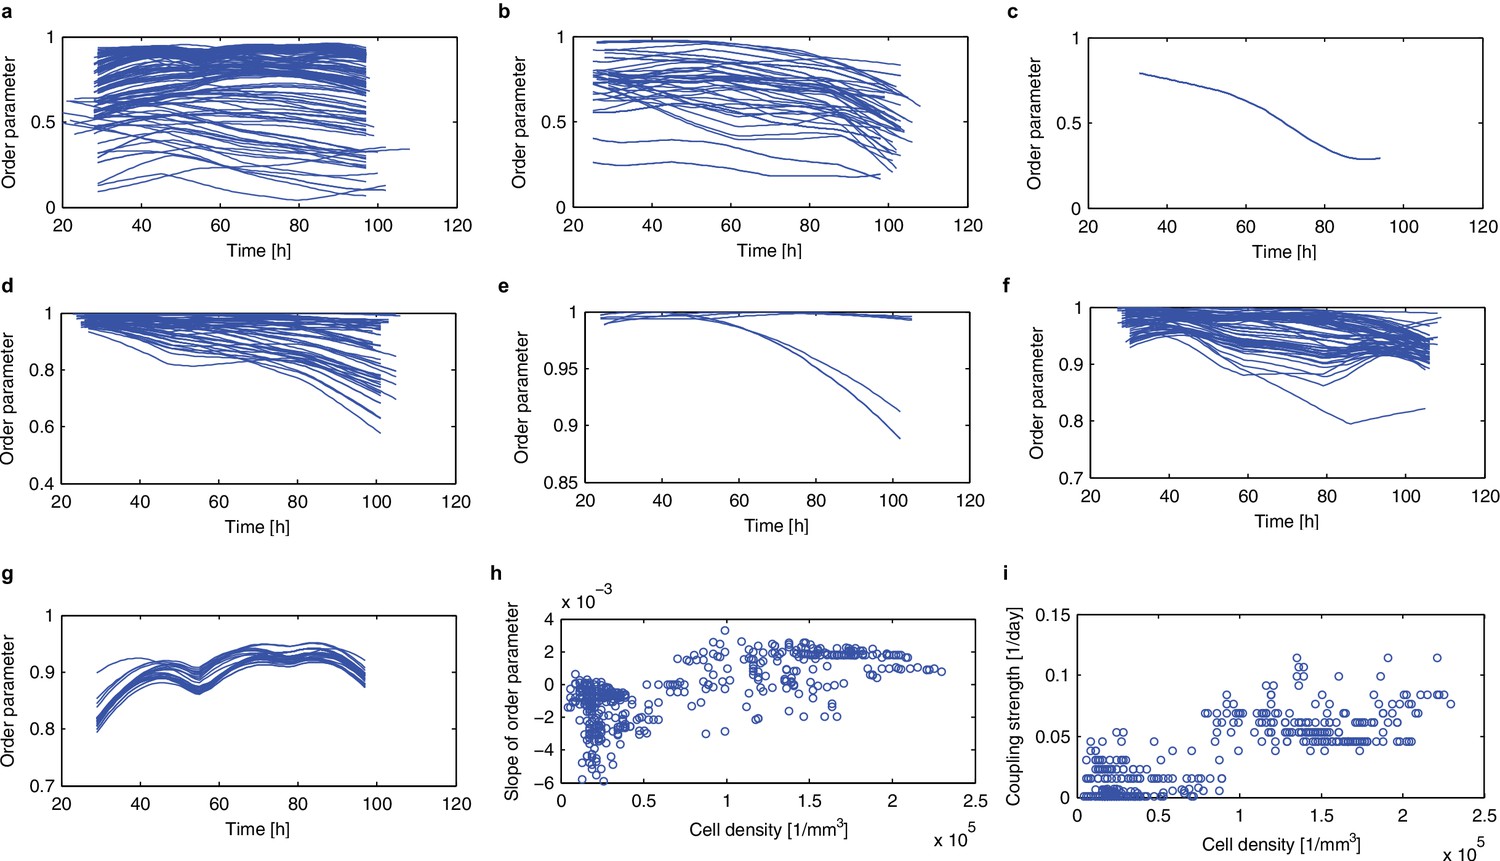
(a–g), Time evolution of the order parameter R (Kuramoto, 1984) is plotted for the root tip (a), lower root (b), upper root (c), lower hypocotyl (d), upper hypocotyl (e), cotyledon (f). (g), Order parameters in area of high cellular density (ρ >1.5*105 [1/mm]) were extracted from the root tip. (h), Dependence of the slope of the order parameter against time on the cell density (re-plotted from Figure 3j). (i), Estimated strength of the coupling is plotted against cell density.
Figure 3—figure supplement 3
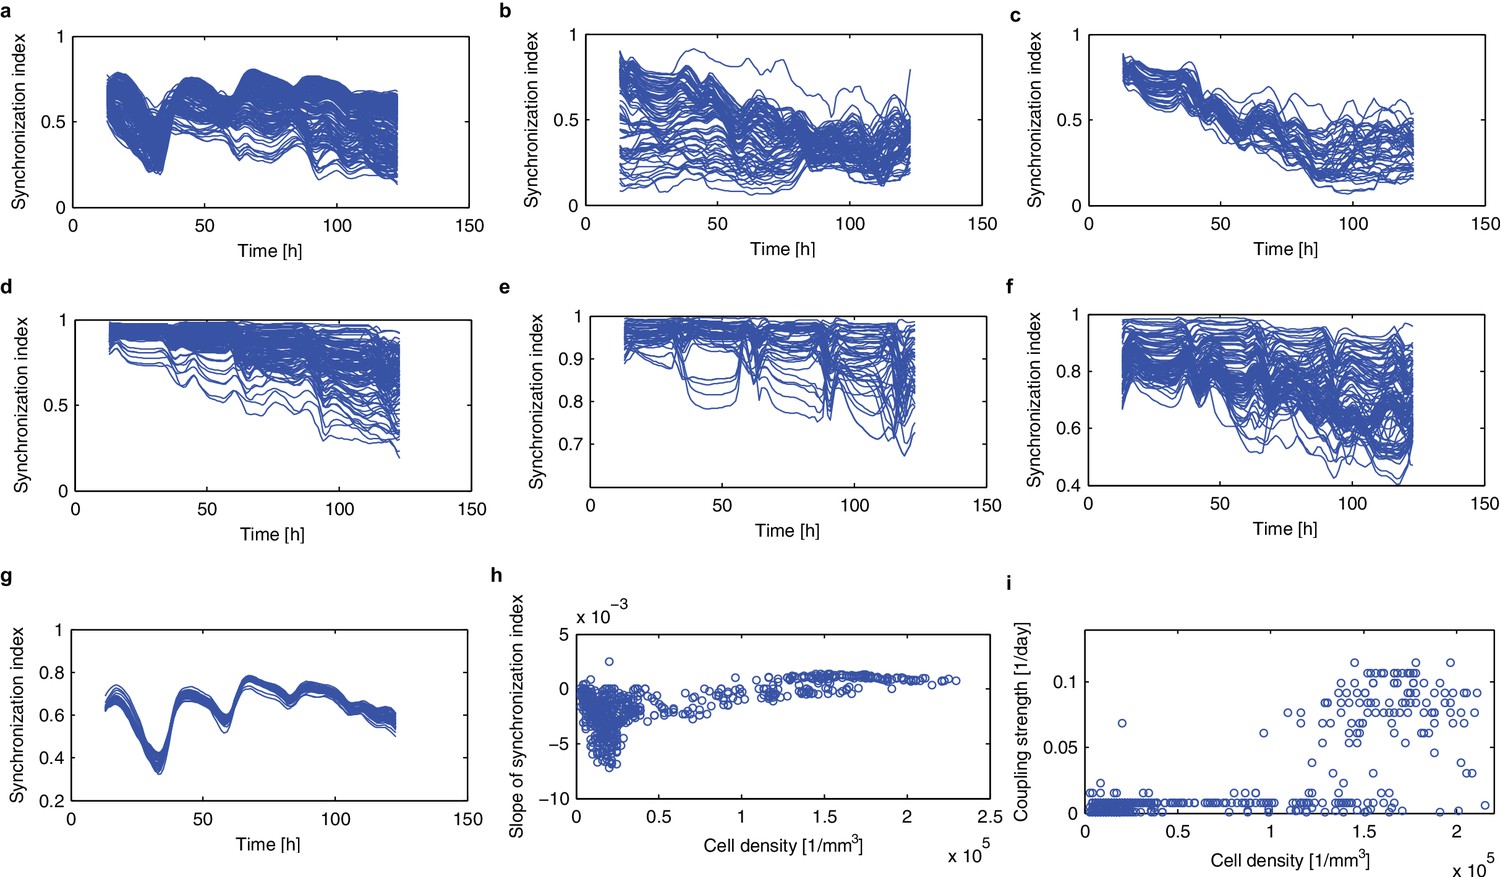
Synchronisation analysis based on the synchronisation index.
(a–f), Time evolution of the synchronisation index (Garcia-Ojalvo et al., 2004) is plotted for the root tip (a), lower root (b), upper root (c), lower hypocotyl (d), upper hypocotyl (e), cotyledon (f). (g), Synchronisation indices in area of high cellular density (ρ >1.5*105 [1/mm]) were extracted from the root tip. (h), Dependence of the slope of the synchronisation index against time on the cell density. (i), Estimated strength of the coupling is plotted against cell density.
Figure 3—figure supplement 4

Synchronisation analysis applied to CCA1-long dataset based on the order parameter.
(a–g), Time evolution of the order parameter R is plotted for the root tip (a), root (sect 1) (b), root (sect 2) (c), root/hypocotyl (d), hypocotyl (sect 1) (e), hypocotyl (sect 2) (f), cotyledon (g). (h), Dependence of the slope of the order parameter against time on the cell density. (i), Estimated strength of the coupling is plotted against cell density.
Videos
Video 1
Peaks of CCA1-YFP expression in the lower hypocotyl and root region.
Video of CCA1-YFP raw (left panel) and normalised (right panel) expression in rhythmic cells imaged from 29 h (root section) or 29.5 h (lower hypocotyl) in LL. Both colour intensity and size of spot indicate expression level. Frame number is indicated by the time step and each frame is approximately 1.1 h apart.
Video 2
Peaks of CCA1-YFP expression in the cotyledon region.
Video of CCA1-YFP raw (left panel) and normalised (right panel) expression in rhythmic cells imaged from in LL. Both colour intensity and size of spot indicate expression level. Frame number is indicated by the time step and each frame is approximately 1.1 hr apart.
Video 3
Peaks of CCA1-YFP expression in the upper hypocotyl region.
Video of CCA1-YFP raw (left panel) and normalised (right panel) expression in rhythmic cells imaged from 29 h in LL. Both colour intensity and size of spot indicate expression level. Frame number is indicated by the time step and each frame is approximately 1.1 h apart.
Video 4
Waves of PRR9:LUC expression in the lower hypocotyl and root.
Video of PRR9:LUC luminescence in the hypocotyl and root of a single seedling from 8–144 h after transfer to constant light. Frame intervals are 1.5 h and scale bar shows 0.5 mm.
Tables
Key resources table
| Reagent type (species) or resource | Designation | Source or reference | Identifiers | Additional information |
|---|---|---|---|---|
| gene (Arabidopsis thaliana) | CCA1 | PMID: 9657153 | TAIR:AT2G46830 | |
| gene (Arabidopsis thaliana) | PRR9 | PMID: 14634162 | TAIR:AT2G46790 | |
| gene (Arabidopsis thaliana) | GI | PMID: 17102804 | TAIR:AT1G22770 | |
| strain, strain background (Arabidopsis thaliana) | cca1-11 | PMID: 14555691 | TAIR:1008081946 | |
| strain, strain background (Agrobacterium tumefaciens) | GV3101 | doi:10.1007/BF00331014 | ||
| transfected construct | CCA1::CCA1-YFP | This paper | Ask for ‘CCY_pPB’ | promoter::protein construct |
| transfected construct | 35S::H2B-RFP | PMID: 22466793 | promoter::protein construct | |
| biological sample (Arabidopsis thaliana) | CCA1::LUC | PMID: 20530216 | Ask for ‘B8-5’ | promoter::luciferase construct; Col-0 background |
| biological sample (Arabidopsis thaliana) | GI::LUC | PMID: 20530216 | Ask for ‘A2-1-4’ | promoter::luciferase construct; Col-0 background |
| biological sample (Arabidopsis thaliana) | PRR9::LUC | PMID: 20530216 | Ask for ‘G8-5’ | promoter:Luciferase construct; Col-0 background |
| biological sample (Arabidopsis thaliana) | CCA1-YFP WT (Ws) | This paper | Ask for ‘1–1’ | CCA1::CCA1-YFP; 35S::H2B-RFP, WT clock period |
| biological sample (Arabidopsis thaliana) | CCA1-YFP long (Ws) | This paper | Ask for ‘3–1’ | CCA1::CCA1-YFP; 35S::H2B-RFP, long clock period |
| Recombinant DNA reagent | pPCV812 | PMID: 18980642 | ||
| sequence-based reagent | CCA1_CDS_Fwd | Sigma-Aldrich | 5’-AAAGGATCCATGGAGACAAATTCGTCTGGA-3’ | |
| sequence-based reagent | CCA1_CDS_Rev | Sigma-Aldrich | 5’-ATACCCGGGTGTGGAAGCTTGAGTTTCCAA-3’ | |
| sequence-based reagent | CCA1_prom_Fwd | Sigma-Aldrich | 5’-AAAGAATTCATTTAGTCTTCTACCCTTCATGC-3’ | |
| sequence-based reagent | CCA1_prom_Rev | Sigma-Aldrich | 5’-ATAGGATCCCACTAAGCTCCTCTACACAACTTC-3’ | |
| software | Imaris | BitPlane, Switzerland | version 7.0 | |
| software | ImageJ | National Institutes of Health, U.S.A. | public domain | |
| software | MATLAB | MathWorks, U.K. | version 2015b | |
| algorithm | MATLAB code | This paper | https://gitlab.com/slcu/teamJL/Gould_etal_2018 |
Additional files
-
Transparent reporting form
- https://doi.org/10.7554/eLife.31700.025
Download links
A two-part list of links to download the article, or parts of the article, in various formats.
Downloads (link to download the article as PDF)
Open citations (links to open the citations from this article in various online reference manager services)
Cite this article (links to download the citations from this article in formats compatible with various reference manager tools)
Coordination of robust single cell rhythms in the Arabidopsis circadian clock via spatial waves of gene expression
eLife 7:e31700.
https://doi.org/10.7554/eLife.31700


