Preferential assembly of heteromeric kainate and AMPA receptor amino terminal domains
- National Institute of Biomedical Imaging and Bioengineering Institutes of Health, National Institutes of Health, United States
- National Institute of Child Health and Human Development, National Institutes of Health, United States
Figures
Figure 1
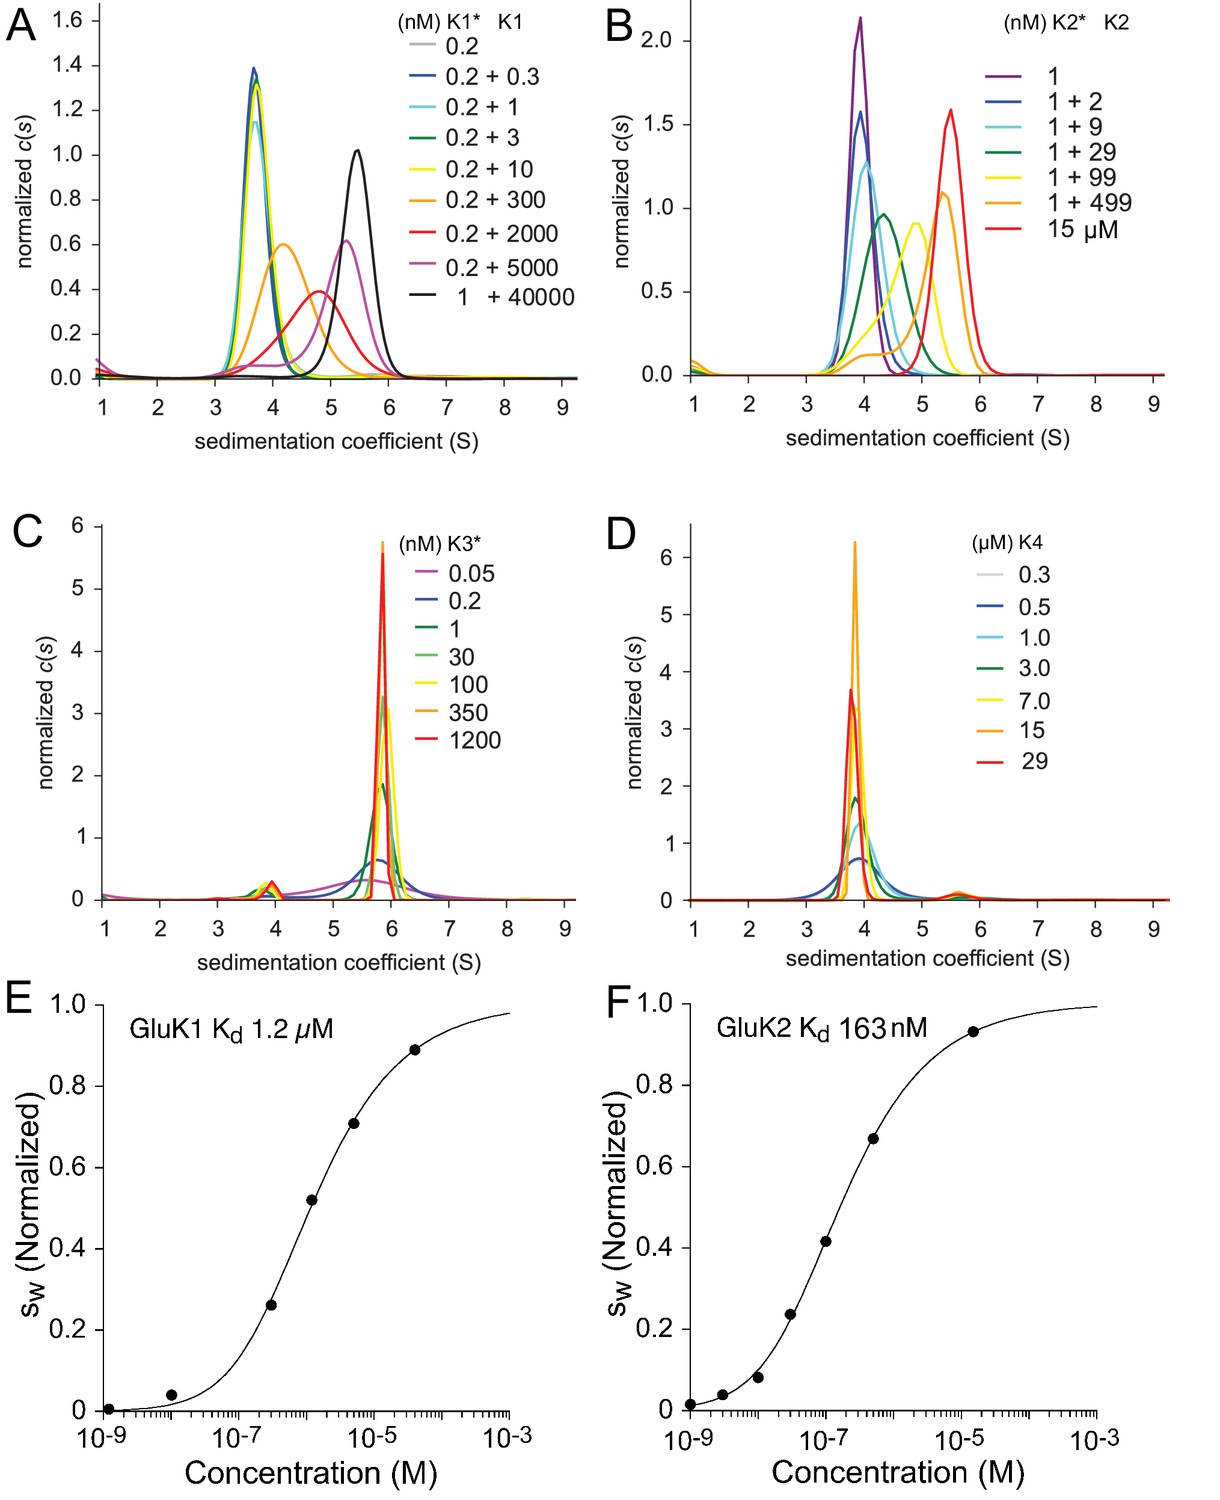
Sedimentation velocity analysis of the homo-dimerization of GluK1 (A), GluK2 (B), GluK3 (C), and GluK4 (D).
Panel A: Sedimentation coefficient distributions derived from FDS-SV data of samples with 0.2 nM or 1 nM DyLight 488-labeled GluK1 mixed with 0.3 nM - 40 µM unlabeled GluK1 at the concentrations indicated in the legend (with the asterisk indicating the molecule carrying the fluorophore). Panel B: traces for an analogous titration series of 1 nM DyLight 488-labeled GluK2 with 2–499 nM unlabeled GluK2 using fluorescence detection, and a 15 µM sample of unlabeled GluK2 determined by absorbance detection at 280 nm. Panel C: distributions from fluorescence data from DyLight 488-GluK3 at 50 pM - 1.2 µM. Panel D: Analogous distributions of 0.3–29 µM unlabeled GluK4 detected by absorbance at 280 nm. Panels E and F: Isotherms of signal-weighted average sedimentation coefficients of GluK1 and GluK2, derived from the distributions in A and B, respectively, and best-fit isotherms of a monomer-dimer model with refined of 1.2 µM for GluK1 E and 160 nM for GluK2 F, respectively. For better visual comparison, is normalized to assign a value of 1.0 to the range from monomer to dimer -value.
Figure 2
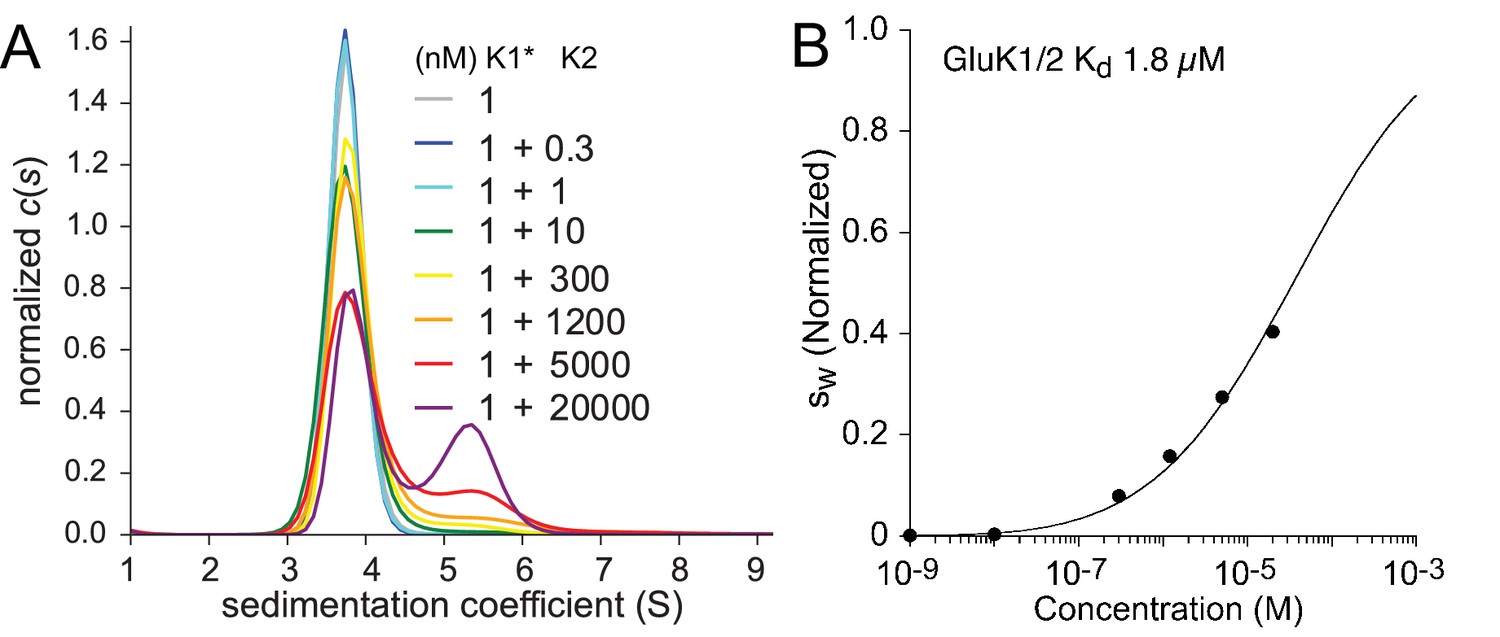
Hetero-dimerization of GluK1 and GluK2 ATD.
Panel A: Sedimentation coefficient distribution based on FDS-SV data of 1 nM DyLight 488-labeled GluK1 mixed with 0.3–20 µM unlabeled GluK2. A GluK1 control sample without GluK2 (grey) is virtually superimposed by those for 0.3 nM (black) and 1 nM (cyan) GluK2. Panel B: isotherm (normalized to assign a value of 1.0 to the range from monomer to dimer -value) after integration of traces (circles) and fit with a model for competitive homo- and hetero-association, fixing the two previously measured homo-dimerization constants of GluK1 and GluK2 while refining the for GluK1/GluK2 heteromers to the best-fit value of 1.8 µM.
Figure 3
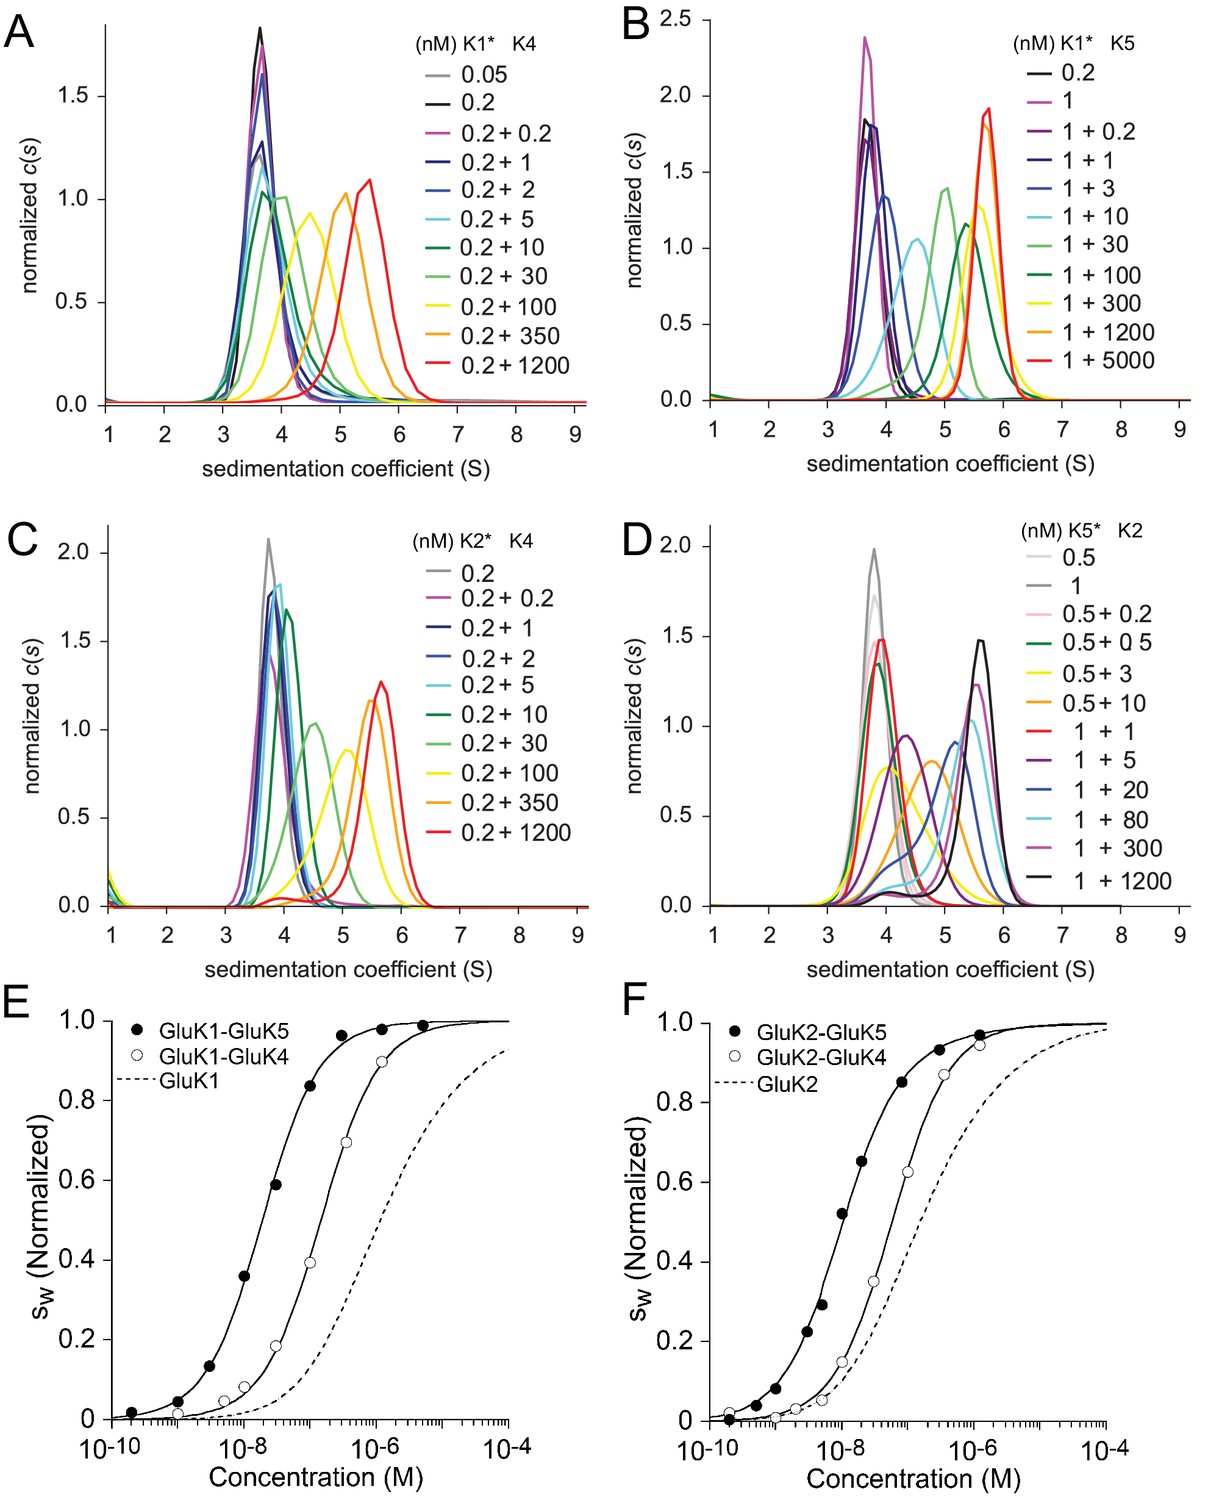
Sedimentation velocity analysis of the hetero-dimerization of GluK1 and GluK2 with GluK4 and GluK5.
Panel A: Sedimentation coefficient distributions determined from analysis of FDS-SV data for titration of 50–200 pM DyLight 488-labeled GluK1 with 0.2 nM - 1.2 µM unlabeled GluK4. Panel B: distributions for an analogous titration series of 200 pM or 1 nM DyLight 488-labeled GluK1 with 0.2 nM - 5 µM unlabeled GluK5. Panel C: distributions from analysis of FDS-SV data for titration of 200 pM DyLight 488-labeled GluK2 with 0.2 nM - 1.2 µM unlabeled GluK4. Panel D: Analogous distributions from FDS-SV data for the titration of 0.5 nM or 1 nM DyLight 488-labeled GluK5 with 0.2 nM - 1.2 µM unlabeled GluK2. Panel E: Isotherms of -values for the titration series of GluK1 with either GluK4 or GluK5, fit with a coupled equilibrium model for GluK1/GluK4 or GluK1/GluK5 heterodimer assembly competitive with homo-dimerization of both binding partners, leads to a best-fit heterodimer of 146 nM (95% CI: 116–184 nM) for GluK1/GluK4 and 18 nM (95% CI: 15–22 nM) for GluK1/GluK5. For comparison, the dashed line shows the isotherm for homomeric GluK1. is normalized to assign 1.0 for the range from monomer to dimer -value. Panel F: Analogous to E, isotherms of -values for the titration series of GluK2 with either GluK4 or GluK5, fit with a coupled equilibrium model for GluK2/GluK4 or GluK2/GluK5 heterodimer assembly competitive with homo-dimerization of both binding partners, lead to a heterodimer of 57 nM (95% CI: 46–71 nM) for GluK1/GluK4 and 12 nM (95% CI: 6–17 nM) for GluK1/GluK5; the dashed line shows the isotherm for homomeric GluK2.
Figure 4
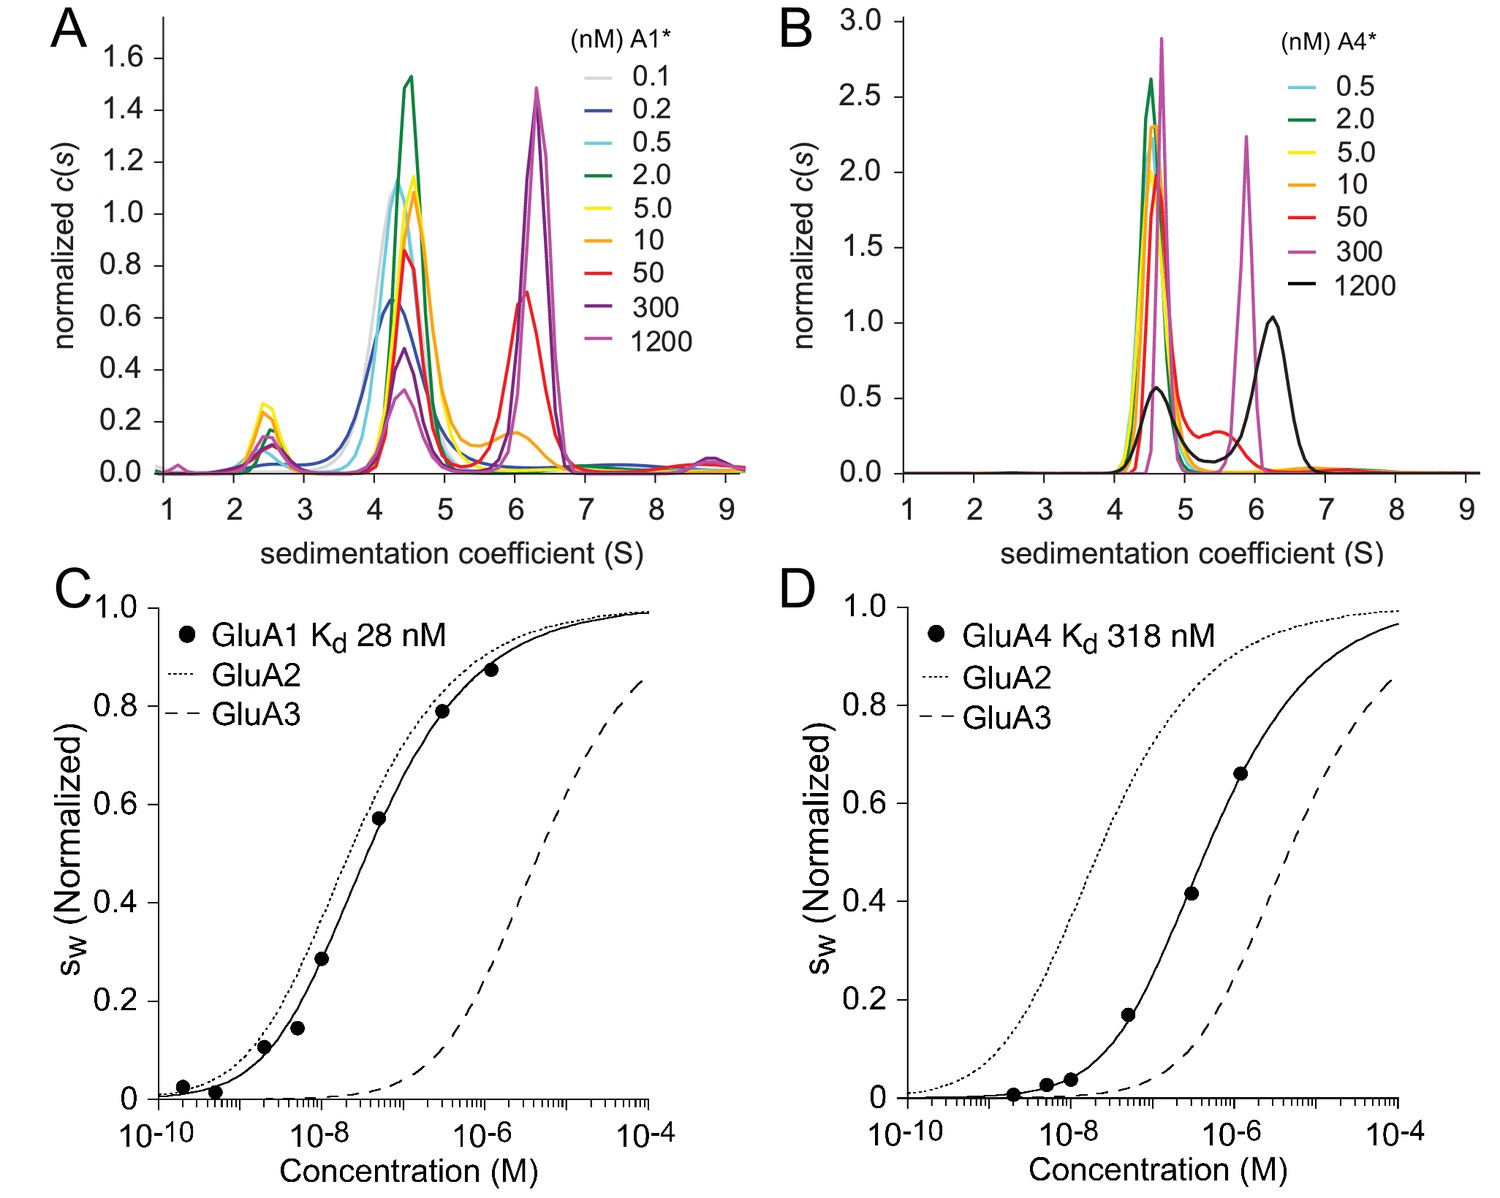
Homomeric assembly of AMPA receptor ATDs.
Panels A and B: Sedimentation coefficient distributions derived from FDS-SV data of a dilution series of 100 pM - 1.2 µM EGFP-GluA1 (A) and 500 pM - 1.2 µM EGFP-GluA4. Panels C and D: Isotherms of for GluA1 (C) or GluA4 (D) fit with a model for monomer-dimer association with a best-fit for GluA1 of 28 nM (95% CI: 14–58 nM) and for GluA4 of 318 nM (95% CI: 145–730 nM). For comparison, the dotted and dashed lines show isotherms for GluA2 and GluA3, respectively. is normalized to assign a value of 1.0 to the range from monomer to dimer -value.
Figure 5

Heteromeric assembly of AMPA receptor ATDs.
Shown are sedimentation coefficient distributions for the titrations of 0.2 or 0.5 nM EGFP-GluA1 with 0.2 nM - 1.2 µM unlabeled GluA2 (Panel A), 0.5 nM EGFP-GluA1 1 with 0.2 nM - 3 µM unlabeled GluA3 (Panel B), 0.5 nM EGFP-GluA1 with 0.2 nM - 3 µM unlabeled GluA4 (Panel C), 0.5 or 1 nM DyLight 488-labeled GluA2 with 0.2 nM - 1.2 µM unlabeled GluA3 (Panel D), 0.5 nM EGFP-GluA4 with 0.2 nM - 3 µM unlabeled GluA3 (Panel E), and 0.5 nM EGFP-GluA4 with 1 nM - 3 µM unlabeled GluA2 (Panel F).
Figure 6

Isotherms for heteromeric assembly of AMPA receptor ATDs.
Weighted-average as a function of concentration were extracted from the sedimentation coefficient distributions shown in Figure 5, and fit with a competitive homo- and hetero-dimerization model using previously determined homo-dimerization parameters of both components as fixed constraints (solid line). Panel A: The analysis of complexes of GluA2 yielded best-fit heterodimer -values of 2.9 nM (95% CI: 1.6–5.6 nM) for GluA2/GluA1; 1.3 nM (95% CI: 1.0–1.7 nM) for GluA2/GluA3; and 32.6 nM (95% CI: 19–59 nM) for GluA2/GluA4. For comparison, the dotted line shows the isotherm for homomeric assembly of the GluA2 ATD. (Panel B:) The analysis of heterodimer assemblies not containing GluA2 yields best-fit heterodimer -values of 8.3 nM (95% CI: 6–12 nM) for GluA1/GluA3; 61.5 nM (95% CI: 15–218 nM) for GluA1/GluA4; and 91 nM (95% CI: 60–137 nM) for GluA3/GluA4. For comparison, the dashed line shows the isotherm for self-association of GluA3 ATD and the dotted line that of GluA4 ATD. isotherms are normalized to assign 1.0 for the range from monomer to dimer -value.
Figure 7

Diagram of specific preferential binding of AMPAR and KaiR ATDs.
The Gibbs free energy for various dimers at 20C under the current experimental conditions was calculated from the -values in Table 1 and Table 2. Panel A: Graphic presentation of the relationship between the ATDs for AMPAR and KaiR. The color of the big circle (energy cloud) surrounding each pair indicates the free energy level of the dimerization, using the color temperature scale on the right. The width, line type, and color of the arrows emphasizes the stability difference between pairs with exchanged subunits. Panel B and C: Bar graphs of the Gibbs free energy for AMPA (A) and kainate (B) receptor ATD pairs. The dashed lines are visual guides for comparison, at the level of different homodimer free energies.
Tables
Table 1
-values for kainate receptor amino-terminal domain dimer assembly.
https://doi.org/10.7554/eLife.32056.002| DL-GluK1 | DL-GluK2 | DL-GluK3 | DL-GluK4 | DL-GluK5 | |
|---|---|---|---|---|---|
| UL GluK1 | 1.2 µM [0.8, 1.7] | ||||
| UL GluK2 | 1.8 µM [1.5, 2.2] | 163 nM [113, 235] | 9.4 nM [8, 11] | ||
| DL GluK3 | <50 pM* | ||||
| UL GluK4 | 146 nM [116, 184] | 57 nM [46, 71] | >1 mM$ | ||
| UL GluK5 | 18 nM [15,22] | 12 nM [10, 14] | 350 µM% |
-
Values in brackets indicate 95% confidence limits. Abbreviations: UL, Unlabeled protein; DL, DyLight 488-labeled protein; EGFP, EGFP fusion protein. * determination from FDS-SV dilution series. $ determined from SV ABS data. % previously determined from SV ABS data for unlabeled GluK5 (Kumar et al., 2011).
Table 2
-values for AMPA receptor amino-terminal domain dimer assembly.
https://doi.org/10.7554/eLife.32056.007| EGFP-GluA1 | DL-GluA2 | UL-GluA3 | EGFP-GluA4 | |
|---|---|---|---|---|
| UL GluA1 | 28.4 nM [14, 58] | |||
| UL GluA2 | 2.9 nM [1.6, 5.6] | 21.1 nM* [17, 27] | 32.6 nM [19, 59] | |
| UL GluA3 | 8.3 nM [6, 12] | 1.3 nM [1.0, 1.7] | 5.2 µM# [1.7, 14] | 91 nM [60,137] |
| UL GluA4 | 62 nM [15, 218] | 318 nM [145, 730] | ||
-
Values in brackets indicate 95% confidence limits. Abbreviations: UL, Unlabeled protein; DL, DyLight 488-labeled protein; EGFP, EGFP fusion protein. *Similar estimates were obtained separately in previous studies for GluA2 ATD: 24 nM in (Zhao et al., 2016); 16.5–25.4 nM in (Zhao et al., 2013d); 8.3–12 nM in (Zhao et al., 2012). # Value from (Zhao et al., 2012).
Additional files
-
Transparent reporting form
- https://doi.org/10.7554/eLife.32056.011
Download links
A two-part list of links to download the article, or parts of the article, in various formats.
Downloads (link to download the article as PDF)
Open citations (links to open the citations from this article in various online reference manager services)
Cite this article (links to download the citations from this article in formats compatible with various reference manager tools)
Preferential assembly of heteromeric kainate and AMPA receptor amino terminal domains
eLife 6:e32056.
https://doi.org/10.7554/eLife.32056


