Neurovascular sequestration in paediatric P. falciparum malaria is visible clinically in the retina
- University of Liverpool, United Kingdom
- College of Medicine, Malawi
- University of British Columbia and Vancouver General Hospital, Canada
- Liverpool School of Tropical Medicine, United Kingdom
- Royal Liverpool University Hospital, United Kingdom
- American Society for Clinical Pathology, United States
- University of Malawi, Malawi
- Michigan State University, United States
Figures
Figure 1 with 1 supplement

Principal features of malarial retinopathy (MR).
(A) Montage image showing MR pathological features, including orange vessels (asterisks), white centred haemorrhages and whitening. (B) Corresponding fluorescein angiogram showing capillary nonperfusion (asterisks) mapping to retinal whitening. (C–D) Colour fundus image of retinopathy positive eyes (C, right; D, left eye; eyes were from different cases) showing orange intravascular material in large (arrowheads), small and postcapillary venules (asterisks), and capillaries; note retinal whitening also present.
Figure 1—figure supplement 1
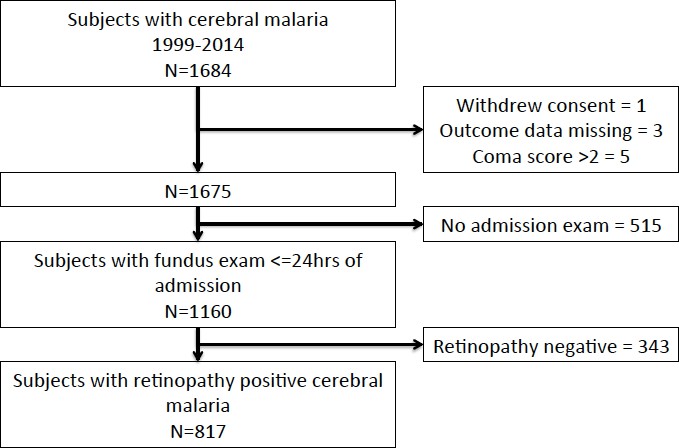
Flow chart describing clinical dataset.
https://doi.org/10.7554/eLife.32208.003
Figure 2

Vessel changes in malarial retinopathy.
(A–B) Vessel colour changes (panels A-B) and intravascular filling defects (panel B, arrowheads) were identified during gross pathology examination (representative images of superior calotte and PO block from histology cases n. 5 and 7, respectively) N = 12. Abnormal vessels were sampled during gross pathology examination and analysed separately (see marked quadrant in panel A). (C–D) H and E staining of parasitised venules from MR cases sampled by punch biopsies from a retinal quadrant with (panel C shows the same orange vessel as in panel A) and without (panel D, case n. 15) vessel discolouration. (C) The margin of the vessel lumen has a near-complete layer of pigment-containing pRBCs (that stain less intensely pink than the adjacent non-parasitised RBC) on the endothelium. (D) Mild sequestration of pRBCs which is marked by an arrowhead. Scale bars (50 μm, (C–D).
Figure 3 with 1 supplement
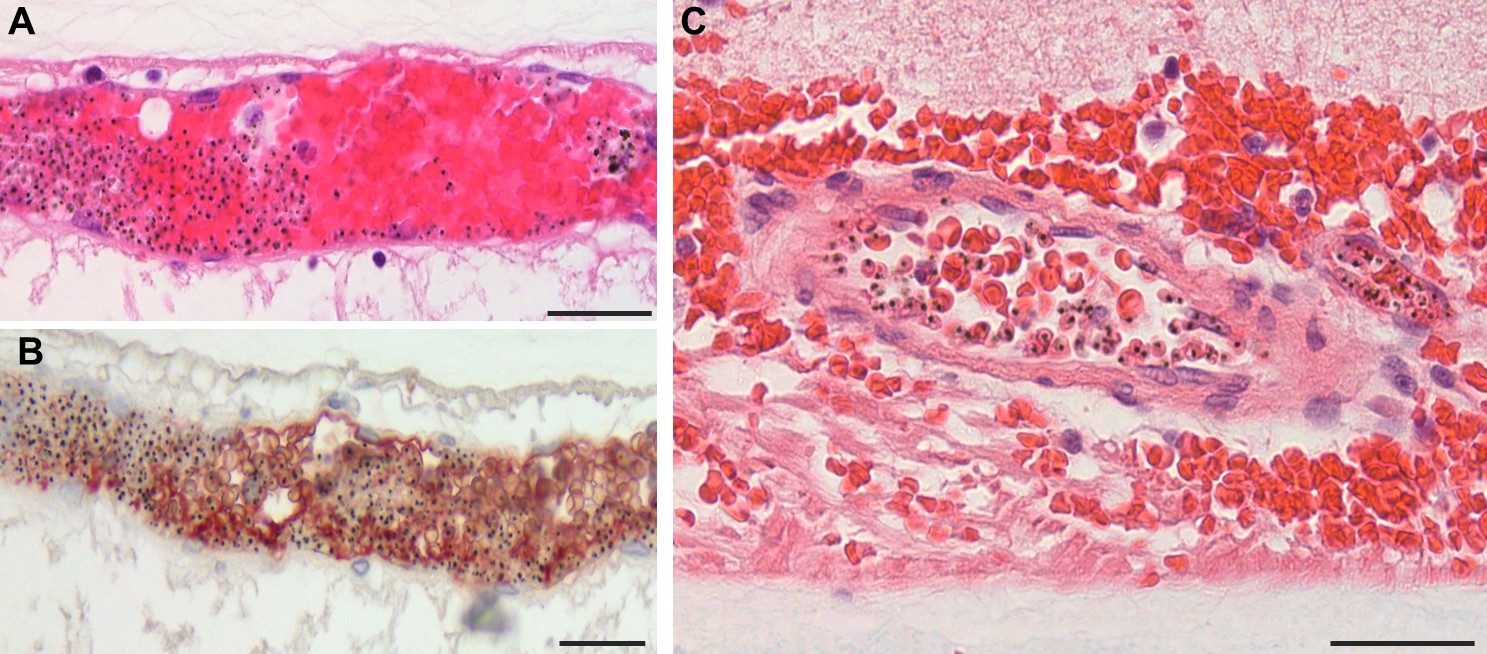
Severe pRBC sequestration in large venules and arterioles in MR with visible vessel discolouration.
(A–B) Longitudinal section of large retinal venule from retinal area affected by intravascular filling defects on fluorescein angiography (histopathology case no. 9) analysed by H&E staining (A) and anti-fibrinogen IHC (B). Clusters of pRBC are seen within the vessel lumen and attached to the wall. (C) Cross section of a large retinal arteriole with moderate pRBC sequestration (case n. 5). Arteriole is surrounded by haemorrhage, probably of a venular origin as arteriolar vessel wall appeared intact (in multiple sections). Scale bars: 50 μm (all panels).
Figure 3—figure supplement 1
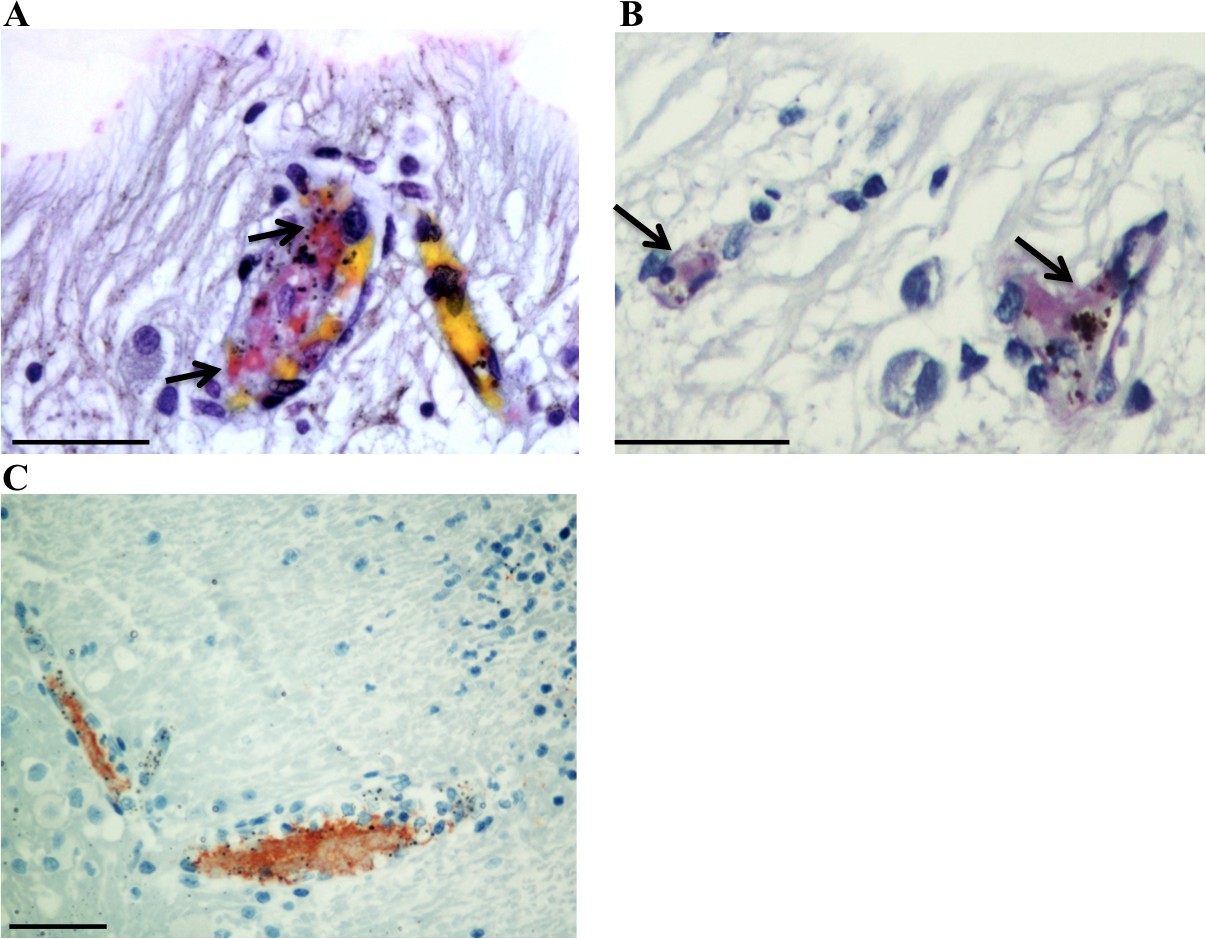
Detection of thrombi in post-mortem retinal periphery using a combination of MSB staining (panels A,B; arrows: intravascular thrombi are stained bright pink), and anti-CD61 platelet marker immunostaining (panel C, red stained).
Scale bars: 50 μm.
Figure 4

Vascular changes in retinal vessels in malarial retinopathy.
(A–I) Expression of endothelial CD34 (panel A: case n. 3, inset: case n. 25 and D: box plot), pericytic SMA (panel B: case n. 12, inset: case n. 27 and E: box plot) and pericytic PDGFRβ (panel C: case n. 13, inset: case n. 26 and F: box plot) markers. Insets show normal annular staining in absence of pRBC sequestration, whereas this annular pattern is lost in the sequestrated vessels seen in A-C. SMA was only reported for venules as it does not produce an annular staining pattern in normal capillaries: panel E. N = 17 for CD34; N = 29 for SMA and PDGFRβ immunostaining. ANOVA was used to compare means. **p<0.005. Scale bars: 20 μm (A–C), 5 μm (insets).
-
Figure 4—source data 1
Vascular changes in retinal vessels inmalarial retinopathy.
- https://doi.org/10.7554/eLife.32208.012
Figure 5

Activation of retinal glial cells in malarial retinopathy (MR).
(A–B) Anti-ICAM-1 staining of MR-positive cases with (case n. 16, panel A) and without (case n. 13, panel B) vessel discolouration. Haematoxylin (blue) counterstain was used. (C–D) Anti-GFAP staining of orange-discoloured vessels in punch biopsy from MR-positive case n. 5, and in MR-negative case n. 25. Haematoxylin counterstaining was omitted here. In A and C, peri-vascular activated astrocytes and Műller cells are marked with arrowheads, and asterisks label Műller cell bodies. Scale bars: 50 μm (all panels).
Figure 6
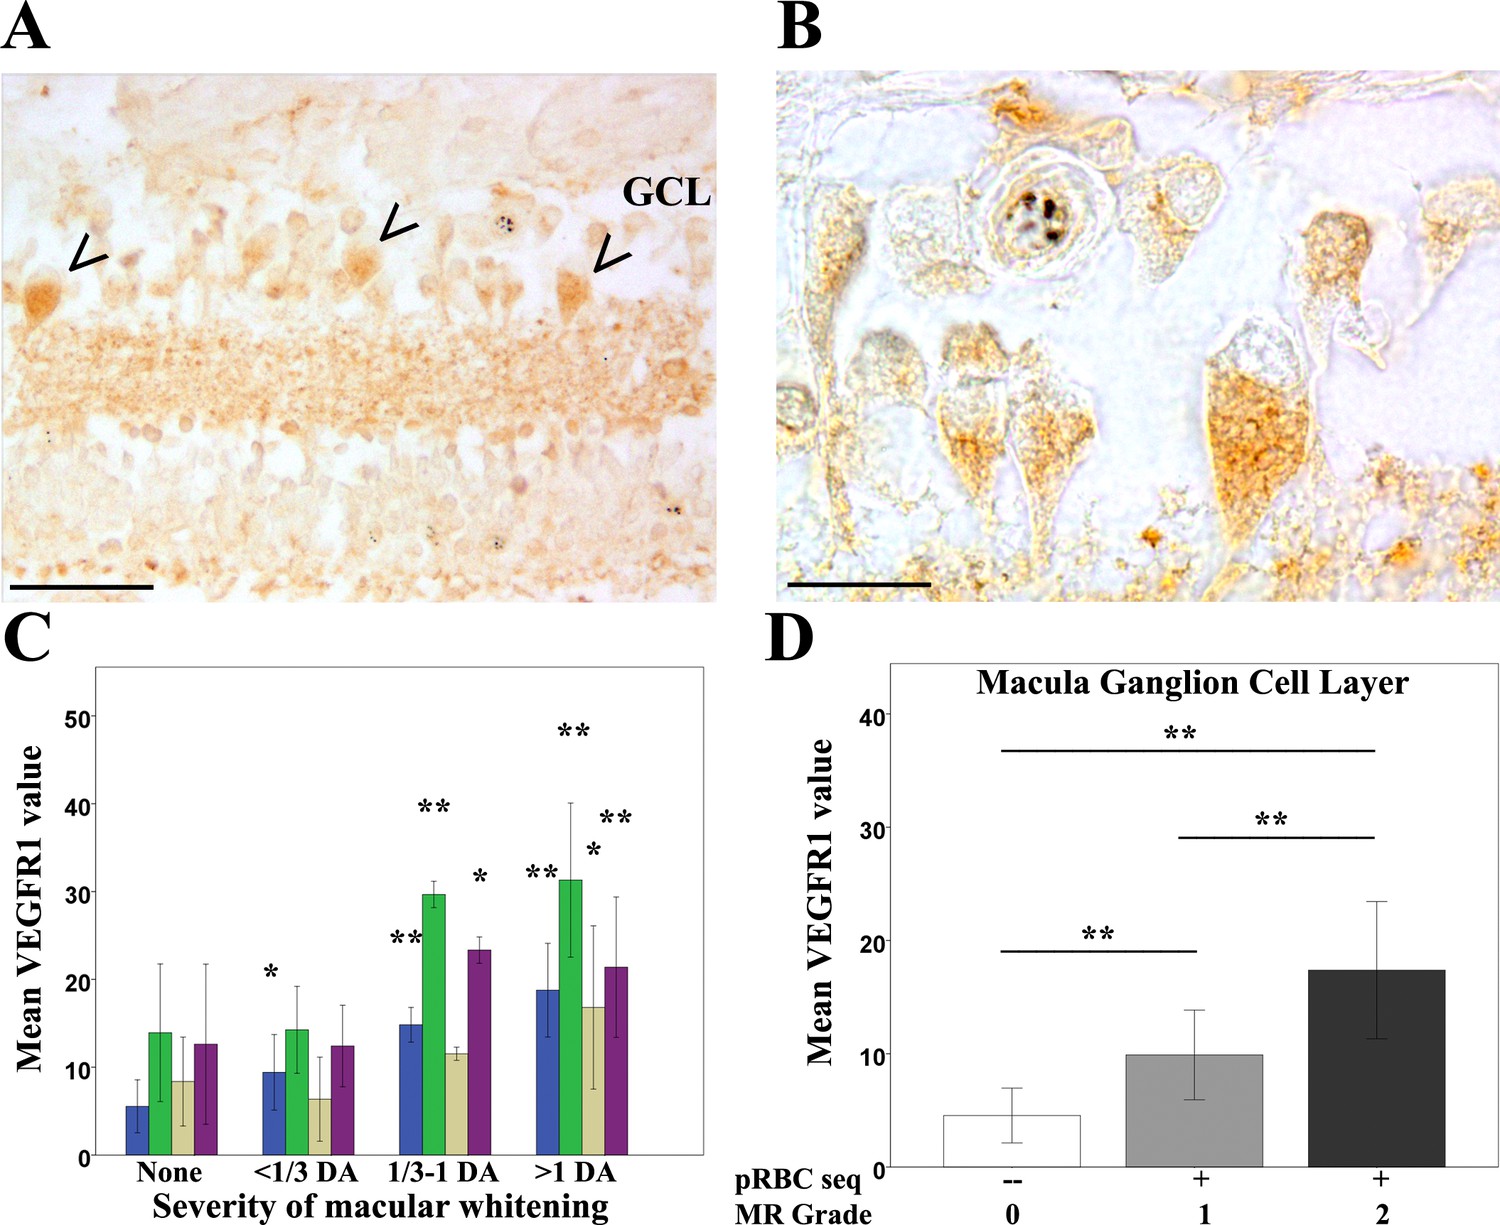
Clinicopathological association between retinal whitening in the macula and increased VEGFR1 expression in malarial retinopathy.
(A–B) Immunostaining pattern in macula affected by whitening (case no 9) (low (A) and high (B) magnification; VEGFR1 +ve ganglion cell bodies indicated by arrowheads). (C) Cluster column chart showing densitometrically assessed intensity of immunoreactivity (‘value’) of VEGFR1 expression plotted by retinal layer against whitening severity, compared with MR –ve cases. Ganglion cell layer = GCL (blue); inner plexiform layer = IPL (green); inner nuclear layer = INL (light brown); outer plexiform layer = OPL (purple). (D) VEGFR1 levels in the GCL plotted against MR severity classification groups (grade 0 = none, 1 = mild, two moderate/severe). Means ± SD are reported in both charts; ANOVA was used to compare means (N = 26). *p≤0.05 and **p≤0.001. Scale bars: 50 μm (panel A); 20 μm (panel B).
-
Figure 6—source data 1
Clinicopathological association between retinal whitening in the macula and increased VEGFR1 expression inmalarial retinopathy.
- https://doi.org/10.7554/eLife.32208.015
Figure 7 with 1 supplement

Clinicopathological association between retinal whitening in the macula and increased AQP4 expression in malarial retinopathy.
(A–C) Immunostaining pattern in the macula with (A-B, case no 13) and without whitening (C, case no 21). Parasitised vessels are marked by arrows. The vertical linear pattern indicates Műller cell immunoreactivity for AQP4. (D) Cluster column chart showing densitometrically assessed intensity of immunoreactivity (‘value’) of AQP4 levels measured by IHC in the macula by retinal layers: nerve fibre layer = NFL (red), ganglion cell layer = GCL (blue), inner plexiform layer = IPL (green), outer plexiform layer = OPL (purple). (E): AQP4 levels in the nerve fibre layer plotted against MR severity classification groups (grade 0 = none, 1 = mild, two moderate/severe). Means ± SD are reported in all graphs; ANOVA was used to compare means (N = 26). *p<0.05 and **p<0.001. Scale bars: 50 μm (panels C, E, F and G); 10 μm (panel D).
-
Figure 7—source data 1
Clinicopathological association between retinal whitening in the macula and increased AQP4 expression inmalarial retinopathy.
- https://doi.org/10.7554/eLife.32208.018
Figure 7—figure supplement 1

Clinicopathological association between retinal whitening in the peripheral retina and increased AQP4 expression in malarial retinopathy.
(A–B) Immunostaining pattern is shown in MR-positive case with whitening (A, case n. 13) and MR-negative case (B, case n. 23). Parasitised vessels are marked by arrows. The vertical linear pattern indicates Műller cell immunoreactivity for AQP4. (C) Cluster column chart showing densitometrically assessed intensity of immunoreactivity (‘value’) of AQP4 levels measured by IHC in the peripheral retina by retinal layers: nerve fibre layer = NFL (red); ganglion cell layer = GCL (blue); inner plexiform layer = IPL (green); outer plexiform layer = OPL (purple). (D) AQP4 levels in the nerve fibre layer plotted against MR severity classification groups (grade 0 = none, 1 = mild, two moderate/severe). For details on grading zones see Appendix 2. Means ± SD are reported in all graphs; ANOVA was used to compare means (N = 26). *p≤0.05 and **p≤0.001. Scale bars: 50 μm (panels A-B).
-
Figure 7—figure supplement 1—source data 1
Clinicopathological association between retinal whitening in the peripheral retina and increased AQP4 expression inmalarial retinopathy.
- https://doi.org/10.7554/eLife.32208.019
Figure 8
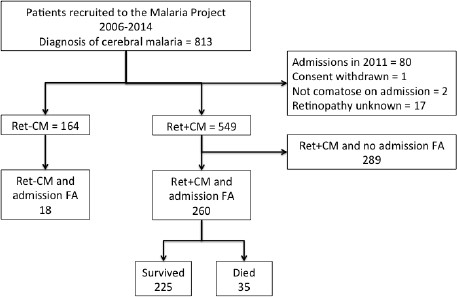
Flow chart describing fluorescein angiography dataset.
https://doi.org/10.7554/eLife.32208.020
Figure 9
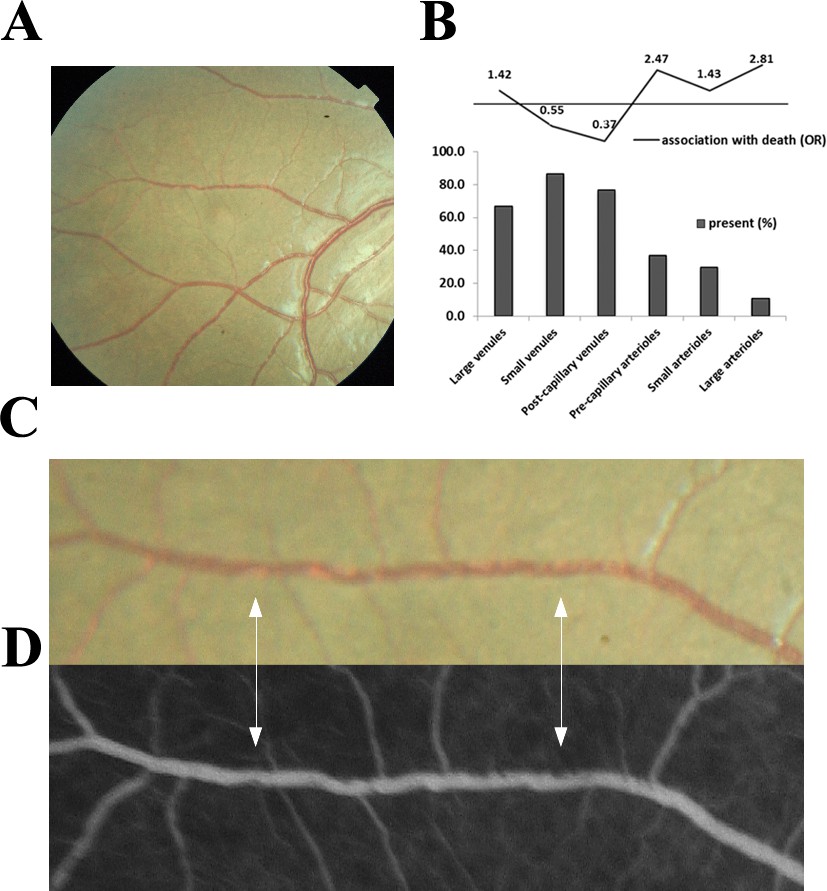
Visible sequestration in the retinal neurovasculature.
(A–D): Orange intravascular material is seen in the retinal venule (A, C) which co-localises to the intravascular filling defects on fluorescein angiography (D) (see arrows). Chart (B) shows the frequency of visible sequestration in six microvessel types in 259 subjects with retinopathy +ve CM and the odds ratios of death within the admission.
-
Figure 9—source data 1
Visible sequestration in the retinal neurovasculature.
- https://doi.org/10.7554/eLife.32208.022
Figure 10
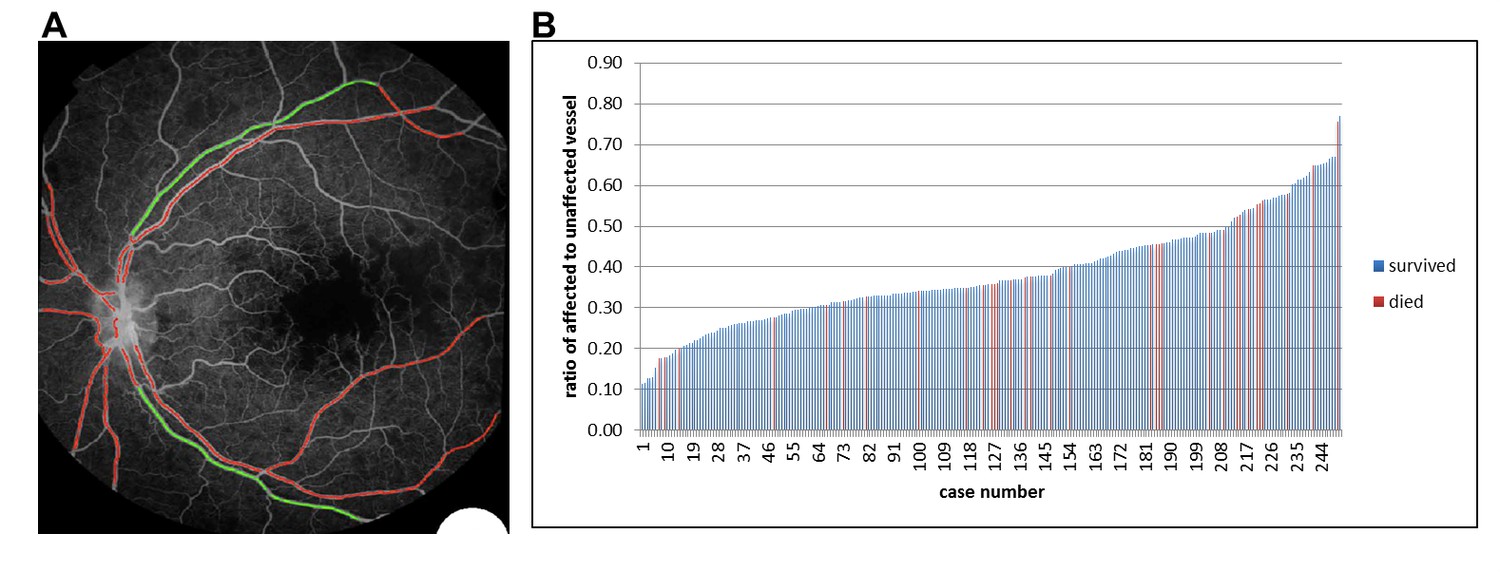
Semiautomated quantitative analysis of sequestration by length of affected vessel.
(A) Example image of semiautomated system to show vessels affected by sequestration (red). (B) Chart showing distribution of proportion of detected vessel affected by sequestration related to survival in 251 eyes (one eye per case).
-
Figure 10—source data 1
Semiautomated quantitative analysis of sequestration by length of vessel involved.
- https://doi.org/10.7554/eLife.32208.025
Appendix 1—figure 1
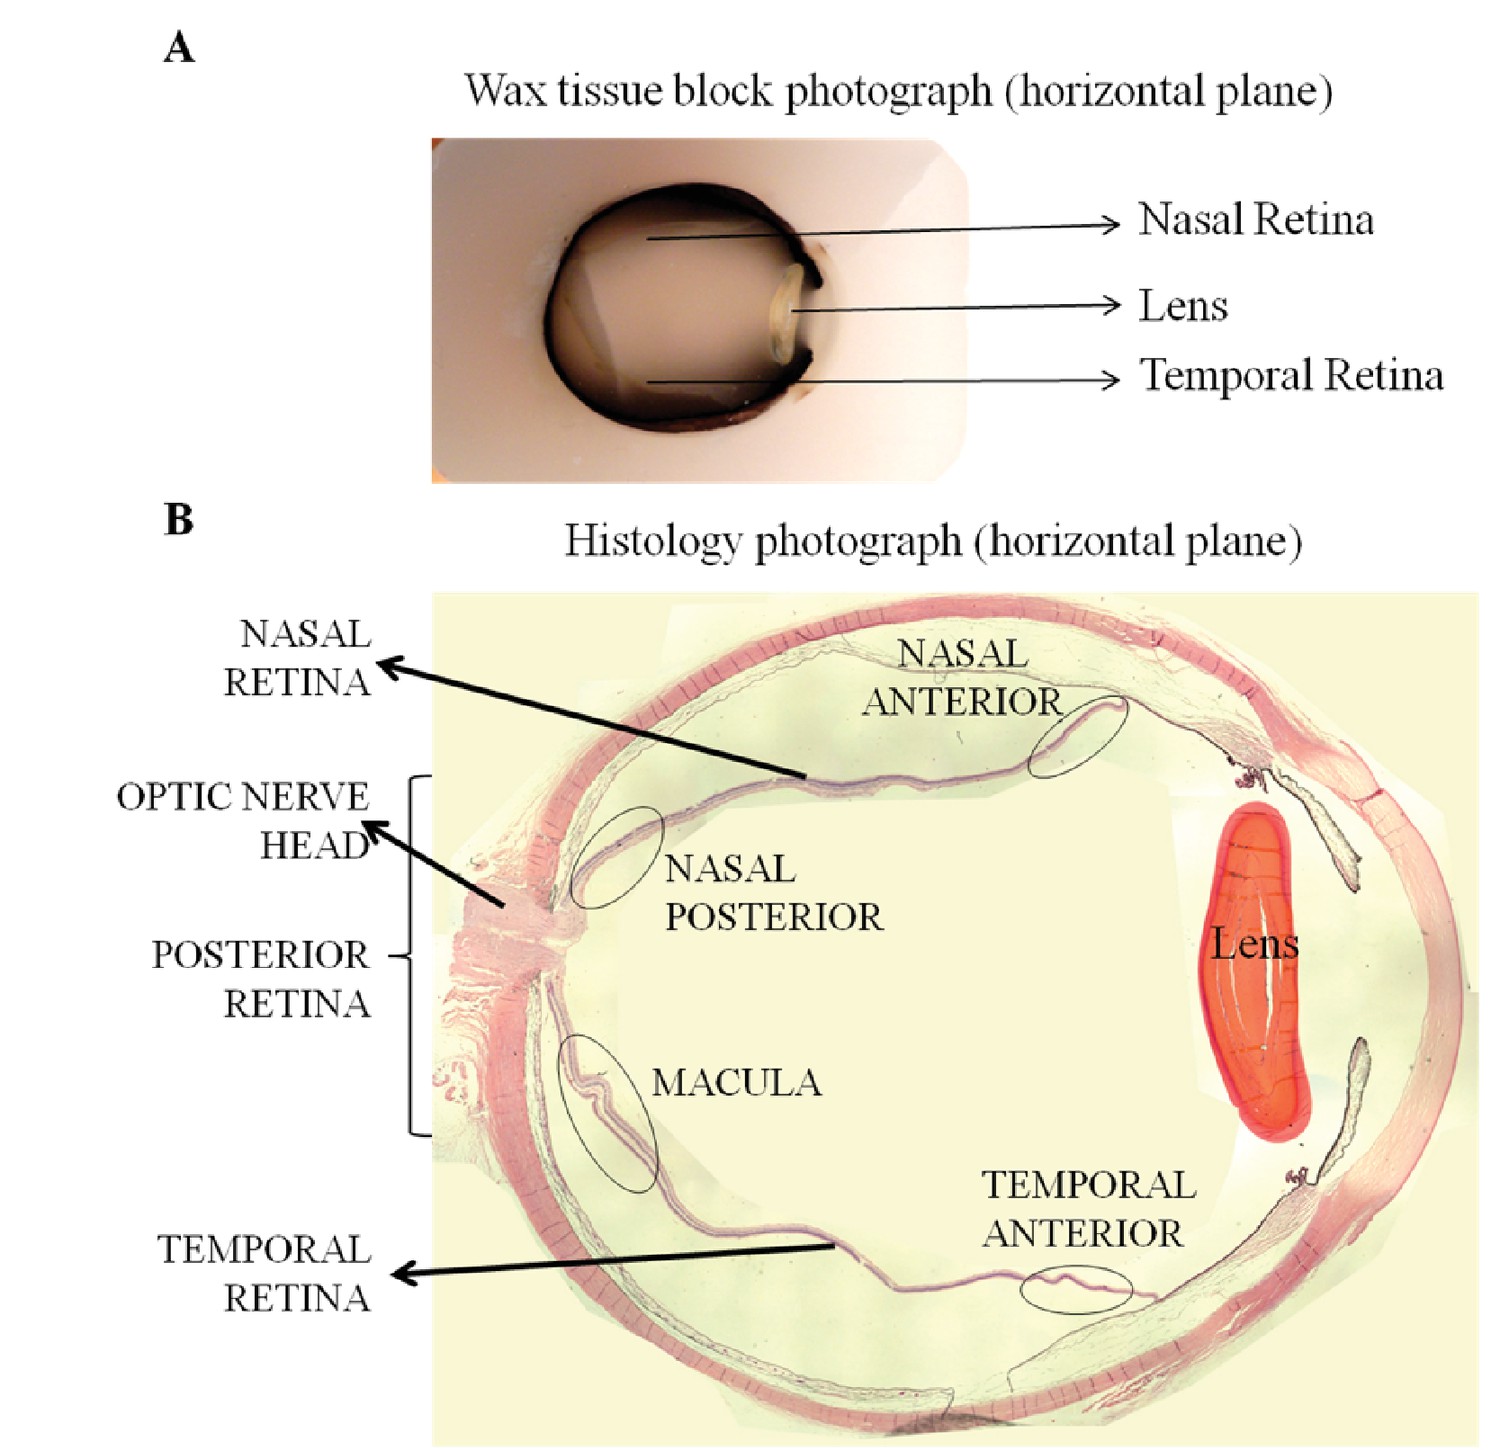
Orientation and topographical association in whole eye histology blocks (A) and in eye sections (B), used to perform correlation studies between fundal images and histology.
https://doi.org/10.7554/eLife.32208.030
Appendix 1—figure 2
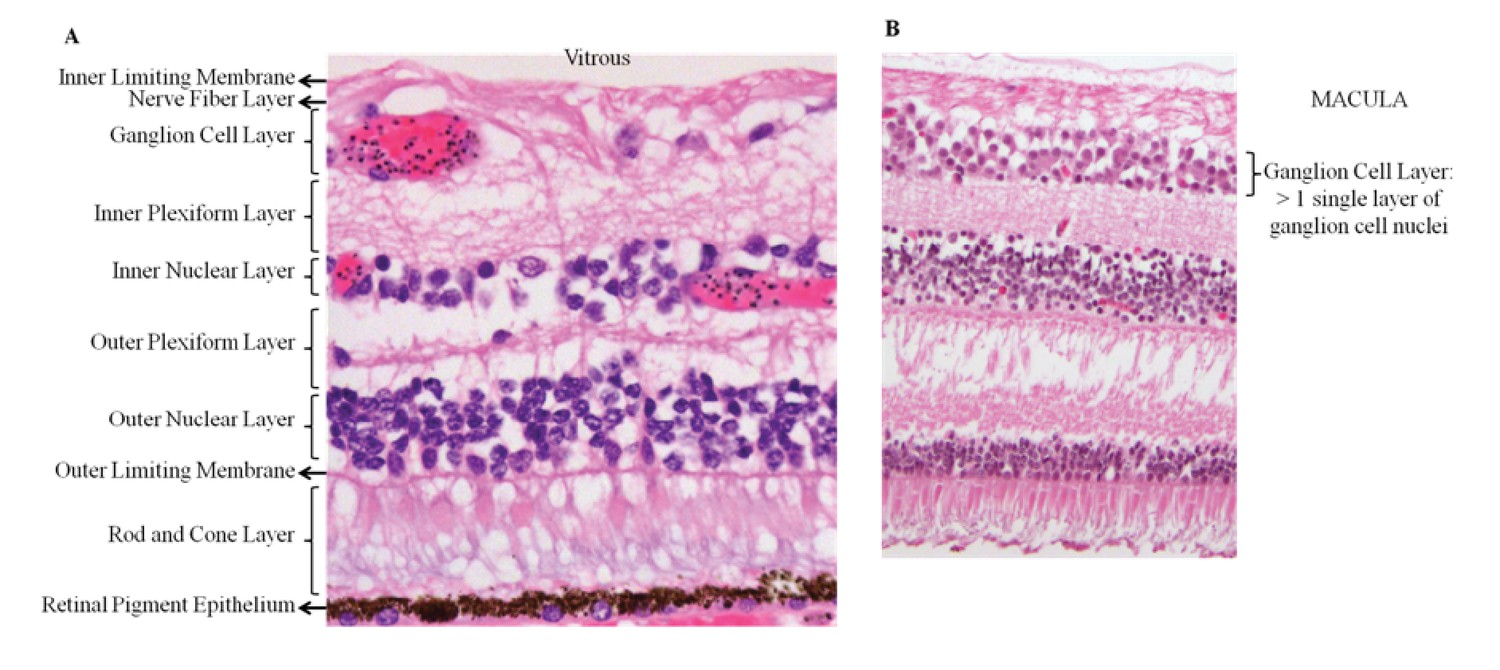
Panel A: retinal structure on light microscopy (H&E staining).
Panel B shows the specific feature of >1 cell thickness in the ganglion cell layer, used to identify the macula.
Appendix 2—figure 1
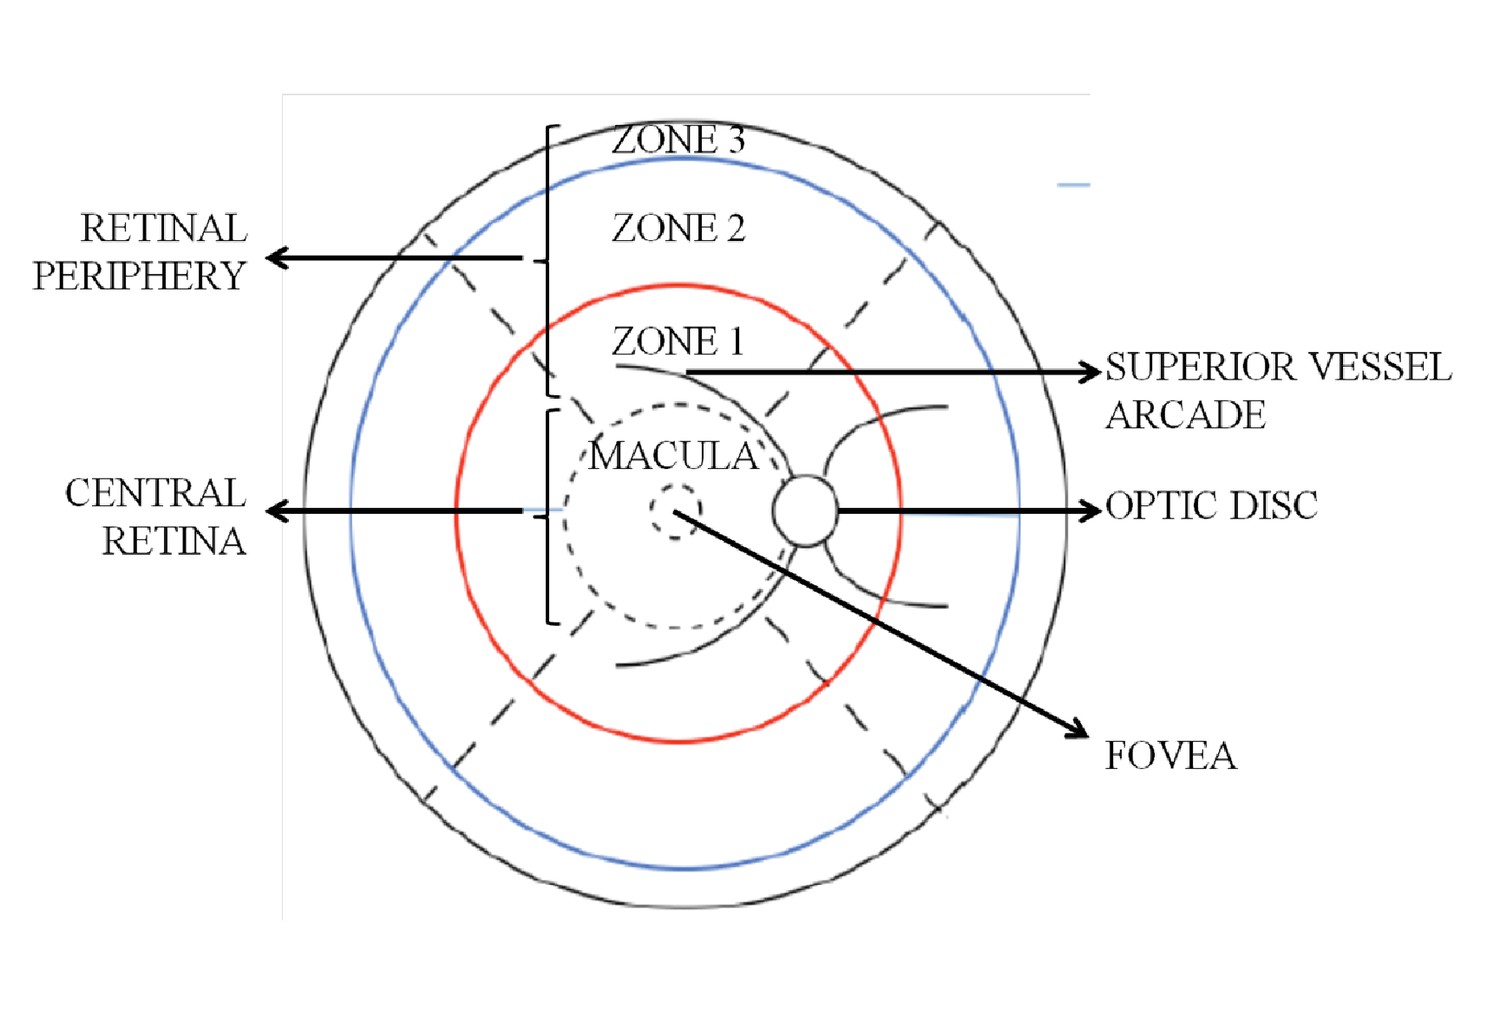
Retinal zones used for clinical grading.
https://doi.org/10.7554/eLife.32208.033Tables
Table 1
Associations with death in 817 subjects with admission retinal exam and retinopathy-positive paediatric cerebral malaria, 137 of whom died and 680 survived.
Retinal features are presented for the worse eye. Estimates are from unadjusted logistic regression. p≤0.01 is bold.
Variable name | Units | Died | Survived | Association with death | ||||||
|---|---|---|---|---|---|---|---|---|---|---|
| Numerical characteristics | Numerical characteristics | OR | 95% CI | p | ||||||
| Demographics | ||||||||||
| Age (median, IQR) | months | 35 | 23–59 | 136 | 39 | 27–58.75 | 680 | 0.99 | 0.00–1.00 | 0.43 |
| Weight (median, IQR) | kg | 11 | 9–15 | 137 | 12 | 10–15 | 680 | 0.97 | 0.93–1.02 | 0.22 |
| Height (median, IQR) | cm | 89 | 79–103 | 135 | 92 | 83–103 | 671 | 0.99 | 0.98–1.00 | 0.15 |
| Sex (%) | boy | 48.9 | 66 | 50.29 | 680 | 1.06 | 0.73–1.53 | 0.77 | ||
| girl | 51.1 | 69 | 49.71 | |||||||
| Clinical | ||||||||||
| Coma score (%) | 0 | 23.3 | 32 | 9.85 | 67 | 3.57 | 2.13–5.88 | <0.001 | ||
| 1 | 41.6 | 57 | 37.7 | 256 | 2.13 | 1.28–3.57 | 0.003 | |||
| 2 | 35.0 | 48 | 52.5 | 357 | reference | |||||
| Respiratory distress (%) | Present | 48.9 | 67 | 39.0 | 265 | 1.5 | 1.04–2.17 | 0.03 | ||
| Absent | 51.1 | 70 | 61.0 | 415 | ||||||
| Convulsions at admission (%) | Present | 12.4 | 17 | 14.9 | 98 | 0.83 | 0.45–1.44 | 0.51 | ||
| Absent | 87.6 | 120 | 85.4 | 574 | ||||||
| Temperature (median, IQR) | degrees C | 38.7 | 37.8–39.5 | 137 | 38.9 | 38–39.7 | 680 | 0.89 | 0.77–1.03 | 0.12 |
| Systolic BP (median, IQR) | mmHg | 100 | 90–110 | 127 | 100 | 90–110 | 652 | 0.99 | 0.99–1.01 | 0.63 |
| Pulse (median, IQR) | beats/min | 156 | 136.5–170.5 | 137 | 152 | 136.75–169 | 678 | 1.0 | 0.99–1.01 | 0.98 |
| Duration of coma (median, IQR) | Hours | 7 | 4–18 | 110 | 7 | 4–17 | 558 | 0.99 | 0.98–1.01 | 0.29 |
| Duration of fever (median, IQR) | Hours | 48 | 33.25–72 | 130 | 60 | 43.25–72 | 652 | 0.99 | 0.99–1.00 | 0.09 |
| Hypoglycaemia on ward (%) | Present | 14.6 | 20 | 7.81 | 53 | 2.02 | 1.16–3.5 | 0.012 | ||
| Absent | 85.4 | 117 | 92.1 | 626 | ||||||
| Laboratory | ||||||||||
| Parasitaemia (median, IQR) | #cells | 79052 | 16695–357000 | 134 | 68076 | 11700–298000 | 649 | 1.0 | 0.99–1.00 | 0.27 |
| White cell count (median, IQR) | #cells | 11300 | 6925–18225 | 120 | 9200 | 6600–13725 | 630 | 1.0 | 1.00–1.00 | 0.004 |
| Haematocrit (median, IQR) | % | 19.5 | 15–24.75 | 136 | 20 | 15.8–25 | 673 | 0.99 | 0.97–1.02 | 0.69 |
| Lactate (median, IQR) | mmol/L | 8.75 | 5.38–12.78 | 92 | 5.3 | 3.2–9.9 | 519 | 1.11 | 1.06–1.16 | <0.001 |
| HRP2 (median, IQR) | ng/ml | 8838.5 | 4435.5–15102.3 | 120 | 5765 | 2471.5–10031 | 609 | 1.0 | 1.00–1.00 | 0.004 |
| HIV (%) | Positive | 22.5 | 29 | 14.9 | 88 | 1.66 | 1.03–2.66 | 0.036 | ||
| Negative | 77.5 | 100 | 85.1 | 503 | ||||||
| Ophthalmoscopy | ||||||||||
| Retinal haemorrhage (%) | >50 | 16.0 | 22 | 4.7 | 32 | 3.4 | 1.78–6.5 | <0.001 | ||
| 21 to 50 | 11.0 | 15 | 6.50 | 44 | 1.69 | 0.85–3.34 | 0.14 | |||
| 6 to 20 | 13.1 | 18 | 19.0 | 129 | 0.69 | 0.38–1.27 | 0.23 | |||
| 1 to 5 | 32.9 | 45 | 42.9 | 291 | 0.76 | 0.48–1.23 | 0.27 | |||
| None | 27.0 | 37 | 27.0 | 183 | reference | |||||
| Macular whitening (%) | >1 | 23.9 | 32 | 14.8 | 100 | 2.31 | 1.16–4.59 | 0.017 | ||
| 1/3 to 1 | 28.4 | 38 | 25.1 | 170 | 1.61 | 0.83–3.12 | 0.16 | |||
| <1/3 | 37.3 | 50 | 45.2 | 306 | 1.18 | 0.63–2.22 | 0.61 | |||
| None | 10.5 | 14 | 14.9 | 101 | reference | |||||
| Foveal whitening (% of foveal zone) | >2/3 | 23.3 | 31 | 11.5 | 78 | 3.39 | 1.83–6.26 | <0.001 | ||
| 1/3 to 2/3 | 18.1 | 24 | 15.2 | 103 | 1.99 | 1.05–3.74 | 0.03 | |||
| <1/3 | 42.8 | 57 | 46.8 | 316 | 1.54 | 0.90–2.62 | 0.11 | |||
| none | 15.8 | 21 | 26.5 | 179 | reference | |||||
| Temporal whitening (%) | 3 | 10.0 | 13 | 12.9 | 87 | 0.83 | 0.41–1.66 | 0.60 | ||
| 2 | 24.6 | 32 | 18.4 | 124 | 1.43 | 0.83–2.47 | 0.20 | |||
| 1 | 41.5 | 54 | 43.1 | 290 | 1.03 | 0.64–1.67 | 0.89 | |||
| none | 23.9 | 31 | 25.6 | 172 | reference | |||||
| Orange vessels, temporal quadrant (%) | present | 44.6 | 58 | 21.7 | 145 | 2.9 | 1.96–4.3 | <0.001 | ||
| absent | 55.4 | 72 | 78.3 | 523 | ||||||
| White vessels, temporal quadrant (%) | present | 25.4 | 33 | 24.3 | 162 | 1.06 | 0.69–1.64 | 0.78 | ||
| absent | 74.6 | 97 | 75.8 | 506 | ||||||
| White capillaries (%) | present | 26.9 | 35 | 33.1 | 221 | 0.75 | 0.49–1.13 | 0.17 | ||
| absent | 73.1 | 95 | 66.9 | 447 | ||||||
| Papilloedema (%) | present | 39.0 | 53 | 21.8 | 148 | 2.29 | 1.55–3.38 | <0.001 | ||
| absent | 61.0 | 83 | 78.2 | 530 | ||||||
| Disc hyperaemia (%) | present | 48.7 | 54 | 35.3 | 212 | 1.73 | 1.15–2.61 | 0.008 | ||
| absent | 51.4 | 57 | 64.7 | 388 | ||||||
Table 2
Summary of clinicopathology dataset.
https://doi.org/10.7554/eLife.32208.005| Clinicopathological investigation (per MR feature) | Number of cases analysed | Number of retinal layers analysed | Number of vessels counted |
|---|---|---|---|
| Vessel changes (H and E; GFAP; FGN; ICAM-1) | |||
| PO block analysis | 27 | -- | 100 |
| Calotte analysis | 6 | -- | 100 |
| Punch biopsies | 4 | -- | 50 |
| Retinal whitening (VEGFR1; AQP4) | |||
| Macular analysis | 20 | 4 | -- |
| Peripheral retinal analysis | 21 | 4 | -- |
Table 3
Retinal pathological features and scores for 29 study subjects in the clinicopathology dataset
https://doi.org/10.7554/eLife.32208.006Case n. | MR* Grade | Eye† | Vessel changes | ||||||||
|---|---|---|---|---|---|---|---|---|---|---|---|
| (Q)‡ | Vessels§ | Localization# | Haem¶ | Macular whitening¥ | Central retinal whitening (overall score)** | Peripheral whitening (score) | Whitening: retinal quadrants | Papill- oedemah†† (score) | |||
| 1 | 2 | RE | 4 Q | Ven + Cap | All quadrants | >50 | 1/3–1 DA | 4 | 3 | 4 Q | 2 |
| 2 | 2 | RE | 4 Q | Ven + Cap | All quadrants | 1–5 | ≥1 DA | 6 | 3 | 4 Q | 2 |
| 3 | 2 | LE | 4 Q | Ven | All quadrants | 1–5 | ≥1 DA | 6 | 1.75 | 4 Q | 2 |
| 4 | 2 | RE | 4 Q | Ven | All quadrants | >50 | 1/3–1 DA | 5 | 1.5 | T + N | 0 |
| 5 | 2 | RE | 3 Q | Ven + Cap | T + N + S | 1–5 | ≥1 DA | 6 | 2.7 | T + N + S | 0 |
| 6 | 2 | RE | 2 Q | Ven | T + S | >50 | <1/3 DA | 2 | 0.75 | T + S | 2 |
| 7 | 2 | LE | None | None | 0 | 6–20 | ≥1 DA | 6 | 0.25 | T | 2 |
| 8 | 2 | RE | None | None | 0 | 0 | ≥1 DA | 6 | 2 | 4 Q | 2 |
| 9 | 2 | LE | 4 Q | Ven + Cap | All quadrants | 0 | ≥1 DA | 6 | 1 | 4 Q | 0 |
| 10 | 2 | LE | None | None | 0 | 21–50 | 1/3–1 DA | 4 | 1.5 | 4 Q | 0 |
| 11 | 2 | LE | 3 Q | NA | NA | 0 | ≥1 DA | 4 | 2 | 4 Q | 0 |
| 12 | 2 | LE | None | None | 0 | 6–20 | 1/3–1 DA | 4 | 0 | 0 | 2 |
| 13 | 2 | LE | None | None | 0 | 1–5 | ≥1 DA | 6 | 1 | 4 Q | 0 |
| 14 | 2 | RE | NA | NA | NA | 1–5 | 1/3–1 DA | 4 | NA | NA | 2 |
| 15 | 2 | LE | 3 Q | Ven + Cap | T + N + S | 1–5 | <1/3 DA | 2 | 0.7 | T + N + S | 0 |
| 16 | 2 | LE | 3 Q | Ven | T + N + S | 1–5 | <1/3 DA | 2 | 0.5 | I + N | 0 |
| 17 | 1 | RE | 1 Q | None | 0 | 0 | <1/3 DA | 2 | 1 | T + S | 2 |
| 18 | 1 | RE | 1 Q | Cap | T | 0 | <1/3 DA | 2 | 1 | 4Q | 0 |
| 19 | 1 | RE | None | None | 0 | 1–5 | <1/3 DA | 2 | 1 | T + N | 0 |
| 20 | 1 | LE | None | None | 0 | 1–5 | <1/3 DA | 2 | 0 | NA | 0 |
| 21 | 1 | LE | None | None | 0 | None | None | 0 | 0.25 | 0 | 0 |
| 22 | 0 | RE | None | None | 0 | None | None | 0 | 0 | 0 | 0 |
| 23 | 0 | LE | None | None | 0 | None | None | 0 | 0 | 0 | 0 |
| 24 | 0 | RE | None | None | 0 | None | None | 0 | 0 | 0 | 0 |
| 25 | 0 | LE | None | None | 0 | None | None | 0 | 0 | 0 | 0 |
| 26 | 0 | LE | None | None | 0 | None | None | 0 | 0 | 0 | 0 |
| 27 | 0 | RE | None | None | 0 | None | None | 0 | 0 | 0 | 0 |
| 28 | 0 | LE | None | None | 0 | None | None | 0 | 0 | 0 | 0 |
| 29 | 0 | RE | None | None | 0 | >50 | None | 0 | 0 | 0 | 0 |
-
*MR = malarial retinopathy. Grade was defined based on percentage of retinal vessels with sequestration (Beare et al., 2004) as explained in Methods. Last peripheral parasitaemia (expressed as asexual pRBCs/μl blood), geometric means reported) was: 42,200 (Grade 0), 43,212 (Grade 1) and 9357 (Grade 2).
†Eye: RE = right eye; LE = left eye vessel changes:
-
‡(Q)=number of retinal quadrants affected.
§Vessels: Ven = venules; Cap = capillaries.
-
#Localisation of vessel changes: I = inferior; N = Nasal; S = superior; T = temporal.
¶Haem = no. of retinal haemorrhages.
-
¥Extent of whitening is shown for macula in disc areas (DA).
**Central whitening (overall score)=sum of macular and foveal whitening scores assigned as: 1 =<1/3 DA or FA, 2 = 1/3–1 DA or 1/3-2/3FA, 3 =>1 DA or >2/3FA.
-
††Papilloedema is the swelling of optic disc caused by increased intracranial pressure. The significance of papilloedema in cerebral malaria is not clear; however, it is the strongest risk factor for poor outcome among comatose children with clinical cerebral malaria.
Table 4
Relationship between severe sequestration (pigmented/late parasitised RBCs sequestered around 360° of the lumen circumference) and orange discoloration visible clinically and on gross pathology in 412 venules (diameter 10–50 μm) from nine cases
https://doi.org/10.7554/eLife.32208.010| Orange discolouration | |||
|---|---|---|---|
| + | - | ||
| Severe sequestration | + | 188 | 5 |
| - | 24 | 195 | |
Table 5
Frequency of intravascular filling defects (worse eye) on fluorescein angiography manual grading by involvement of retinal vessel in 259 children with MR-positive disease and FA within 24 hr of admission and unadjusted association with death (n = 35) and coma recovery of consciousness (BCS ≥3; n = 225)
https://doi.org/10.7554/eLife.32208.023Retinal vessel | Sequestration | Died* | Survived* | Association with death | ||||||
|---|---|---|---|---|---|---|---|---|---|---|
| N | % | Total | N | % | Total | OR | 95% CI | p | ||
| large venules | present | 26 | 86.7 | 30 | 172 | 79.3 | 217 | 1.70 | 0.56–5.12 | 0.35 |
| absent | 4 | 13.3 | 45 | 20.7 | ||||||
| small venules | present | 29 | 96.7 | 30 | 211 | 98.1 | 215 | 0.88 | 0.71–1.09 | 0.23 |
| absent | 1 | 3.33 | 4 | 1.86 | ||||||
| post-capillary venules | present | 25 | 96.2 | 26 | 201 | 98.5 | 204 | 0.37 | 0.04–3.70 | 0.4 |
| absent | 1 | 3.85 | 3 | 1.47 | ||||||
| pre-capillary arterioles | present | 19 | 76.0 | 25 | 109 | 56.2 | 194 | 2.47 | 0.94–6.45 | 0.065 |
| absent | 6 | 24.0 | 85 | 43.8 | ||||||
| small arterioles | present | 15 | 51.7 | 29 | 93 | 42.9 | 217 | 1.43 | 0.66–3.11 | 0.37 |
| absent | 14 | 48.3 | 124 | 57.1 | ||||||
| large arterioles | present | 9 | 30.0 | 30 | 29 | 13.2 | 219 | 2.81 | 1.17–6.72 | 0.02 |
| absent | 21 | 70.0 | 190 | 86.8 | ||||||
Key resources table
Antibodies used for immunohistochemistry analysis of the clinicopathology dataset
https://doi.org/10.7554/eLife.32208.026| Antigen | Specificity | MR feature | Manufacturer (clone); RRID* | Host† (class) | Ag retrieval‡ | Dilution§ | Chromogen# | Staining quantification | Ref |
|---|---|---|---|---|---|---|---|---|---|
| VEGFR1 | Retinal cell | Retinal whitening Tissue effects | Abcam (Y103); AB_778798 | Rb mAb (IgG) | Heat (High pH) | 1:2,000, 30 min RT | DAB | Automated | (Kaur et al., 2008a) |
| Aquaporin 4 (AQP4) | Neuroglia | Retinal whitening Tissue effects Intracellular oedema | Abcam (EPR7040); AB_11143780 | Rb mAb (IgG) | Heat (Low pH) | 1:500, 60 min RT | AEC | Automated | (Medana et al., 2011) |
| Glial fibrillaryacidicprotein (GFAP) | Neuroglia (late activation) | Vessel discolouration | Dako; AB_10013482 | Rb pAb | Proteinase K | 1:2,000, o.n. 4°C | AEC | Manual | (Hiscott et al., 1984) |
| ICAM-1 | Endothelium Neuroglia(early activation) | Vessel discolouration | Abcam (EP1442Y); AB_870702 | Rb mAb (IgG) | Heat (High pH) | 1:100, 30 min RT | DAB | Manual | (Lee et al., 2000) |
| CD61 | Platelets and precursors | Retinal whitening Vessel discolouration | Thermo Scientific; AB_929194 | Ms mAb (IgG1) | Heat (High pH) | 1:100, 32 min RT | DAB or AEC | Manual | (White et al., 2009) |
| CD34 (II) | Endothelium | Vessel discolouration | Dako (QBEnd-10); AB_2074478 | Ms mAb (IgG1k) | Heat (High pH) | 1:100, 30 min RT | DAB | Manual | (Kaur et al., 2008a) |
| Smooth muscle actin (SMA) | Pericyte (venules only) | Vessel discolouration | Dako (1A4); AB_2223500 | Ms mAb (IgG2ak) | Heat (Low pH) | 1:2,000, o.n. 4°C | AEC | Manual | (Kaur et al., 2008b) |
| Platelet derived growth factor receptor β (PDGFRβ) | Pericyte (signalling) | Vessel discolouration | Abcam (Y92); AB_777165 | Rb mAb (IgG) | Heat (Low pH) | 1:100, 30 min RT | DAB | Manual | (Armulik et al., 2005) |
-
*RRID: Research Resource Identifiers.
†Host: Rb = rabbit; Ms = mouse; mAb = monoclonal antibody; pAb = polyclonal antibody.
-
‡Ag retrieval: heat-mediated antigen retrieval was performed in high pH solution (10 mM Tris/1 mM EDTA, pH 9.0) or low pH solution (trisodium citrate 10 mM, pH 6.0). Proteinase K was from Dako (ready-to-use solution).
§Dilution and incubation time: RT = room temperature; o.n. = over night.
-
#Chromogen: AEC: 3-amino-9-ethylcarbazole; DAB = 3,3'-diaminobenzidine. Reported references are from main manuscript.
Additional files
-
Supplementary file 1
Comparison of children without and with admission retinal exam data.
- https://doi.org/10.7554/eLife.32208.027
-
Transparent reporting form
- https://doi.org/10.7554/eLife.32208.028
Download links
A two-part list of links to download the article, or parts of the article, in various formats.
Downloads (link to download the article as PDF)
Open citations (links to open the citations from this article in various online reference manager services)
Cite this article (links to download the citations from this article in formats compatible with various reference manager tools)
Neurovascular sequestration in paediatric P. falciparum malaria is visible clinically in the retina
eLife 7:e32208.
https://doi.org/10.7554/eLife.32208


