Evolution and cell-type specificity of human-specific genes preferentially expressed in progenitors of fetal neocortex
- Max Planck Institute of Molecular Cell Biology and Genetics, Germany
- Universitätsklinikum Carl Gustav Carus, Technische Universität Dresden, Germany
- Max Planck Institute for the Physics of Complex Systems, Germany
Figures
Figure 1 with 1 supplement
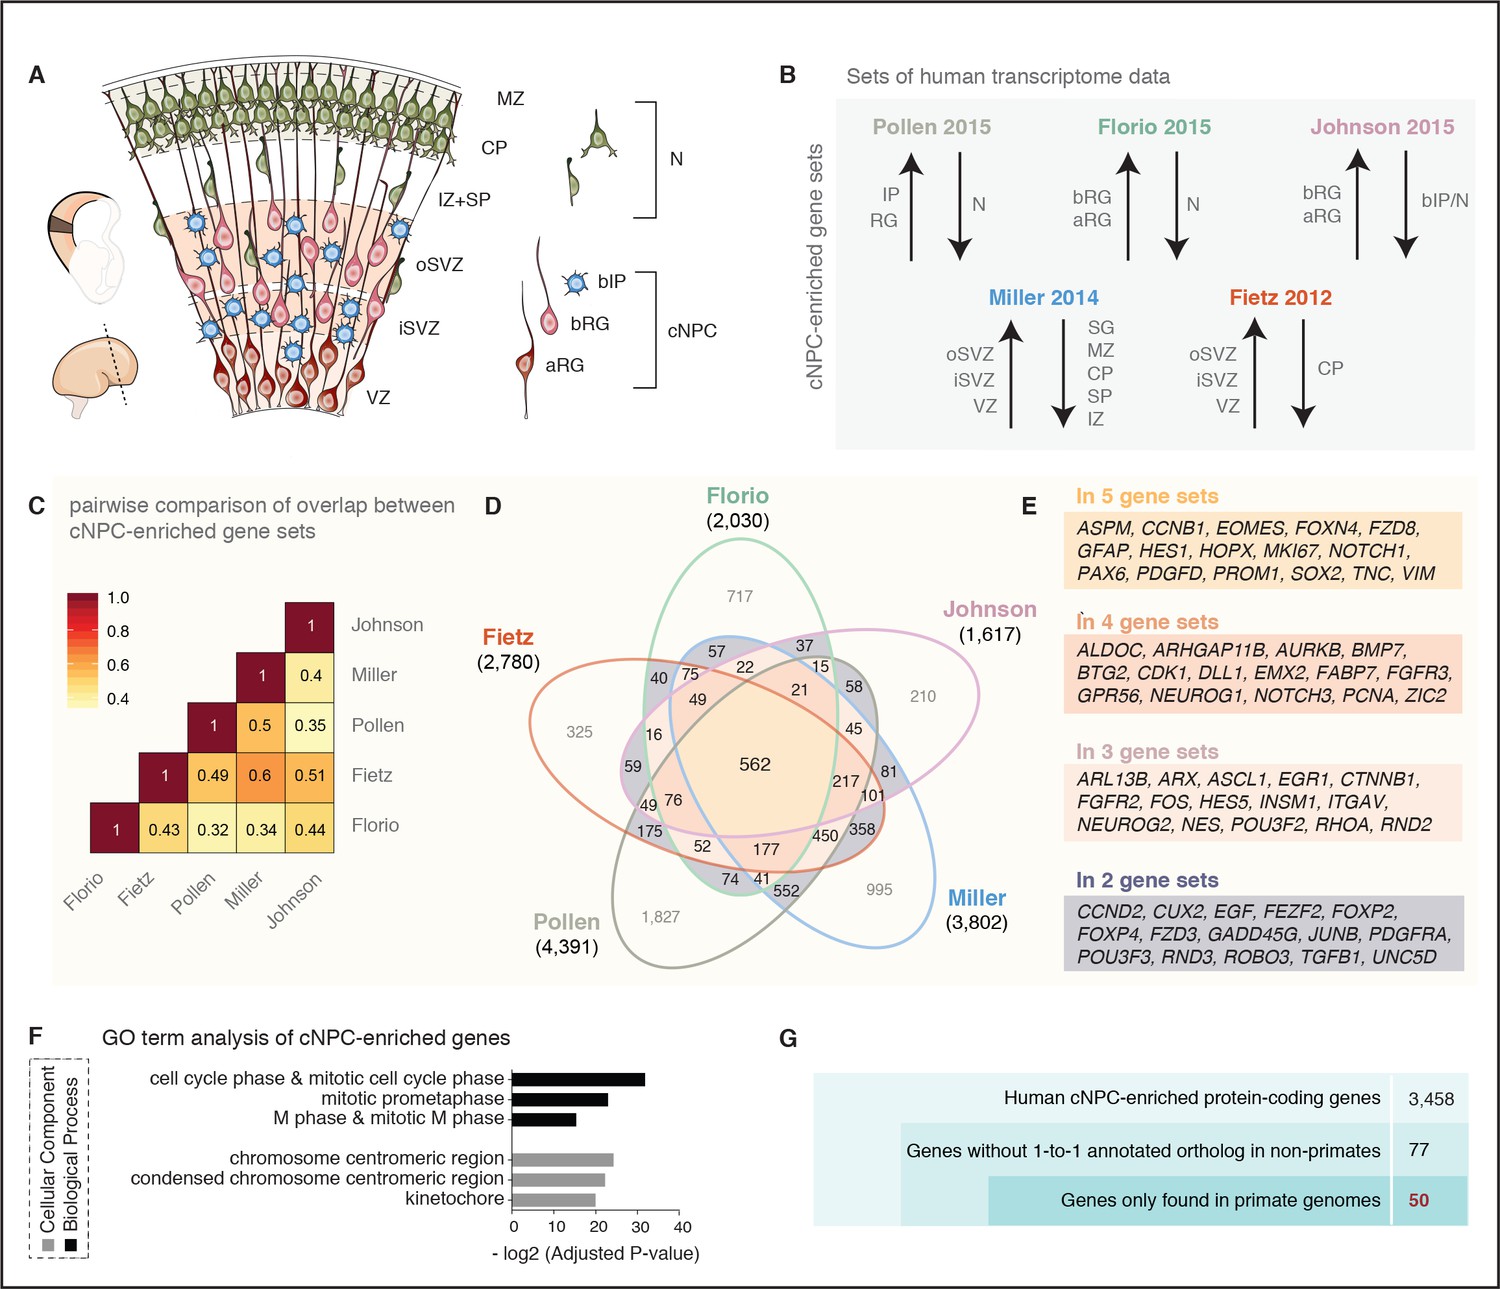
A screen for human cNPC-enriched protein-coding genes and determination which of them have orthologs only in primates.
(A) Cartoon illustrating the main zones and neural cell types in the fetal human cortical wall that were screened for differential gene expression in the human transcriptome datasets as depicted in (B). Adapted from (Florio et al., 2017). SP, subplate; MZ, marginal zone. (B) The indicated five published transcriptome datasets from fetal human neocortical tissue (Fietz et al., 2012; Miller et al., 2014) and cell populations (Florio et al., 2015; Johnson et al., 2015; Pollen et al., 2015), were screened for protein-coding genes showing higher levels of mRNA expression in the indicated germinal zones and cNPC types than in the non-proliferative zones and neurons. (C) Heat map showing a pairwise comparison of the degree of overlap between the five gene sets of human genes with preferential expression in cNPCs. (D) Venn diagram showing the gene sets of human protein-coding genes displaying the differential gene expression pattern depicted in (B). Numbers within the diagram indicate genes found in two (violet), three (pink), four (orange) or all five (yellow) gene sets. Genes found in at least two gene sets were considered as being cNPC-enriched. (E) Selected genes with established biological roles found in two, three, four, or all five gene sets. (F) GO term analysis of human cNPC-enriched genes. The top three most enriched terms for the category Cellular Component (black bars) and for the category Biological Process (grey bars) are shown. (G) Stepwise analysis leading from the 3458 human cNPC-enriched protein-coding genes to the identification of 50 primate-specific genes.
Figure 1—figure supplement 1
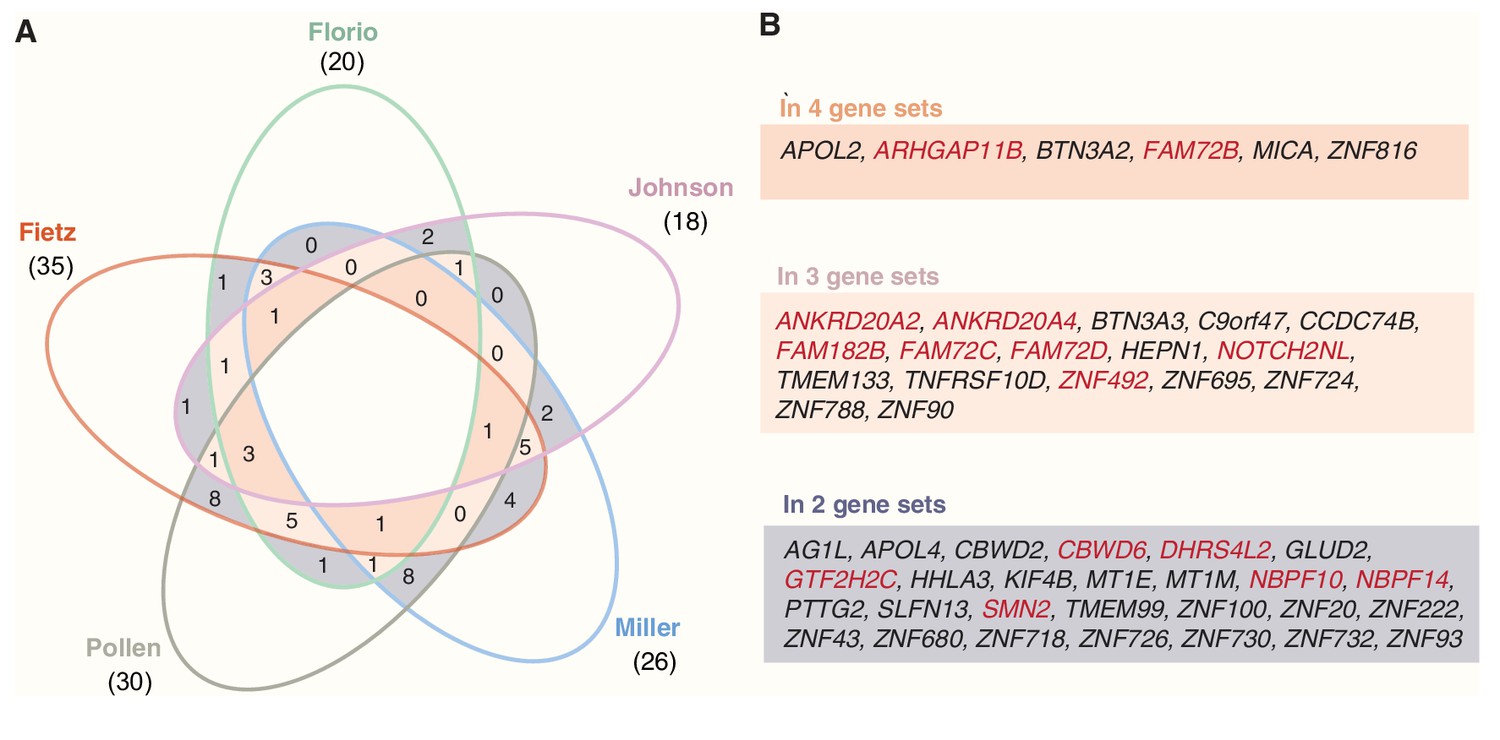
Occurrence of the 50 primate-specific genes in the five gene sets.
(A) Venn diagram showing the numbers of the 50 primate-specific genes that are found in each of the five gene sets, and the numbers found in two (violet), three (pink), or four (orange) gene sets. (B) Specification of the primate-specific genes that are found in two (violet), three (pink), or four (orange) gene sets. Genes depicted in red are human-specific.
Figure 2
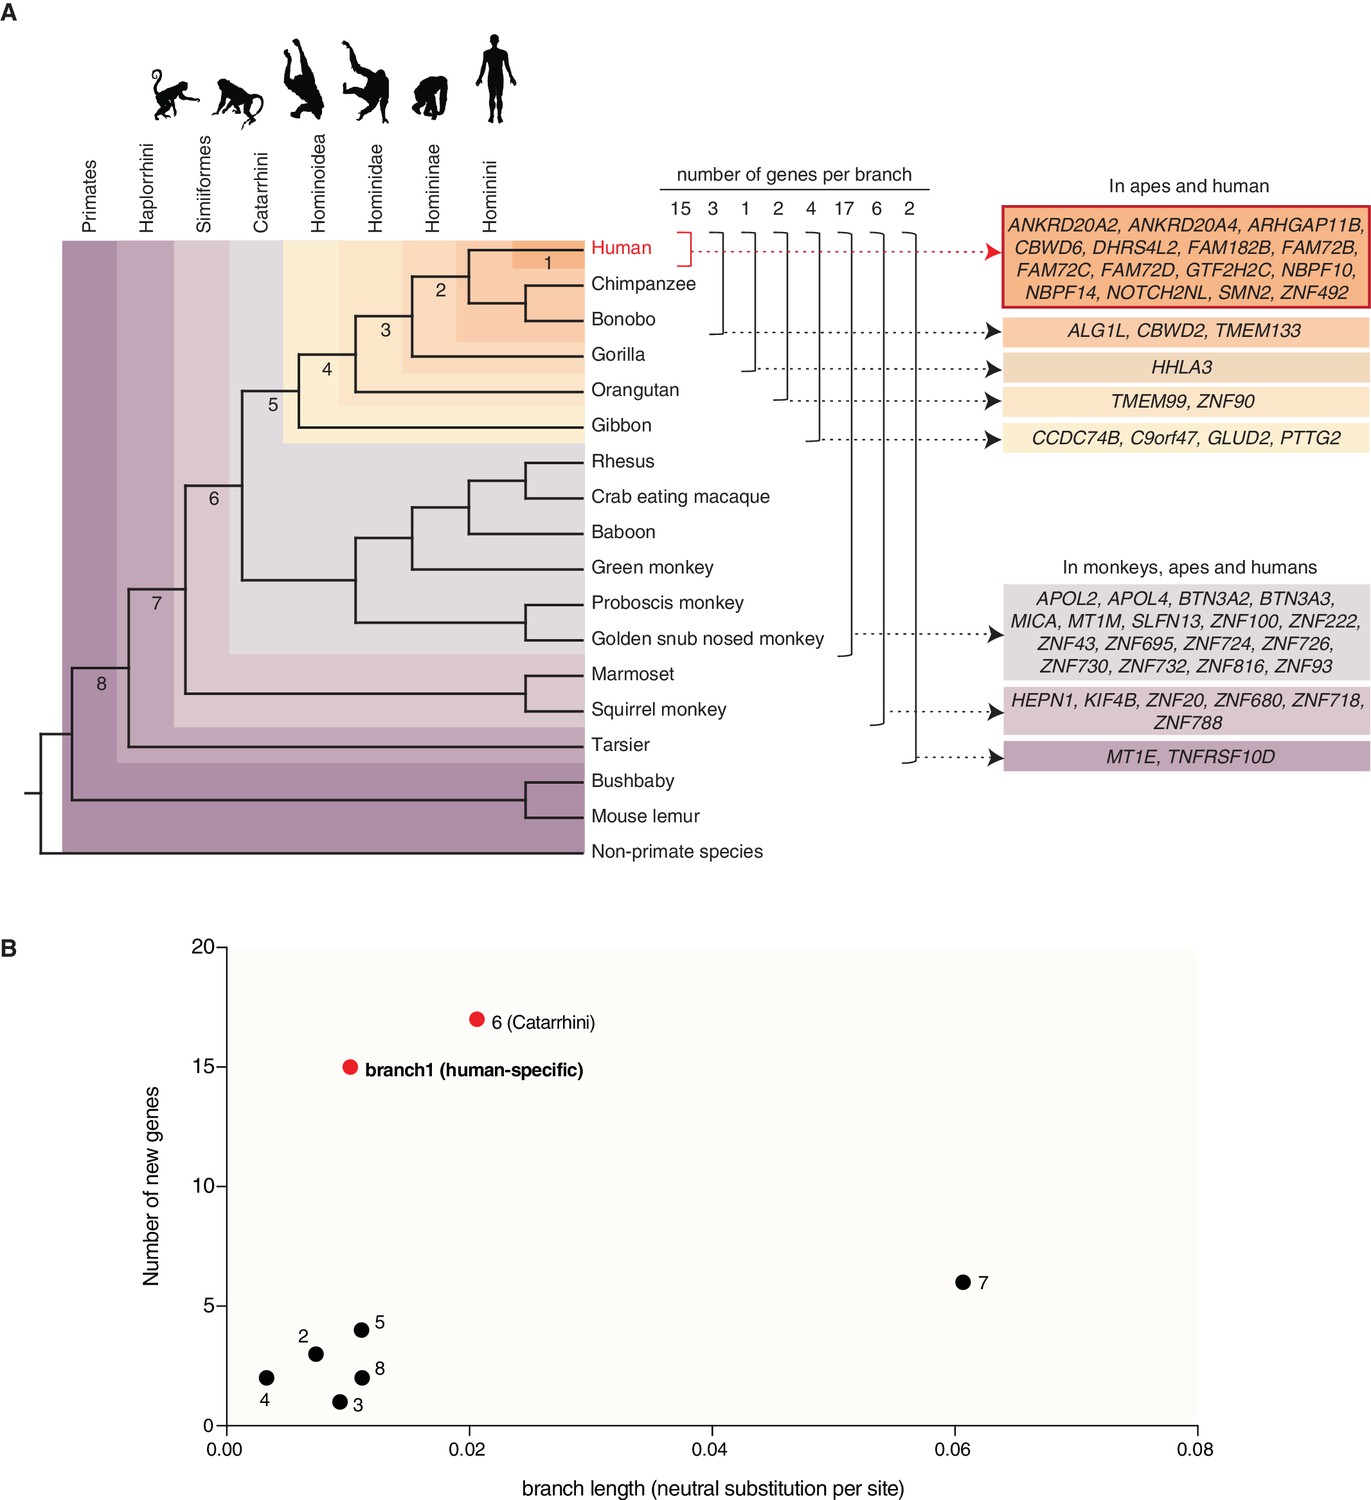
Occurrence of the primate-specific genes in the various primate clades.
(A) Assignment of the 50 primate-specific genes to a primate clade, based on the primate genome(s) in which an intact reading frame was found in the present analysis. Clades are specified on the top left. The color-coding and brackets indicate the species in each clade analyzed in the present study. Numbers on top of the brackets indicate the number of genes assigned to that clade. Note that the occurrence of the genes in the various clades does not necessarily apply to every species in the clade. (B) Diagram depicting the number of new cNPC-enriched genes as a function of the frequency of occurrence of neutral base pair substitutions in the eight different branches leading to these various clades (branch length). Numbered dots indicate the branches shown in panel (A). Red dots indicate the branches with disproportionately high rates of appearance of new cNPC-enriched genes.
Figure 3
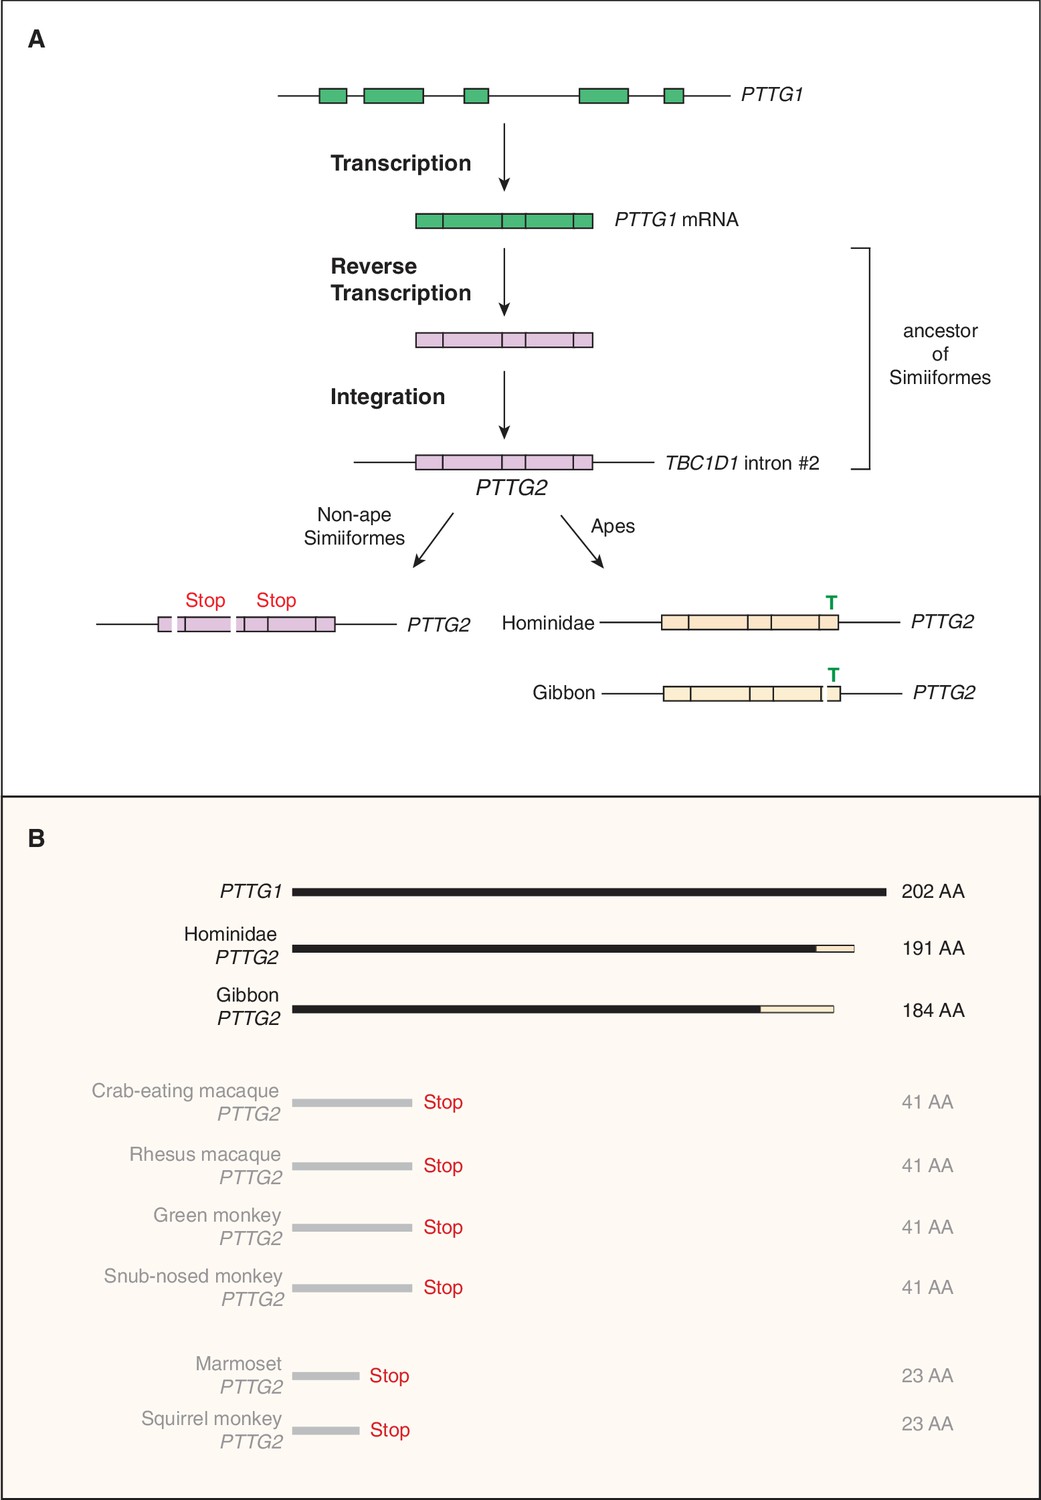
Evolutionary origin of the PTTG2 gene.
(A) Origin of the PTTG2 gene by reverse transcription of the PTTG1 mRNA and insertion as a retroposon into the TBC1D1 locus in the ancestor to New-World monkeys, Old-World monkeys and apes (Simiiformes). (B) Comparison of the PTTG1 and Hominoidea PTTG2 polypeptides, and of the prematurely closed open-reading frames of non-ape Simiiformes PTTG2.
Figure 4 with 2 supplements
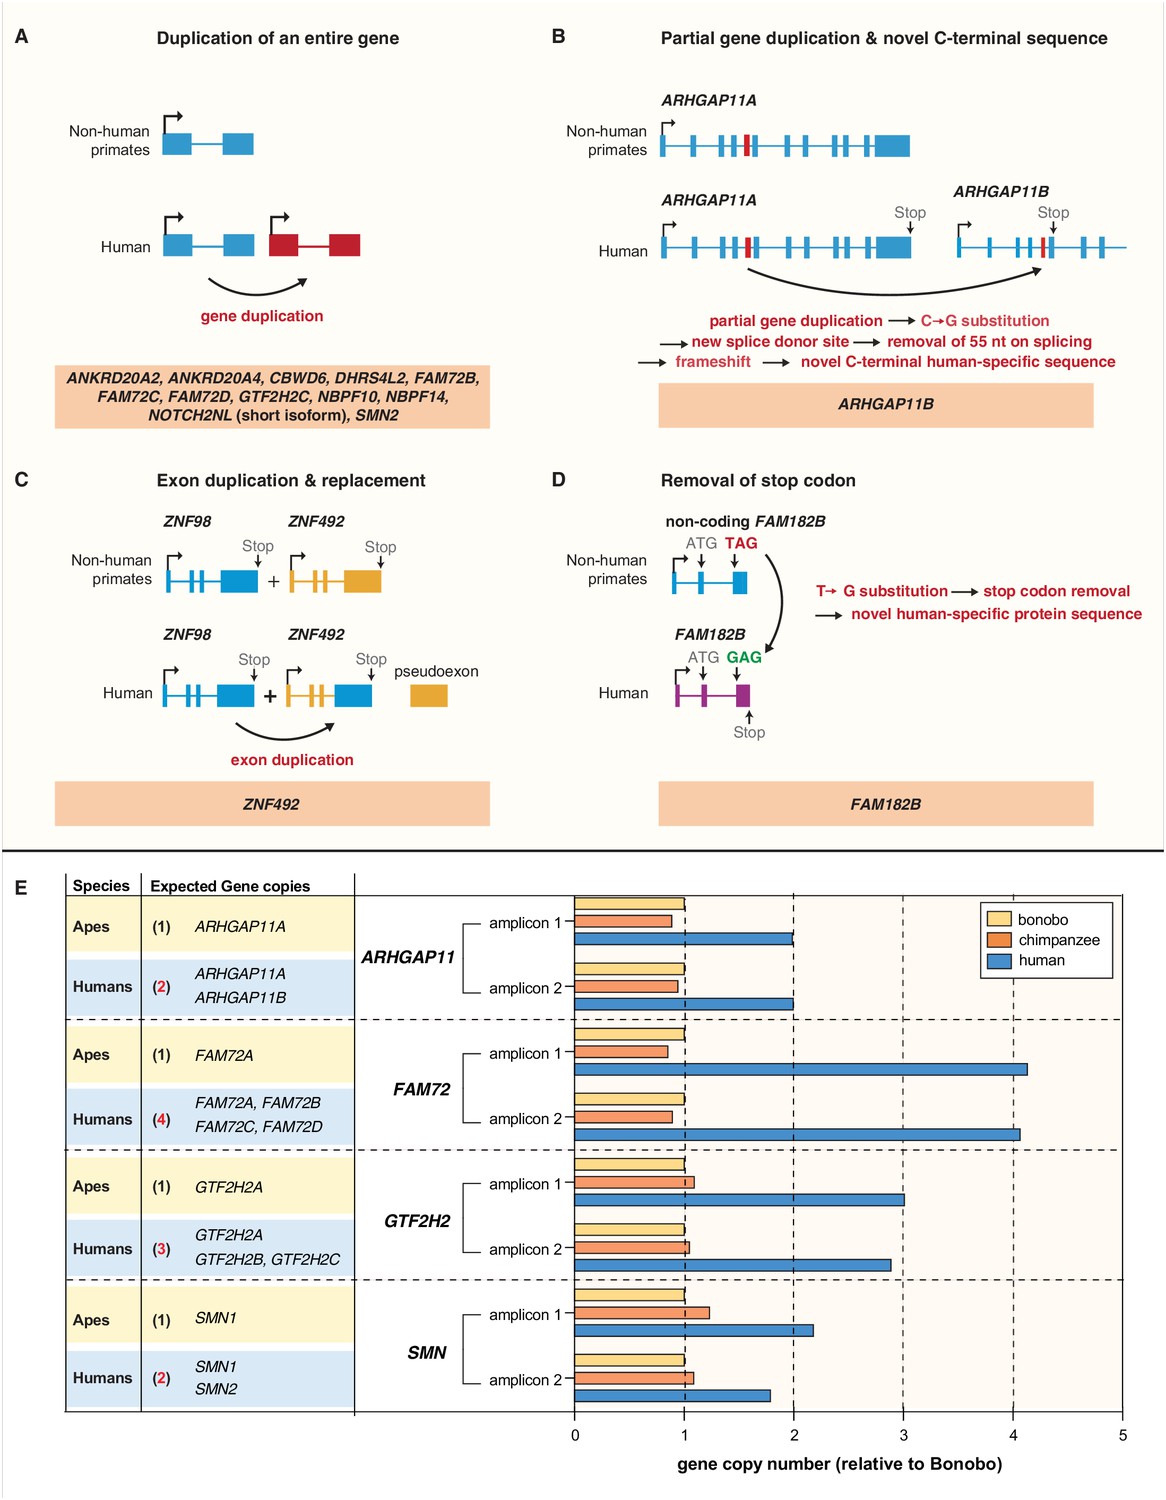
Evolution of the human-specific cNPC-enriched protein-coding genes.
Diagrams depicting the evolutionary origin of the 15 human-specific genes. (A) Duplication of the entire ancestral gene, which applies to 12 of the human-specific genes. NOTCH2NL is included in this group because it initially arose by duplication of the entire NOTCH2 gene. Note that the gene duplication giving rise to SMN2 occurred after the Neandertal – modern human lineage split, whereas the other 11 gene duplications occurred before that split (Dennis et al., 2017). (B) Partial gene duplication giving rise to ARHGAP11B ~ 5 Mya (Riley et al., 2002; Antonacci et al., 2014; Dennis et al., 2017). Note that a single C–>G substitution in exon 5 (red box), which likely occurred after the gene duplication event but before the Neandertal – modern human lineage split, created a new splice donor site, causing a reading frame shift that resulted in a novel, human-specific 47 amino acid C-terminal sequence (Florio et al., 2015; Florio et al., 2016). (C) Exon duplication and replacement giving rise to human ZNF492. Exon 4 of ZNF98 (blue) is duplicated and inserted into intron 3 of ZNF492 (orange), rendering the original ZNF492 exon 4 a pseudoexon. (D) Removal of a stop codon converting the non-coding FAM182B of non-human primates into the protein-coding human FAM182B. A single T–>G substitution removes the stop codon at the 5' end of exon 3, thereby creating an open reading frame (purple). (E) Validation of the human-specific nature of selected human genes by determination of their copy numbers. Human (blue), chimpanzee (orange) and bonobo (yellow) genomic DNA was used as template to perform a qPCR that would generate two distinct amplicons of both, the gene common to all three species (black regular letters) and the human-specific gene(s) under study (red bold letters), as indicated. The relative amounts of amplicons obtained for each of the four gene groups are depicted with the amounts of amplicons obtained with the bonobo genomic DNA as template being set to 1.0. Note that compared to chimpanzee and bonobo genomic DNA, the copy number in human genomic DNA is (i) two-fold higher for ARHGAP11, consistent with the presence of the human-specific gene ARHGAP11B in addition to the common gene ARHGAP11A; (ii) four-fold higher for FAM72, consistent with the presence of the human-specific genes FAM72B, FAM72C and FAM72D in addition to the common gene FAM72A; (iii) three-fold higher for GTF2H2, consistent with the presence of the human-specific genes GTF2H2B (black bold letters, not among the cNPC-enriched genes identified in this study) and GTF2H2C in addition to the common gene GTF2H2A; and (iv) two-fold higher for SMN, consistent with the presence of the human-specific gene SMN2 in addition to the common gene SMN1.
-
Figure 4—source data 1
Human raw data.
This zipped folder contains four data files of human raw data used to generate the graphs presented in Figure 4—figure supplement 2. Data file 1: Human raw data (R1) of pool 1. Data file 2: Human raw data (R2) of pool 1. Data file 3: Human raw data (R1) of pool 2. Data file 4: Human raw data (R2) of pool 2.
- https://doi.org/10.7554/eLife.32332.010
-
Figure 4—source data 2
Bonobo raw data.
This zipped folder contains four data files of bonobo raw data used to generate the graphs presented inFigure 4—figure supplement 2. Data file 5: Bonobo raw data (R1) of pool 1. Data file 6: Bonobo raw data (R2) of pool 1. Data file 7: Bonobo raw data (R1) of pool 2. Data file 8: Bonobo raw data (R2) of pool 2.
- https://doi.org/10.7554/eLife.32332.011
-
Figure 4—source data 3
Chimpanzee raw data.
This zipped folder contains four data files of chimpanzee raw data used to generate the graphs presented in Figure 4—figure supplement 2. Data file 9: Chimpanzee raw data (R1) of pool 1. Data file 10: Chimpanzee raw data (R2) of pool 1. Data file 11: Chimpanzee raw data (R1) of pool 2. Data file 12: Chimpanzee raw data (R2) of pool 2.
- https://doi.org/10.7554/eLife.32332.012
Figure 4—figure supplement 1
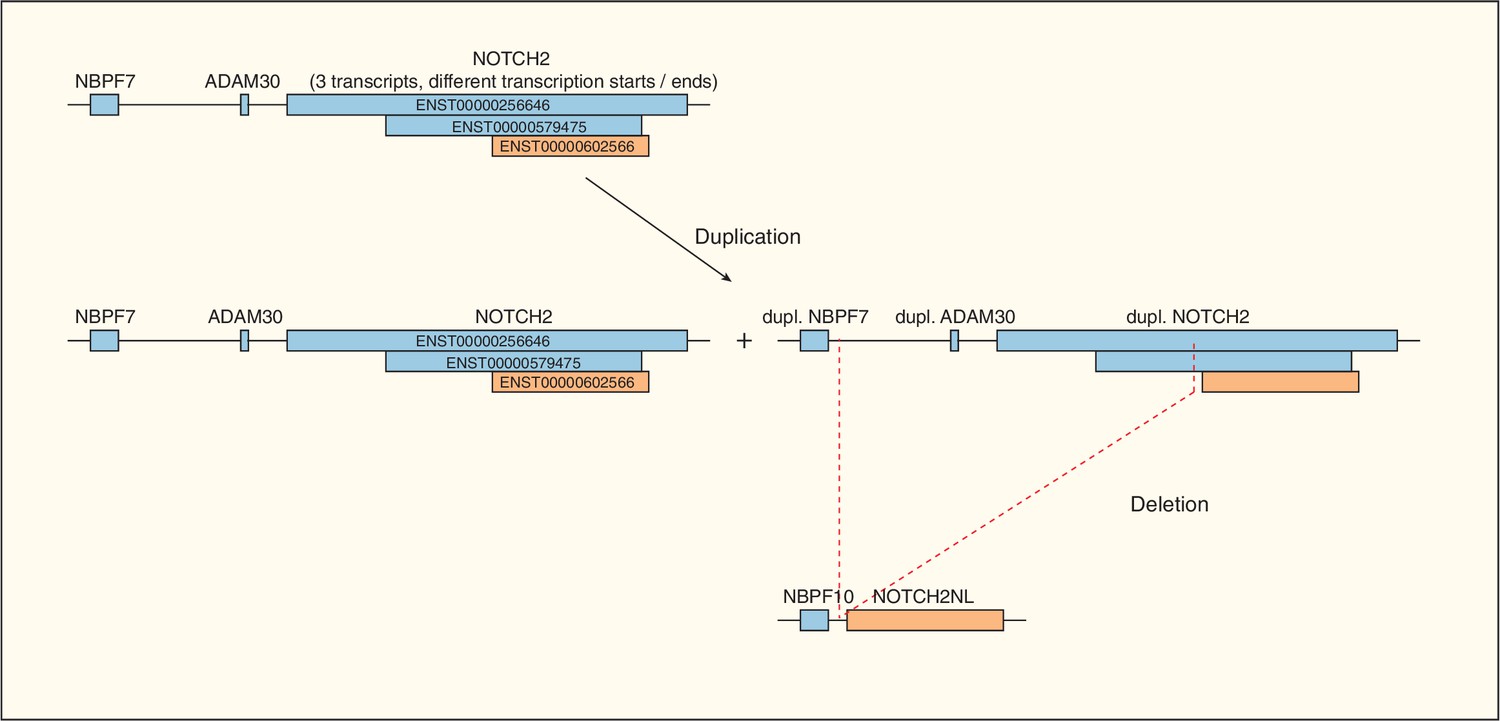
Evolution of NOTCH2NL.
Origin of NOTCH2NL by duplication of the NBPF7, ADAM30 and NOTCH2 genes (blue), followed by deletion (red dashed lines) of the sequence between the duplicated NBPF7 (which becomes NBPF10) and a large portion of the duplicated NOTCH2. Note that three different splice variants of NOTCH2 exist (ENST00000256646, ENST00000579475 (blue) and ENST00000602566 (orange)) and that only the sequence coding for the smallest splice variant (ENST00000602566 (orange)) remained intact and gave rise to NOTCH2NL (orange).
Figure 4—figure supplement 2
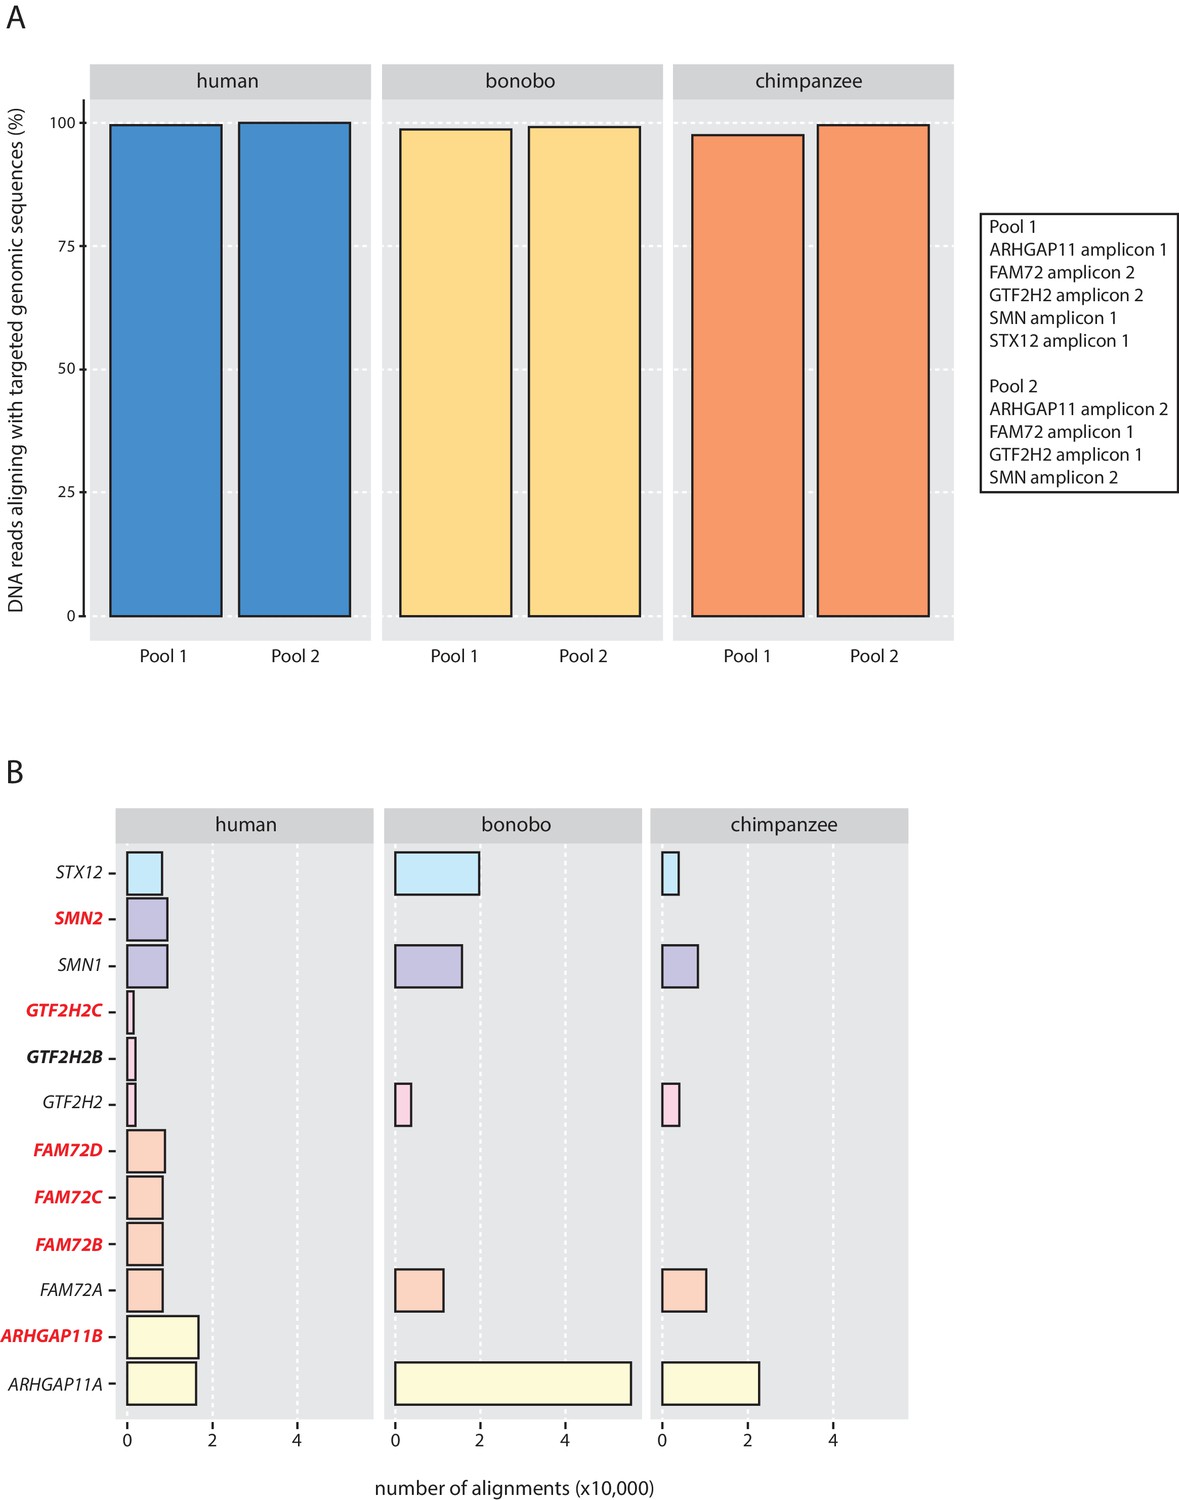
Validation of the genomic qPCR specificity.
(A) Percentage of DNA reads that aligned with the targeted genomic sequences of human (blue), bonobo (yellow) and chimpanzee (orange). (B) Absolute number of DNA reads that aligned with a given targeted genomic sequence. Gene names in bold red letters, cNPC-enriched human-specific genes; gene name in bold black letters, human-specific gene; gene names in regular letters, ancestral genes.
Figure 5 with 1 supplement
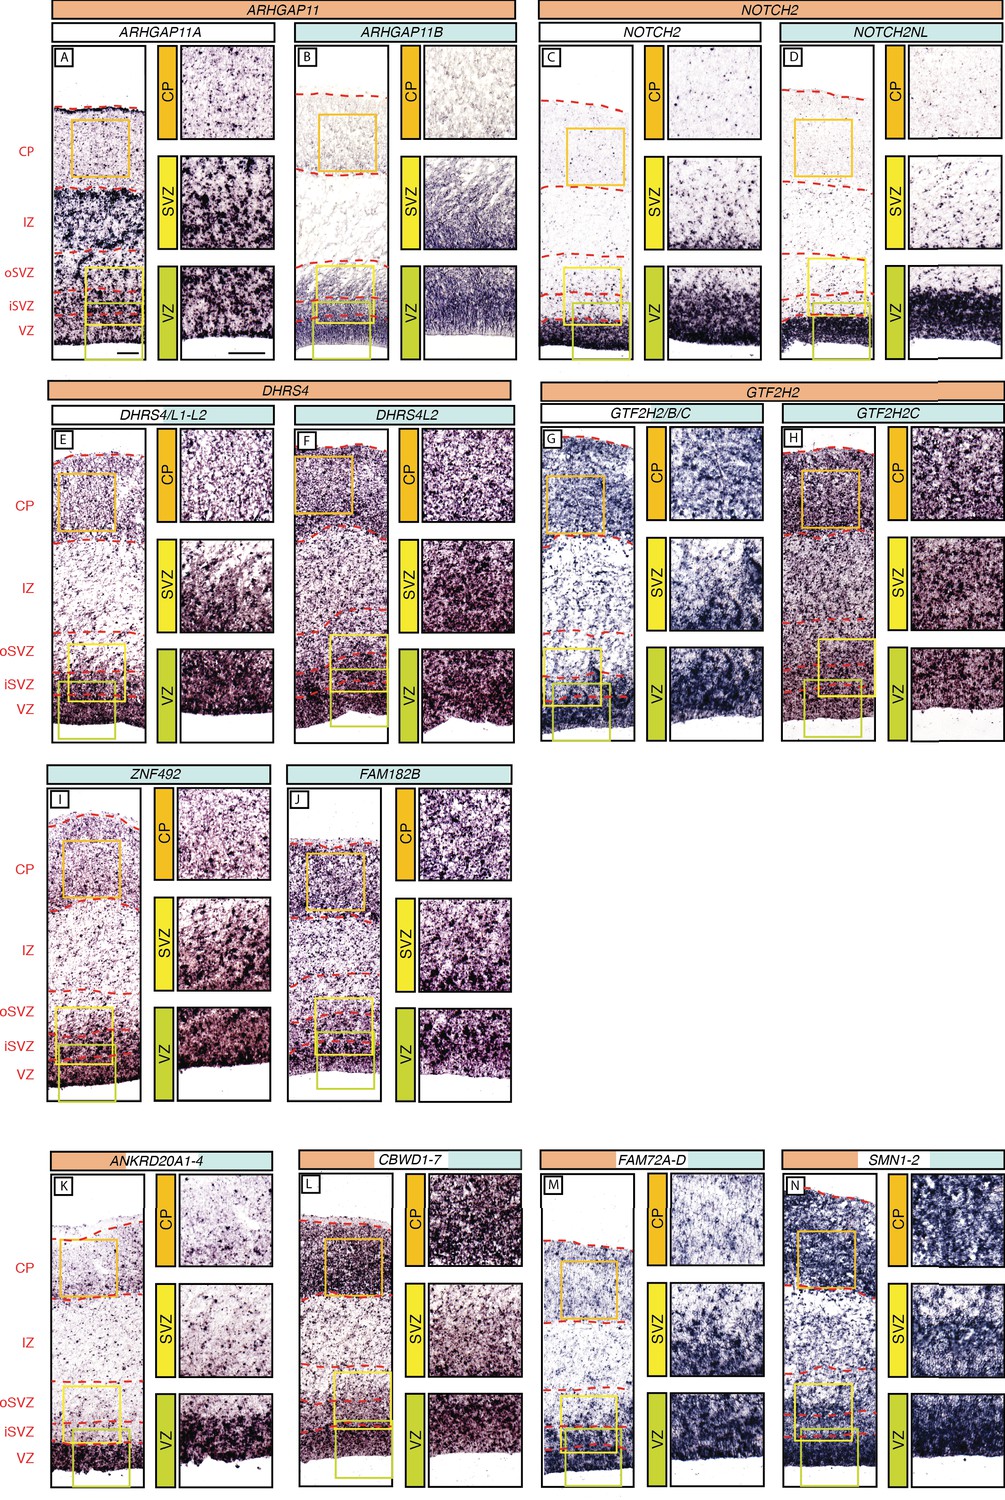
In-situ hybridization analysis of the mRNA levels of the human-specific cNPC-enriched protein-coding genes in the various zones of the fetal neocortical wall.
Coronal sections of human fetal neocortex (13 wpc) were subjected to ISH using probes that (i) are specific for the mRNA of the human-specific gene under study (B, D, F, H, I, J), indicated by the gene name with blue background; (ii) recognize the mRNAs of both the human-specific gene(s) and the paralog gene(s) common to other primates as well (E, G, K, L, M, N), indicated by gene names with white/blue background; or (iii) are specific to the ancestral paralog (A, C), indicated by the gene name with white background. The various zones of the fetal neocortical wall are indicated on the left and by red dashed lines. Green, yellow, and orange boxes indicate areas of the VZ, SVZ and CP, respectively, that are shown at higher magnification in the respective images on the right. Scale bars in A apply to all panels and are 100 µm. Note that an ISH probe yielding a reliable signal for ZNF98 could not be designed.
Figure 5—figure supplement 1
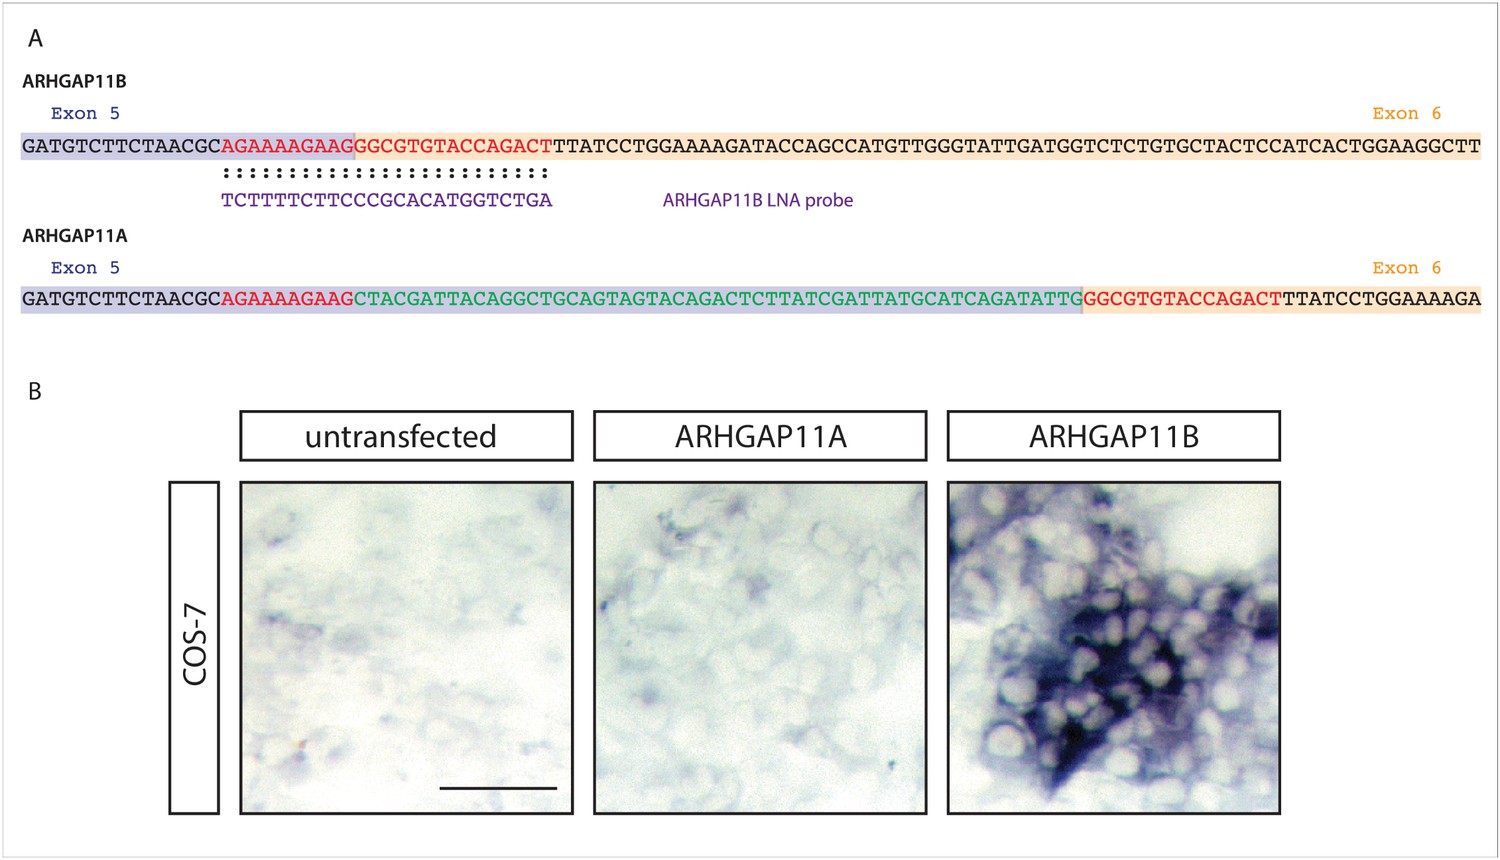
ARHGAP11B-specific ISH probe.
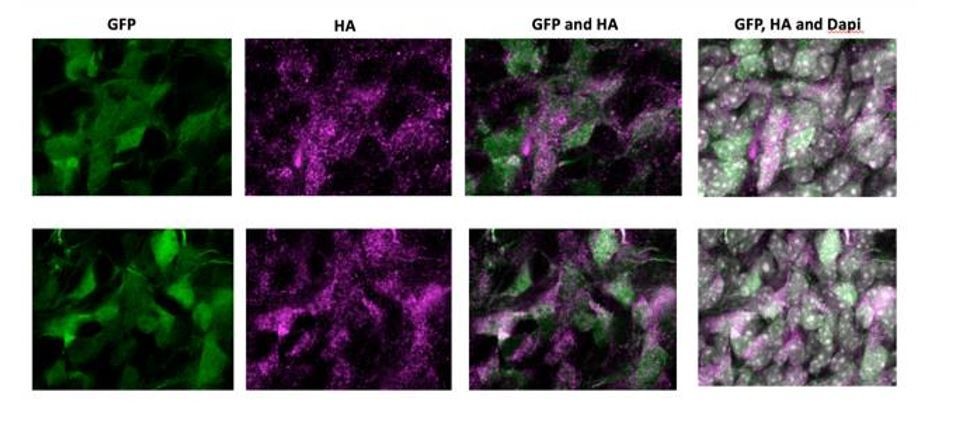
(A) Nucleotide sequences at the exon 5 (purple background) – exon 6 (orange background) junction of the ARHGAP11B (top) and ARHGAP11A (bottom) mRNAs (note that U is depicted as T). The ARHGAP11B LNA ISH probe shown in violet is complementary to the nucleotides shown in red. The 55 nucleotides shown in green are unique to the 3'-end of the ARHGAP11A exon 5 and interfere with the binding of the LNA ISH probe to the ARHGAP11A mRNA, rendering the probe ARHGAP11B-specific. (B) Images of COS-7 cells that were either untransfected, or transfected with either an ARHGAP11A- or ARHGAP11B-expressing construct and stained with the ARHGAP11B LNA ISH probe. Note that an ISH signal is detected only in ARHGAP11B-transfected COS-7 cells, confirming the specificity of the LNA ISH probe for ARHGAP11B. Scale bar, 50 µm.
Figure 6
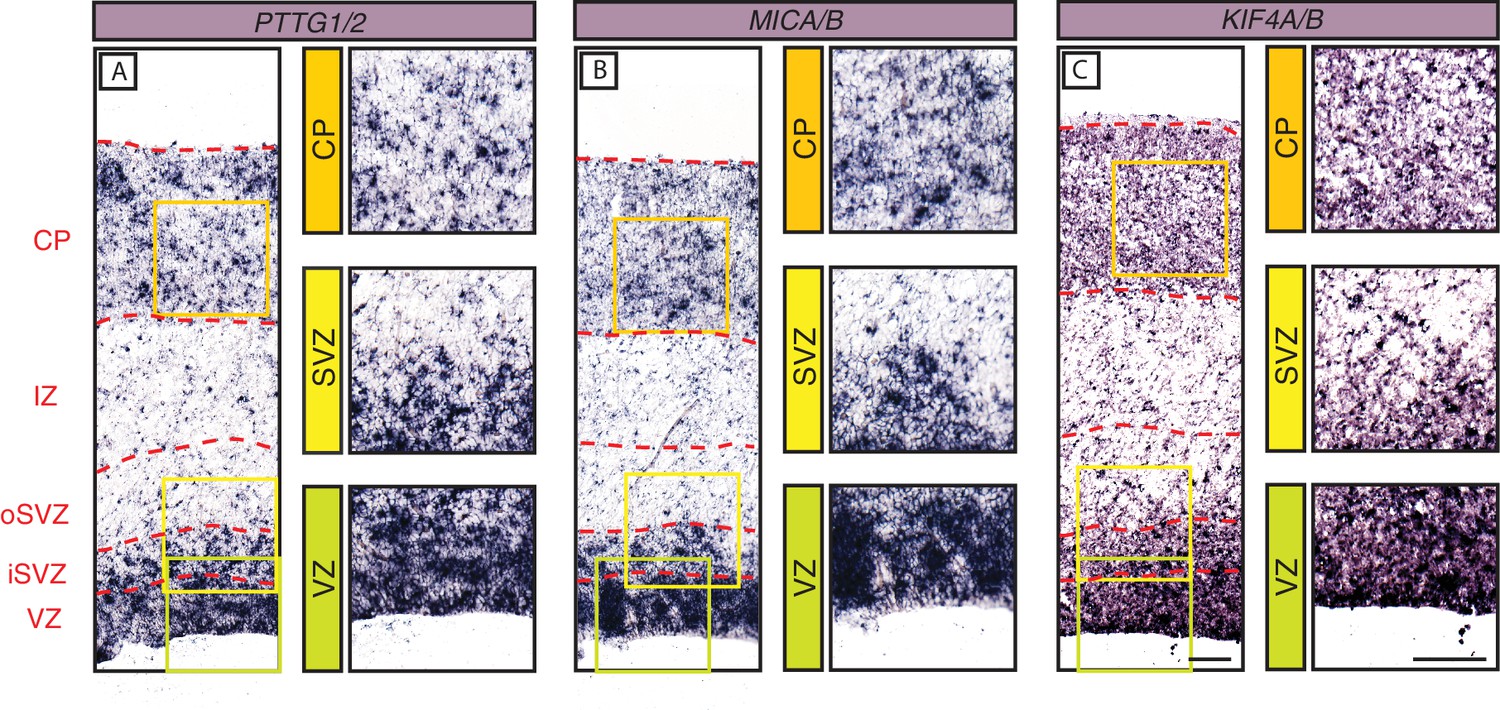
In-situ hybridization analysis of the mRNA levels of three selected primate-specific genes in the various zones of the fetal human neocortical wall.
Coronal sections of human fetal neocortex (13 wpc) were subjected to ISH using probes recognizing the mRNAs of the primate-specific genes PTTG2 (A), MICA (B) and KIF4B (C) and their ancestral paralogs PTTG1 (A), MICB (B), and KIF4A (C). The various zones of the fetal neocortical wall are indicated on the left and by red dashed lines. Green, yellow, and orange boxes indicate areas of the VZ, SVZ, and CP, respectively, that are shown at higher magnification in the respective images on the right. Scale bars in C apply to all panels and are 100 µm.
Figure 7 with 4 supplements
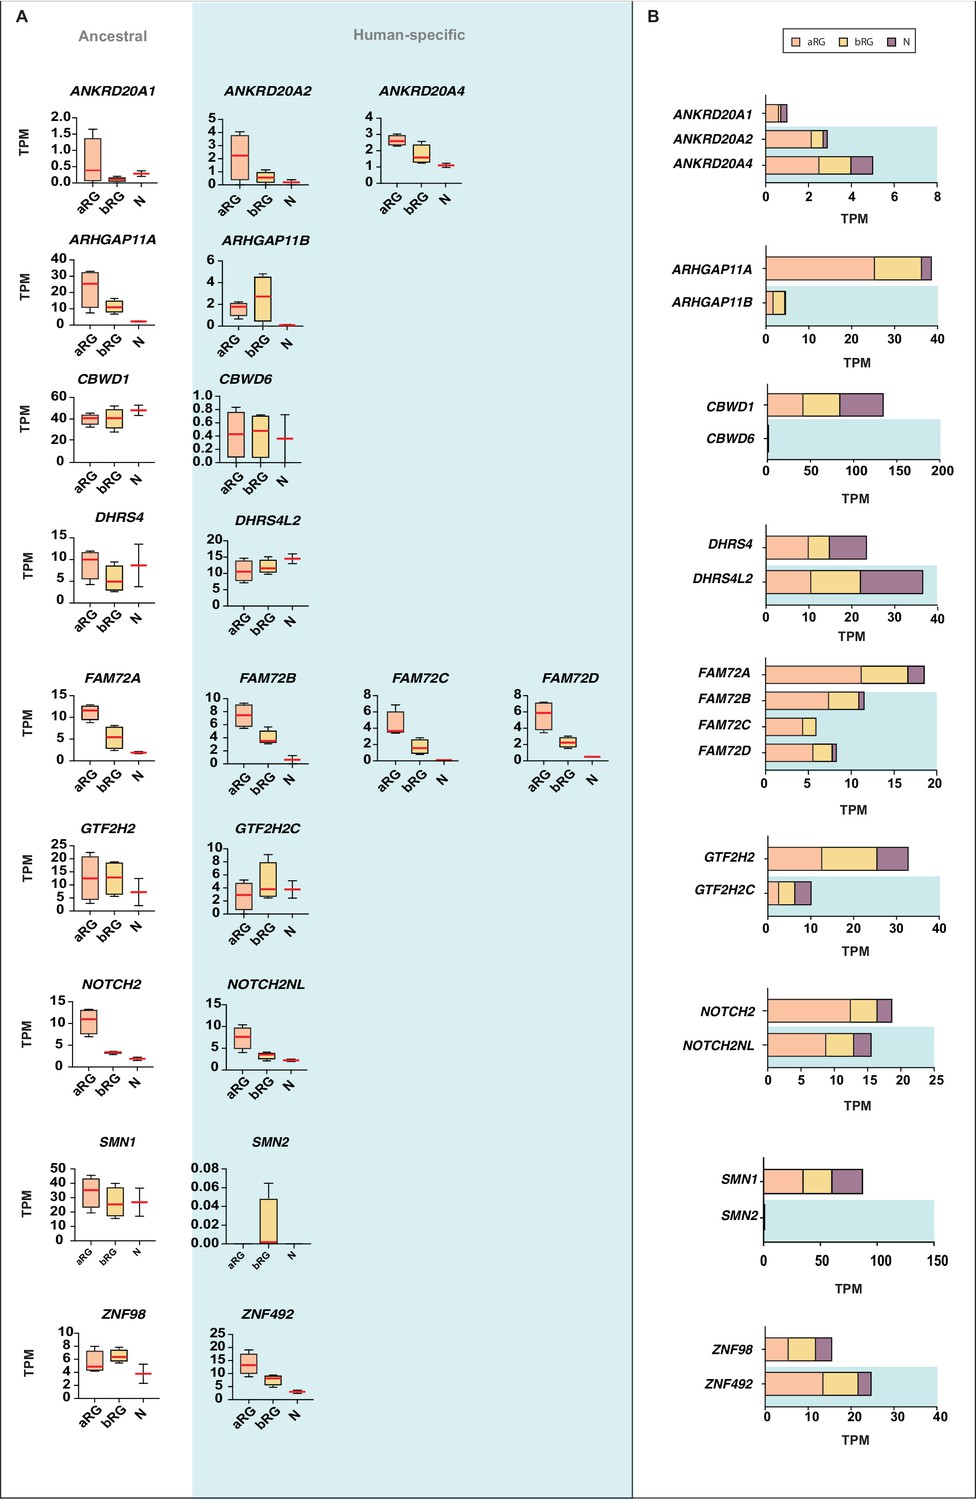
Comparison of the mRNA expression of 12 human-specific cNPC-enriched protein-coding genes with their ancestral paralogs in isolated cell populations enriched in aRG, bRG and neurons from fetal human neocortex.
A previously published genome-wide transcriptome dataset obtained by RNA-Seq of cell populations isolated from fetal human neocortex, that is, aRG (orange) and bRG (yellow) in S-G2-M and a fraction enriched in neurons but also containing bRG in G1 (N, purple) (Florio et al., 2015), was analyzed for the abundance of mRNA-Seq reads assigned to either the indicated human-specific gene(s) under study (blue background) or the corresponding ancestral paralog (white background), using the Kallisto algorithm. (A) Min-max box-and-whiskers plots showing mRNA levels (expressed in Transcripts Per Million, TPM); red lines indicate the median. (B) Stacked bar plots showing the cumulative mRNA expression levels in the indicated cell types (sum of the median TPM values shown in (A)).
-
Figure 7—source data 1
Alignments of the mRNA sequences of ancestral and human-specific paralogs of the orthology groups ANKRD20A, ARHGAP11, CBWD, DHRS4, FAM72, GTF2H2, NOTCH2 and ZNF98.
This zipped folder contains 8 files of alignments between the mRNA sequences of ancestral and human-specific paralogs of the orthology groups ANKRD20A, ARHGAP11, CBWD, DHRS4, FAM72, GTF2H2, NOTCH2 and ZNF98 that were used as a mapping reference to identify paralog-specific mRNA reads in the analysis performed in Figure 7—figure supplement 2.
- https://doi.org/10.7554/eLife.32332.021
Figure 7—figure supplement 1
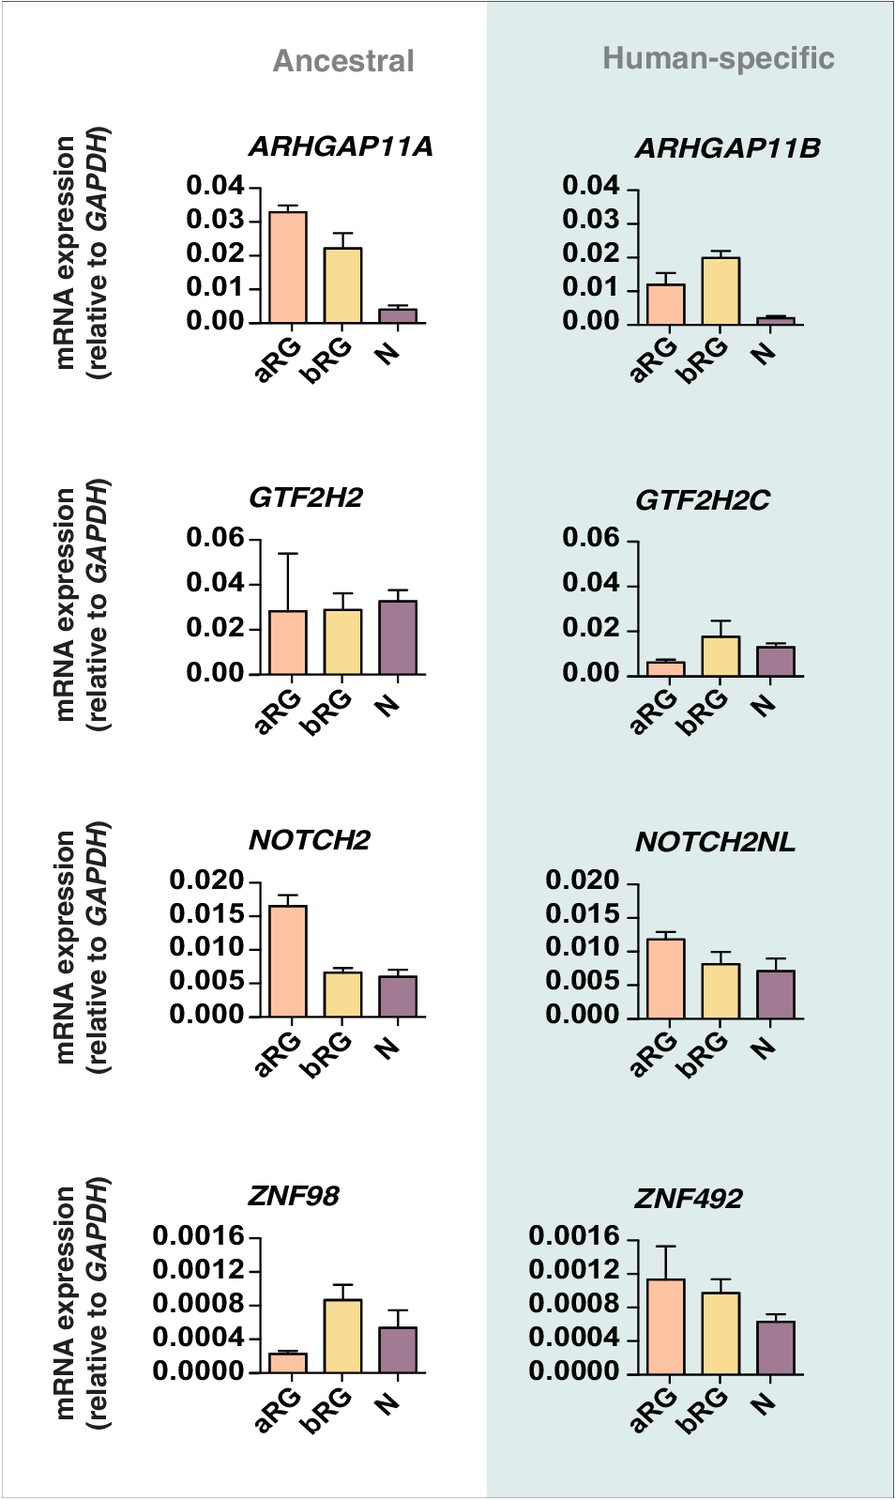
qPCR validation of the Kallisto analysis.
Previously prepared cDNAs of radial glial cell populations (aRG, orange; bRG, yellow) in S-G2-M and of a fraction enriched in neurons but also containing bRG in G1 (N, purple) isolated from fetal human neocortex (Florio et al., 2015) were re-analyzed by qPCR in order to quantify the expression of the human-specific cNPC-enriched genes ARHGAP11B, GTF2H2C, NOTCH2NL, and ZNF492 (blue background) compared to their respective ancestral paralogs ARHGAP11A, GTF2H2, NOTCH2, and ZNF98 (white background). The resulting value for the mRNA level of a given gene is expressed relative to that of GAPDH in the indicated cell type. Error bars indicate the SD of technical replicates (3 PCR amplifications).
Figure 7—figure supplement 2
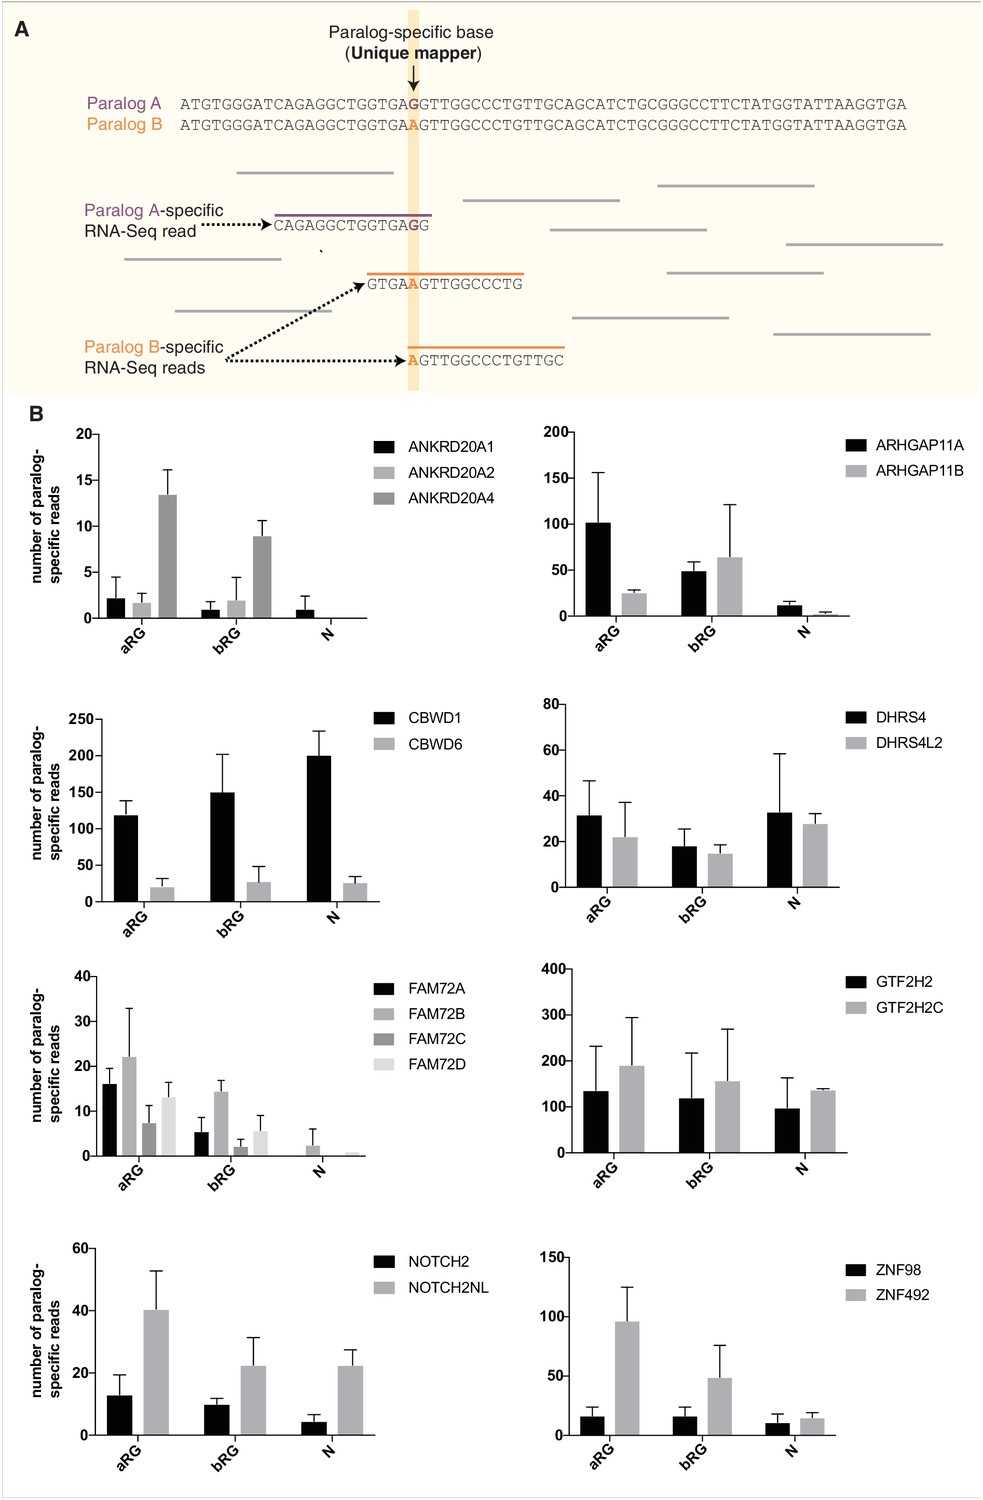
Comparison of the paralog-specific mRNA expression between 11 human-specific cNPC-enriched genes and their respective ancestral paralog in aRG, bRG and neuron-enriched cell populations from fetal human neocortex.
(A) Diagram outlining the strategy used to ascertain paralog-specific mRNA expression in a given cell type of interest. mRNA sequences of an ancestral vs. a human-specific paralog (paralog A vs. B in the example shown) were aligned, and the homologous, yet distinct, core sequences of each alignment were extracted. The corresponding sequences of each paralog were used as a mapping reference for RNA-Seq reads from aRG, bRG and neuron-enriched cell populations from fetal human neocortex (Florio et al., 2015). Only reads aligning to ‘unique mappers’, i.e. paralog-specific sites (SNPs or indels), were used for the analysis shown in (B). In the example shown, paralog-specific reads specific for paralog A or paralog B, as defined by the paralog-specific base (vertical yellow line) are colored in purple and orange, respectively. (B) Bar plots showing the total numbers of paralog-specific RNA-Seq reads (identified as described in (A)) found in aRG vs. bRG vs. neuron-enriched (N) cell populations from fetal human neocortex (Florio et al., 2015). Grey bars indicate human-specific genes; black bars indicate their respective ancestral paralog. Data are the mean of four individual samples isolated from two human specimens; errors bars, SD.
Figure 7—figure supplement 3
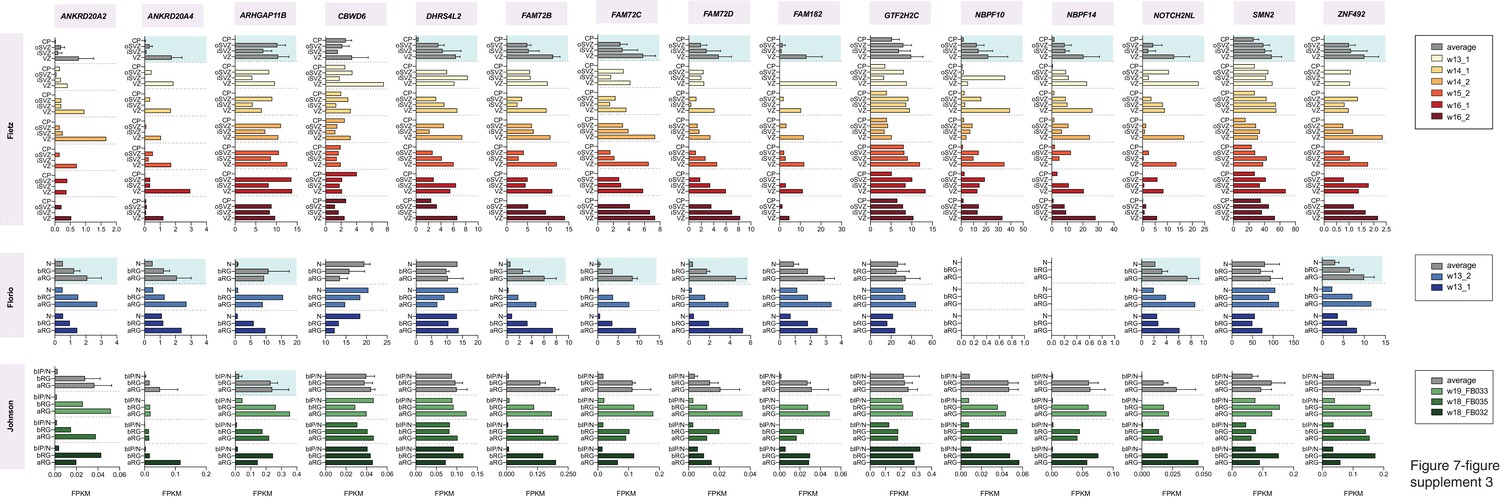
mRNA expression levels of the 15 human-specific, cNPC-enriched, protein-coding genes in the human individuals analyzed in the Fietz et al., Florio et al. and Johnson et al. transcriptome datasets.
Horizontal bars indicate the FPKM values for the mRNA levels of the 15 genes (top) in the indicated germinal zones (Fietz) and cell populations (Florio, Johnson) (left to each plot) in each of the individual human specimen analyzed in Fietz (six specimen), Florio (two specimen) and Johnson (three specimen). Individual specimen are color-coded as indicated in the key on the right, which also gives the gestational age of the specimen (wpc). Average mRNA levels are depicted on top of each plot (grey bars). Error bars indicate SD. Average mRNA levels with blue background indicate genes that are cNPC-enriched in the respective gene set.
Figure 7—figure supplement 4
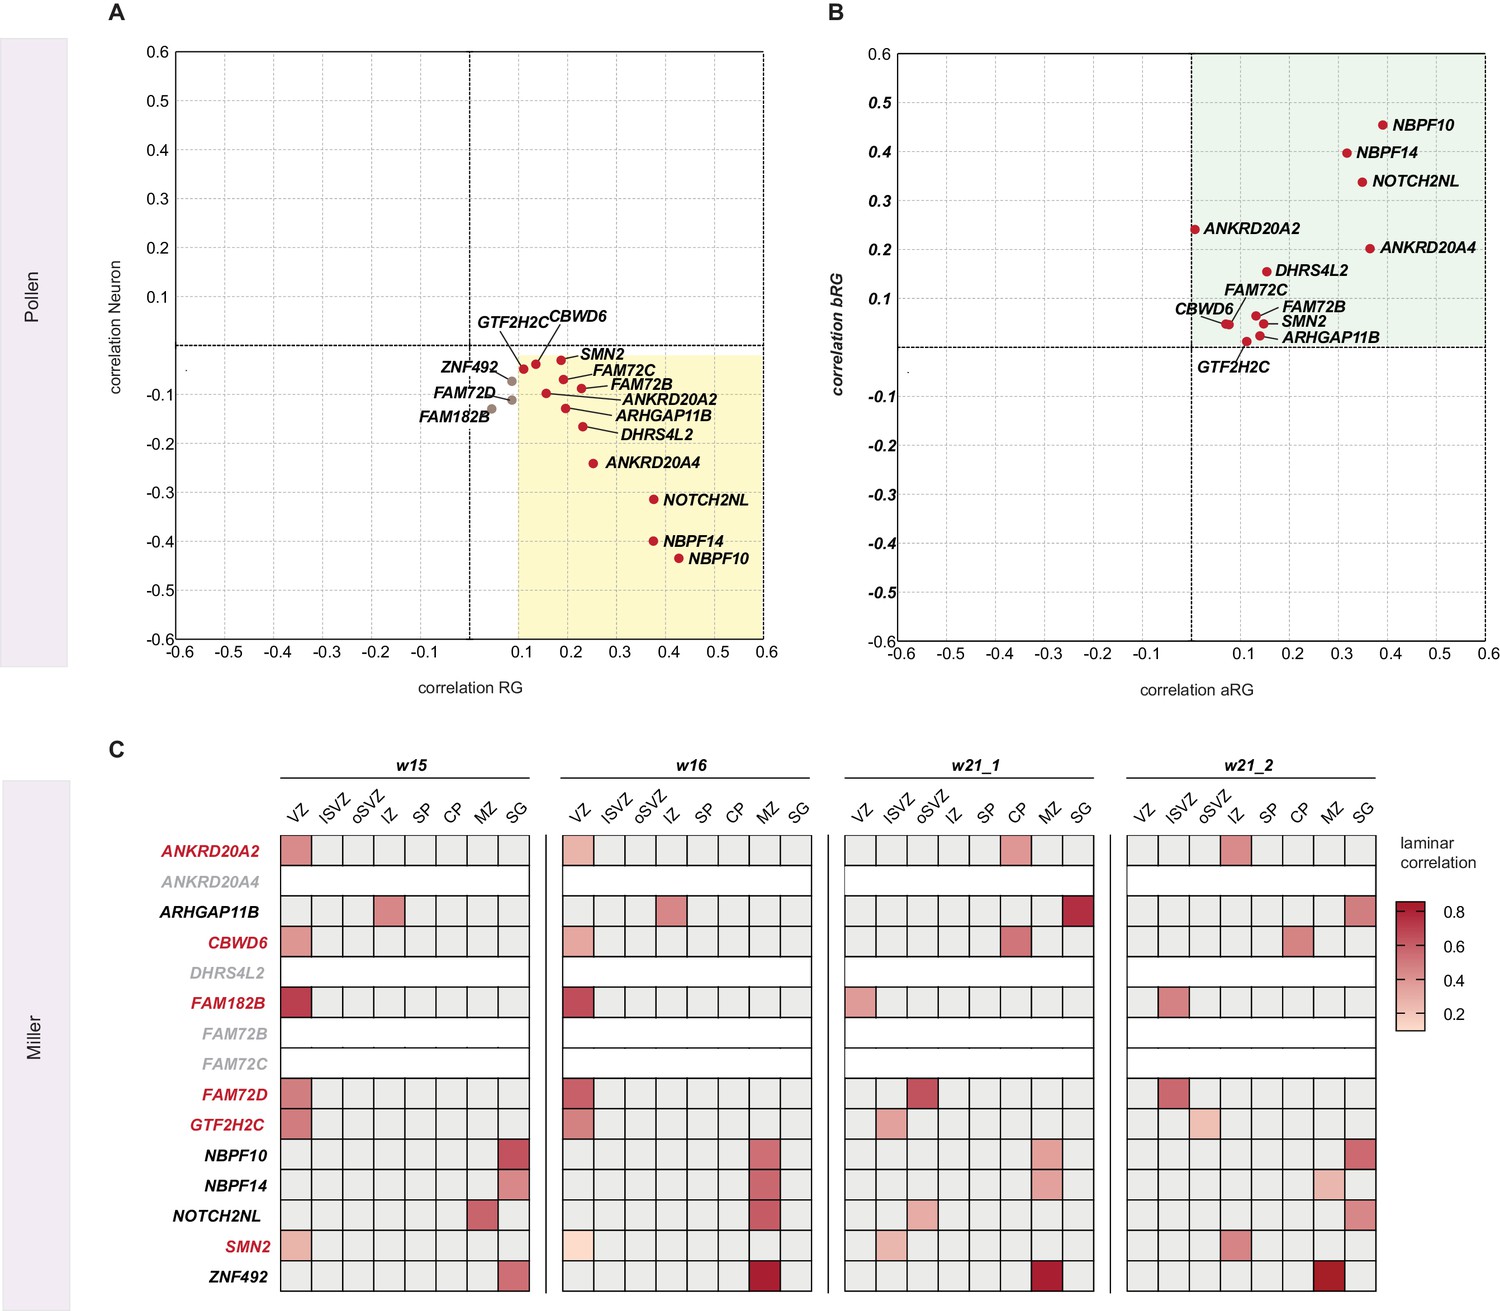
Analysis of the expression of the 15 human-specific, cNPC-enriched, protein-coding genes in the cell types of the Pollen et al. transcriptome dataset and in the cortical zones of the Miller et al. transcriptome dataset.
(A, B) Pollen et al. transcriptome dataset. (A) Plot showing the scores of correlation with radial glia (RG, X axis) vs. neuron (Y axis) regarding the expression of each of the 15 genes. Red dots indicate genes the expression of which is cNPC-enriched, grey dots genes the expression of which is not. Yellow box indicates the coordinates corresponding to the selection filter used to define cNPC-enriched expression in the Pollen et al. dataset. (B) Plot showing the scores of correlation with aRG (X axis) vs. bRG (Y axis) regarding the expression of each of the 12 human-specific genes, classified as cNPC-enriched in the Pollen et al. dataset (red dots in A). Note that all these 12 genes positively correlate with both aRG and bRG. (C) Heat map showing the laminar correlation scores (see color key on right) with the various cortical zones analyzed in the Miller et al. transcriptome dataset regarding the expression of each of the 15 genes. Red letters indicates genes that are cNPC-enriched in the Miller et al. dataset, black letters indicate genes that are not. Grey letters indicate genes that were not detected in the Miller et al. dataset.
Figure 8
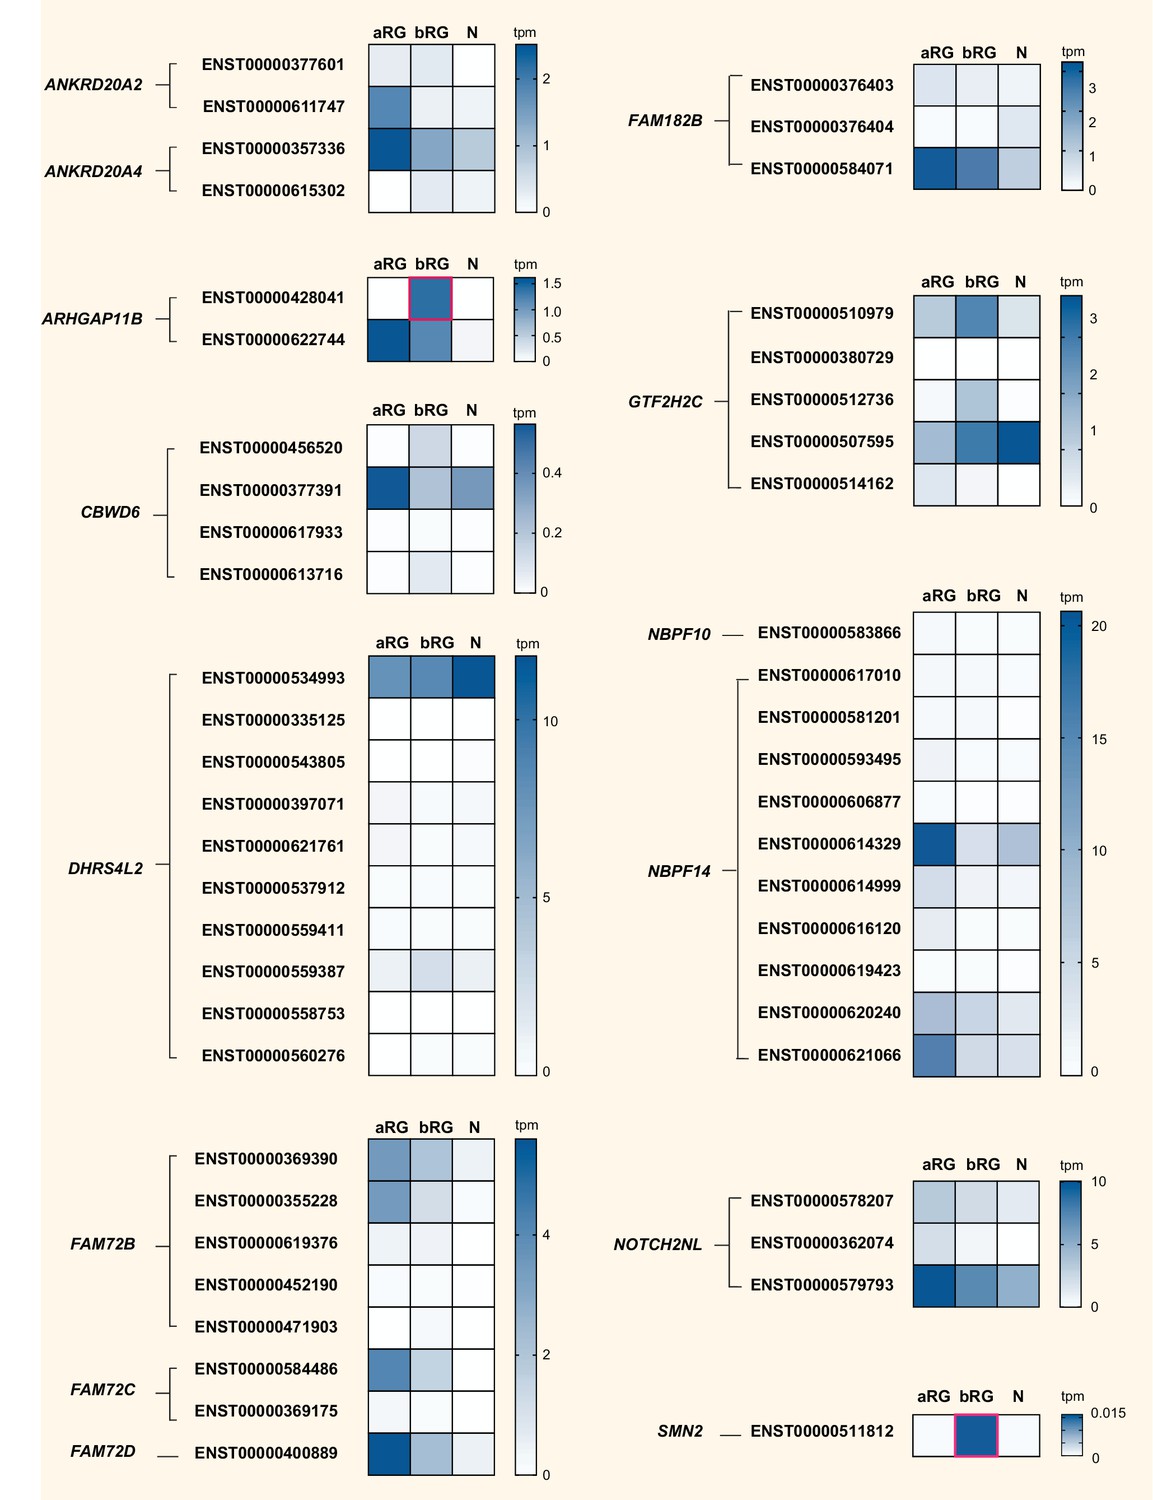
Cell-type specificity of mRNA expression of splice variants encoded by 14 human-specific cNPC-enriched genes.
Heatmaps showing TPM expression levels (see color keys on right) of all protein-coding splice variants encoded by the indicated 14 human-specific cNPC-enriched genes in aRG, bRG and neuron-enriched (N) cell populations from fetal human neocortex (Florio et al., 2015). Only splice variants with detectable expression, albeit very low in some cases, are shown. ZNF492 is not shown as only one splice variant exists. See Supplementary file 4 for mRNA expression data for each cell type and splice variant, including non-coding transcripts. Human-specific genes are grouped based on orthology, and splice variants (indicated by Ensembl transcript IDs) encoded by the respective cNPC-enriched human-specific gene(s) are grouped together. Note that ENST00000428041, a splice variant of ARHGAP11B and ENST00000511812, a splice variant of SMN2, are uniquely expressed in bRG (red boxes). Splice variant-specific mRNA expression was assessed using the Kallisto algorithm.
Figure 9
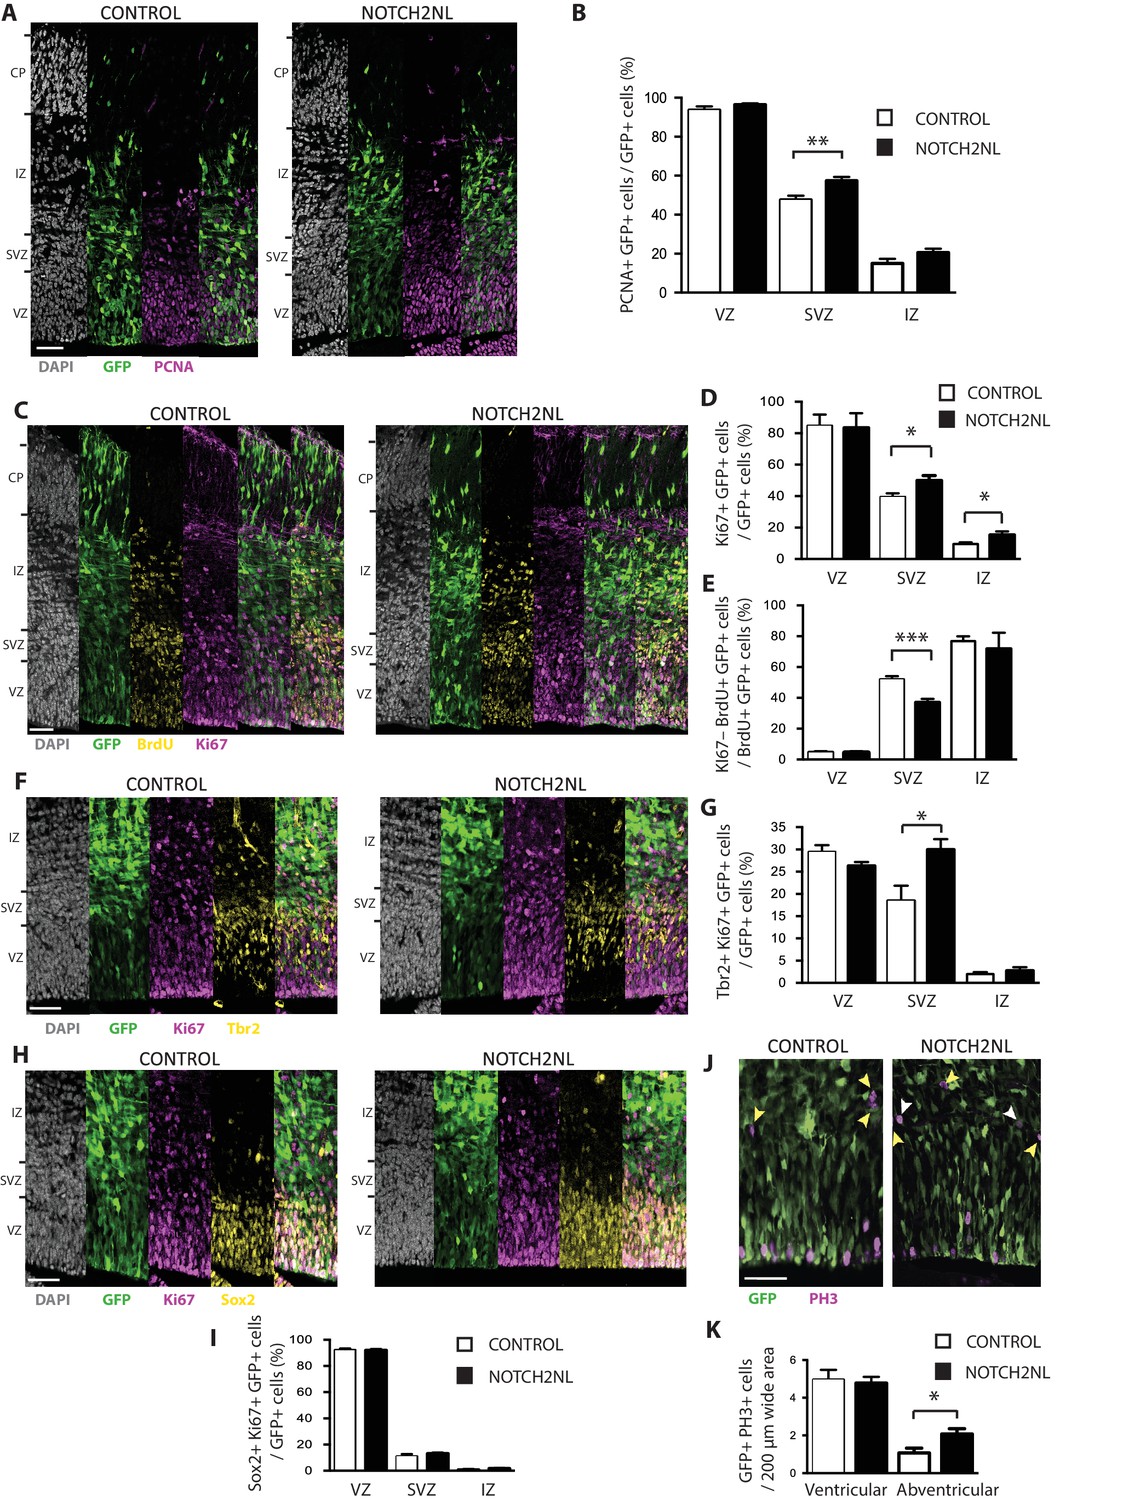
Forced expression of NOTCH2NL in mouse embryonic neocortex increases cycling basal progenitors.
The neocortex of E13.5 mouse embryos was in utero co-electroporated with a plasmid encoding GFP together with either an empty vector (Control) or a NOTCH2NL expression plasmid (NOTCH2NL), all under constitutive promoters, followed by analysis 48 hr later. Bromodeoxyuridine (BrdU) was administered by intraperitoneal injection (10 mg/kg) into pregnant mice at E14.5 (C, E). (A) GFP (green) and PCNA (magenta) double immunofluorescence combined with DAPI staining (white) of control (left) and NOTCH2NL-electroporated (right) neocortex. (B) Quantification of the percentage of the progeny of the targeted cells, that is, the GFP+ cells, that are PCNA+ in the VZ, SVZ and IZ upon control (white columns) and NOTCH2NL (black columns) electroporation. (C) GFP (green), BrdU (yellow), and Ki67 (magenta) triple immunofluorescence combined with DAPI staining (white) of control (left) and NOTCH2NL-electroporated (right) neocortex. (D) Quantification of the percentage of the progeny of the targeted cells, that is, the GFP+ cells, that are Ki67+ in the VZ, SVZ, and IZ upon control (white columns) and NOTCH2NL (black columns) electroporation. (E) Quantification of the percentage of the BrdU-labeled progeny of the targeted cells, that is, the GFP+ cells, that are Ki67–, that is, that did not re-enter the cell cycle, in the VZ, SVZ, and IZ upon control (white columns) and NOTCH2NL (black columns) electroporation. (F, H) GFP (green), Ki67 (magenta), and either Tbr2 (F) or Sox2 (H) (yellow) triple immunofluorescence combined with DAPI staining (white) of control (left) and NOTCH2NL-electroporated (right) neocortex. (G, I) Quantification of the percentage of the progeny of the targeted cells, that is, the GFP+ cells, that are Ki67+ and Tbr2+ (G) or Ki67+ and Sox2+ (I) in the VZ, SVZ and IZ upon control (white columns) and NOTCH2NL (black columns) electroporation. (J) GFP (green) and phosphohistone H3 (PH3, magenta) double immunofluorescence of control (left) and NOTCH2NL-electroporated (right) neocortex. Yellow arrowheads, GFP– and PH3+ abventricular cells. White arrowheads, GFP+ and PH3+ abventricular cells. (K) Quantification of the number of ventricular and abventricular progeny of the targeted cells, that is, the GFP+ cells, that are in mitosis (PH3+) in a 200 μm-wide microscopic field upon control (white columns) and NOTCH2NL (black columns) electroporation. (A, C, F, H, J) Images are single 2 μm optical sections. Scale bars, 50 μm. (B, D, E, G, I, K) Data are mean of 6–11 embryos each, averaging the numbers obtained from 1 to 4 cryosections per embryo (one 100 μm-wide (B, D, E, G, I) or 200 μm-wide (K) microscopic field per cryosection). Error bars indicate SEM; *p<0.05; **p<0.01;***p<0.001; Student’s t-test.
Author response image 1
Tables
Table 1
Primate-specific genes
https://doi.org/10.7554/eLife.32332.005| Gene symbol | Gene name | Function | cNPC-enriched in | Occurrence | Features |
|---|---|---|---|---|---|
| ANKRD20A2 | Ankyrin repeat domain 20 family member A2 | Unknown | Florio, Pollen, Miller | Homo (before Neandertal-Denisovan split) | Five ankyrin repeats, three coiled coil motifs [UniProt] |
| ANKRD20A4 | Ankyrin repeat domain 20 family member A4 | Unknown | Florio, Fietz, Pollen | Homo (before Neandertal-Denisovan split) | Five ankyrin repeats, three coiled coil motifs [UniProt] |
| ARHGAP11B | Rho GTPase activating protein 11B | Basal progenitor amplification (Florio et al., 2015) | Florio, Fietz, Pollen | Homo (before Neandertal-Denisovan split) | One nucleotide substitution led to a novel splice donor site in exon five resulting in a novel and unique C-terminal sequence and a loss of Rho-GAP activity (Florio et al., 2015; Florio et al., 2016) |
| CBWD6 | COBW Domain Containing 6 | Unknown | Pollen, Miller | Homo (before Neandertal-Denisovan split) | CobW domain, ATP binding sites [UniProt] |
| DHRS4L2 | Dehydrogenase/reductase 4 like 2 | Maybe an NADPH dependent retinol oxidoreductase [RefSeq] | Fietz, Pollen | Homo (before Neandertal-Denisovan split) | Unknown |
| FAM182B | Family with sequence similarity 182 member B | Unknown | Fietz, Miller | Homo (before Neandertal-Denisovan split) | Removal of a stop codon resulting in an open reading frame in humans (this publication) |
| FAM72B | Family with sequence similarity 72 member B | Unknown | Florio, Fietz, Pollen | Homo (before Neandertal-Denisovan split) | Unknown |
| FAM72C | Family with sequence similarity 72 member C | Unknown | Florio, Fietz, Pollen | Homo (before Neandertal-Denisovan split) | Unknown |
| FAM72D | Family with sequence similarity 72 member D | Unknown | Florio, Fietz, Miller | Homo (before Neandertal-Denisovan split) | Unknown |
| GTF2H2C | GTF2H2 family member C | Unknown | Pollen, Miller | Homo (before Neandertal-Denisovan split) | VWFA domain, C4-type zinc finger motif [UniProt] |
| NBPF10 | Neuroblastoma Breakpoint Family Member 10 | Contains DUF1220 domains which have been implicated in a number of developmental and neurogenetic diseases (e.g. microcephaly, macrocephaly, autism, schizophrenia, cognitive disability, congenital heart disease, neuroblastoma, and congenital kidney and urinary tract anomalies) [RefSeq] | Fietz, Pollen | Homo (before Neandertal-Denisovan split) | Tandemly repeated copies of DUF1220 protein domains [RefSeq], coiled coil domain [UniProt] |
| NBPF14 | Neuroblastoma Breakpoint Family Member 14 | Contains DUF1220 domains which have been implicated in a number of developmental and neurogenetic diseases (e.g. microcephaly, macrocephaly, autism, schizophrenia, cognitive disability, congenital heart disease, neuroblastoma, and congenital kidney and urinary tract anomalies) [RefSeq] | Fietz, Pollen | Homo (before Neandertal-Denisovan split) | Tandemly repeated copies of DUF1220 protein domains [RefSeq], coiled coil domain [UniProt] |
| NOTCH2NL | Notch 2 N-terminal like | Unknown | Florio, Fietz, Pollen | Homo (before Neandertal-Denisovan split) | 6 EGF-like domains [UniProt] |
| SMN2 | Survival of motor neuron 2, centromeric | Loss of SMN1 and SMN2 results in embryonic death; mutations in SMN1 are associated with spinal muscular atrophy, mutations in SMN2 do not lead to disease; forms heteromeric complexes with proteins such as SIP1 and GEMIN4, and also interacts with several proteins known to be involved in the biogenesis of snRNPs, such as hnRNP U protein and the small nucleolar RNA binding protein [RefSeq] | Pollen, Miller | Homo (after Neandertal-Denisovan split) | Evolved after the split from Neanderthal and Denisovan (Dennis et al., 2017); telomeric (SMN1) and centromeric (SMN2) copies of this gene are nearly identical and encode the same protein; critical sequence difference between the two genes is a single nucleotide in exon 7, which is thought to be an exon splice enhancer; the full length protein encoded by this gene localizes to both the cytoplasm and the nucleus [RefSeq]; GEMIN2 binding site, tudor domain, RPP20/POP7 interaction site, SNRPB binding site, SYNCRIP interaction site [UniProt] |
| ZNF492 | Zinc finger protein 492 | Unknown | Florio, Fietz, Pollen | Homo (before Neandertal-Denisovan split) | Human ZNF492 is a chimera consisting of the original KRAB repressor domain and the acquired ZNF98 DNA binding domain (this publication); KRAB domain and 13 C2H2 zinc finger motifs [UniProt] |
| ALG1L | ALG1, chitobiosyldiphosphodolichol beta-mannosyltransferase like | Unknown | Pollen, Miller | Hominini | Unknown |
| CBWD2 | COBW domain containing 2 | Unknown | Pollen, Miller | Hominini | CobW domain, ATP binding sites [UniProt] |
| TMEM133 | Transmembrane protein 133 | Unknown | Fietz, Miller, Johnson | Hominini | Intronless gene [RefSeq]; transmembrane protein without signal peptide and two predicted transmembrane domains (Protter) |
| HHLA3 | HERV-H LTR-associating 3 | Unknown | Fietz, Pollen | Homininae | Unknown |
| TMEM99 | Transmembrane protein 99 | Unknown | Fietz, Miller | Hominidae | Transmembrane protein with signal peptide and three transmembrane domains [UniProt, Protter] |
| ZNF90 | Zinc finger protein 90 | Unknown | Florio, Pollen | Hominidae | KRAB domain and 15 C2H2 zinc finger motifs [UniProt] |
| CCDC74B | Coiled-coil domain containing 74B | Unknown | Fietz, Pollen, Miller, Johnson | Hominoidae | Coiled-coil motif [UniProt] |
| C9orf47 | Chromosome nine open reading frame 47 | Unknown | Fietz, Miller, Johnson | Hominoidae | Signal peptide [UniProt, Protter] |
| GLUD2 | Glutamate Dehydrogenase 2 | Localized to the mitochondrion, homohexamer, recycles glutamate during neurotransmission and catalyzes the reversible oxidative deamination of glutamate to alpha-ketoglutarate [RefSeq] | Miller, Johnson | Hominoidae | Arose by retroposition (intronless) (this publication) |
| PTTG2 | Pituitary tumor-transforming 2 | Unknown | Fietz, Miller | Hominoidae | Arose by retroposition; reading frame remained open only in apes (this publication); destruction box, SH3 binding domain [UniProt] |
| APOL2 | Apolipoprotein L2 | Is found in the cytoplasm, where it may affect the movement of lipids or allow the binding of lipids to organelles [RefSeq] | Florio, Fietz, Pollen, Johnson | Catarrhini | Signal peptide [UniProt, Protter] |
| APOL4 | Apolipoprotein L4 | May play a role in lipid exchange and transport throughout the body, as well as in reverse cholesterol transport from peripheral cells to the liver [RefSeq] | Fietz, Miller | Catarrhini | Signal peptide [UniProt, Protter] |
| BTN3A2 | Butyrophilin subfamily three member A2 | Immunoglobulin superfamily, may be involved in the adaptive immune response [RefSeq] | Fietz, Pollen, Miller | Catarrhini | Signal peptide, Ig-like V-type domain, coiled coil motif, one transmembrane domain [UniProt, Protter] |
| BTN3A3 | Butyrophilin Subfamily 3 Member A3 | Major histocompatibility complex (MHC)-associated gene | Fietz, Miller | Catarrhini | Arose by triplication duplication: BTN3A1 is likely the ancestral gene, BTN3A1 duplicated once and this 'copy' duplicated to BTN3A2 and BTN3A3. This triplication happened in the human-rhesus ancestor since marmoset has only a single gene (this publication); type I membrane protein with two extracellular immunoglobulin (Ig) domains and an intracellular B30.2 (PRYSPRY) domain [UniProt] |
| MICA | MHC class I polypeptide-related sequence A | Is a ligand for the NKG2-D type II integral membrane protein receptor; functions as a stress-induced antigen that is broadly recognized by intestinal epithelial gamma delta T cells; variations have been associated with susceptibility to psoriasis one and psoriatic arthritis [RefSeq] | Florio, Fietz, Miller | Catarrhini | Signal peptide, Ig-like C1-type domain, one transmembrane domain [UniProt, Protter] |
| MT1M | Metallothionein 1M | Unknown | Miller, Johnson | Catarrhini | Two metal-binding domains [UniProt] |
| SLFN13 | Schlafen Family Member 13 | Unknown | Florio, Johnson | Catarrhini | Unknown |
| ZNF100 | Zinc finger protein 100 | Unknown | Fietz, Pollen | Catarrhini | KRAB domain and 12 C2H2 zinc finger motifs [UniProt] |
| ZNF222 | Zinc Finger Protein 222 | Unknown | Pollen, Miller | Catarrhini | KRAB domain and 10 C2H2 zinc finger motifs [UniProt] |
| ZNF43 | Zinc finger protein 43 | Unknown | Fietz, Pollen | Catarrhini | KRAB domain and 22 C2H2 zinc finger motifs [UniProt] |
| ZNF695 | Zinc finger protein 695 | Unknown | Florio, Fietz, Miller | Catarrhini | KRAB domain and 13 C2H2 zinc finger motifs [UniProt] |
| ZNF724 | Zinc finger protein 724 | Unknown | Florio, Fietz, Pollen | Catarrhini | KRAB domain and 16 C2H2 zinc finger motifs [UniProt] |
| ZNF726 | Zinc finger protein 726 | Unknown | Florio, Fietz | Catarrhini | KRAB domain and 20 C2H2 zinc finger motifs [UniProt] |
| ZNF730 | Zinc finger protein 730 | Unknown | Fietz, Johnson | Catarrhini | KRAB domain and 12 C2H2 zinc finger motifs [UniProt] |
| ZNF732 | Zinc finger protein 732 | Unknown | Florio, Pollen | Catarrhini | KRAB domain and 16 C2H2 zinc finger motifs [UniProt] |
| ZNF816 | Zinc finger protein 816 | Unknown | Florio, Fietz, Pollen, Miller | Catarrhini | KRAB domain and 15 C2H2 zinc finger motifs [UniProt] |
| ZNF93 | Zinc finger protein 93 | Unknown | Pollen, Miller | Catarrhini | KRAB domain and 17 C2H2 zinc finger motifs [UniProt] |
| HEPN1 | Hepatocellular carcinoma, down-regulated 1 | Transient expression of this gene significantly inhibits cell growth and suggests a role in apoptosis; downregulated or lost in hepatocellular carcinomas [RefSeq] | Florio, Fietz, Miller | Simiiformes | Expressed in the liver; encodes a short peptide, predominantly localized to the cytoplasm [RefSeq] |
| KIF4B | Kinesin family member 4B | A microtubule-based motor protein that plays vital roles in anaphase spindle dynamics and cytokinesis [RefSeq] | Fietz, Pollen | Simiiformes | Intronless retrocopy of kinesin family member 4A [RefSeq]; kinesin motor domain, ATP binding site, coiled coil, nuclear localization signal, PRC1 interaction domain [UniProt] |
| ZNF20 | Zinc finger protein 20 | Unknown | Fietz, Miller | Simiiformes | KRAB domain and 15 C2H2 zinc finger motifs [UniProt] |
| ZNF680 | Zinc finger protein 680 | Unknown | Florio, Pollen | Simiiformes | KRAB domain and 12 C2H2 zinc finger motifs [UniProt] |
| ZNF718 | Zinc finger protein 718 | Unknown | Fietz, Pollen | Simiiformes | KRAB domain and 11 C2H2 zinc finger motifs [UniProt] |
| ZNF788 | Zinc finger family member 788 | Unknown | Fietz, Pollen | Simiiformes | No KRAB domain, 17 C2H2 zinc finger motifs [UniProt] |
| MT1E | Metallothionein 1E | Unknown | Pollen, Miller | Haplorrhini | Two metal-binding domains [UniProt] |
| TNFRSF10D | TNF receptor superfamily member 10d | Does not induce apoptosis and has been shown to play an inhibitory role in TRAIL-induced cell apoptosis. [RefSeq] | Florio, Fietz | Haplorrhini | Signal peptide, TRAIL-binding domain, one transmembrane domain, truncated death domain [UniProt, Protter] |
Key resources table
| Reagent type (species) or resource | Designation | Source or reference | Identifiers | Additional information |
|---|---|---|---|---|
| Strain, strain background (Mus musculus) | C57BL/6J | MPI-CBG Animal Facility | ||
| Biological sample (Homo sapiens) | fetal neocortex tissue (13 wpc) | Universitätsklinikum Carl Gustav Carus Dresden | ||
| Antibody | anti-BrdU (mouse) | MPI-CBG Antibody Facility | (1:1000) | |
| Antibody | anti-GFP (chicken polyclonal) | Abcam | Abcam Cat# ab13970, RRID:AB_300798 | (1:1000) |
| Antibody | anti-PH3 (rat monoclonal) | Abcam | Abcam Cat# ab10543, RRID:AB_2295065 | (1:1000) |
| Antibody | anti-Tbr2 (mouse) | MPI-CBG Antibody Facility | (1:500) | |
| Antibody | anti-Sox2 (goat polyclonal) | R + D Systems | R and D Systems Cat# AF2018, RRID:AB_355110 | (1:500) |
| Antibody | anti-Ki67 (rabbit polyclonal) | Abcam | Abcam Cat# ab15580, RRID:AB_443209 | (1:500) |
| Antibody | anti-PCNA (mouse monoclonal) | Millipore | Millipore Cat# CBL407, RRID:AB_93501 | (1:500) |
| Antibody | Alexa Fluor 488-, 555- and 594-secondaries | Molecular Probes | (1:500) | |
| Recombinant DNA reagent | pCAGGS | doi: 10.1126/science.aaa1975 | ||
| Recombinant DNA reagent | pCAGGS-GFP | doi: 10.1126/science.aaa1975 | ||
| Recombinant DNA reagent | pCAGGS-NOTCH2NL | this paper | NOTCH2NL was PCR amplified from cDNA and cloned into pCAGGS | |
| Sequence-based reagent | ARHGAP11B LNA probe | this paper | AGTCTGGTACACGCCCTTCTTTTCT | |
| Sequence-based reagent | DHRS4L2 LNA probe | this paper | AGACAGTGGCGGTTGCGTGA | |
| Sequence-based reagent | FAM182B LNA probe | this paper | GCAGGGATACACGGCTAT | |
| Sequence-based reagent | GTF2H2C LNA probe | this paper | TCAGACGGCCTGCC | |
| Software, algorithm | cutadapt (v1.15) | https://cutadapt.readthedocs.io/en/stable/ | RRID:SCR_011841 | |
| Software, algorithm | STAR (v2.5.2b) | https://github.com/alexdobin/STAR | RRID:SCR_015899 | |
| Software, algorithm | Bedtools | http://bedtools.readthedocs.io/en/stable/# | RRID:SCR_006646 | |
| Software, algorithm | R | The R Foundation | ||
| Software, algorithm | samtools | Genome Research Limited | RRID:SCR_002105 | |
| Software, algorithm | bowtie1 | http://bowtie-bio.sourceforge.net/index.shtml | RRID:SCR_005476 | |
| Software, algorithm | BioMart | Bioconductor | ||
| Software, algorithm | BLAT | http://genome.ucsc.edu/cgi-bin/hgBlat?command=start | RRID:SCR_011919 | |
| Software, algorithm | Kallisto | doi:10.1038/nbt.3519 | ||
| Software, algorithm | FastQC | Babraham Bioinformatics | RRID:SCR_014583 | |
| Software, algorithm | dupRadar | Bioconductor | ||
| Software, algorithm | DESeq2 | Bioconductor | RRID:SCR_015687 | |
| Software, algorithm | GeneTrail2 | https://genetrail2.bioinf.uni-sb.de | ||
| Other | CESAR | doi: 10.1093/nar/gkw210 |
Additional files
-
Supplementary file 1
cNPC-enriched genes.
This file summarizes information of the five datasets, occurrence of all cNPC-enriched genes in the five datasets and composition of the five gene sets including gene expression data.
- https://doi.org/10.7554/eLife.32332.024
-
Supplementary file 2
GO term analysis of cNPC-enriched genes.
This file contains the output of the GO term analysis.
- https://doi.org/10.7554/eLife.32332.025
-
Supplementary file 3
Chromosome location of all cNPC-enriched primate-specific genes in the different primates.
This file contains the chromosome location of all cNPC-enriched primate-specific genes in the 12 primate species analyzed.
- https://doi.org/10.7554/eLife.32332.026
-
Supplementary file 4
mRNA expression data of splice variants.
This file contains mRNA expression data for the human-specific genes and their corresponding ancestral paralog for each cell type and splice variant, including non-coding transcripts.
- https://doi.org/10.7554/eLife.32332.027
-
Supplementary file 5
qPCR primer.
This file contains the primer sequences of the qPCR for the validation of the paralog-specific gene expression analysis.
- https://doi.org/10.7554/eLife.32332.028
-
Supplementary file 6
Primer for genomic qPCR.
This file contains the primer sequences of the genomic qPCR.
- https://doi.org/10.7554/eLife.32332.029
-
Supplementary file 7
Primer for ISH probes.
This file contains the primer sequences used to generate the templates for the synthesis of the ISH probes.
- https://doi.org/10.7554/eLife.32332.030
-
Transparent reporting form
- https://doi.org/10.7554/eLife.32332.031
Download links
A two-part list of links to download the article, or parts of the article, in various formats.
Downloads (link to download the article as PDF)
Open citations (links to open the citations from this article in various online reference manager services)
Cite this article (links to download the citations from this article in formats compatible with various reference manager tools)
Evolution and cell-type specificity of human-specific genes preferentially expressed in progenitors of fetal neocortex
eLife 7:e32332.
https://doi.org/10.7554/eLife.32332


