Codon usage bias controls mRNA and protein abundance in trypanosomatids
- University of Dundee, United Kingdom
Figures
Figure 1

Protein expression is increased by GC3 codons in T.brucei.
(A) Schematic map of the pRPai-based, tetracycline-inducible reporter construct. Relevant restriction sites are shown. Black bars, tubulin untranslated regions; arrow, pol-I promoter; pA, polyadenylation site; SA, splice-acceptor site. The heat-maps of the wild-type and human codon optimised gLUC genes indicate level (percentage) of codon over-representation (green) and under-representation (red) in highly expressed genes. (B) Protein blot analysis of gLUC expression in T. brucei. *, cross-reactive band. The Coomassie-stained panel serves as a loading control; the strong band at approximately 55 kDa is the abundant Variant Surface Glycoprotein (VSG). The numbers indicate proportional luciferase expression, based on densitometry. Three independent clones gave similar results for each construct. (C) The heat-maps of synthetic gLUC reporter genes indicate codon usage as in A above. The plot indicates luciferase activity for each reporter in T. brucei; four readings from two independent strains. Error bars, standard deviation. *, p<0.0001; one-way ANOVA test. (D) The heat-maps of synthetic GFP reporter genes indicate codon usage as in A above. The LICOR protein blot indicates GFP expression for each reporter in T. brucei; β-tubulin serves as a loading control. Two independent clones gave similar results for each construct.
Figure 2
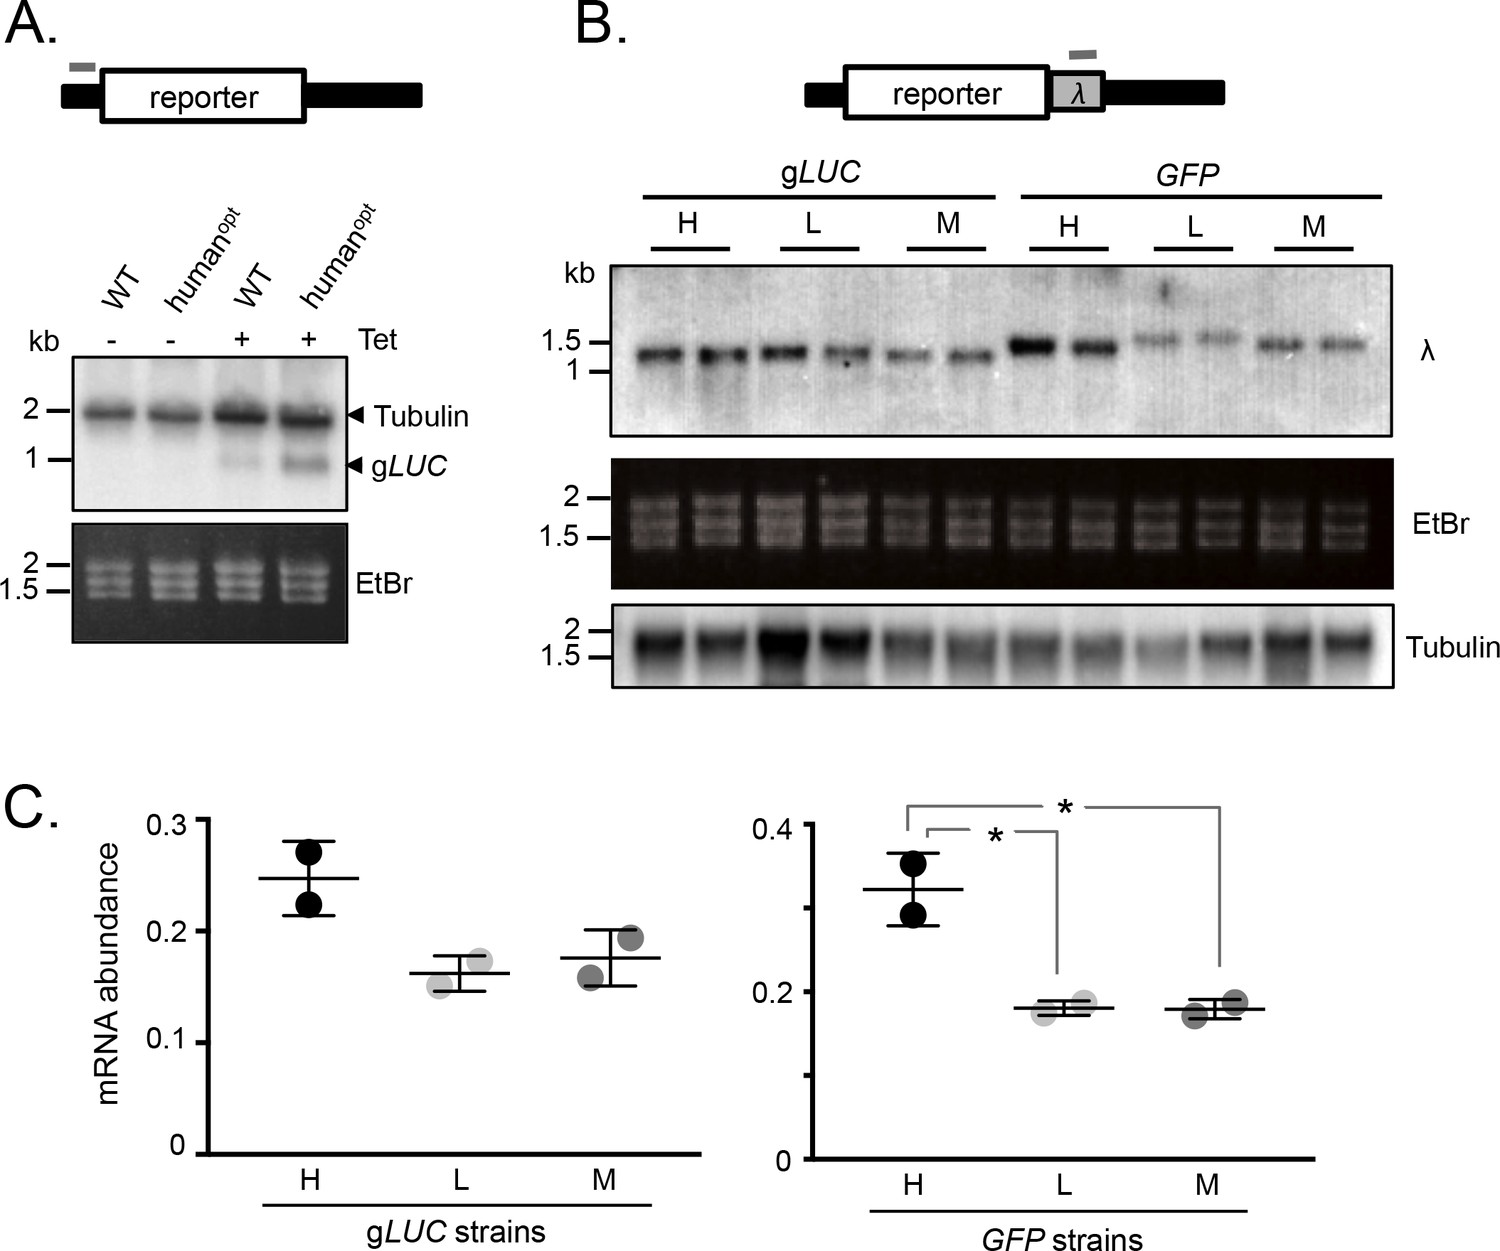
mRNA expression is increased by GC3 codons in T.brucei.
(A) Schematic map of the reporter cassette. The grey bar indicates the position of the tubulin untranslated region probe. The RNA blot indicates native tubulin transcripts and the gLUC transcripts. An ethidium bromide stained gel serves as an additional loading control. (B) Schematic of the reporter cassette incorporating a lambda 3'-untranslated segment. The grey bar indicates the position of the lambda untranslated region probe. The upper RNA blot shows gLUC and GFP transcripts. An ethidium bromide stained gel and a replicate blot probed for tubulin serve as loading controls. Pairs of independent strains were analysed for each reporter construct. (C) Phosphorimager-based quantification of reporter expression in B. Error bars, standard deviation from two independent strains. Values were corrected for loading (tubulin). *, p<0.02; one-way ANOVA test.
Figure 3

Genome scale analysis of codon usage bias.
(A) CAI value distribution is shown for all non-redundant T. brucei genes and the cohorts of genes indicated. See the text for more detail on each cohort. (B) CAI values are shown in heat-map format (deviation from average, Av) on physical maps of T. brucei chromosome 3 and L. major chromosome 1. Salient features are indicated. (C) Codon representation (third position difference), relative to the average usage across the genome, is shown within the cohorts of T. brucei genes indicated; protein kinase activity (GO:0004672), plasma membrane (GO:0005886), transcription (GO:0006350), translation (GO:0006412). The numbers above the heat-map indicate the number of redundant codons available in each case.
Figure 4
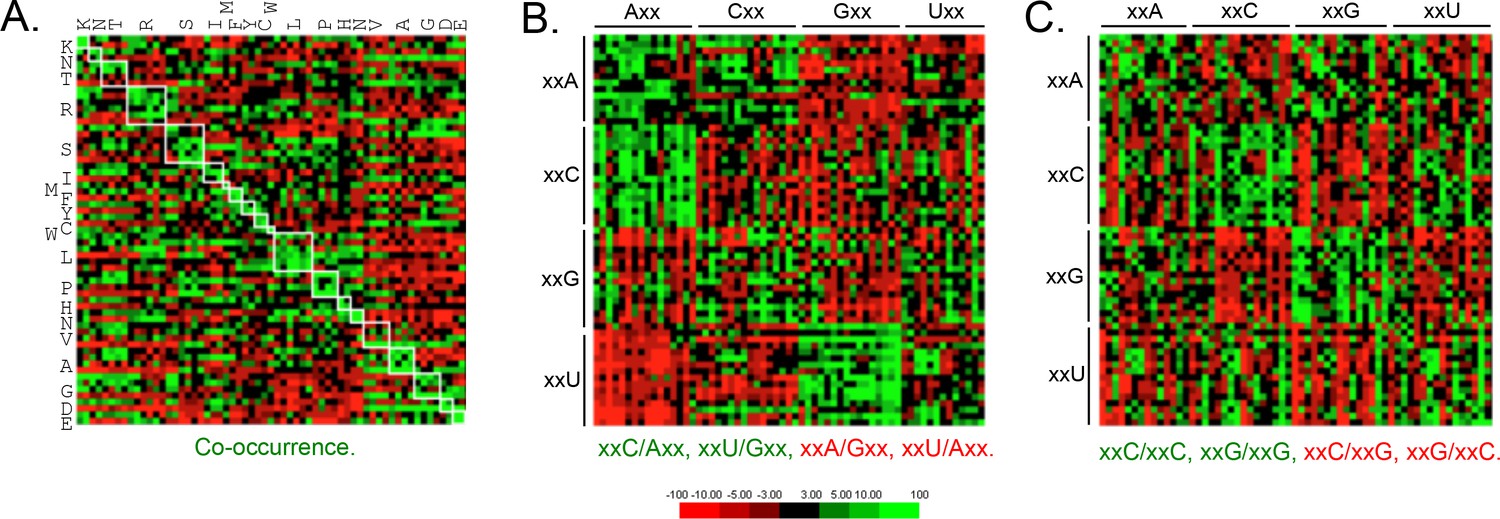
Genome scale analysis of codon pair bias in T.
brucei. (A) Codon co-occurrence by encoded amino acid. Amino acid pairs are over-represented; highlighted by white boxes. (B) Analysis of third position followed by first position pairs. Examples of over-represented pairs are shown in green and examples of under-represented pairs are shown in red. (C) Analysis of third position and third position pairs. Examples are shown as in B. Amino acids and codons on the vertical axis precede those on the horizontal axis.
Figure 5 with 1 supplement

Transcriptome and proteome data and the impact of gene length in T.brucei.
(A) Correspondence between observed mRNA and protein expression. (B) Relationship between observed mRNA expression and protein coding sequence (CDS) length. RPKM, Reads Per Kilobase of transcript per Million mapped reads. (C) Relationship between observed protein expression and protein coding sequence (CDS) length. Cohorts of particularly long (red, 13.4 ± 1 kbp, n = 11) and short (blue, 0.55 ± 0.22 kbp, n = 67) genes, encoding dynein heavy chains and ribosomal proteins, respectively, are highlighted. n = 2315 genes for panels A and C, n = 7225 genes for panel B.
Figure 5—figure supplement 1
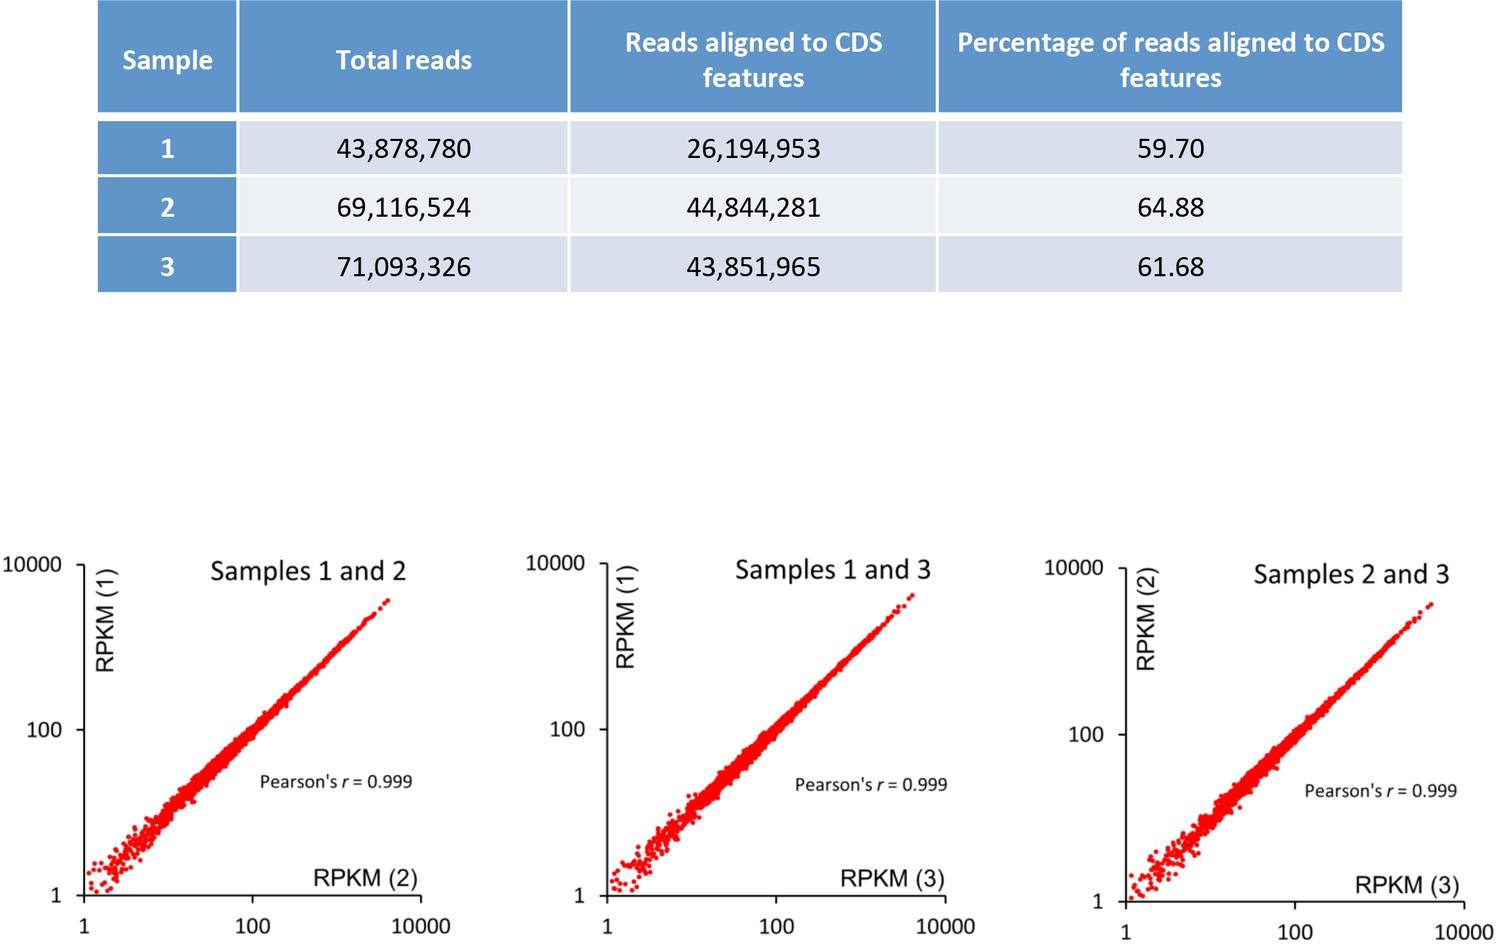
RNA-seq data.
Replicate read counts and correspondence analysis. RPKM (Reads Per Kilobase of transcript per Million mapped reads).
Figure 6 with 1 supplement
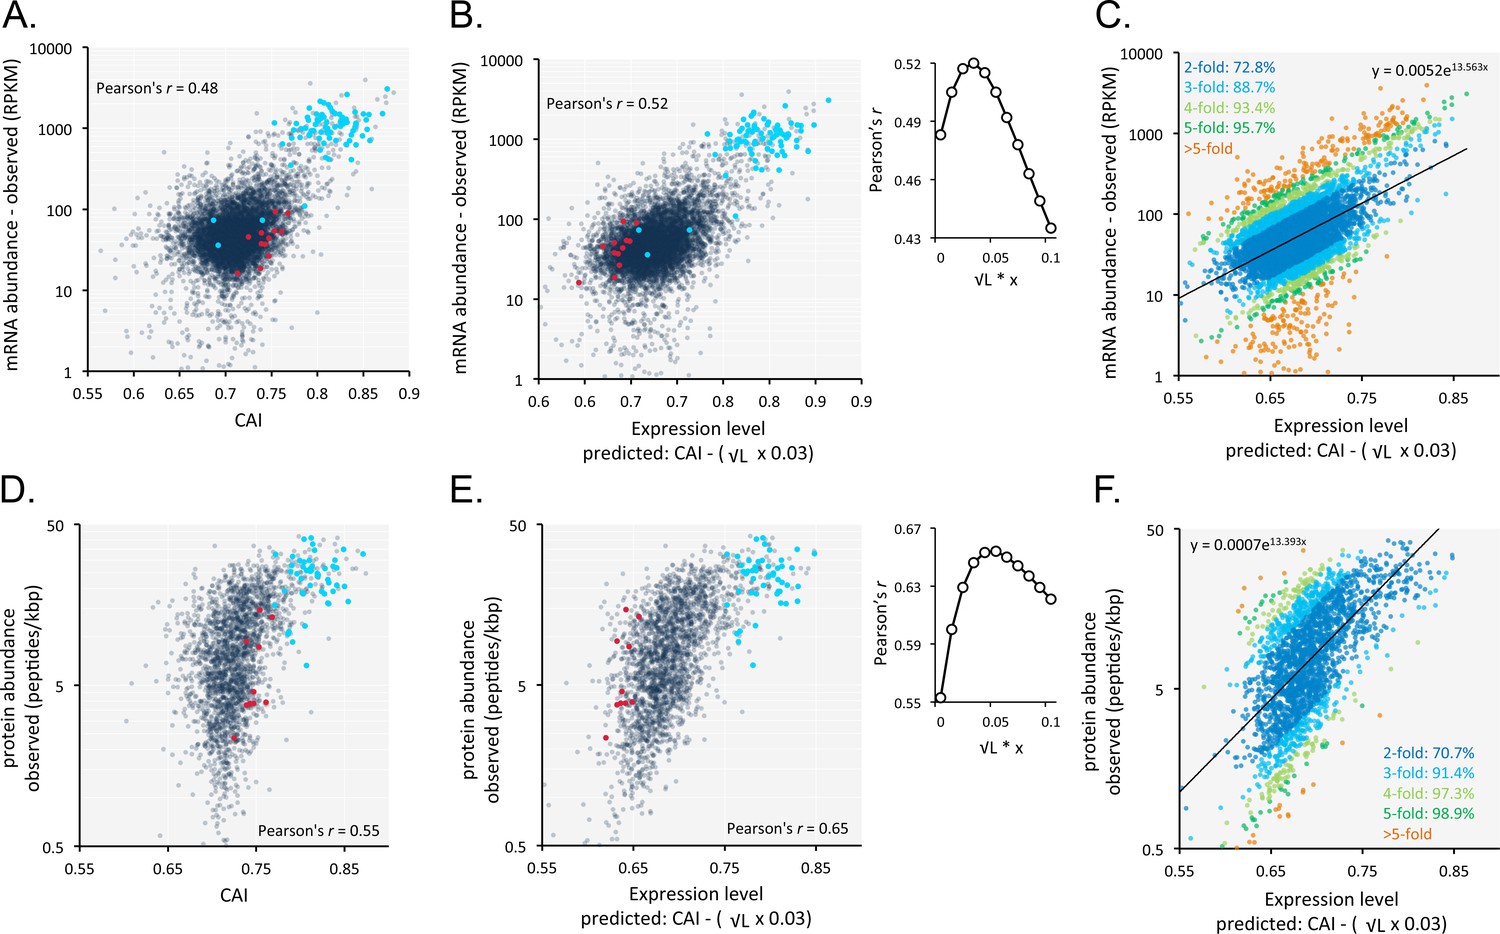
Codon usage is predictive of relative mRNA and protein expression in T.brucei.
(A) Correspondence between relative observed mRNA expression and CAI. (B) Correspondence between relative observed mRNA levels and predicted expression based on CAI and CDS length in kbp (L); the inset shows the impact of length-correction on the correlation coefficient. RPKM, Reads Per Kilobase of transcript per Million mapped reads. (C) As in B but showing proportions of expression measures within 2- to 5-fold of the predictions; the formula for the exponential trend-line is indicated. (D) Correspondence between relative observed protein expression and CAI. (E) Correspondence between relative observed protein levels and predicted expression based on CAI and CDS length in kbp (L); inset as in B above. (F) As in E but showing proportions of expression measures within 2- to 5-fold of the predictions; the formula for the exponential trend-line is indicated. A-B, D-E; Cohorts of particularly long (red) and short (blue) genes (see Figure 5) are highlighted. n = 7225 genes for panels A-C, n = 2315 proteins for panels D-F.
Figure 6—figure supplement 1
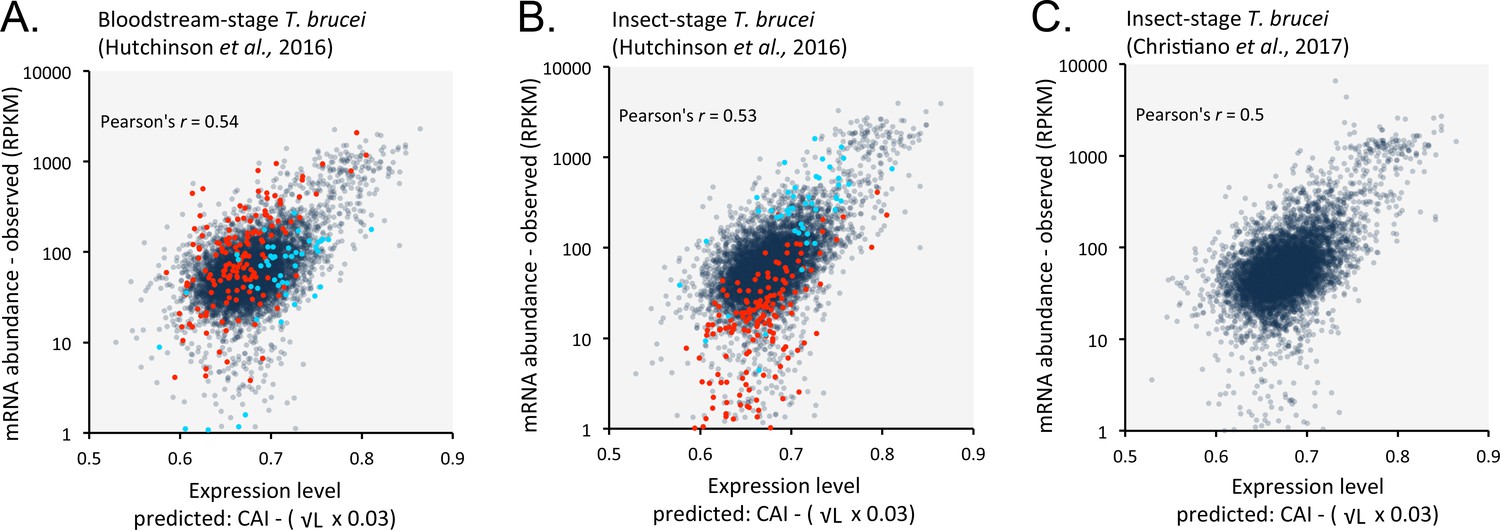
Length-adjusted CAI is predictive of relative mRNA expression in previously published datasets.
Data from distinct life cycle stages of T. brucei and from different research groups were analysed; the data source is indicated in each case. Correspondence is shown between relative observed mRNA expression and our predictions based on CAI and CDS length in kbp (L). (A) Bloodstream-stage cells. Cohorts of bloodstream-upregulated (red) and insect-upregulated (blue) genes are highlighted (≥3 fold change between life cycle stages); the correlation coefficients do not take account of these ‘stage-specific’ genes n = 201. Total n = 7191 genes. (B) As in A but for insect-stage cells. (C). Insect-stage cells. n = 7307 genes. RPKM, Reads Per Kilobase of transcript per Million mapped reads.
Figure 7

Codon usage predicts the relative expression of protein complexes and cohorts of proteins with related functions in T.brucei.
Correspondence between observed peptide counts and predicted abundance based on CAI. The complexes and cohorts are listed in order of peptides/kbp and number of proteins is indicated for each; protein numbers are also reflected by the symbol sizes. The formula for the exponential trend-line is indicated. n = 23 cohorts, n = 277 proteins.
Figure 8
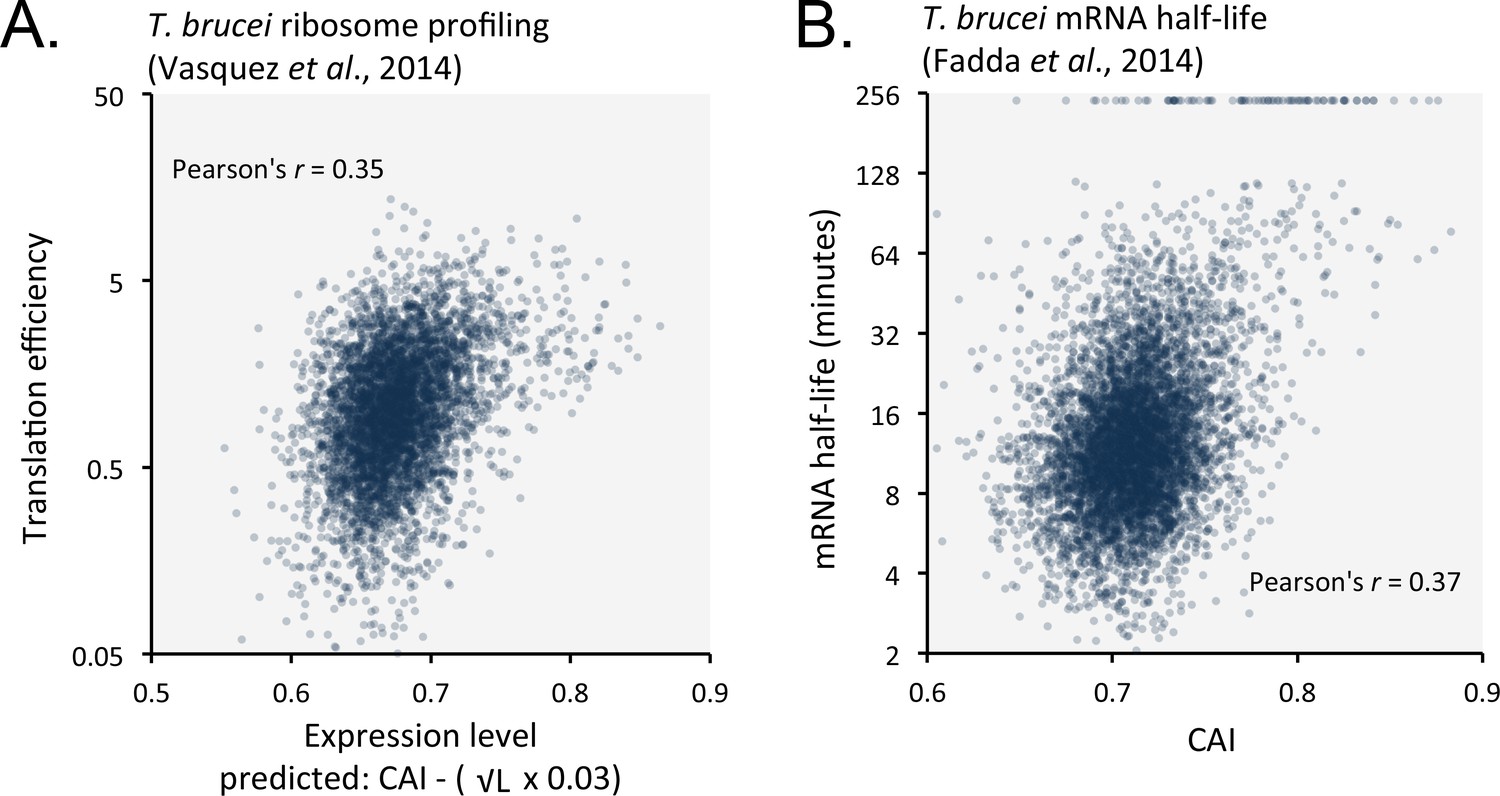
Length-adjusted CAI and CAI are predictive of translation efficiency and mRNA half-life, respectively, in previously published data from T.brucei; the data source is indicated in each case.
(A) Correspondence between translation efficiency (footprint levels/mRNA levels) and length-adjusted CAI. n = 4880 genes. Data from bloodstream-form cells is shown; correlation coefficient for insect-form cells was 0.36 (improved by 3.3% by the length-adjustment). (B) Correspondence between mRNA half-life and CAI. n = 6333 genes. Data from bloodstream-form cells is shown; correlation coefficient for insect-form cells was 0.42.
Figure 9
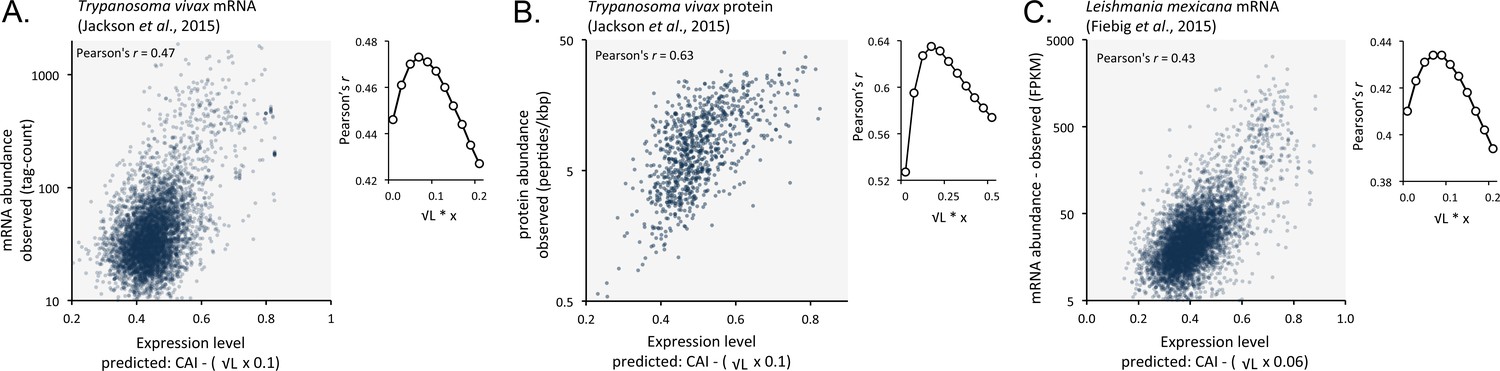
Length-adjusted CAI is predictive of relative mRNA and protein expression in previously published data from the other trypanosomatids, T.vivax and Leishmania mexicana; the data source is indicated in each case.
The plots indicate correspondence between relative observed mRNA or protein expression and our predictions based on CAI and CDS length in kbp (L). (A) T. vivax mRNA expression. n = 5170 genes. (B) T. vivax protein expression. n = 859 proteins. (C). Leishmania mexicana mRNA expression. n = 5715 genes. The insets show the impact of length-correction on the correlation coefficient. FPKM, Fragments Per Kilobase of transcript per Million mapped reads.
Tables
Key resources table
| Reagent type (species) or resource | Designation | Source or reference | Identifiers | Additional information |
|---|---|---|---|---|
| gene (Gaussia princeps) | gLUC | PMID: 18408930 | AY015993.1 | wild-type |
| gene (Gaussia princeps) | gLUC | PMID: 18408930 | EU372000 | human codon-optimised |
| cell line (Trypanosoma brucei) | 2T1 | PMID: 16182389 | ||
| transfected construct (Trypanosoma brucei) | pRPa-iSL plasmid | PMID: 18588918 | 69244 | available from addgene.org |
| transfected construct (Trypanosoma brucei) | pRPa plasmid | PMID: 18588918 | ||
| transfected construct (Trypanosoma brucei) | pRPa-λ plasmid | this paper | see materials and methods | |
| antibody | α-gLUC | New England Biolabs | one in 1000 | |
| sequence-based reagent | EUluc5 oligonucleotide | this paper | GATCCTGCAGCTCGAGATGAAGCCCACCGAGAACAACG | |
| sequence-based reagent | EUluc3 oligonucleotide | this paper | GATCGAATTCAGATCTAAGCTTTTACAGCTTCGAGTCGCCGCCGGCGCC | |
| sequence-based reagent | WTluc5 oligonucleotide | this paper | GATCCTCGAGATGAAACCAACTGAAAACAATG | |
| sequence-based reagent | WTluc3 oligonucleotide | this paper | GATCAAGCTTTTATAATTTACTATCACCACCGGCACCCTT | |
| sequence-based reagent | Lambda5 oligonucleotide | this paper | GATCAAGCTTTGCAGGGTGAGATTGTGGC | |
| sequence-based reagent | Lambda3 oligonucleotide | this paper | GATCGAATTCGCTCAGTTGTTCAGGAATATG | |
| sequence-based reagent | TUBF oligonucleotide | this paper | AGATCTTCAAACACTAGTTTAAGC | |
| sequence-based reagent | TUBR oligonucleotide | this paper | CATGATAAATAAATAGAAGTGCTTTGTTG | |
| sequence-based reagent | λF oligonucleotide | this paper | GATTCATAAGTTCCGCTGTGTGCCGCATCTC | |
| sequence-based reagent | λR oligonucleotide | this paper | GCTCAGTTGTTCAGGAATATGGTGCAGCAG | |
| commercial assay or kit | BioLux Gaussia luciferase | New England Biolabs | ||
| software, algorithm | Bowtie 2 | PMID: 22388286 | ||
| software, algorithm | SAMtools | PMID: 19505943 | ||
| software, algorithm | edgeR | PMID: 19910308 | ||
| software, algorithm | CAI calculator | http://www.umbc.edu//codon/cai/cais.php | ||
| software, algorithm | ANACONDA | http://bioinformatics.ua.pt/software/anaconda/ | ||
| online database | TriTrypDB, RRID:SCR_007043 | http://tritrypdb.org/tritrypdb/ |
Additional files
-
Supplementary file 1
Sheet 1: Synthetic genes.
Sequences of gLUC and GFP genes with high, medium or low proportions of GC3-codons. Sheet 2: T. brucei expression data. CAI values, proteome and transcriptome data and predicted expression levels are tabulated for the non-redundant gene sets analysed in Figures 5–6. Sheet 3: T. brucei gene cohorts. Data for the genes analysed in Figure 7. Sheet 4: T. brucei - extended set of ranked CAI values and predictions, including GeneID and product description; n = 8479. Sheet 5: T. vivax - ranked CAI values and predictions, including GeneID and product description; n = 7836. Sheet 6: L. mexicana - ranked CAI values and predictions, including GeneID and product description; n = 5715.
- https://doi.org/10.7554/eLife.32496.014
-
Transparent reporting form
- https://doi.org/10.7554/eLife.32496.015
Download links
A two-part list of links to download the article, or parts of the article, in various formats.
Downloads (link to download the article as PDF)
Open citations (links to open the citations from this article in various online reference manager services)
Cite this article (links to download the citations from this article in formats compatible with various reference manager tools)
Codon usage bias controls mRNA and protein abundance in trypanosomatids
eLife 7:e32496.
https://doi.org/10.7554/eLife.32496


