The small molecule ISRIB rescues the stability and activity of Vanishing White Matter Disease eIF2B mutant complexes
- Calico Life Sciences LLC, United States
- AbbVie, United States
Figures
Figure 1 with 1 supplement
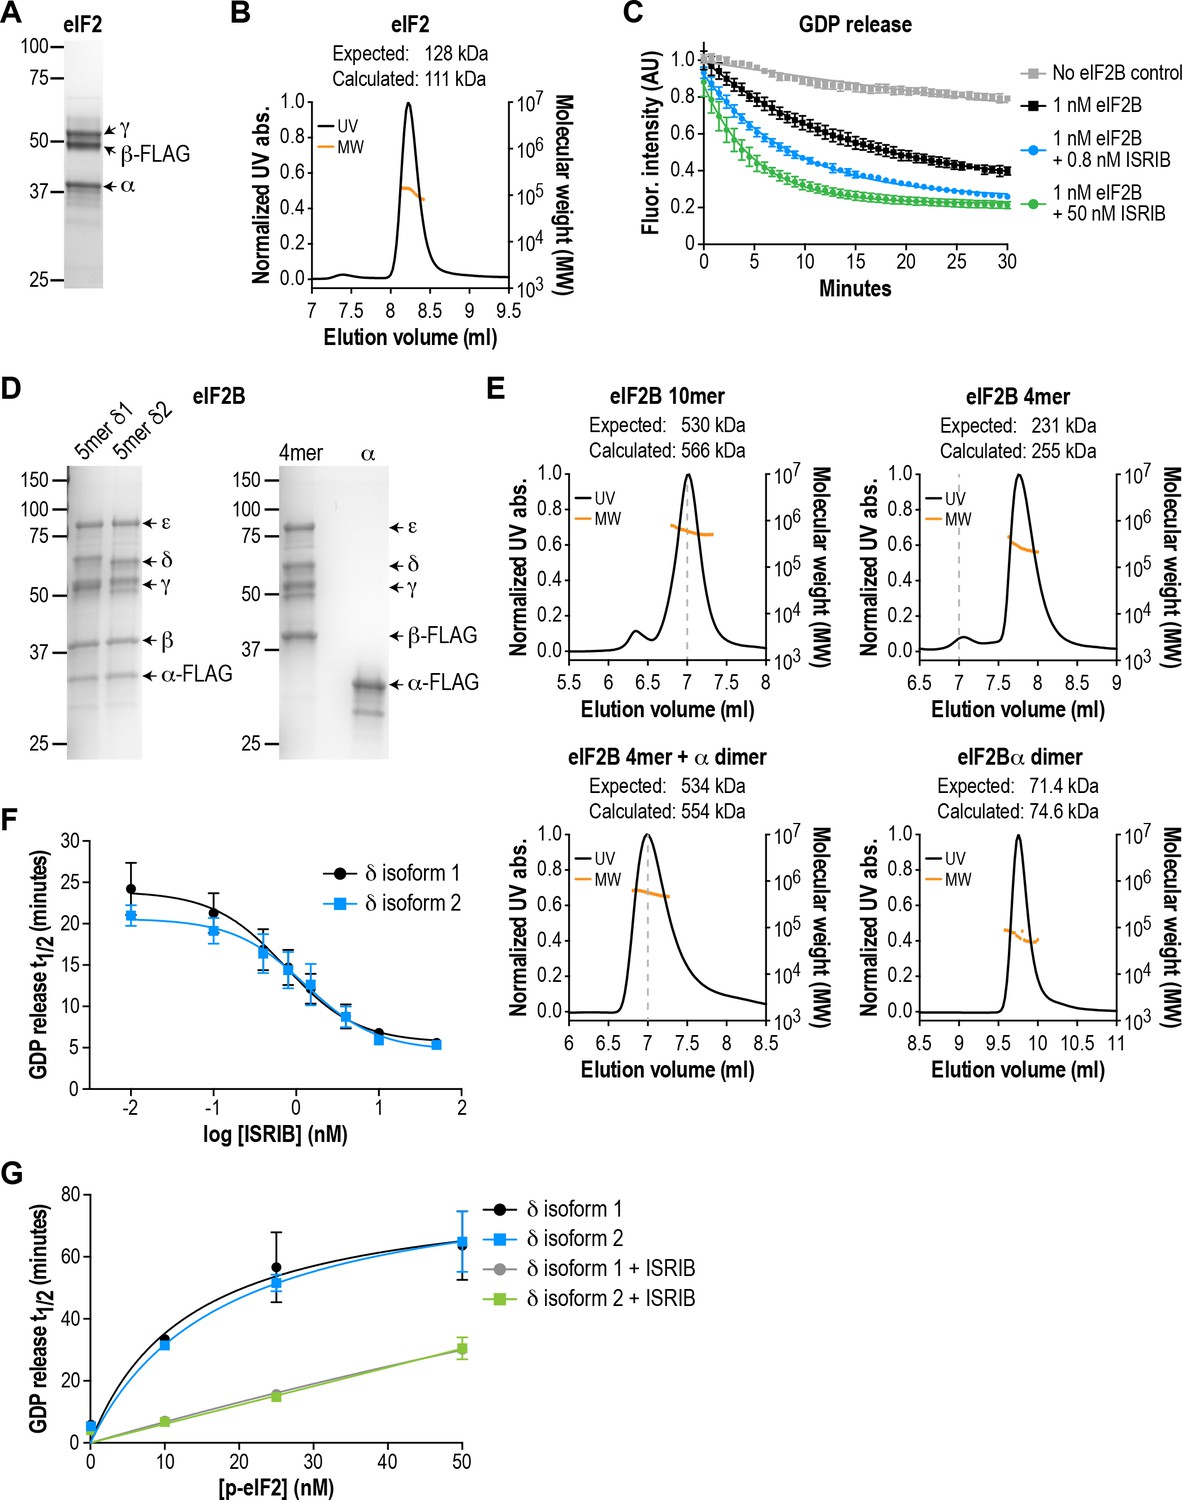
eIF2B isoforms have identical GEF activity and ISRIB alters the sensitivity of eIF2B to eIF2 phosphorylation.
(A) Coomassie-stained SDS-PAGE gel of recombinant human eIF2 used as a substrate in the in vitro GEF assays. (B) Multi-angle light scattering analysis of purified eIF2, indicating good agreement between measured and expected molecular weights for the heterotrimeric complex. (C) eIF2B stimulates GDP release from eIF2 that is further enhanced by addition of ISRIB. Bodipy-FL-GDP was loaded onto eIF2, and its release measured over time as a decay in fluorescence with or without eIF2B and ISRIB. Representative fluorescence intensity curves are shown. Intensities were normalized to the starting values for the no-lysate control condition. (D) Coomassie-stained SDS-PAGE gels of purified recombinant human eIF2B complexes. (E) Multi-angle light scattering analysis of purified WT eIF2B. The (αβδγε)2 complex (δ2 isoform) ran as a 10mer. The βδγε subcomplex ran as a 4mer, whereas the α subunit forms a homodimer. Combining separately purified βδγε and α subunit reconstituted the 10mer. The dashed gray line marks the 7 ml elution position to facilitate comparisons between plots. (F) δ1 and δ2 isoforms of eIF2B behaved identically with respect to GEF activity and response to ISRIB. 5 nM phospho-eIF2 was included in the assay. (G) Dose-response curves of GDP release half-life in the presence of increasing amounts of phospho-eIF2. The curves of δ1 + ISRIB (grey) and δ2 + ISRIB (green) overlap each other. For (F) and (G), half-lives of GDP release at each ISRIB concentration were calculated by fitting single-exponential decays to the Bodipy-FL-GDP fluorescence decay curves. Each point represents 9 measurements from three independent experiments (mean ± SD).
Figure 1—figure supplement 1
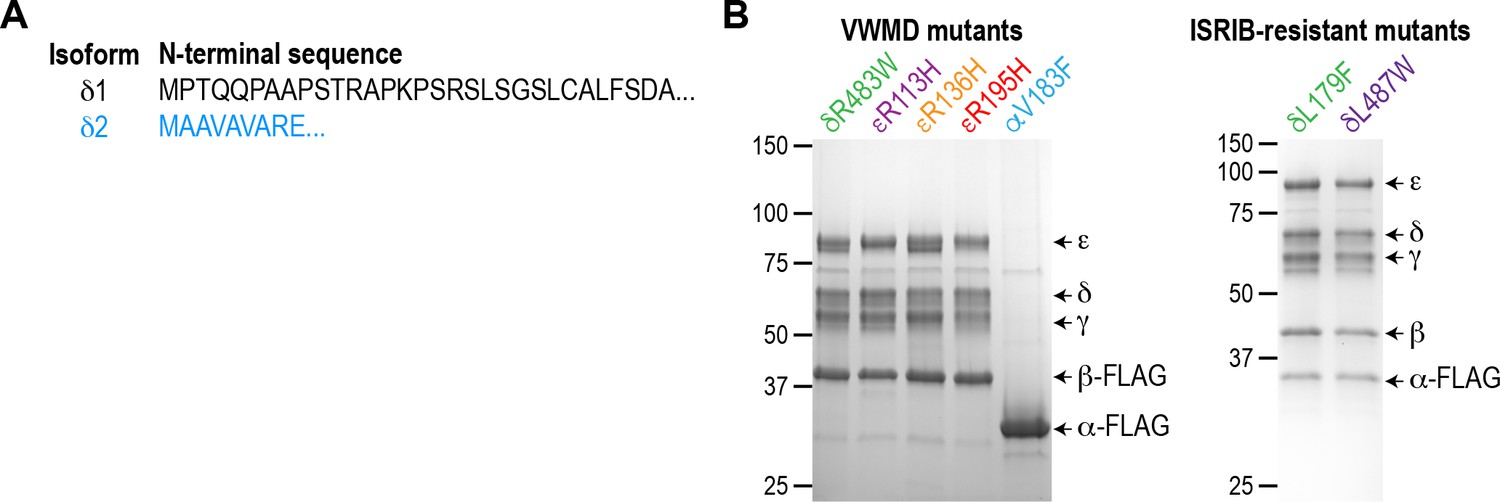
Purification of eIF2B mutants.
(A) Primary sequence of the eIF2B δ1 and δ2 isoforms, showing the region in which they differ at the N-terminus of the protein. (B) Coomassie-stained SDS-PAGE gels of purified recombinant human mutant eIF2B complexes.
Figure 2 with 2 supplements

Recombinant eIF2B VWMD mutants have reduced GEF activity and complex stability that is rescued by ISRIB.
(A) VWMD mutations tested in this study, visualized as spheres on the structure of S. pombe eIF2B (PDB: 5B04; Kashiwagi et al., 2016). The human mutation sites are shown in plain text and the corresponding yeast residues in superscript. For clarity, only one of each pair of residues is labeled. (B) Half-lives of GDP release for recombinant WT and VWMD eIF2B, calculated by fitting single-exponential decays to the Bodipy-FL-GDP fluorescence decay curves. All VWMD mutants except εR136H had reduced GEF activity that is significantly stimulated by ISRIB (p<0.001). Significance is shown for comparisons of each mutant to WT and between selected mutants. **p<0.005, ***p<0.001, ns, not significant. (C) ISRIB EC50 values calculated from dose-response measurements in GEF assays (individual curves shown in Figure 2—figure supplement 1A). Significance is shown for comparisons of each mutant to WT. **p<0.01, ***p<0.001. (D) Dose-response curves of GDP release half-life in the presence of increasing amounts of WT or V183F α subunit. For (B)-(D), half-lives of GDP release at each ISRIB/α concentration were calculated by fitting single-exponential decays to the Bodipy-FL-GDP fluorescence decay curves. Each point represents 9 measurements from three independent experiments (mean ±SD). (E) All eIF2B VWMD mutant complexes except εR136H have reduced complex stability compared to WT. Size-exclusion chromatograms of reconstituted wild-type and VWMD mutant eIF2B complexes in the presence of 300 mM NaCl. The elution positions of the (αβδγε)2 10mer and βδγε 4mer are indicated. A cartoon schematic of 10mer formation is shown above the graphs. (F) Quantification of eIF2B 10mer:4mer peak ratios from (E), which serves as a measure of complex stability (N = 3, mean ± SD). *p<0.05, ***p<0.001, ns, not significant. Significance is shown for comparisons to WT within a condition (vehicle or ISRIB). Between conditions for a given construct, all differences were significant (p<0.005).
Figure 2—figure supplement 1

Recombinant eIF2B VWMD mutants have reduced GEF activity that is rescued by ISRIB.
(A) All eIF2B VWMD mutant complexes except εR136H have reduced GEF activity compared to WT. ISRIB dose-response curves of GDP release half-life for each mutant. Half-lives of GDP release at each ISRIB concentration were calculated by fitting single-exponential decays to the Bodipy-FL-GDP fluorescence decay curves. Data from the WT curve is reproduced in each of the VWMD mutant plots as a dotted line for comparison. The ISRIB EC50 values were similar between WT and VWMD eIF2B. Each point represents 9 measurements from three independent experiments (mean ± SD). (B) ISRIB stabilizes an octameric form of eIF2B in the absence of eIF2Bα. Size-exclusion chromatograms of wild-type eIF2B tetramers (no α subunit) in the presence of 300 mM NaCl. The elution positions of the (βδγε)2 8mer and βδγε 4mer are indicated. (C) Michaelis-Menten curves of GDP release rate constants in the presence of increasing amounts of WT or V183F α subunit. WT dimeric α subunit is ~40X better at stimulating GEF activity (Km = 6 nM) compared to the monomeric V183F VWMD mutation (Km = 246 nM). ISRIB synergizes with α subunit, reducing the amounts required for GEF activity stimulation (Km = 3.6 nM for αWT and 88 nM for αV183F). Each point represents 9 measurements from three independent experiments (mean ± SD).
Figure 2—figure supplement 2
Recombinant eIF2B VWMD mutants have reduced complex stability that is rescued by ISRIB.
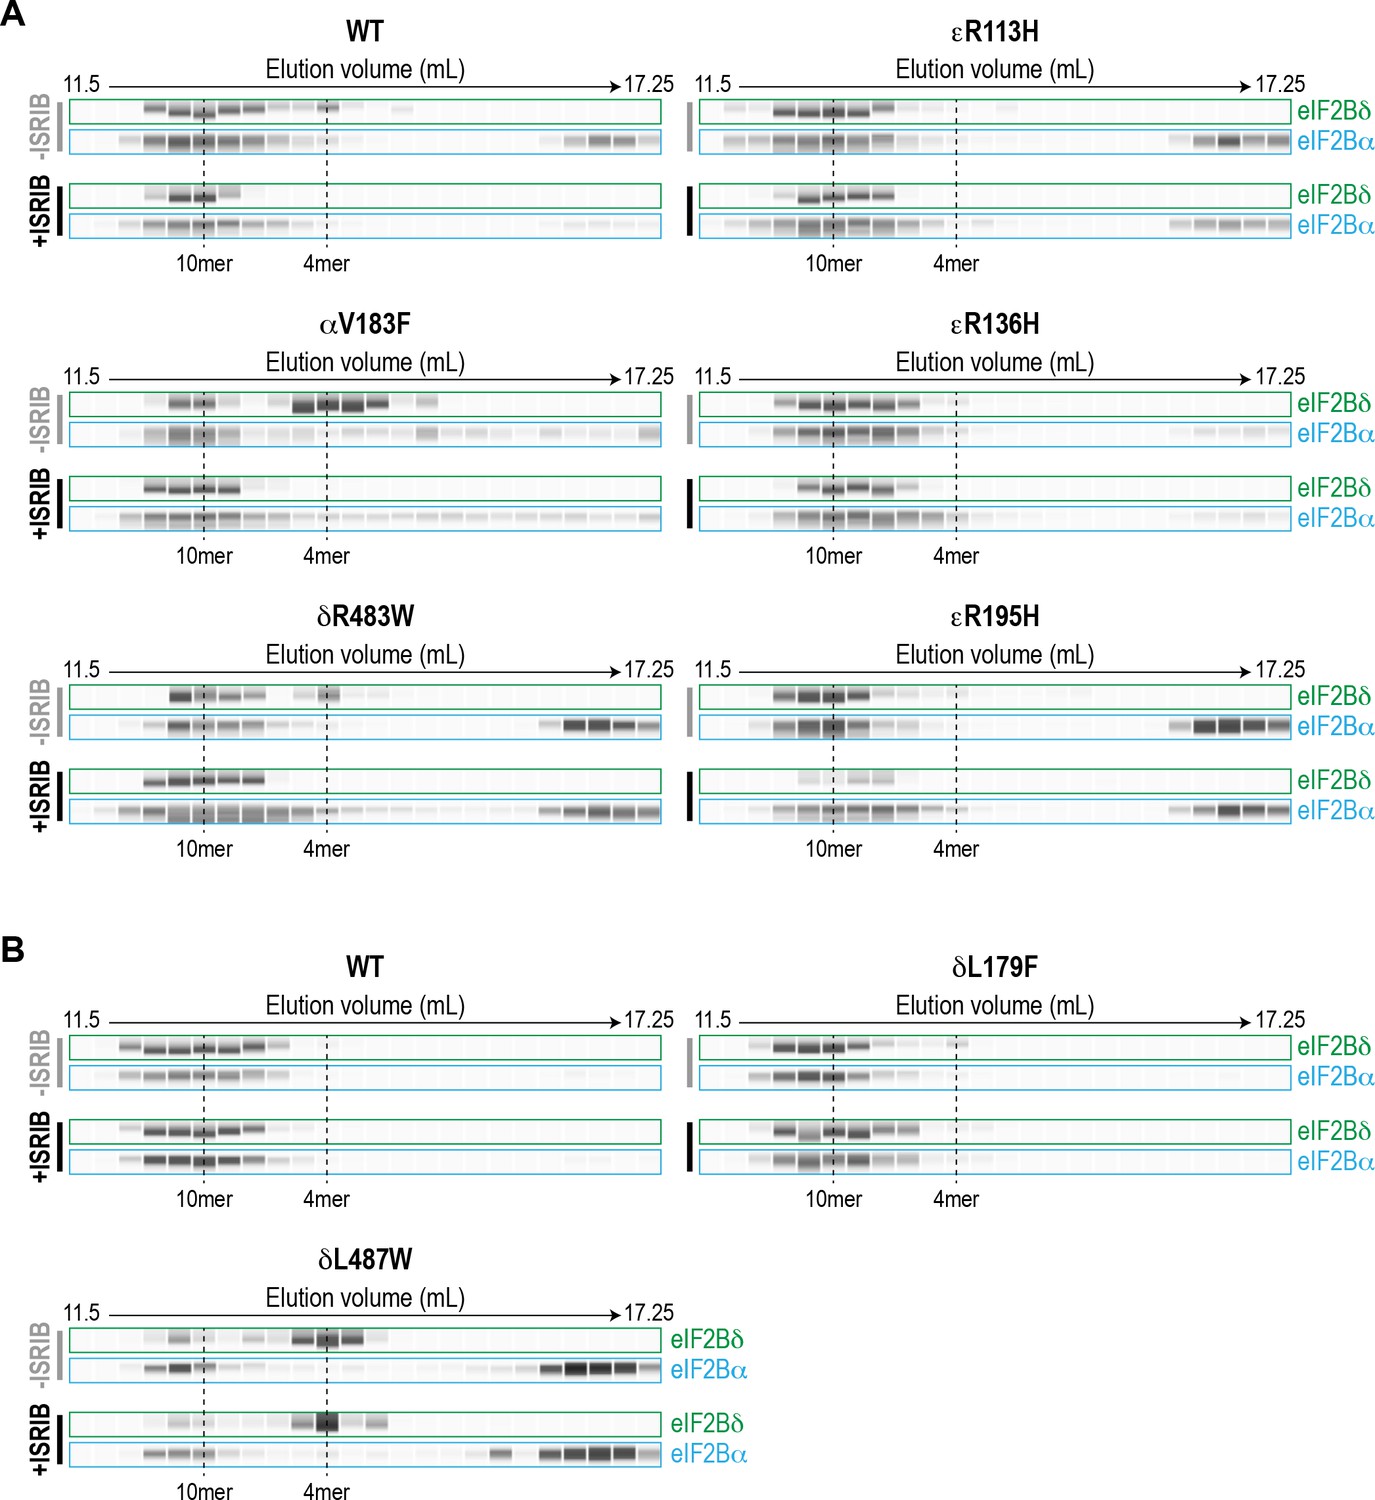
(A–B) Immunoblotting of eIF2Bδ (representative of the 4mer subcomplex) and eIF2Bα from the SEC experiments in (A) Figure 2E and (B) Figure 3B. Bands shown are simulated representations of the electropherogram signal from the Wes instrument. Dashed lines indicate the positions of 10mer and 4mer based on UV peak profiles (see Figure 2E and Figure 3B).
Figure 3
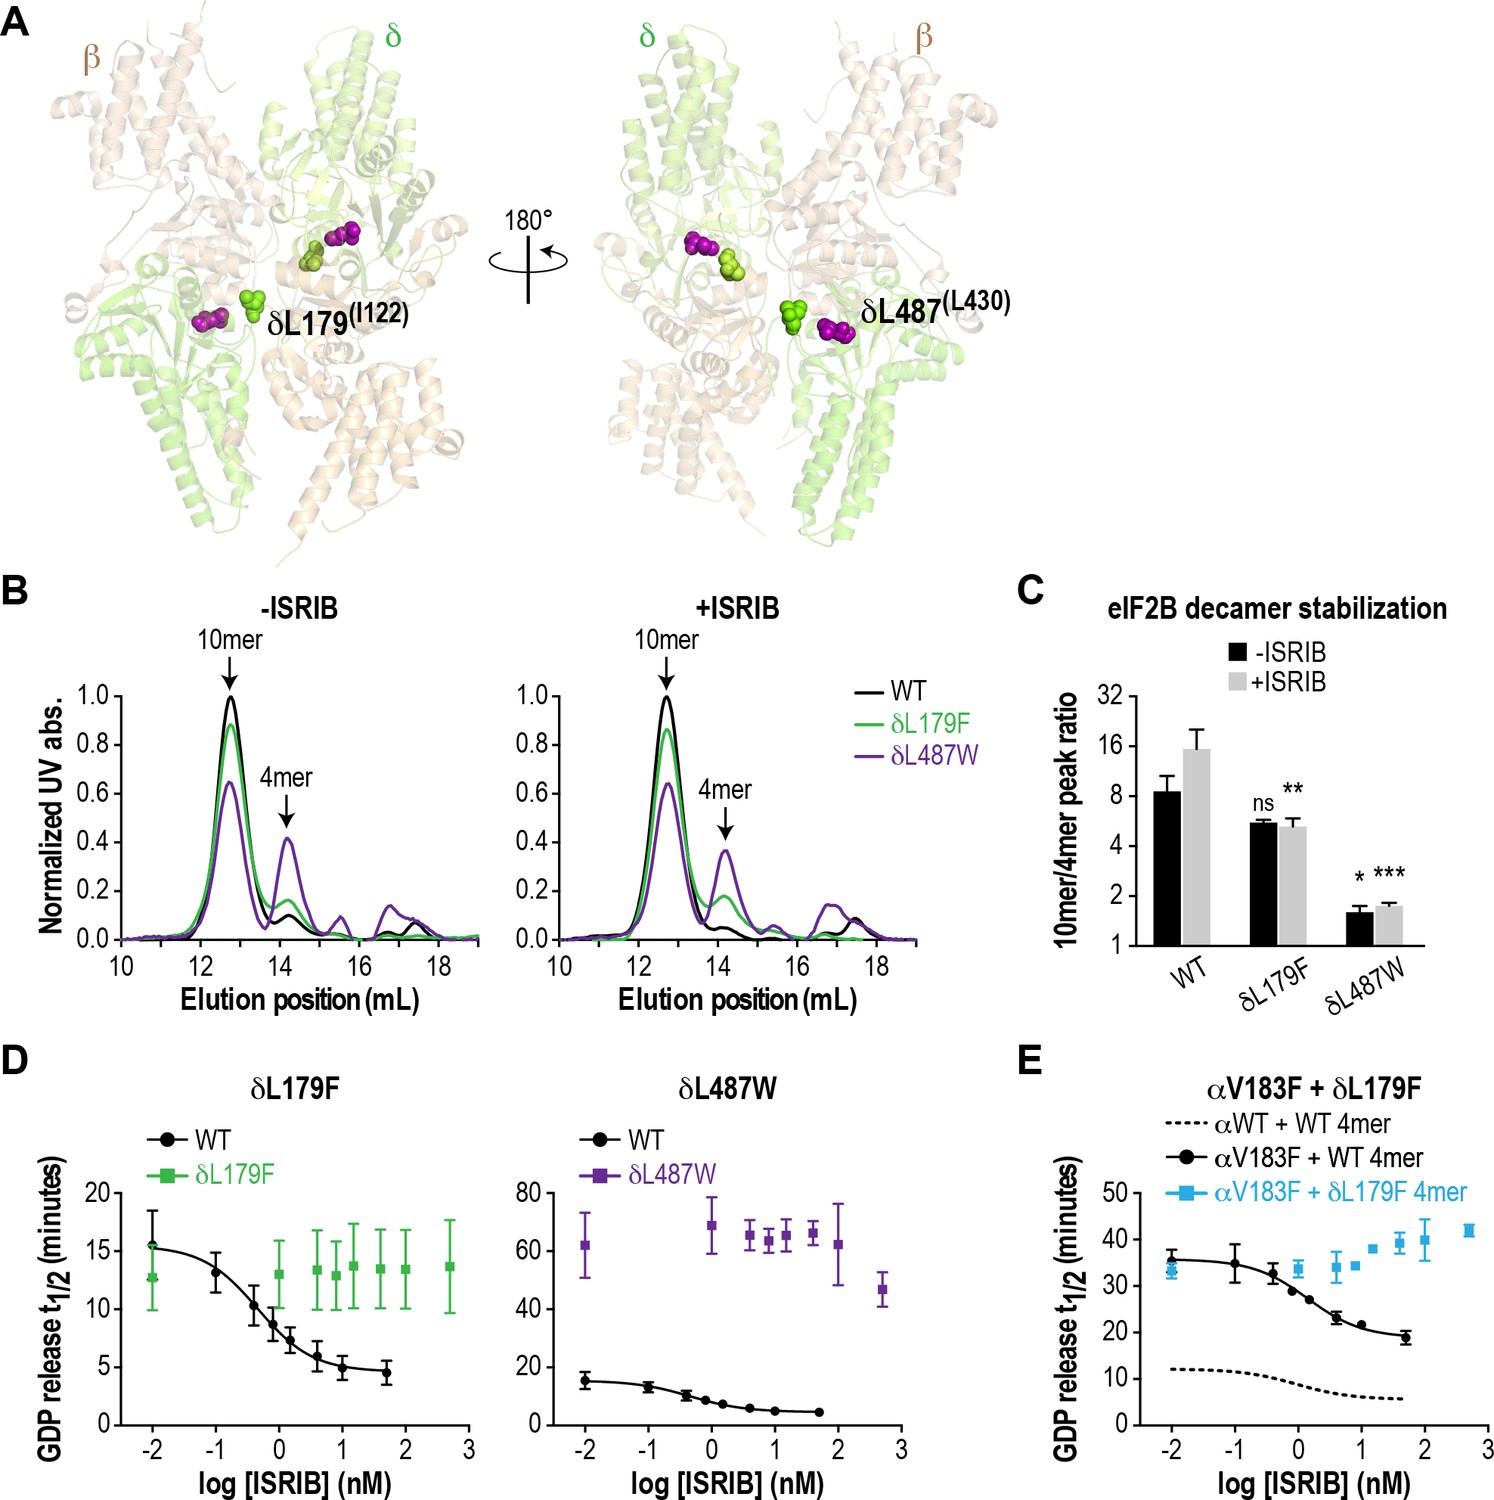
ISRIB-resistant mutants in the δ subunit can exhibit WT or VWMD-like stability and GEF activity.
(A) ISRIB-resistant mutations tested in this study, visualized as spheres on the structure of S. pombe eIF2B (PDB: 5B04; Kashiwagi et al., 2016). The human mutation sites are shown in plain text and the corresponding yeast residues in superscript. For clarity, only one of each pair of residues is labeled. (B) ISRIB-resistant mutants have reduced complex stability and are unresponsive to 200 nM ISRIB. Size-exclusion chromatograms of reconstituted WT and ISRIB-resistant eIF2B complexes in the presence of 300 mM NaCl. The elution positions of the (αβδγε)2 10mer and βδγε 4mer are indicated. (C) Quantification of eIF2B 10mer:4mer peak ratios from (A) (N = 2, mean ±SD). *p<0.05, **p<0.005, ***p<0.001, ns, not significant. Significance is shown for comparisons to WT within a condition (vehicle or ISRIB). Between conditions for a given construct, only WT was significant with p<0.05. (D) The GEF activity of ISRIB-resistant mutants is not enhanced by up to 500 nM ISRIB (550X WT EC50). ISRIB dose-response curves of GDP release half-life for WT, δL179F and δL487W 5mers. (E) ISRIB dose-response curves of GDP release half-life for WT and δL179F 4mer mixed with αV183F. Data from the WT 4mer + αWT is reproduced from Figure 2—figure supplement 1A as a dotted line for comparison. For (D) and (E), each point represents 9 measurements from three independent experiments (mean ± SD).
Figure 4 with 4 supplements
ISRIB attenuates the ISR and rescues the GEF activity of eIF2B in HEK293T VWMD mutant cells.
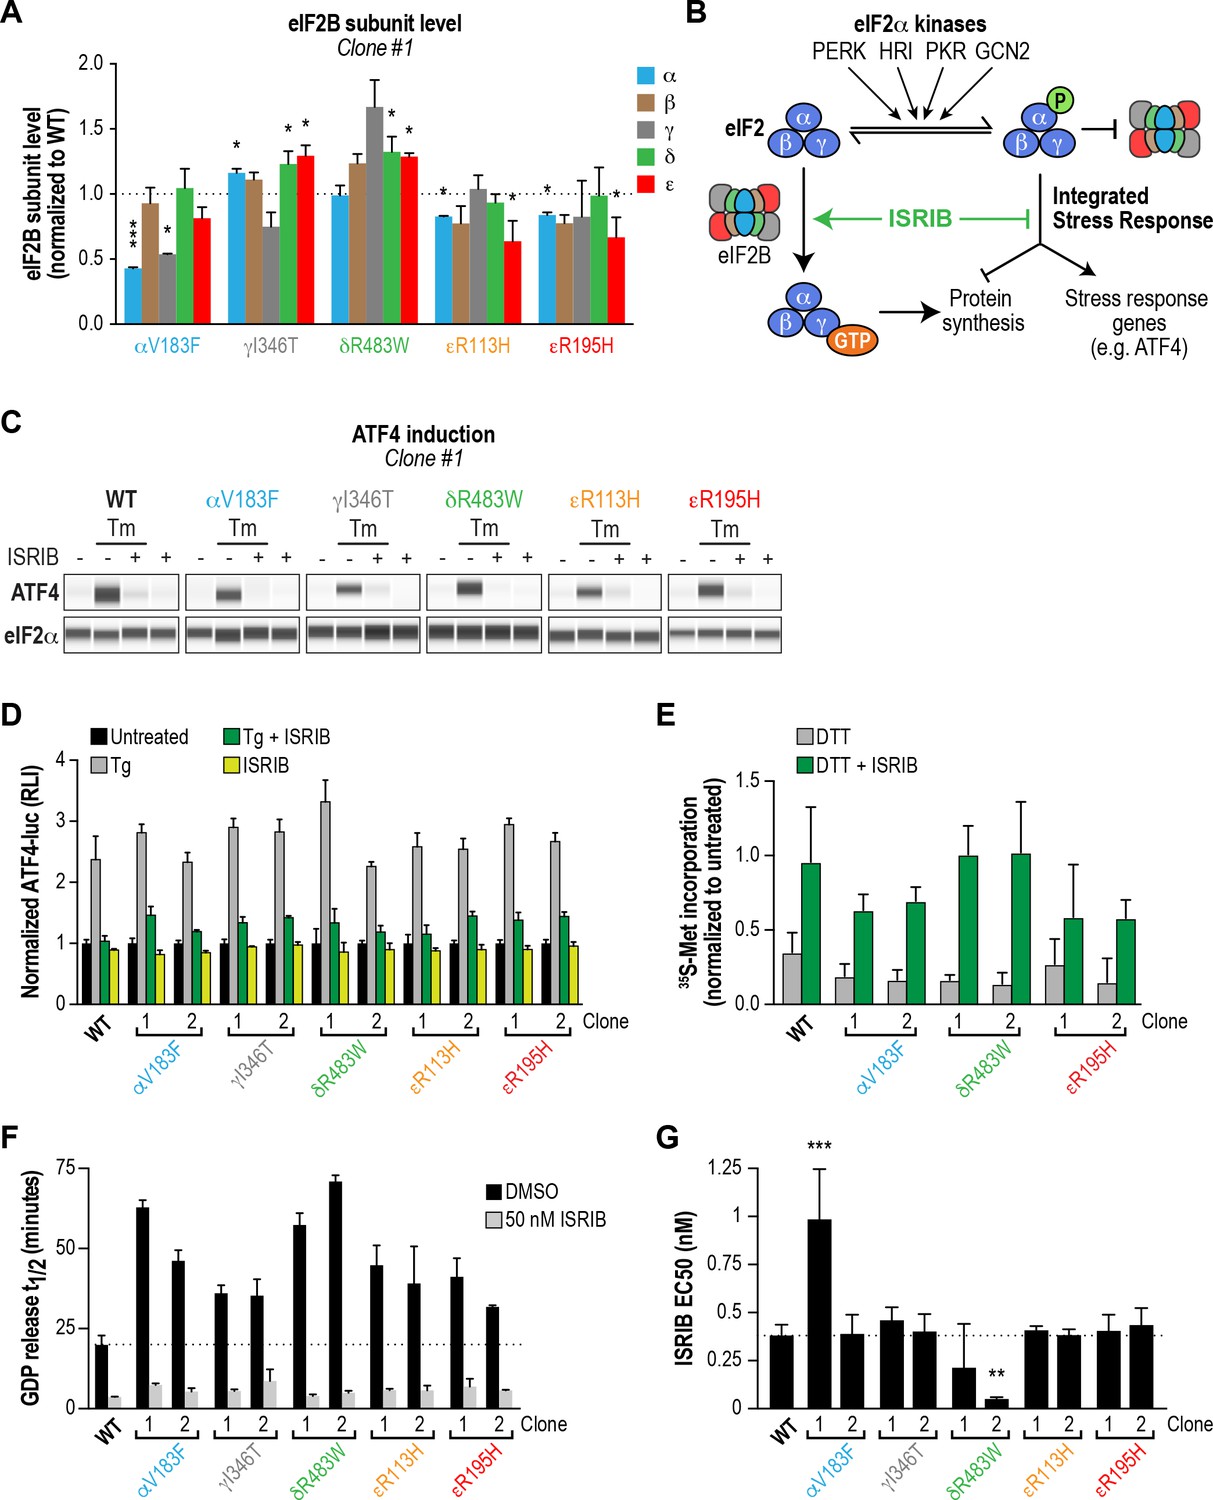
(A) Levels of the five eIF2B subunits were measured by immunoblotting (Wes analysis) of lysates from WT and VWMD cell lines. The chemiluminescence signal of each subunit was normalized to α-tubulin as a loading control and subsequently normalized again to WT subunit levels (N = 2, mean ± SD). The Wes image of one replicate is shown in Figure 4—figure supplement 1B. Quantification of a second clone of each mutant is shown in Figure 4—figure supplement 1C. Significance is shown for each subunit compared to WT; *p<0.05, ***p<0.001. (B) Schematic depicting the two outputs of the ISR: reduction in bulk protein synthesis and translational induction of ISR target genes. (C) ISRIB blocks ATF4 induction in VWMD mutants. Immunoblot analysis of endogenous ATF4 protein levels in WT and VWMD mutant cells. Total eIF2α was used as a loading control. Cells were treated with or without 1 μg/mL Tm and 500 nM ISRIB for 3 hr. A representative experiment is shown (N = 2). Similar results were observed in the second clone of each mutant (Figure 4—figure supplement 2A). (D) ISRIB attenuates Tg-evoked reporter activity in VWMD mutants. Relative luminescence values for the indicated cell lines treated with 100 nM Tg ± 500 nM ISRIB for 3 hr (N = 4, mean ± SD). The values were normalized to the signal of untreated control within each cell line. In every cell line, ISRIB significantly reduced the Tg-induced reporter signal (p<0.001). (E) ISRIB rescues 35S-methionine incorporation in both WT and VWMD mutants to a similar extent. Cells were treated with 2.5 mM DTT ± 500 nM ISRIB for 1 hr and pulsed with 35S-methionine 20 min prior to collection. Lysates were subjected to SDS-PAGE and quantification of radiolabeled methionine incorporation was done by gel densitometry in a Typhoon FLA scanner and normalized to that of untreated cells (N = 2, mean ± SD). Raw images used to quantify the lane intensities are shown in Figure 4—figure supplement 2D. (F) Half-lives of GDP release for WT and VWMD HEK293T lysates, calculated by fitting single-exponential decays to the Bodipy-FL-GDP fluorescence decay curves. All VWMD mutants had significantly reduced GEF activity (p<0.001) that is stimulated by ISRIB. (G) ISRIB EC50 values calculated from dose-response measurements in GEF assays (individual curves shown in Figure 4—figure supplement 4C). Significance is shown for comparisons of each mutant to WT; **p<0.005, ***p<0.001. For (F) and (G), each bar represents 9 measurements from three independent experiments (mean ± SD).
Figure 4—figure supplement 1
Several VWMD mutations reduce the protein level of the affected subunit in cells.
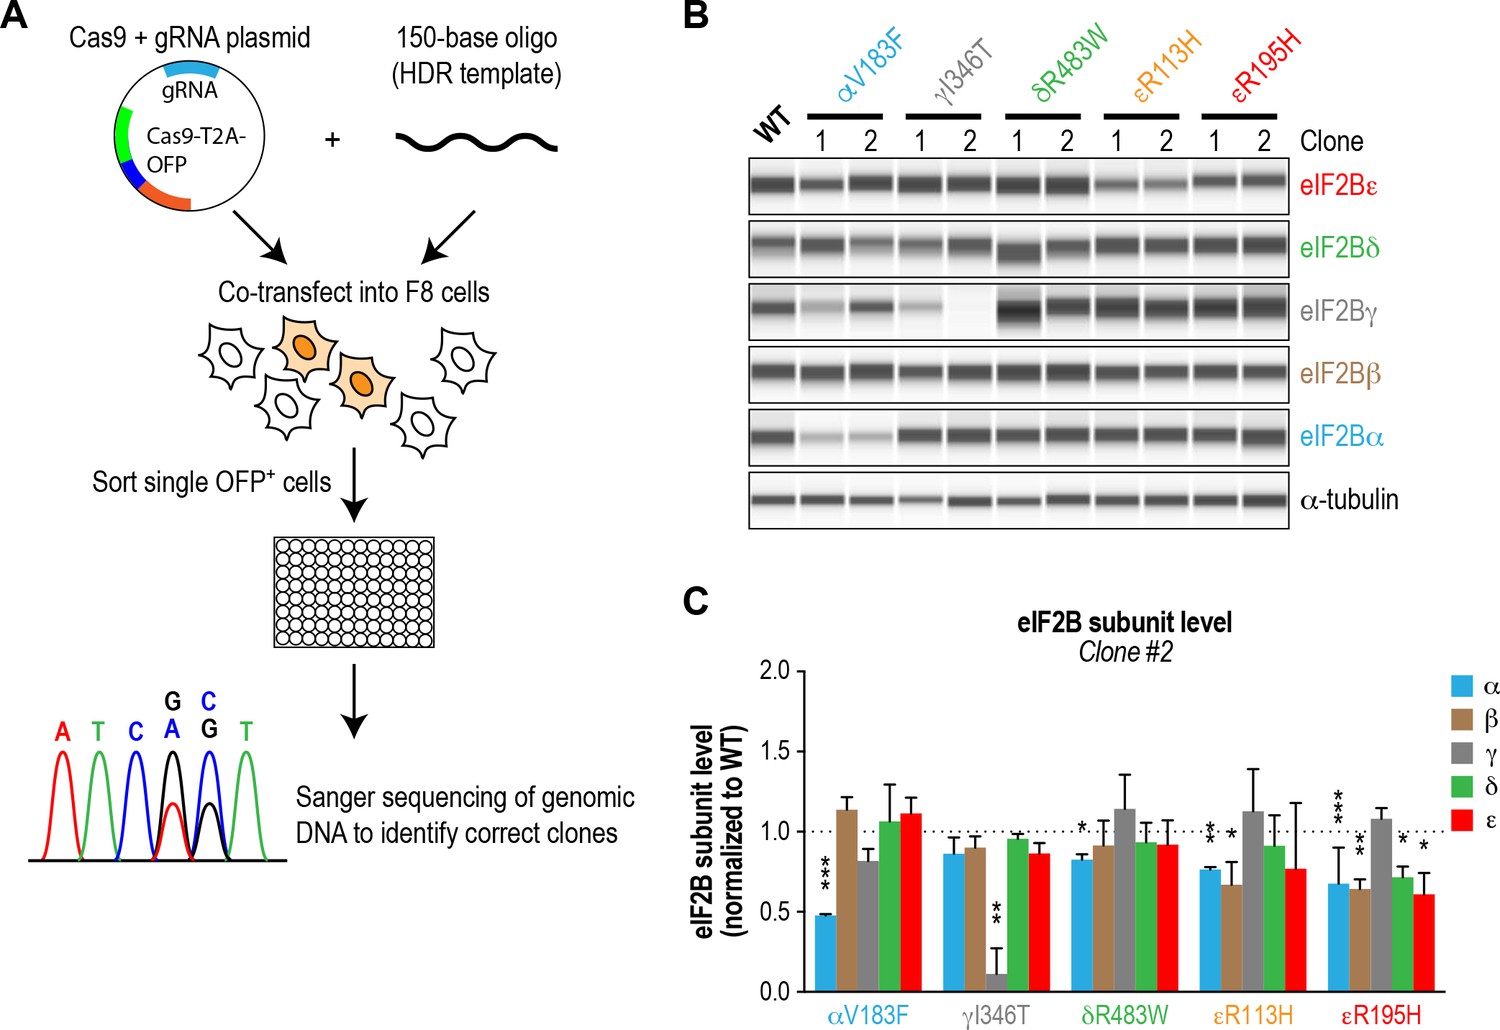
(A) Schematic of the workflow used to generate VWMD mutant HEK293T cell lines. Cells were co-transfected with a Cas9-OFP-gRNA plasmid and a ssDNA HDR template targeting a specific mutation. OFP-positive cells were single-sorted into 96 well-plates, expanded and sequenced to identify clones harboring the VWMD mutation of interest. (B) eIF2B immunoblots (Wes analysis) of lysates from WT and VWMD cell lines. α-tubulin was used as a loading control. A representative experiment is shown. Bands shown are simulated representations of the electropherogram signal from the Wes instrument. Two independent clones of each VWMD cell line were analyzed. (C) Levels of the five eIF2B subunits in clone 2. The chemiluminescence signal of each subunit was normalized to α-tubulin as a loading control and subsequently normalized again to WT subunit levels (N = 2, mean ± SD). Significance is shown for each subunit compared to WT; *p<0.05, **p<0.01, ***p<0.001.
Figure 4—figure supplement 2
VWMD mutant cells have normal rates of protein synthesis and ISRIB partially rescues a stress-induced reduction.
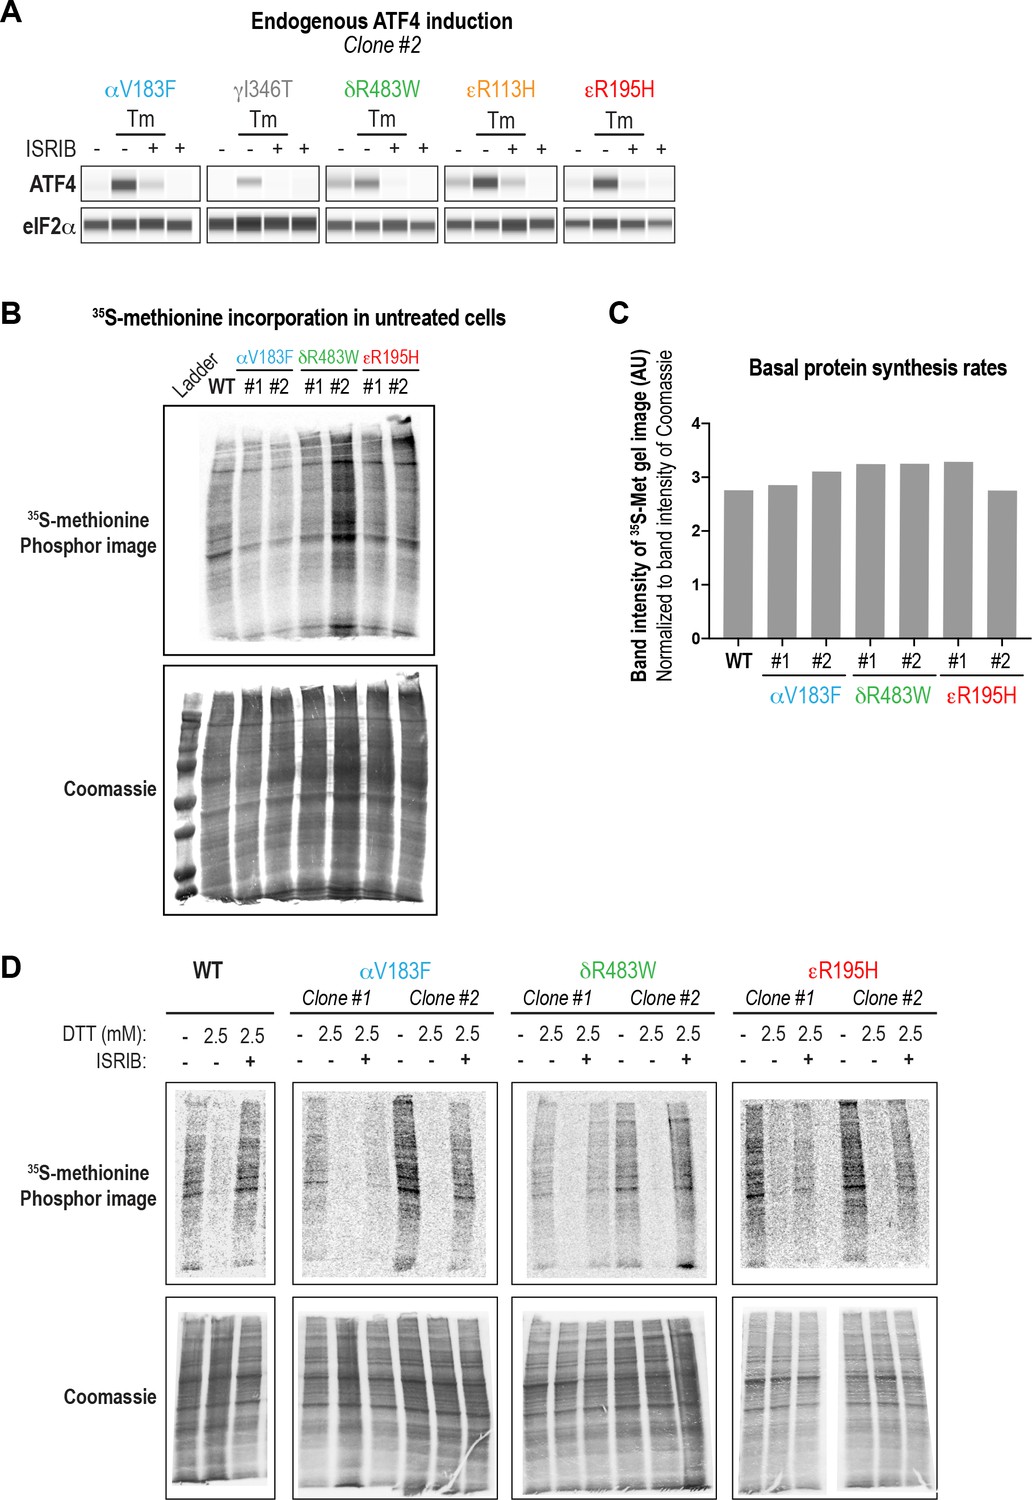
(A) ISRIB blocks ATF4 induction in VWMD mutants. Immunoblot (Wes analysis) of endogenous ATF4 protein levels in WT and VWMD mutant cells. Total eIF2α was used as a loading control. Cells were treated with or without 1 μg/mL Tm and 500 nM ISRIB for 3 hr. A representative experiment for the second clone of each mutant is shown (N = 2). (B) WT and VWMD mutant cells were pulsed with 35S-methionine for 20 min prior to collection. Lysates were subjected to SDS-PAGE, and gels were dried and imaged on a Typhoon FLA scanner. Total protein content in each lane was visualized by Coomassie staining. Two independent clones of each VWMD cell line were analyzed. (C) Quantification of gel images in (B). For each lane, the radioactive signal intensity was normalized to total protein as measured by Coomassie staining. (D) ISRIB partially rescues protein synthesis in both WT and VWMD mutants. Cells were treated with 2.5 mM DTT ± 500 nM ISRIB for 1 hr and pulsed with 35S-methionine 20 min prior to collection. Lysates were subjected to SDS-PAGE and quantification of radiolabeled methionine incorporation was done by gel densitometry in a Typhoon FLA scanner (N = 2 clones, mean ± SD). The quantification of signal density is shown in Figure 4E.
Figure 4—figure supplement 3
VWMD mutant cells show a similar response to ER stress as WT cells.
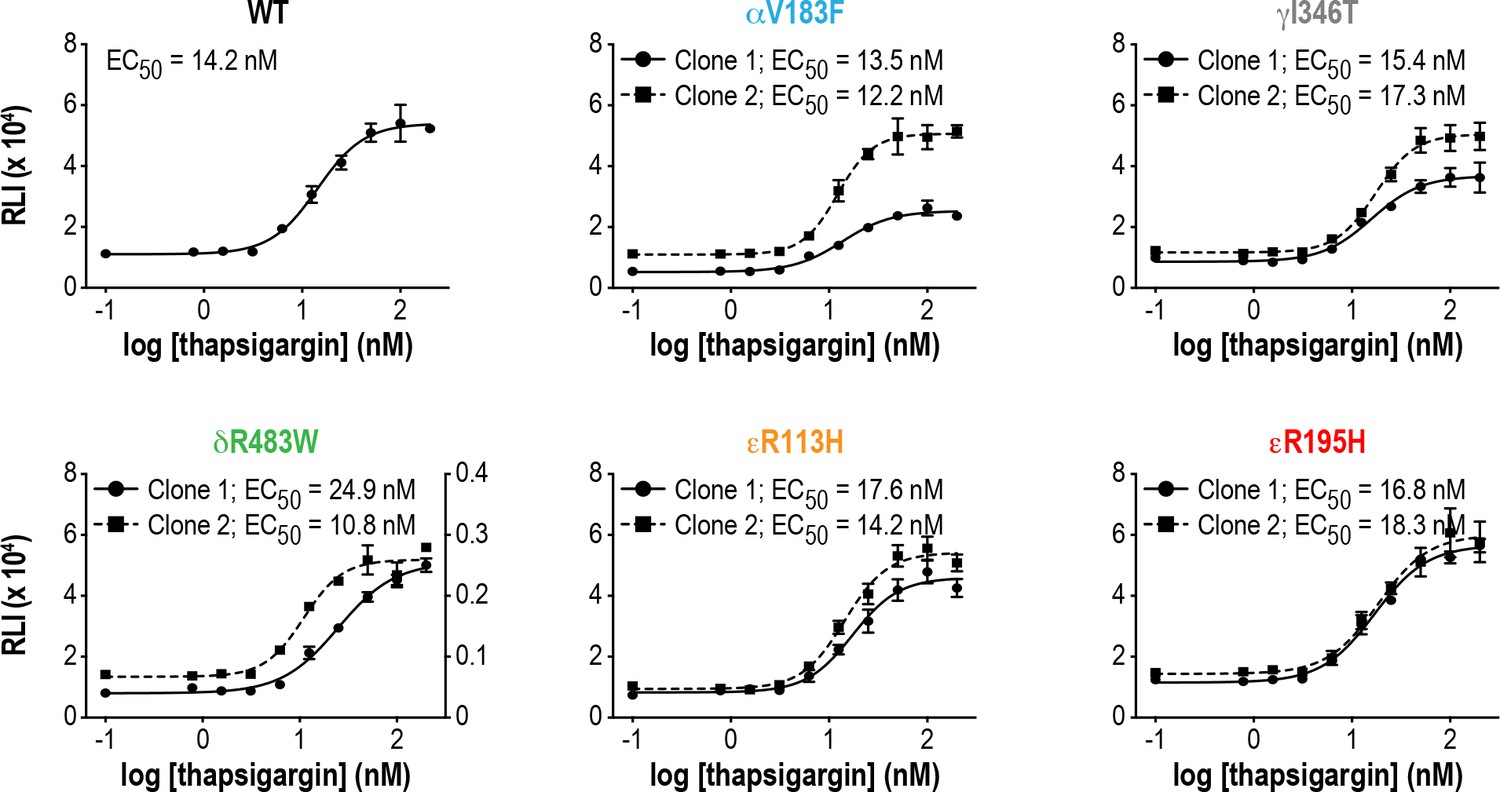
Tg dose-response curves of ATF4-luciferase reporter activity in WT and VWMD cell lines. Cells were treated with increasing concentrations of Tg for 7 hr (N = 3, mean ± SD). The values for δR483W clone #1 are plotted on the right y-axis, due to the low luminescence output from this clone.
Figure 4—figure supplement 4
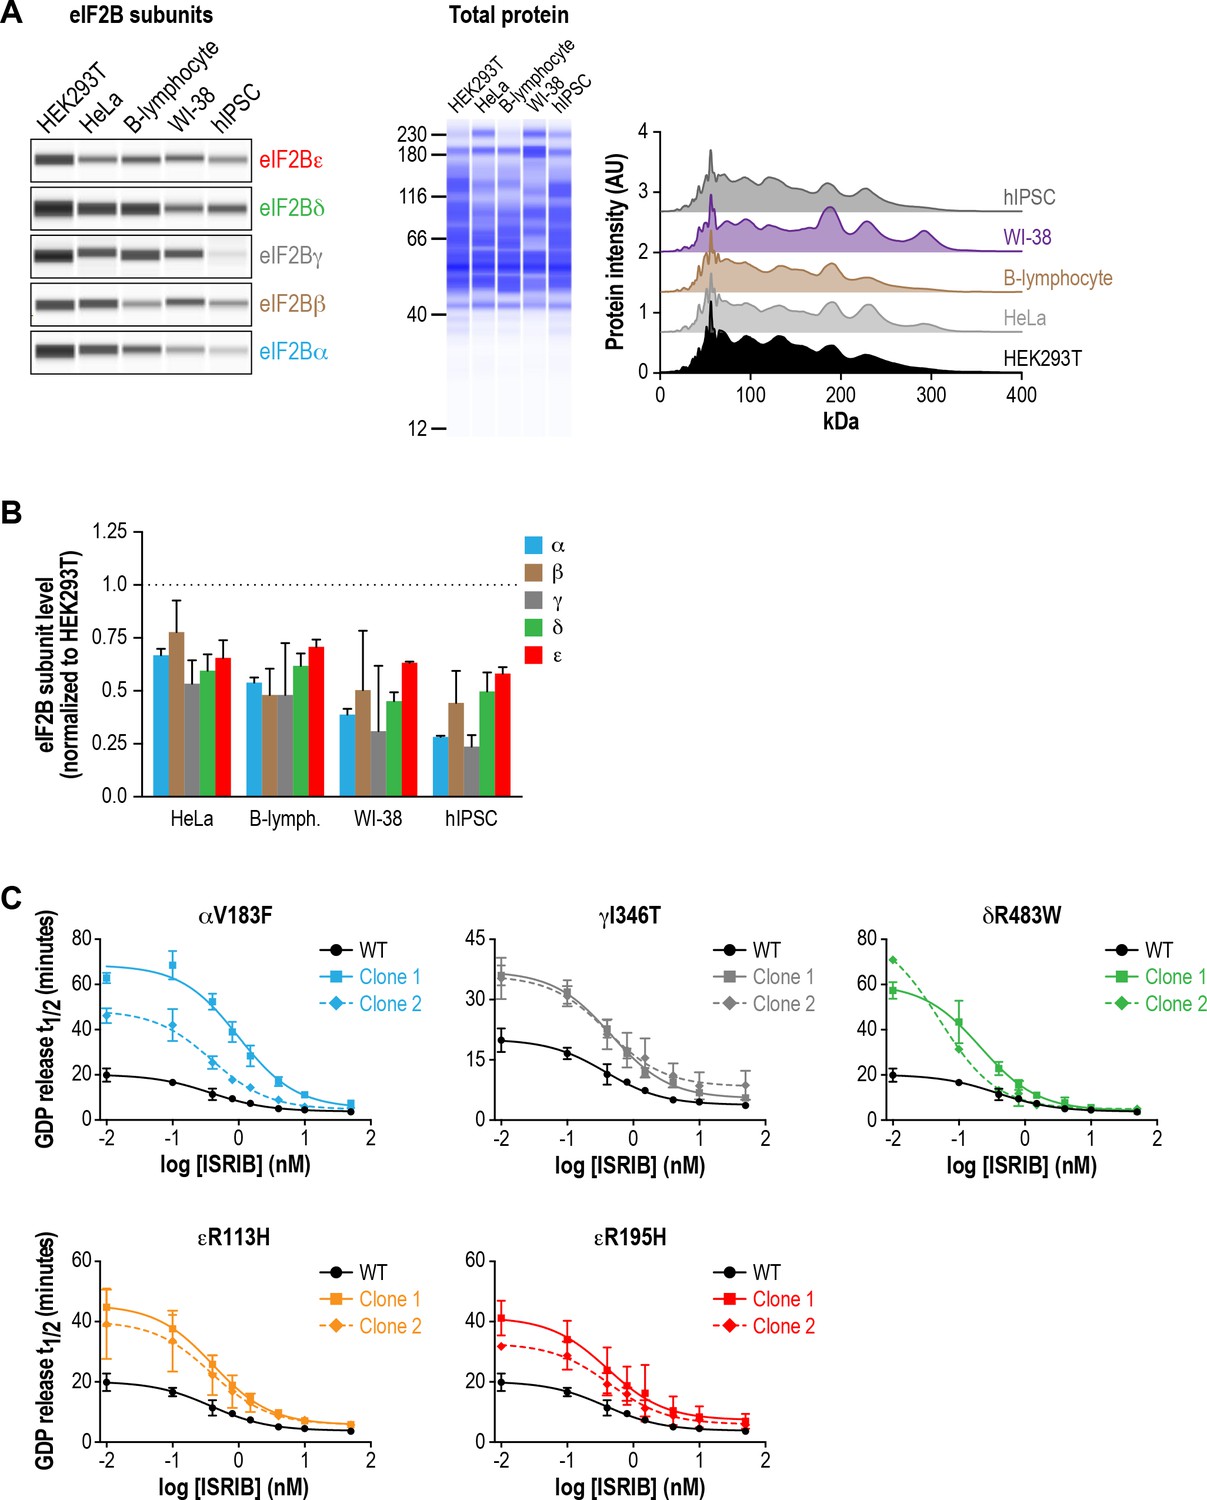
Lysates from VWMD cells exhibit reduced GEF activity in vitro that is enhanced by ISRIB.
(A) Levels of the five eIF2B subunits were measured by immunoblotting (Wes analysis) of lysates from different cell lines. The cell lines were: HEK293T (human embryonic kidney, SV40-transformed), HeLa (adenocarcinoma), primary B-lymphocyte (EBV-transformed), WI-38 (normal lung fibroblast) and hIPSC (human induced pluripotent stem cell). The protein concentration of each lysate was normalized to 0.2 mg/mL and 0.2 μL of each sample was loaded onto the Wes instrument. Representative images of eIF2B subunits and total protein are shown. An intensity trace of total protein in each Wes capillary is also shown, confirming equal protein loading. (B) The chemiluminescence signal of each subunit was normalized to HEK293T subunit levels (N = 2, mean ± SD). All subunits were significantly different from HEK293T (p<0.01) with the exception of HeLa eIF2Bβ, which was not significant. (C) ISRIB dose-response curves of GDP release half-life for the eIF2B VWMD mutants. Half-lives of GDP release at each ISRIB concentration were calculated by fitting single-exponential decays to the Bodipy-FL-GDP fluorescence decay curves. Data from the WT curve is reproduced in each of the VWMD mutant plots as a solid black line for comparison. Every VWMD lysate exhibited reduced GEF activity compared to WT lysate, which could be rescued by ISRIB in a dose-dependent manner. Each point represents 9 measurements from three independent experiments (mean ± SD).
Tables
Table 1
eIF2B mutants generated in this study
https://doi.org/10.7554/eLife.32733.007| eIF2B subunit | Mutation | Age of disease onset (years) | Disease alleles | HEK293T cells generated | Recombinant protein generated |
|---|---|---|---|---|---|
| α | V183F | 10–17 | Homozygous* | X | X |
| γ | I346T | 1–4 | Homozygous; also compound heterozygous with G47E† | X | - |
| δ | R483W | <1 | Homozygous‡ | X | X |
| ε | R113H | 1–30 | Homozygous; also compound heterozygous with multiple other mutations§ | X | X |
| ε | R136H | 3 | Homozygous# | - | X |
| ε | R195H | <1 | Homozygous** | X | X |
| δ | L179F | ISRIB-resistant; not naturally occurring†† | - | X | |
| δ | L487W | ISRIB-resistant; not naturally occurring | - | X | |
-
*Ohlenbusch et al., 2005
†Wu et al., 2009
-
‡van der Knaap et al., 2003
§Fogli et al., 2004
-
#Kantor et al., 2005
**Fogli et al., 2002
-
††Sekine et al., 2015
Key resources table
| Reagent type or resource | Designation | Source or reference | Identifiers | Additional information |
|---|---|---|---|---|
| Cell line (H. sapiens) | HEK293T with ATF4-Luc reporter | PMID: 23741617 | ||
| Cell line (H. sapiens) | HEK293T (eIF2Bα V183F) with ATF4-Luc reporter | This paper | two clones generated | |
| Cell line (H. sapiens) | HEK293T (eIF2Bγ I346T) with ATF4-Luc reporter | This paper | two clones generated | |
| Cell line (H. sapiens) | HEK293T (eIF2Bδ R483W) with ATF4-Luc reporter | This paper | two clones generated | |
| Cell line (H. sapiens) | HEK293T (eIF2Bε R113H) with ATF4-Luc reporter | This paper | two clones generated | |
| Cell line (H. sapiens) | HEK293T (eIF2Bε R195H) with ATF4-Luc reporter | This paper | two clones generated | |
| Antibody | Rabbit monoclonal anti-ATF4 | Cell Signaling | #11815 | (1:50) in Wes |
| Antibody | Rabbit monoclonal anti-eIF2α | Cell Signaling | #5324 | (1:100) in Wes |
| Antibody | Rabbit polyclonal anti-eIF2Bα | ProteinTech | #18010–1-AP | (1:50) in Wes |
| Antibody | Rabbit polyclonal anti-eIF2Bβ | ProteinTech | #11034–1-AP | (1:50) in Wes |
| Antibody | Rabbit polyclonal anti-eIF2Bγ | ProteinTech | #11296–2-AP | (1:25) in Wes |
| Antibody | Rabbit polyclonal anti-eIF2Bδ | ProteinTech | #11332–1-AP | (1:50) in Wes |
| Antibody | Rabbit polyclonal anti-eIF2Bε | Bethyl Labs | #A302-556 | (1:50) in Wes |
| Antibody | Mouse monoclonal anti-tubulin | Cell Signaling | #3873 | (1:50) in Wes |
| Recombinant DNA reagent | CRISPR nuclease vector with OFP reporter | Thermo Fisher | #A21174 | |
| Sequence-based reagent | eIF2Bα V183F guide RNA | This paper | GTGGTGCTAGATGCTGCTGTCGG | |
| Sequence-based reagent | eIF2Bγ I346T guide RNA | This paper | TGACAATCTGGGCTGACGAATGG | |
| Sequence-based reagent | eIF2Bδ R483W guide RNA | This paper | GACTAGATTCAACAACCGTAGGG | |
| Sequence-based reagent | eIF2Bε R113H guide RNA | This paper | CCGCCCTACATCTCTCAATGTGG | |
| Sequence-based reagent | eIF2Bε R195H guide RNA | This paper | TTGTCTTCGTGGCAACGAGTTGG | |
| Recombinant protein | GST-PERK | Thermo Fisher | #PV5106 | Used to phosphorylate eIF2in vitro |
| Commercial assay | ONE-GLO luciferase assay | Promega | #E6120 | |
| Chemical compound | Bodipy-FL-GDP | Thermo Fisher | #G22360 | |
| Chemical compound | ISRIB | PMID: 23741617 | Synthesized in-house | |
| Chemical compound | Thapsigargin | Sigma-Aldrich | #T9033 | Stock solution prepared in DMSO |
| Chemical compound | Tunicamycin | Sigma-Aldrich | #T7765 | Stock solution prepared in DMSO |
Additional files
-
Supplementary file 1
Allele sequences of HEK293T mutant cell lines used in this study.
- https://doi.org/10.7554/eLife.32733.014
-
Transparent reporting form
- https://doi.org/10.7554/eLife.32733.015
Download links
A two-part list of links to download the article, or parts of the article, in various formats.
Downloads (link to download the article as PDF)
Open citations (links to open the citations from this article in various online reference manager services)
Cite this article (links to download the citations from this article in formats compatible with various reference manager tools)
The small molecule ISRIB rescues the stability and activity of Vanishing White Matter Disease eIF2B mutant complexes
eLife 7:e32733.
https://doi.org/10.7554/eLife.32733


