The causal role of the somatosensory cortex in prosocial behaviour
- Royal Netherlands Academy of Art and Sciences (KNAW), Netherlands
- University of Bologna, Italy
- IRCCS Fondazione Santa Lucia, Italy
- University of Lübeck, Germany
- University of Amsterdam, Netherlands
Figures
Figure 1 with 1 supplement
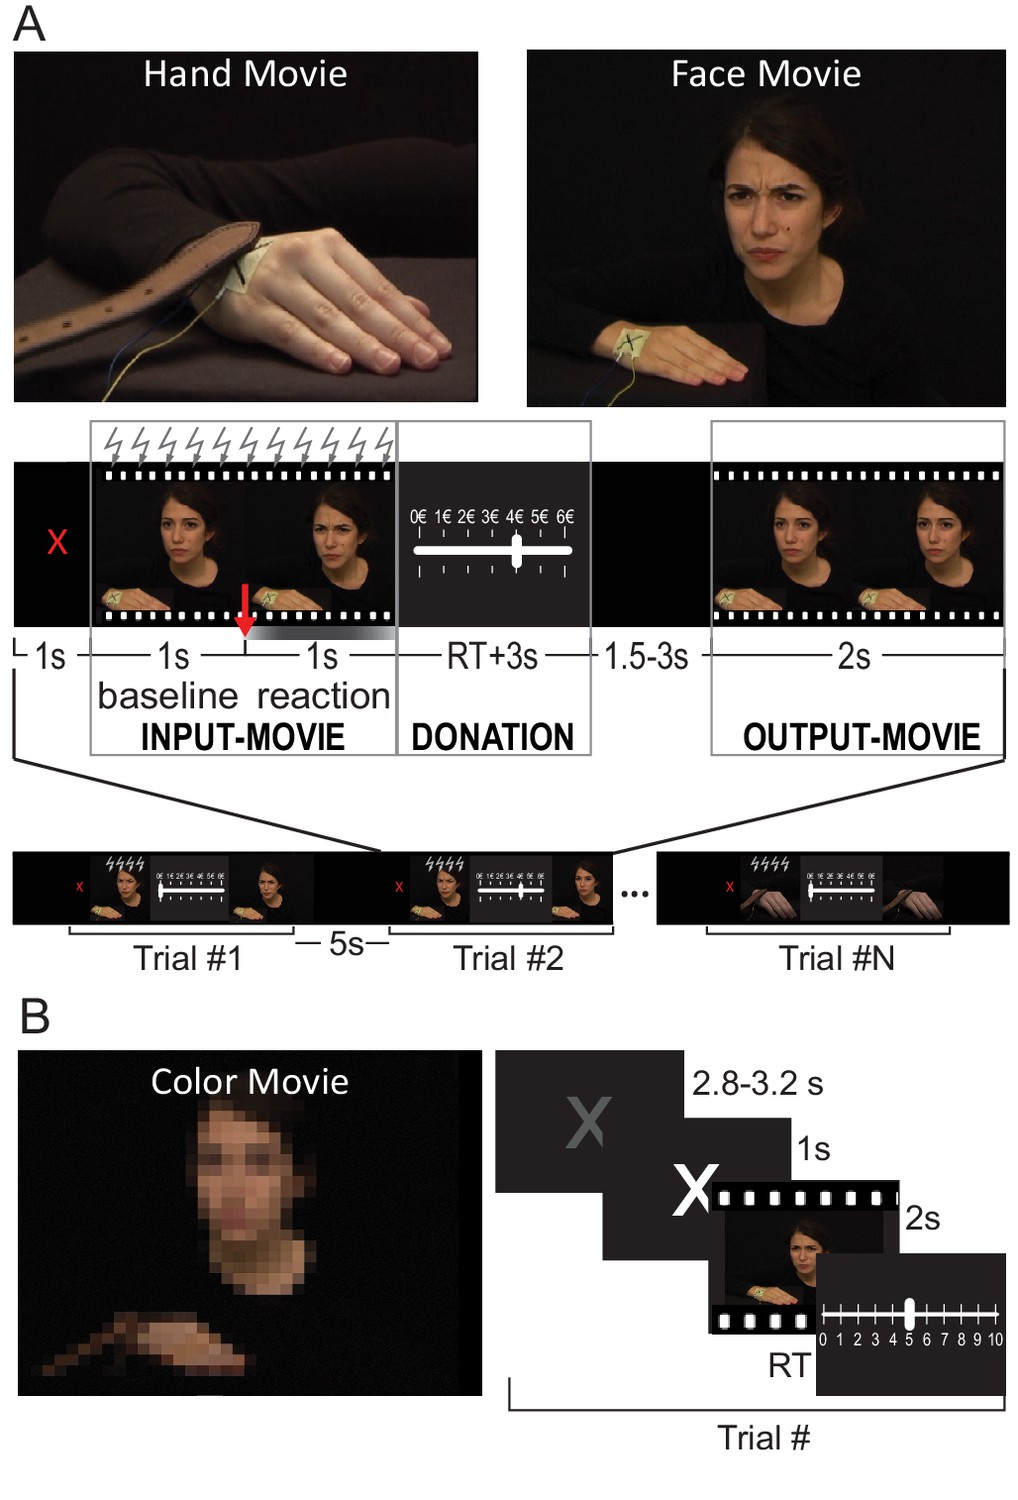
Paradigm.
(A) Top: a snapshot from the Hand and Face videos (examples of each condition are presented in Videos 1–4). Middle: trial structure. The red arrow indicates the timing of the shock delivery, belt touching the hand or beginning of the color saturation changes. The gray gradient graphically illustrates the dynamic of the face reaction and color saturation changes, with stronger gray corresponding to stronger facial expression or stronger saturation. The intensity of the OutputMovie is equal to the intensity of InputMovie minus the donation. Bottom: run structure. The same structure was used in the EEG and TMS experiments. Gray lightning symbols indicate when TMS was applied in the TMS version of the experiment. (B) A snapshot from the Color videos (see Videos 5, 6) and the trial structure for the rating task.
Figure 1—figure supplement 1
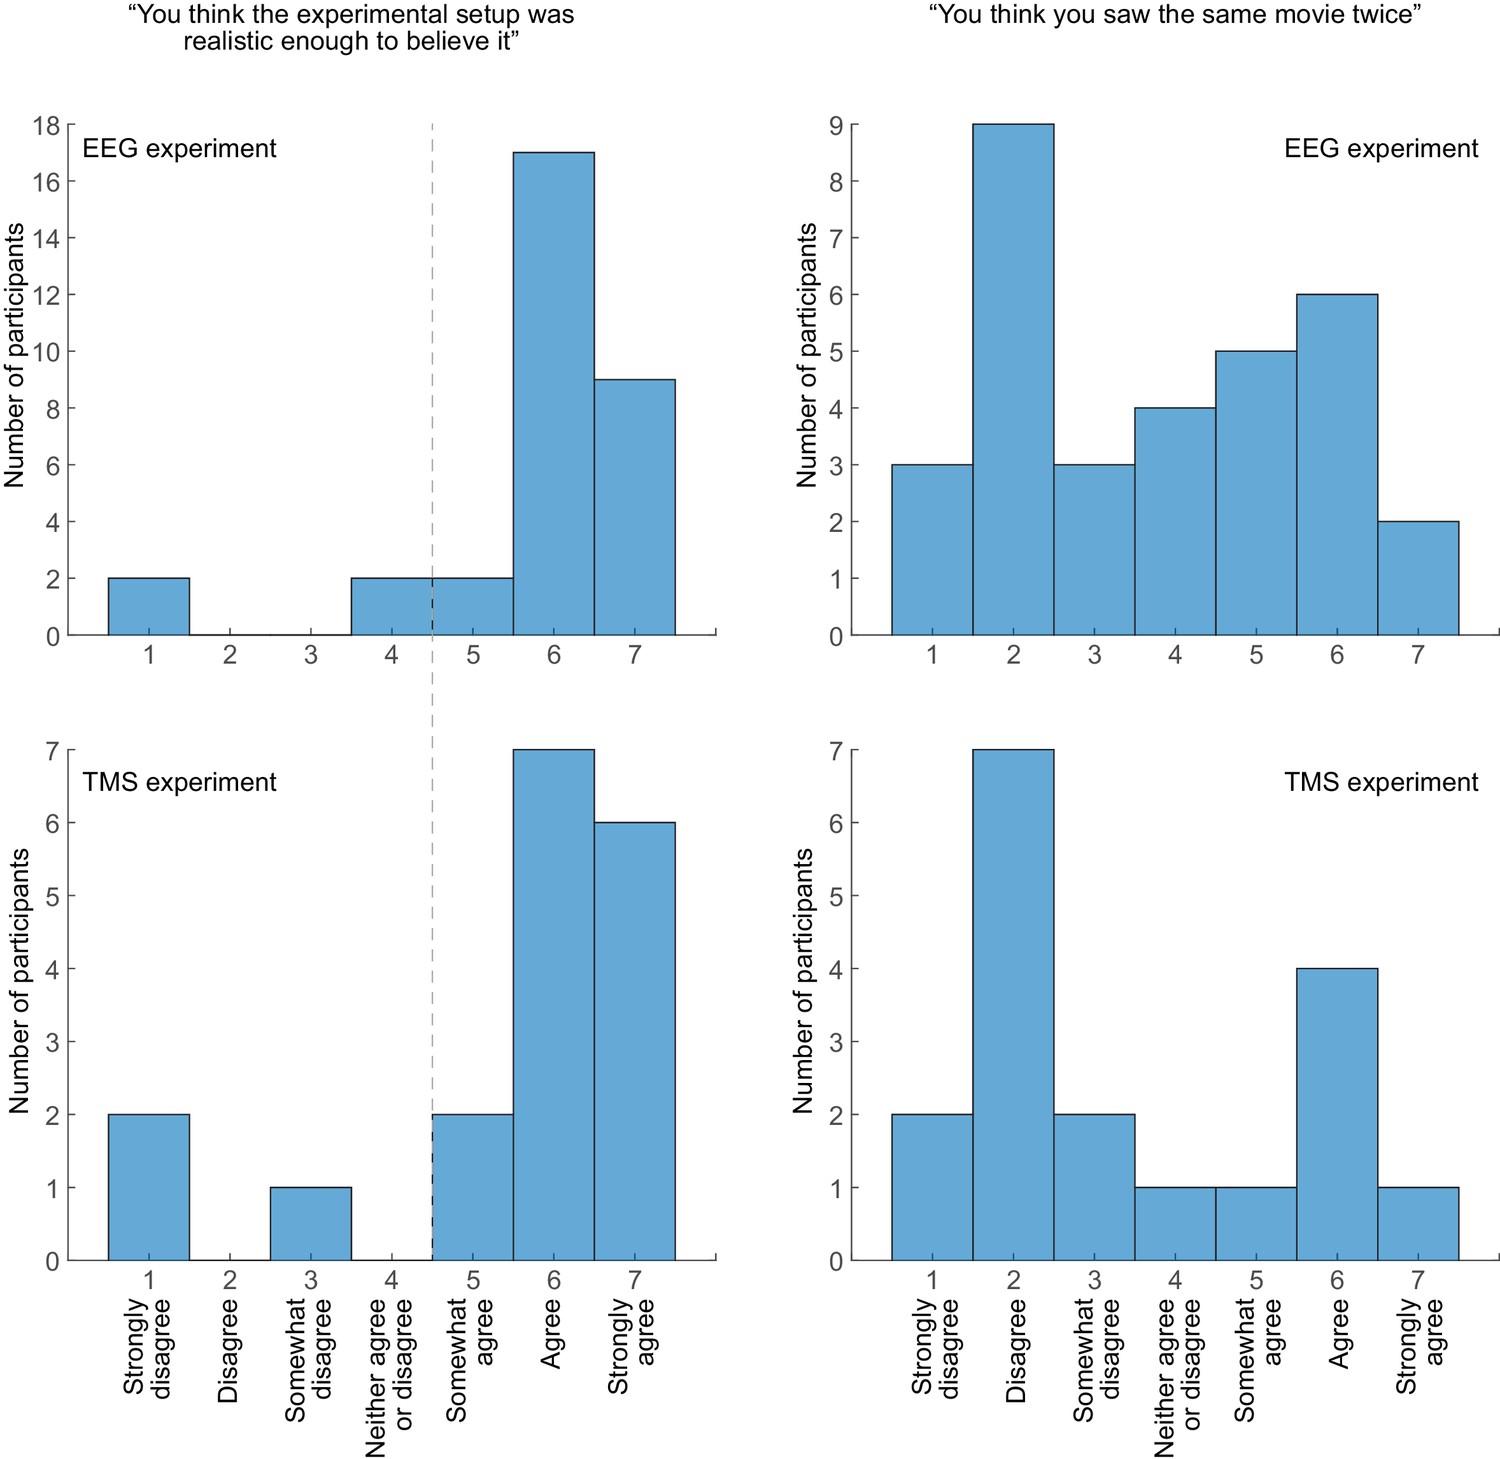
Histograms of participants’ responses for the credibility and movie repetition detection for the experiment with the Costly Helping paradigm.
The dotted grey line indicates the cut-off used as exclusion criteria.
-
Figure 1—figure supplement 1—source data 1
Participants’ responses for the credibility and movie repetition detection for the experiment with the Costly Helping paradigm.
- https://doi.org/10.7554/eLife.32740.005
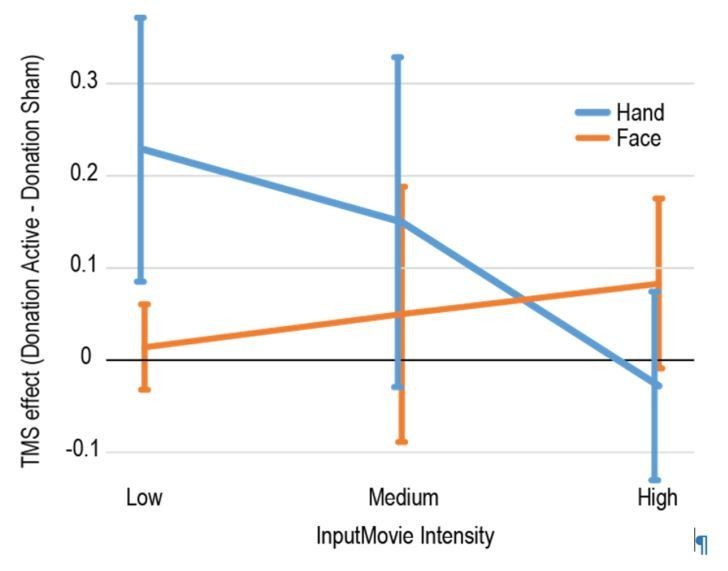
Figure 2
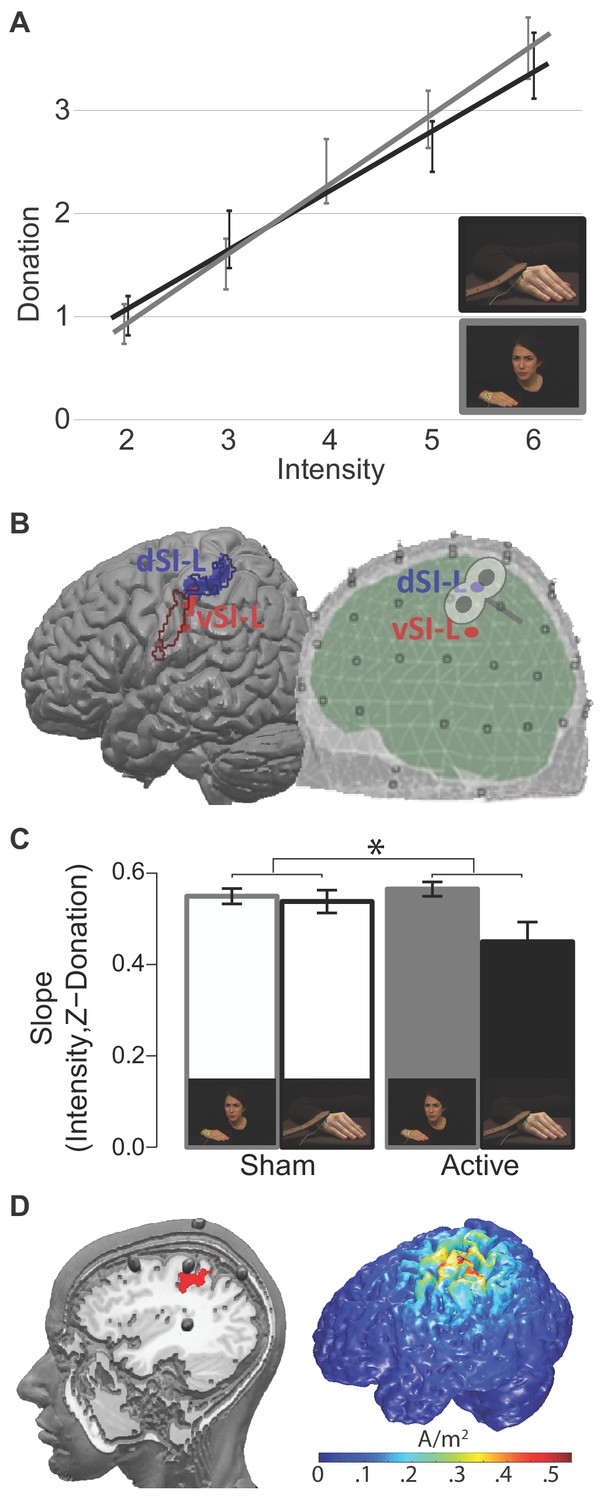
ROIs and TMS results.
(A) The relationship between InputMovie intensity, as assigned by an independent pool of participants during the movies validation procedure, and given donation for hand and face videos. Each point is the group average donation for the specific intensity. Error bars represent S.E.M. (B) Pain Localizer ROIs. Left: results of the pain localizer within the primary somatosensory cortices (see 'Supplementary information') shown on the Colin brain together with contours of regions associated with hand (blue) and face (red) movements. These contours were generated using the meta-analyses tool Neurosynth (Yarkoni et al., 2011). Specifically, we generated reverse inference maps using the search terms ‘grasping’ and ‘speech production’ to probe movements of the hand and of the face, respectively, and intersected each with an anatomical map of the left SI from the anatomy toolbox (as the union of BA1, 2, 3a and 3b). Right: schematic visualization of the dorsal and ventral ROIs within the EEG template space, and approximate site of the TMS stimulation. (C) Interaction Condition x TMS results. *p<0.05. Error bars represent S.E.M. (D) The left render shows the location of the five HD-tDCS electrodes on the scalp and where the central anode is positioned relative to our d-SIL ROI (red). The image was created by inserting fish oil omega three pills in place of the HD-tDCS electrodes inside the electrodes holders. A participant was wearing the montage while a T1-weighted anatomical image was acquired (TR = 8.2 ms, TE = 3.8 ms, flip angle = 8°, FOV = 240 mm × 240 mm, 1 × 1 × 1 mm isotropic voxels). The right render shows the 3D simulation of current density changes expected from our tDCS montage, obtained using the electrostatic finite element method (FEM) offered by the Matlab toolbox COMETS 2 (Jung et al., 2013).
-
Figure 2—source data 1
Average donation given by participants for the specific intensity and condition.
Data source of Figure 2A.
- https://doi.org/10.7554/eLife.32740.016
-
Figure 2—source data 2
dSI-L and vSI-L ROIs and BEM model used in Figure 2A.
- https://doi.org/10.7554/eLife.32740.017
-
Figure 2—source data 3
Single participants’ robust slopes between the intensity of Input Movie and given donation in the TMS study.
Data source of Figure 2C.
- https://doi.org/10.7554/eLife.32740.018
Figure 3
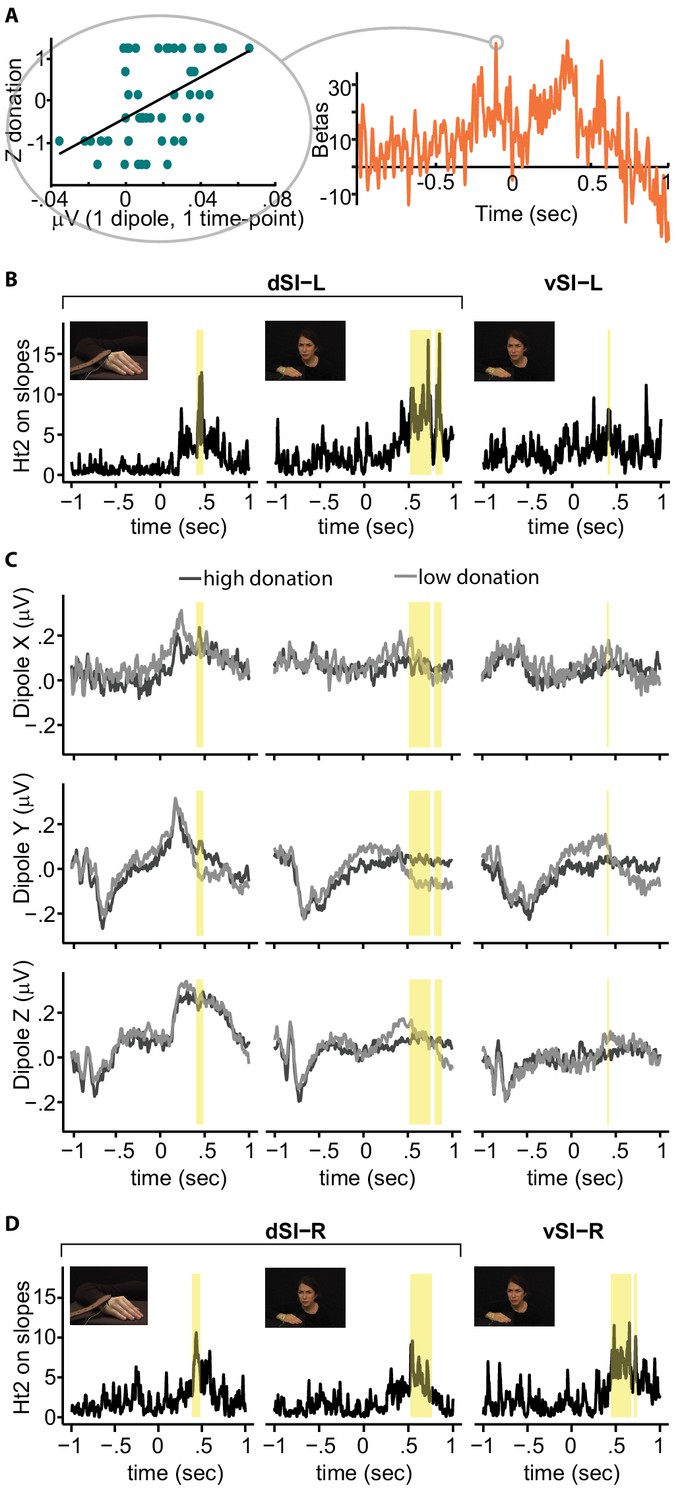
Regression between SI activity and donation.
(A) Left: relationship between brain activity of one example participant at a given time-point and the Z-donation for all the trials of that participant. The linear trend represents the slope of the robust regression performed on these values. Right: time-course of the robust regression slopes (betas) for the same example participant. (B) Time-course of the Hotelling's t-squared (Ht2) test on the slopes for the significant ROI and condition. Because the two significant Hand clusters are very close in time, for illustrative purposes only, they have been evidenced by a single yellow band. (C) Grand averages for high (darker lines) and low (lighter lines) donation for each dipole, SI-ROI and condition. (D) Right hemisphere results. Significant clusters based on Ht2 are shown in yellow.
-
Figure 3—source data 1
Brain activity of one example participant at a given time-point and the Z-donation for all the trials of that participant.
Time-course of beta of the same participant. Data source of Figure 3A.
- https://doi.org/10.7554/eLife.32740.020
-
Figure 3—source data 2
Time-course of the Hotelling's t-squared (Ht2) test on the slopes for the significant ROI and condition.
Data source of Figure 3B.
- https://doi.org/10.7554/eLife.32740.021
-
Figure 3—source data 3
Group average of the brain activity in each time point and condition.
Data source of Figure 3C.
- https://doi.org/10.7554/eLife.32740.022
-
Figure 3—source data 4
Time-course of the Hotelling's t-squared (Ht2) test on the slopes for the mirror ROI and condition.
Data source of Figure 3D.
- https://doi.org/10.7554/eLife.32740.023
Author response image 1
Author response image 2
Videos
Video 1
Example of Hand video of intensity 1.
https://doi.org/10.7554/eLife.32740.006
Video 2
Example of Hand video of intensity 6.
https://doi.org/10.7554/eLife.32740.007
Video 3
Example of Face video of intensity 1.
https://doi.org/10.7554/eLife.32740.008
Video 4
Example of Face video of intensity 7.
https://doi.org/10.7554/eLife.32740.009
Video 5
Example of Color video of intensity 1.
https://doi.org/10.7554/eLife.32740.010
Video 6
Example of Color video of intensity 6.
https://doi.org/10.7554/eLife.32740.011Tables
Table 1
Participants characteristics.
The table indicates the number of tested participants for each experiment, with those excluded from the analyses within brackets; the average age and its standard deviation (SD); the gender ratio; and the experimental task. Three participants from the EEG and three from the TMS experiment were excluded because they did not sufficiently believe the cover story. One participant in the EEG was excluded because of EEG failure. One participant in the tDCS was excluded because they performed at chance level. Analyses on gender effects can be found in Supplementary file 3.
| Total NO subj. (excluded) | Age (SD) | Gender M /F | Experimental task | |
|---|---|---|---|---|
| Validation costly helping stimuli | 40 | 24 (6) | 23/17 | Rating other’s pain |
| Validation rating stimuli | 20 | 24-(3.4) | 8/12 | Rating other’s pain and color saturation |
| fMRI | 25 | 25 (6) | 11/14 | Rating own pain |
| EEG | 32 (4) | 25 (5) | 16/16 | Decision to help |
| TMS | 18 (3) | 25 (7) | 12/6 | Decision to help |
| HD-tDCS | 26 (1) | 25 (4) | 13/13 | Rating other’s pain and color saturation |
-
Table 1—source data 1
Participant’s demographic information.
- https://doi.org/10.7554/eLife.32740.013
Table 2
Number of videos for each intensity presented as InputMovie in the EEG and TMS experiment.
The last line shows the average movie intensities and their standard deviation presented for each condition and experiment.
| Perceived intensity | EEG experiment | TMS experiment per session | ||
|---|---|---|---|---|
| Hand | Face | Hand | Face | |
| 2 | 13 | 23 | 4 | 10 |
| 3 | 2 | 3 | 10 | 4 |
| 4 | 0 | 4 | 4 | 4 |
| 5 | 27 | 10 | 10 | 6 |
| 6 | 1 | 11 | 2 | 6 |
| 7 | 1 | |||
| Average intensity | 4 ± 1.4 | 3.7 ± 1.7 | 3.9 ± 1.2 | 3.8 ± 1.6 |
Additional files
-
Supplementary file 1
Source data: for each of the dipoles extracted from d-SIL, the single participant’s average brain activity within the time-window was able to predict their donation (significant in cluster-statistic).
- https://doi.org/10.7554/eLife.32740.024
-
Supplementary file 2
Source data: for each of the dipoles extracted from v-SIL, the single participant’s average brain activity within the time-window was able to predict their donation (significant in cluster-statistic).
- https://doi.org/10.7554/eLife.32740.025
-
Supplementary file 3
Source data: data used for gender difference analyses.
- https://doi.org/10.7554/eLife.32740.026
-
Source code 1
Pain Localizer source code.
- https://doi.org/10.7554/eLife.32740.027
-
Source code 2
Pain Localizer.
- https://doi.org/10.7554/eLife.32740.028
-
Transparent reporting form
- https://doi.org/10.7554/eLife.32740.029
Download links
A two-part list of links to download the article, or parts of the article, in various formats.
Downloads (link to download the article as PDF)
Open citations (links to open the citations from this article in various online reference manager services)
Cite this article (links to download the citations from this article in formats compatible with various reference manager tools)
The causal role of the somatosensory cortex in prosocial behaviour
eLife 7:e32740.
https://doi.org/10.7554/eLife.32740


