A dynamic mechanism for allosteric activation of Aurora kinase A by activation loop phosphorylation
- University of Minnesota, United States
- Memorial Sloan Kettering Cancer Center, United States
- Weill Cornell Medical College, United States
Figures
Figure 1 with 2 supplements

Phosphorylation on T288 does not switch AurA into the DFG-In state.
(a) IR spectra of nitrile-labeled phosphorylated AurA. The apo sample (solid black line), and the sample bound to Tpx2 (dashed black line), were measured at 5°C, and the kinase bound to ADP (colored lines) was measured at the indicated temperatures. Arrows indicate peaks assigned to the DFG-In and DFG-Out states. The inset shows the same experiments performed with unphosphorylated AurA. Single representative spectra are shown, normalized to peak maxima. (b) Overview of the structure of AurA in the active conformation bound to ADP (yellow) and Tpx2 (beige), with enlarged views of the DFG-In (right, PDB ID: 1OL5) and DFG-Out (bottom, PDB ID: 5L8K) states with the nitrile probe (Q185CN) modeled into the structures. (c) Second derivatives of IR spectra of apo WT and W277A AurA, showing the ~1.5 cm−1 spectral shift of the 2158 cm−1 peak (arrow).
Figure 1—figure supplement 1
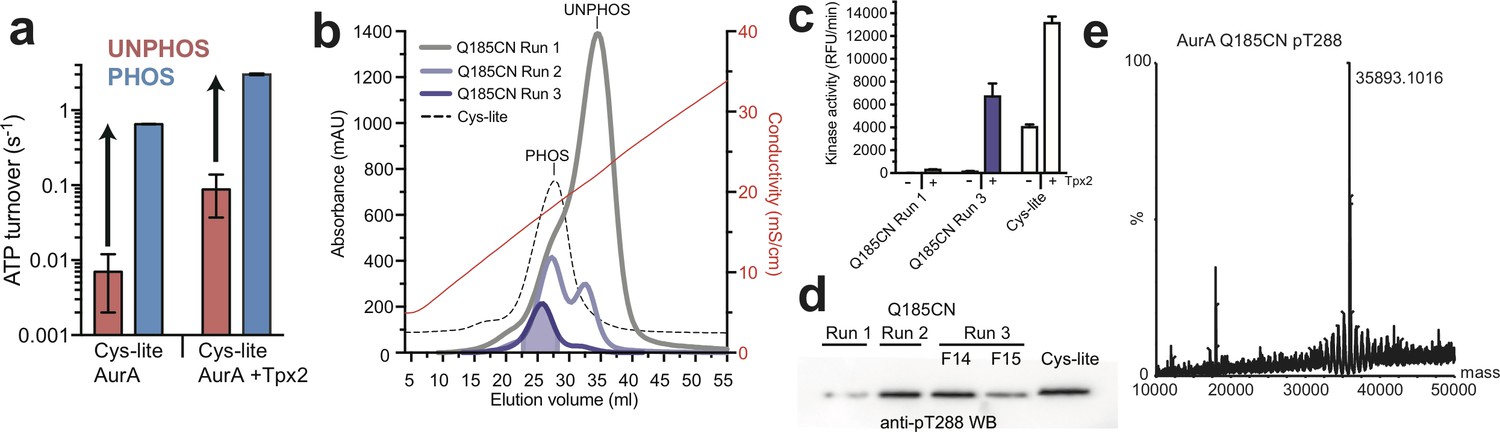
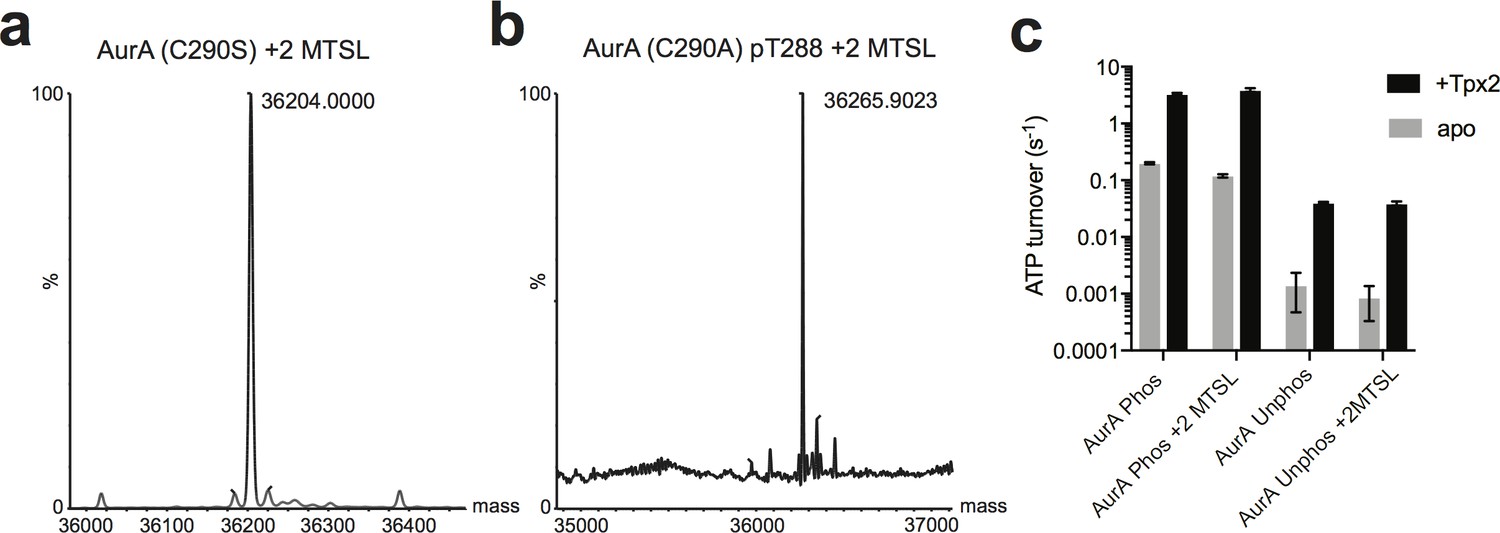
Activation of AurA by phosphorylation and preparation of homogenously phosphorylated nitrile-labeled AurA for IR experiments.
(a) Kinase assay data (ATP turnover per second) showing the catalytic activity of AurA measured using a spectrophotometric coupled enzyme assay (ADP Quest). Assays were performed with phosphorylated (blue) and unphosphorylated (red) Cys-lite AurA constructs with and without 10 μM Tpx2 peptide. Arrows indicate activation by phosphorylation. Values represent mean values ± s.d.; n = 3. (b) Ion exchange chromatograms showing repeated rounds of purification used to isolate homogeneously phosphorylated nitrile-labeled (‘Q185CN’) AurA. For each run, the fractions containing mostly phosphorylated kinase were pooled and subjected to another round of ion exchange until only the phosphorylated species was present. The dotted line is the chromatogram of homogeneously phosphorylated Cys-lite kinase (without the Q185C mutation). (c) Kinase activity assays showing activity of labeled AurA samples from the first and final round of purification compared to the activity of the Cys-lite kinase. Activity was measured in the presence and absence of 10 μM Tpx2. Note that the Q185C and Q185CN forms of AurA have substantially reduced kinase activity in the absence of Tpx2 due to disruption of an active site hydrogen bond network mediated by Q185 (see the Cyphers et al., 2017 reference). (d) Western blot using a phospho-specific antibody against pT288 AurA shows enrichment of the phosphorylated kinase in runs 2 and 3. The Cys-lite kinase (without the Q185C mutation) is shown as a positive control. (e) Mass spectra of the purified nitrile-labeled construct phosphorylated at T288.
Figure 1—figure supplement 2
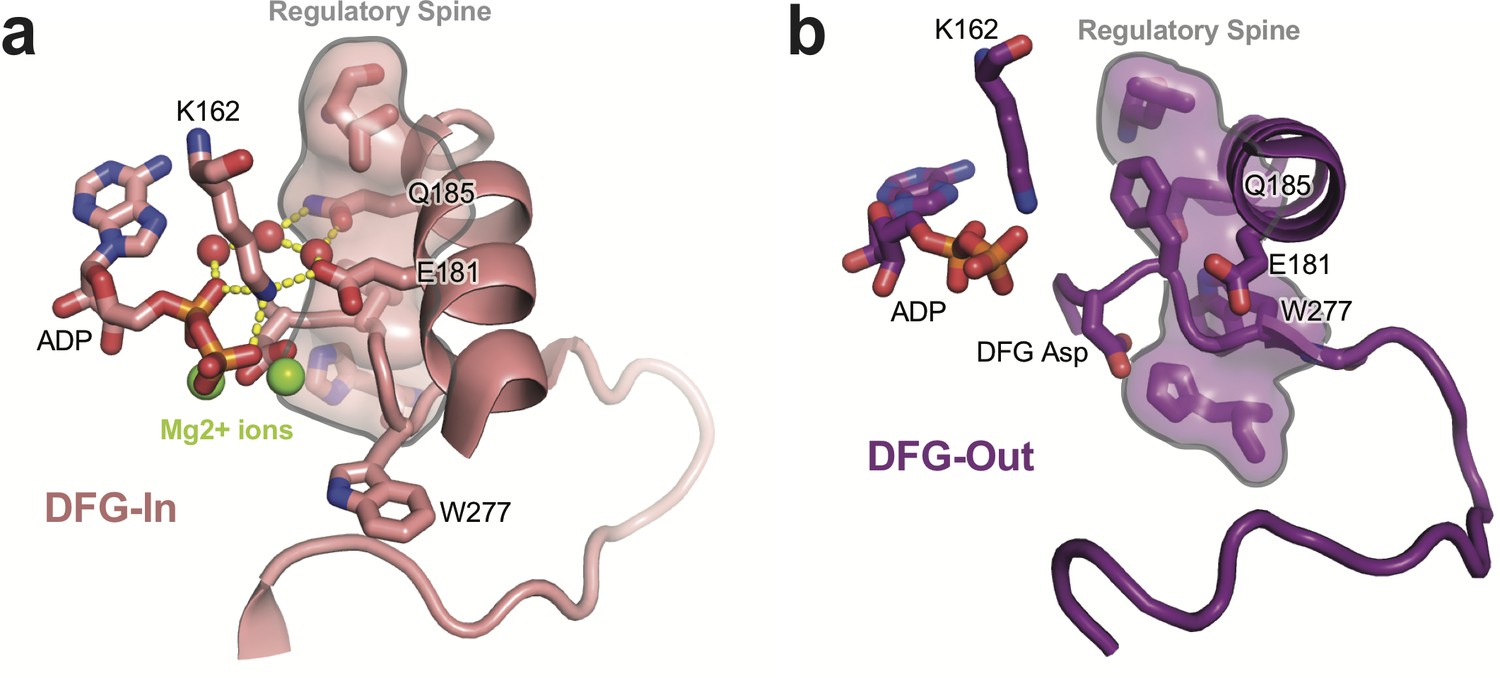
Comparison of the active site of AurA in the DFG-In and DFG-Out states.
(a) Crystal structure of active AurA in the DFG-In state (PDB ID: 1OL5). The regulatory spine is shown as a surface representation, and the water-mediated hydrogen bonds linking Q185 and the catalytic Glu-Lys pair (E181 and K162) are shown as dashed yellow lines (see the Cyphers et al., 2017 reference). Bound nucleotide and magnesium ions are indicated. (b) Structure of AurA in the DFG-Out state (PDB ID: 5L8K). In the remodeled regulatory spine, residue W277 takes the place of the DFG phenylalanine residue, and the Q185 residue becomes buried in a hydrophobic pocket. Nucleotide is bound in the structure despite the loss of magnesium coordination.
Figure 2 with 2 supplements
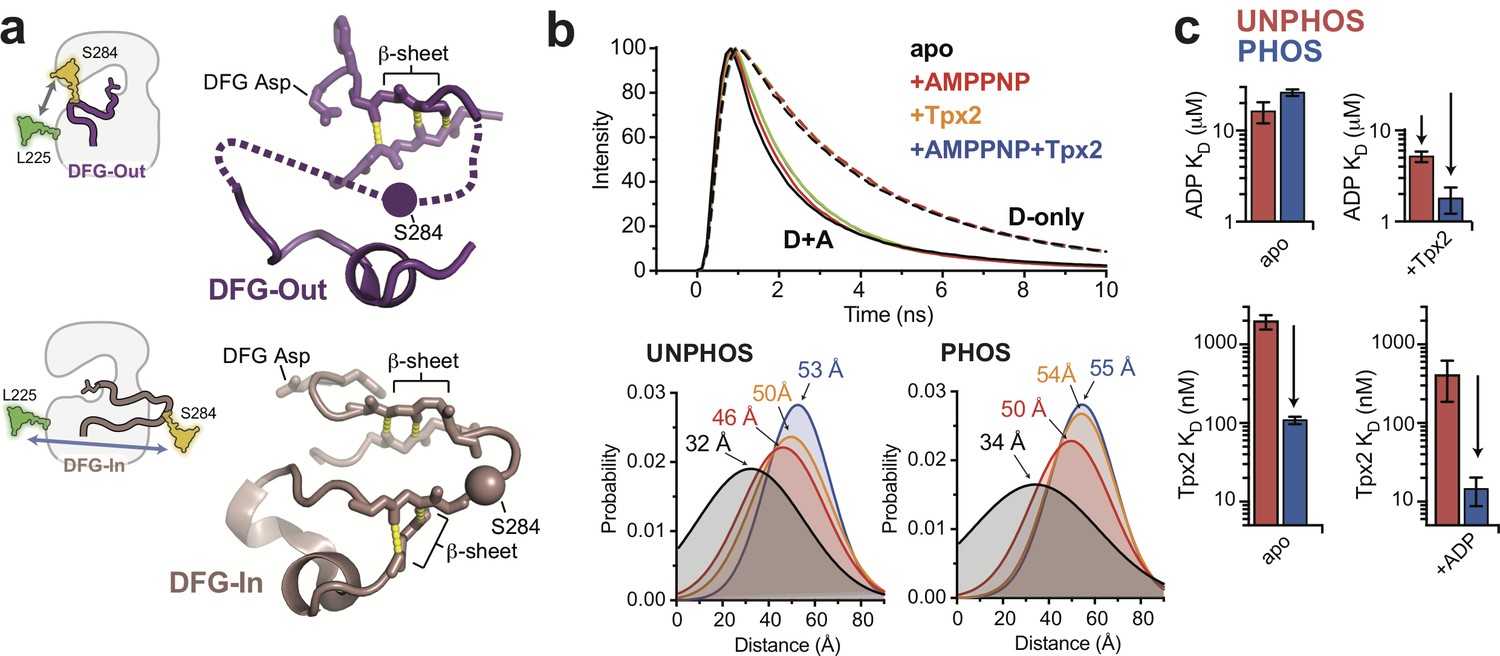
The phosphorylated activation loop remains flexible and shifts to a more active conformation upon Tpx2 binding.
(a) (left) Schematics showing the labeling scheme used to detect the DFG-In/Out transition by FRET. (right) Structures of the DFG-Out (top) and DFG-In (bottom) states of AurA, highlighting the β-sheet hydrogen bonds constraining the N- and C-terminal segments of the activation loop. The S284C labeling site is shown as a sphere. (b) (top) Time-resolved fluorescence waveforms for D-only (dashed lines) and D + A (solid lines) phosphorylated AurA in the presence and absence of 125 μM Tpx2 and 1 mM AMPPNP. Data are for a single representative experiment, normalized to the fluorescence peak. (bottom) Comparison of single-Gaussian distance distribution fits to fluorescence lifetime data obtained with unphosphorylated (left) and phosphorylated AurA (right). (c) Binding constants of ADP (top panels) and Tpx2 (bottom panels) for phosphorylated (blue) and unphosphorylated (red) AurA determined with and without the other ligand pre-bound to the kinase. Data represent mean values ± s.d.; n = 3.
Figure 2—figure supplement 1

Validation of constructs used for fluorescence experiments.
(a and b) LC-MS spectra of the phosphorylated AurA construct (C290A C393S L225C S84C) used for FRET experiments labeled with (a) donor and (b) both donor and acceptor fluorophores. All samples show at least one phosphorylation (1P), and the degree of second-site phosphorylation (2P) varied between preparations, but we did not observe significant variation in behavior among preparations (activity, or KD for ADP or Tpx2). (c) Kinase assay data showing unlabeled and labeled AurA are active and activated by Tpx2 binding to a similar extent. Data represent the average of three replicate experiments ± s.d. (d) Tryptic LC-MS/MS of the phosphorylated Cys-lite construct used for IR and EPR experiments, showing results for one of several observed tryptic peptides containing the T288 residue. The diagnostic b3 ion, which demonstrates that the extra mass of 80 daltons on this peptide is associated with T288, is labeled.
Figure 2—figure supplement 2
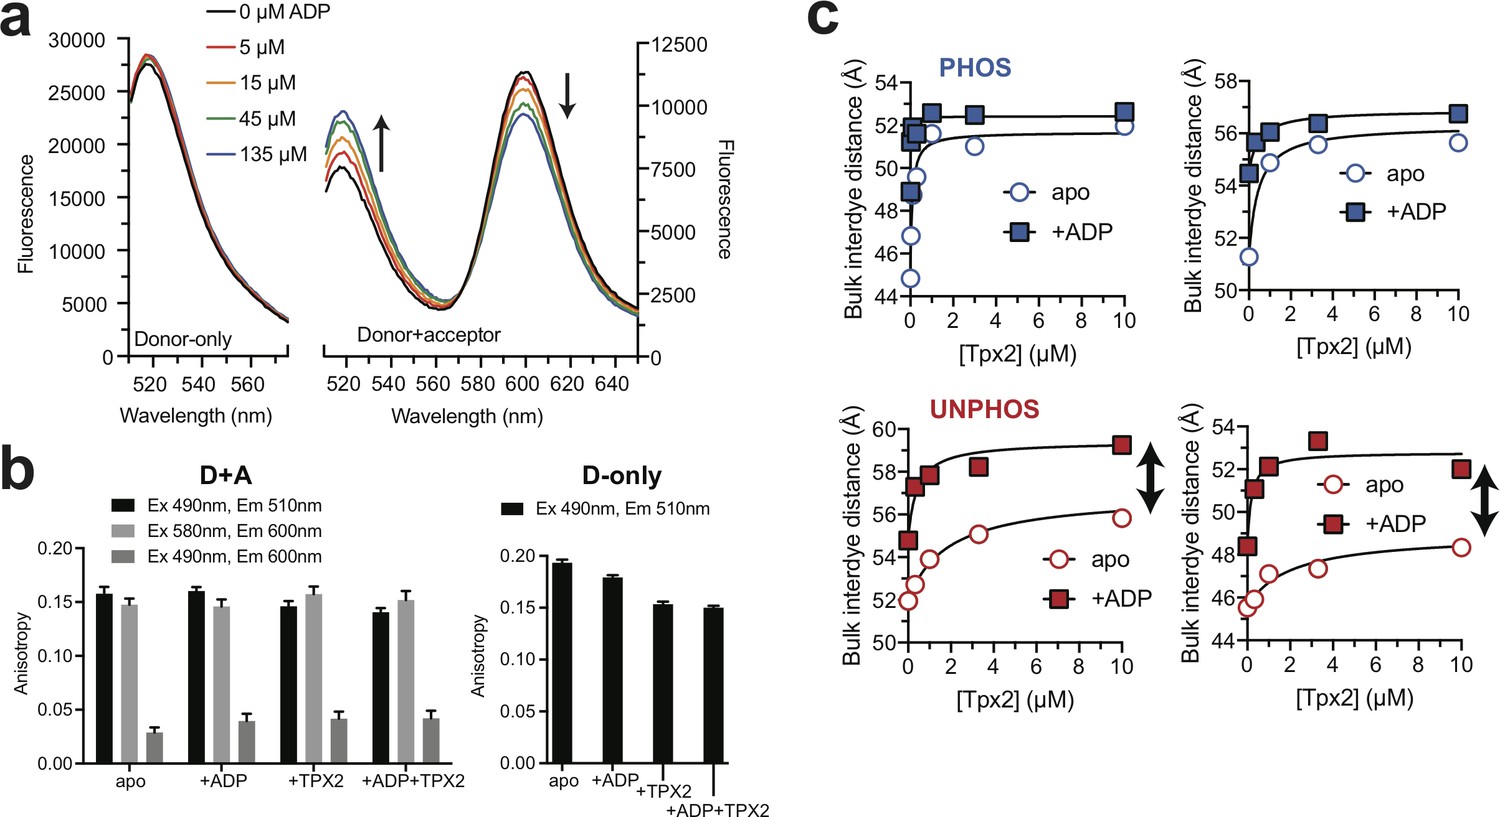
Steady-state fluorescence and FRET experiments.
(a) Emission spectra of donor-only (left) and donor + acceptor (right) labeled phosphorylated AurA in the presence of different concentrations of ADP. Single representative experiments. (b) Steady-state fluorescence anisotropy measurements for representative donor + acceptor (left) and donor-only (right) phosphorylated AurA samples measured at the indicated excitation and emission wavelengths for apo AurA and AurA bound to the indicated ligands, demonstrating minimal changes in anisotropy between biochemical states. (c) Pairs of replicate steady-state FRET experiments with phosphorylated (top) and unphosphorylated (bottom) AurA, showing titrations of Tpx2 performed in the absence of ADP (apo), and in the presence of ADP (+ADP). Double-headed arrows highlight the incomplete conformational shift observed upon Tpx2 binding with the unphosphorylated samples.
Figure 3 with 2 supplements
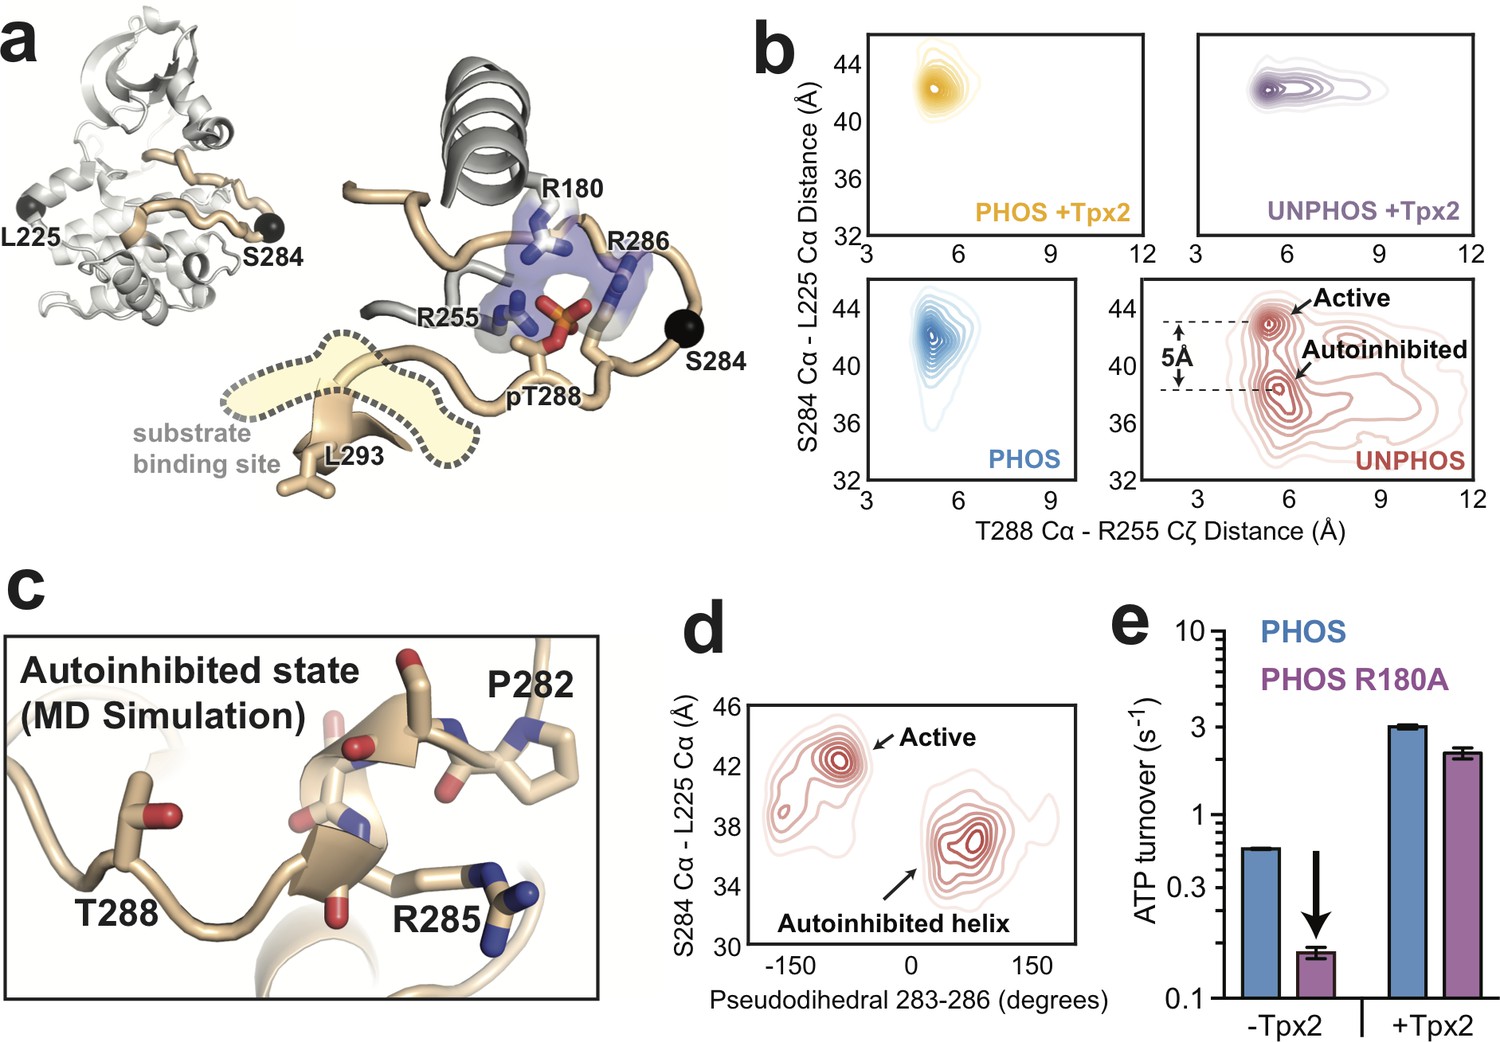
Molecular dynamics simulations of AurA show that phosphorylation disfavors an autoinhibited DFG-In substate and promotes a fully-activated configuration of the activation loop.
(a) Structure of active, phosphorylated AurA bound to Tpx2 and ADP (PDB ID: 1OL5) showing the interactions between pT288 and the surrounding arginine residues. The S284 and L225 Cα atoms are shown as black spheres. (b) Contour plots showing the L225 Cα - S284 Cα distances plotted against the T288 Cα - R255 Cζ distances for all four biochemical conditions. The active and autoinhibited DFG-In states observed for the unphosphorylated kinase in the absence of Tpx2 (red), and the shift in the L225-S284 distance between them, are indicated. (c) Simulation snapshot showing the helical turn in the activation loop and the position of the T288 sidechain at the C-terminal end of the helix. (d) The L225 - S284 distance is plotted against the dihedral angle defined by the Cα atoms of residues 283–286 (pseudodihedral). The helical conformation in the autoinhibited state is indicated. (e) Kinase activity (shown as ATP turnover per second) for phosphorylated WT (blue) and phosphorylated R180A (purple) AurA unlabeled FRET constructs in the presence and absence of 10 μM Tpx2. The decrease in the activity in the absence of Tpx2 due to the R180A mutation is highlighted by the arrow. Data represent mean values ± s.d.; n = 3.
Figure 3—figure supplement 1
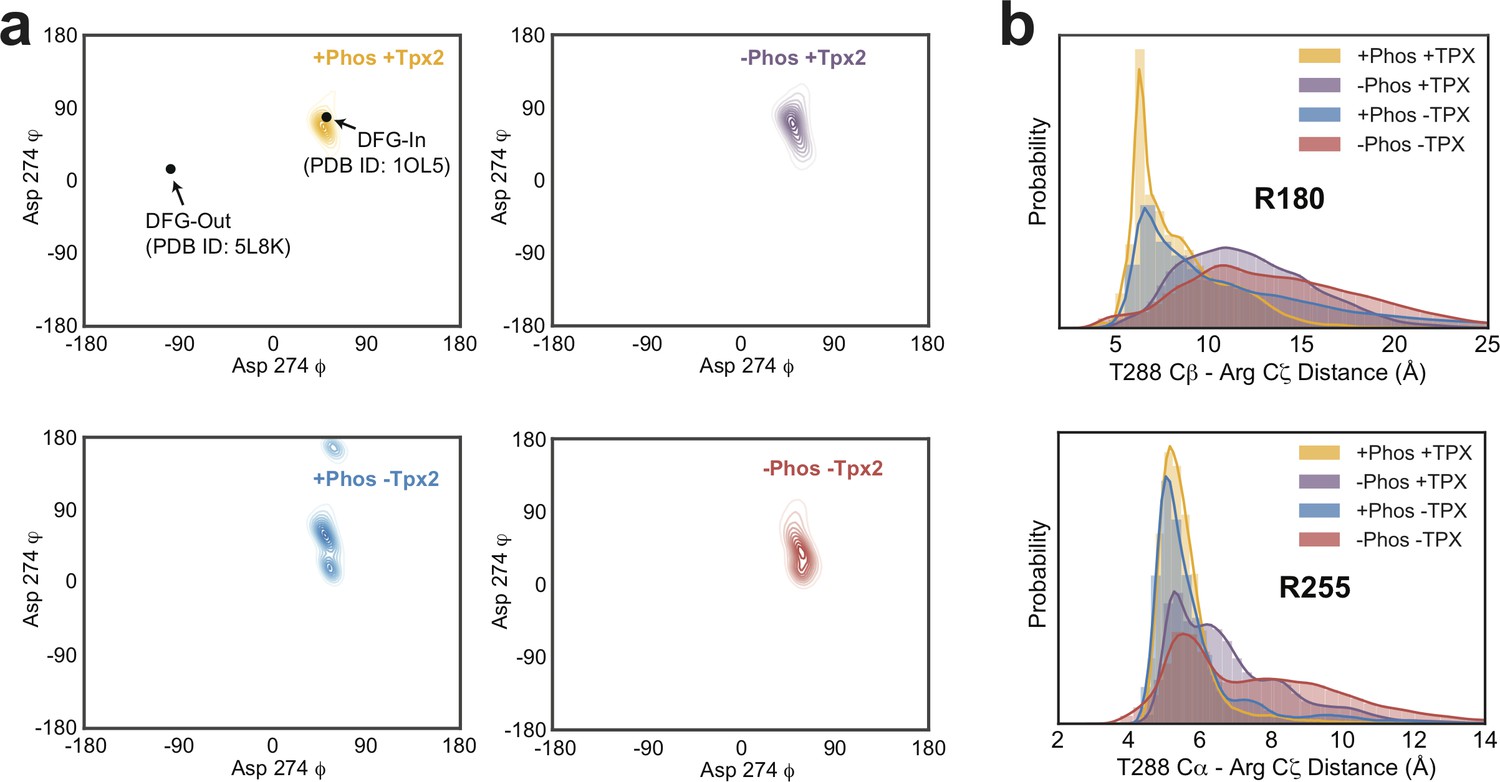
Analysis of DFG motif conformation and Arginine-pT288 interactions in MD trajectories.
(a) Contour plots of the distribution of backbone torsion angles ϕ and φ for Asp 274 of the DFG motif across all simulations. The corresponding values for the DFG-In and DFG-Out states, taken from PDB IDs 1OL5 and 5L8K, respectively, are indicated in the top left panel for reference. All simulations stay close to the torsion values in the DFG-In x-ray structure used to initiate the simulations (PDB ID: 1OL5) of ϕ = 50, φ = 80. (b) Distributions of the T288 Cβ - R180 Cζ (top) and T288 Cα - R255 Cζ (bottom) distances determined from MD simulations of AurA performed in the indicated biochemical states.
Figure 3—figure supplement 2
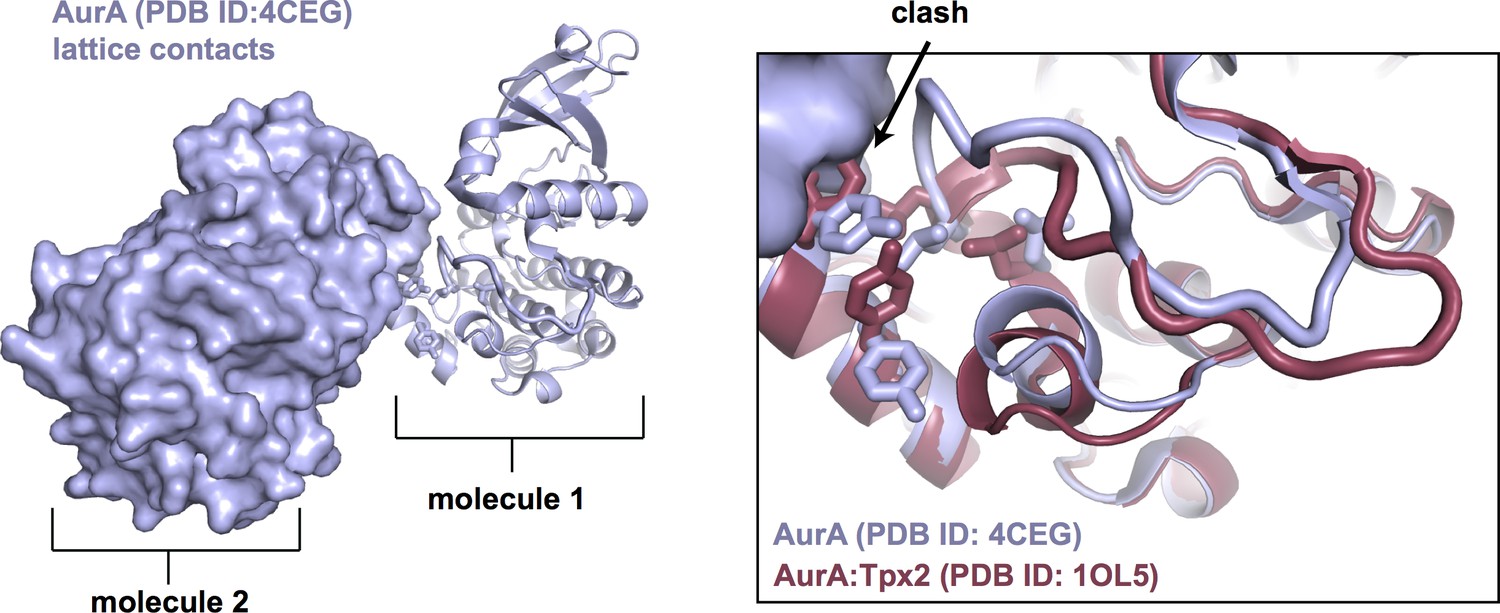
Crystal lattice contacts in the common hexagonal crystal form of AurA (left) result in a distorted conformation of the activation loop (right), in which the peptide binding site, highlighted as sticks, is not properly assembled (structure shown in blue).
The structure of AurA bound to Tpx2 in the active conformation is shown in red for comparison.
Figure 4 with 3 supplements
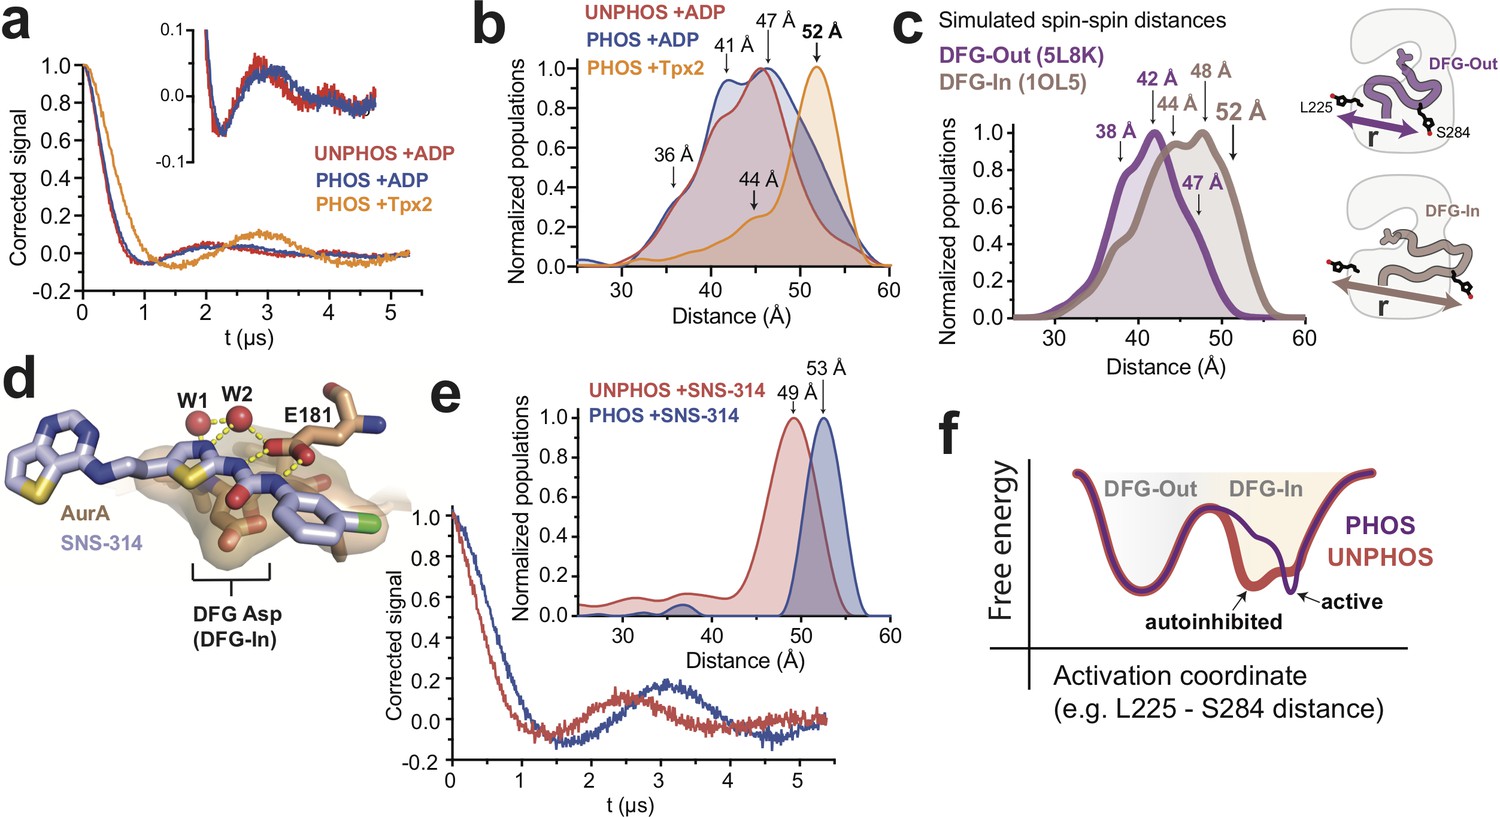
DEER spectroscopy confirms that phosphorylation of AurA alters the DFG-In state.
(a) Background-corrected DEER spectra of unphosphorylated AurA bound to ADP (red), and phosphorylated AurA bound to either ADP (blue) or to Tpx2 (yellow). The inset shows an enlarged view of the spectra for the +ADP samples. (b) Population densities obtained by Tikhonov regularization for the data shown in (a), with prominent peaks in the distributions indicated. The increased sampling of distances beyond ~50 angstroms in the phosphorylated kinase bound to ADP is highlighted with darker blue shading. Data are from single representative experiments of two independent repeats. (c) Spin-spin distance distributions obtained by molecular dynamics simulations initiated from X-ray structures of AurA in either the DFG-Out state (purple) or the fully-active DFG-In state with both Tpx2 and phosphorylation (pink). The inset shows schematics of the spin-labeling scheme. (d) X-ray structure of SNS-314 bound to AurA highlighting interactions with the DFG motif, structured water molecules and the catalytic glutamate (E181) specific to the DFG-In state (PDB ID: 3D15). (e) DEER spectra (main panel) and distance distributions (inset) measured for unphosphorylated (red) and phosphorylated (blue) AurA bound to SNS-314. The distributions are vertically aligned with those shown in (b) to facilitate comparison. (f) Hypothesized energy landscape for AurA, highlighting the effect of phosphorylation on the DFG-In state.
Figure 4—figure supplement 1
Validation of spin-labeled AurA constructs used for EPR.
(a and b) Whole protein LC-MS spectra of (a) unphosphorylated AurA C290S C247A C393S L225C S284C and (b) phosphorylated AurA C290A C247A C393S L225C S284C homogeneously labeled with two MTSL spin labels. (c) Kinase assay data showing unlabeled and MTSL-labeled AurA are active and activated by Tpx2 binding to a similar extent. Data represent the average of three replicate experiments ± s.d.
Figure 4—figure supplement 2
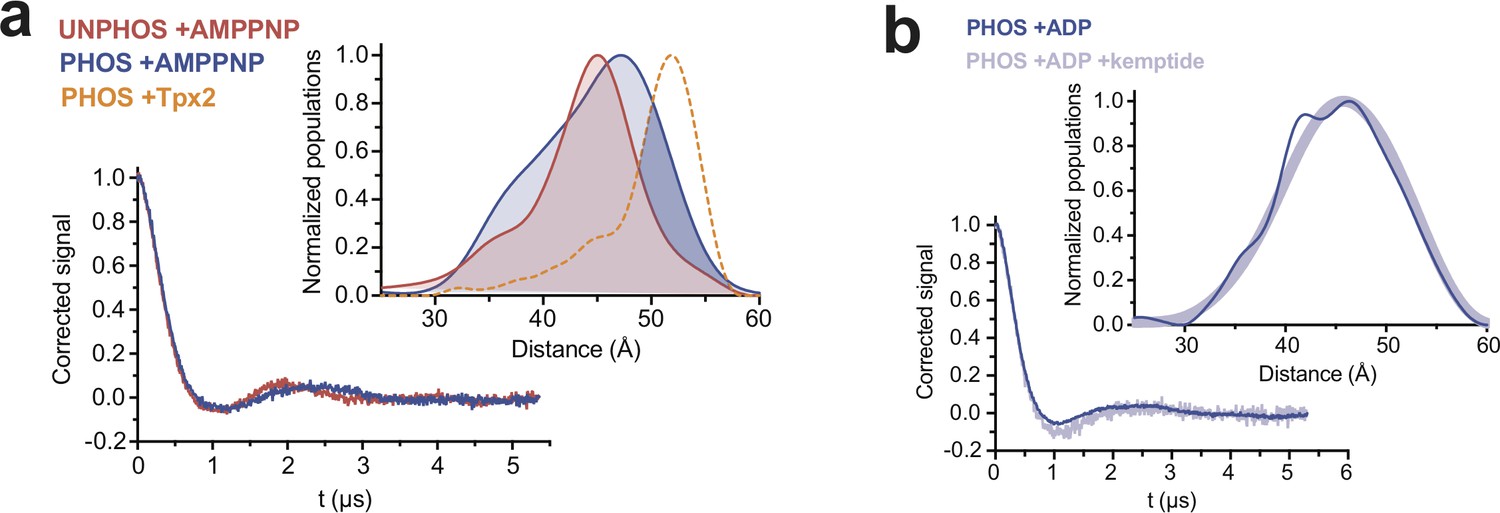
DEER experiments with AMPPNP and peptide substrate.
(a) DEER spectra and distance distributions (inset) for unphosphorylated (red) and phosphorylated (blue) AurA bound to the non-hydrolyzable ATP-analog AMPPNP. The distribution for phosphorylated AurA bound to Tpx2 is shown as a yellow dotted line for comparison. The increased sampling of distances beyond ~50 angstroms in the phosphorylated kinase bound to AMPPNP is highlighted with darker blue shading (bottom). (b) DEER spectra and distance distributions (inset) for phosphorylated AurA bound to ADP alone (dark blue) or ADP and 10 mM kemptide substrate peptide (light blue).
Figure 4—figure supplement 3

DEER experiments with an alternate spin labeling site support a phosphorylation-driven structural transition in the DFG-In state.
DEER spectra (a) and distance distributions (b) obtained with unphosphorylated (red) and phosphorylated (blue) AurA labeled with MTSL at L225C and S283C and bound to SNS-314. The inset in a shows a schematic representation of the labeling scheme. The arrows in b highlight the increase in distance observed with phosphorylation.
Additional files
-
Transparent reporting form
- https://doi.org/10.7554/eLife.32766.016
Download links
A two-part list of links to download the article, or parts of the article, in various formats.
Downloads (link to download the article as PDF)
Open citations (links to open the citations from this article in various online reference manager services)
Cite this article (links to download the citations from this article in formats compatible with various reference manager tools)
A dynamic mechanism for allosteric activation of Aurora kinase A by activation loop phosphorylation
eLife 7:e32766.
https://doi.org/10.7554/eLife.32766


