A transcription factor collective defines the HSN serotonergic neuron regulatory landscape
- Instituto de Biomedicina de Valencia IBV-CSIC, Spain
- Centro Superior de Investigación en Salud Pública, FISABIO, Spain
- Howard Hughes Medical Institute, Columbia University Medical Center, United States
Figures
Figure 1 with 2 supplements
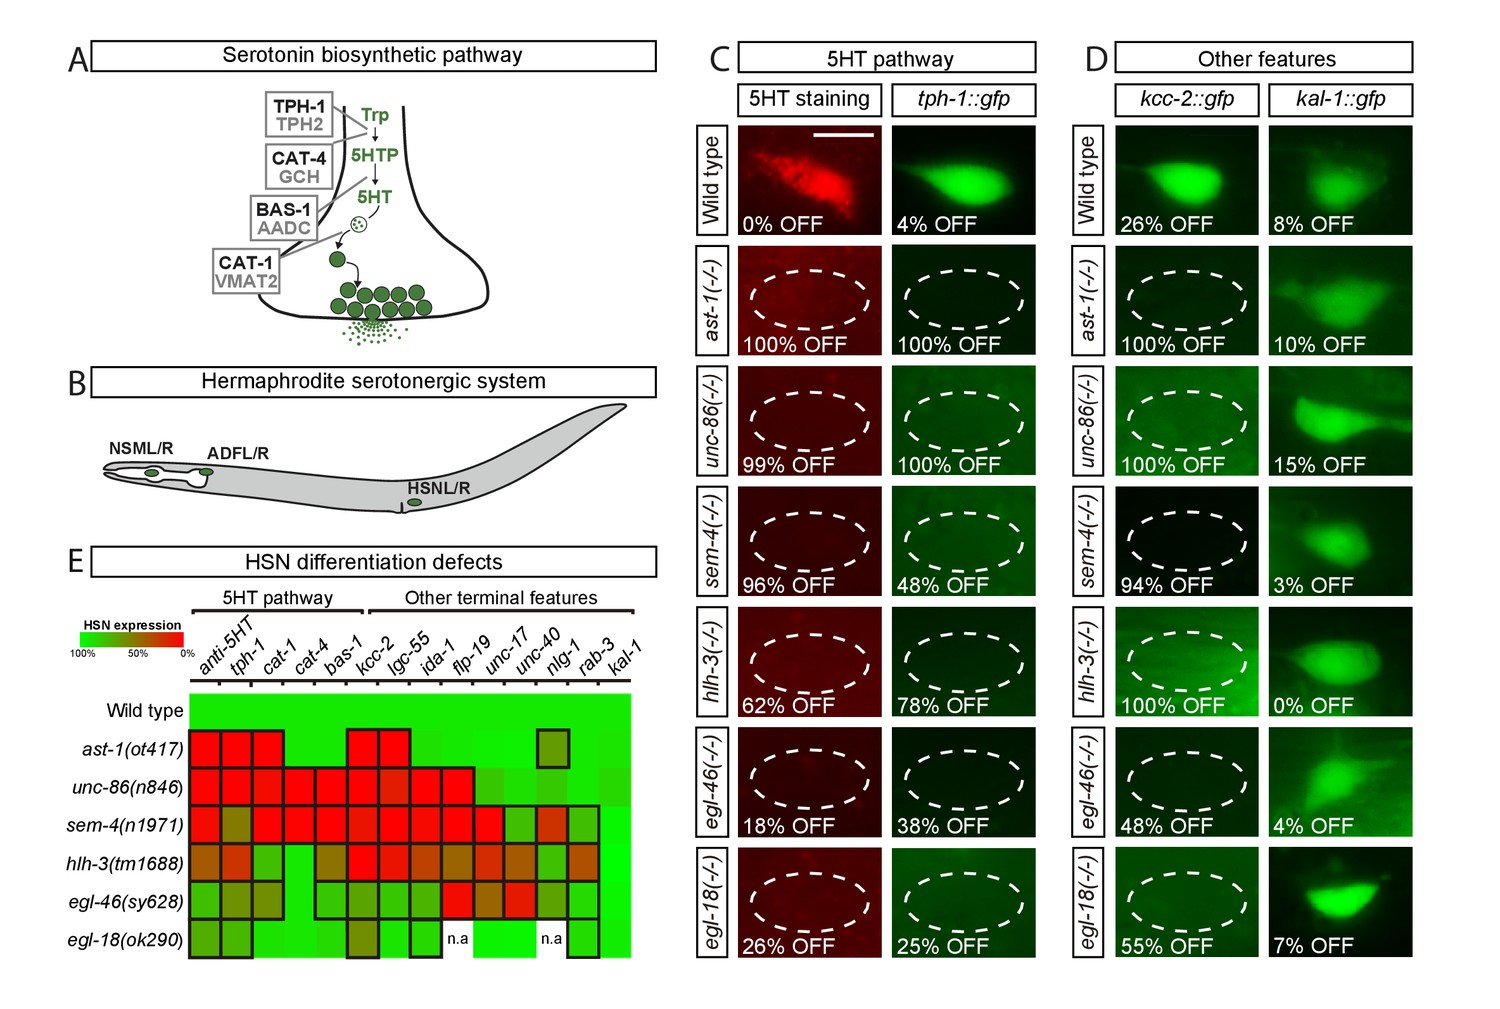
Transcription factors from six different TF families are required for HSN terminal differentiation.
(A) Phylogenetically conserved serotonin biosynthetic pathway. C. elegans protein names appear in black case, mammalian in grey. AADC: aromatic L-amino acid decarboxylase; GCH: GTP cyclohydrolase; TPH: tryptophan hydroxylase; Trp: tryptophan; VMAT: vesicular monoamine transporter; 5HTP: 5-hydroxytryptophan; 5HT: serotonin. (B) C. elegans hermaphrodite serotonergic system is composed of three subclasses of bilateral neurons (NSM, ADF and HSN, L: left, R: right). See Figure 1—figure supplement 1 for expression profiles of serotonergic subclasses. (C) Micrographs showing HSN 5HT staining and tph-1::gfp reporter expression defects of ast-1(ot417), unc-86(n846), sem-4(n1971), hlh-3(tm1688), egl-46(sy628) and egl-18(ok290) mutant animals (quantified in E). Scale bar: 5 μm. (D) Micrographs showing expression defects in the K+/Cl- cotransporter kcc-2::gfp reporter, a terminal feature of HSN not related to 5HT signaling, and normal expression of the extracellular matrix gene kal-1, indicating HSN is still present. (E) Heatmap summary of single TF mutant characterization. Statistically significant expression defects compared to wild type are indicated with a black frame. flp-19: FMRF-like peptide; ida-1: Tyr phosphatase-like receptor; lgc-55: amine-gated Cl- channel; nlg-1: neuroligin; rab-3: ras GTPase; unc-17: vesicular acetylcholine transporter; unc-40: netrin receptor. n.a: not analyzed. See Source data 1 for primary data and Fisher's exact test p-values and Figure 1—figure supplement 2 and Supplementary file 1 for analysis of additional alleles. n > 100 cells per condition.
Figure 1—figure supplement 1
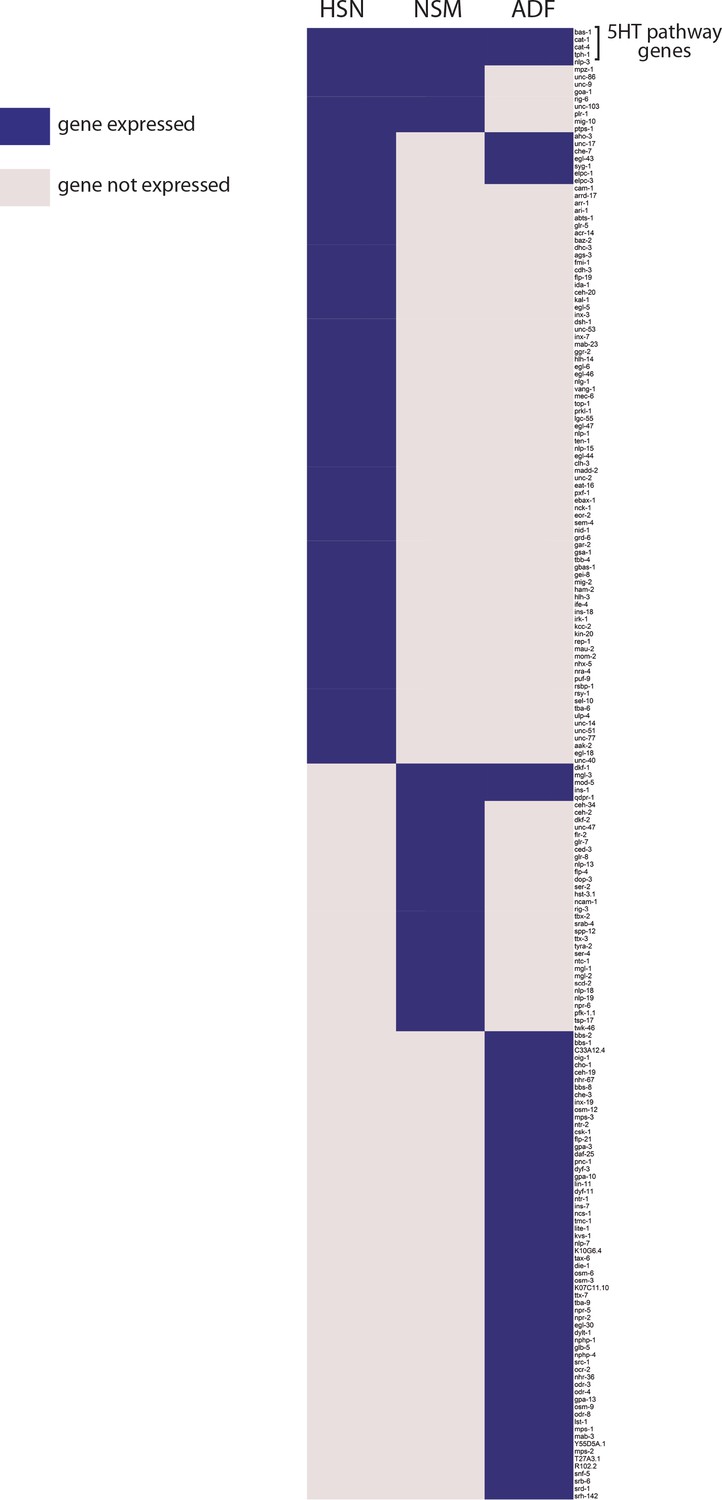
Each serotonergic neuron subclass expresses different sets of genes.
Heat map representation of known HSN, NSM and ADF expressed genes [from (Hobert et al., 2016)]. Only the 5HT pathway genes and one additional gene (nlp-3) are expressed by the three serotonergic subclasses.
Figure 1—figure supplement 2
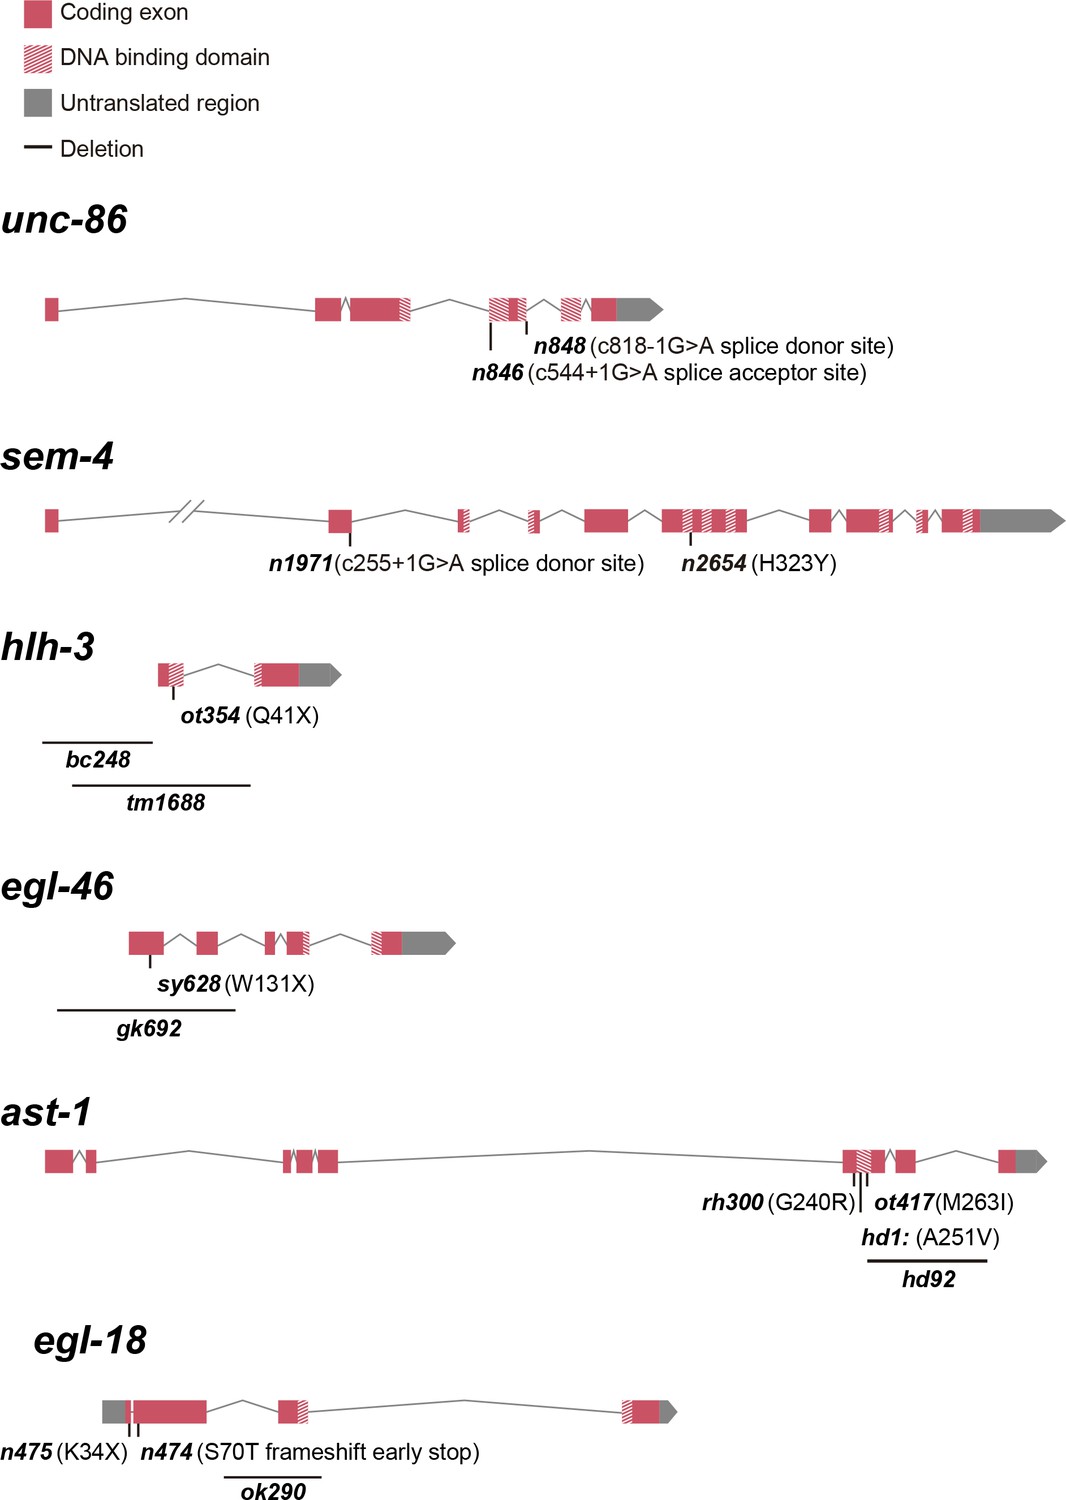
Schematic representation of analyzed HSN TF combination alleles.
See Supplementary file 1 for phenotype description.
Figure 2 with 1 supplement

AST-1 acts as temporal switch for HSN maturation.
(A) Micrographs showing expression of the HSN TF combination at L4 larval stage and adult animals. (B) Analysis of HSN TF expression across all developmental stages in the HSN neuron. n > 30 cells for each developmental point. Error bars are SEP values. See Figure 2—figure supplement 1 for more detailed hlh-3 developmental expression. (C) Heat-shock-induced expression of hlh-3 at L4 larval stage is able to rescue tph-1::gfp expression defects in the HSN neuron. n > 100 cells per condition. See Source data 1 for primary data and Fisher's exact test p-values. *: p-value <0.05. (D) Precocious L1 onset of expression of ast-1, hlh-3 or both using an early active HSN-specific promoter (also expressed in NSM, ADF and VC4/5 neurons). Precocious ast-1 advances tph-1::gfp expression, while hlh-3 alone or in combination with ast-1 delays tph-1::gfp expression and produces expression defects. YA: young adult. n > 30 cells per time point and condition. See Source data 1 for primary data and Fisher's exact test p-values. *: p-value <0.05.
Figure 2—figure supplement 1
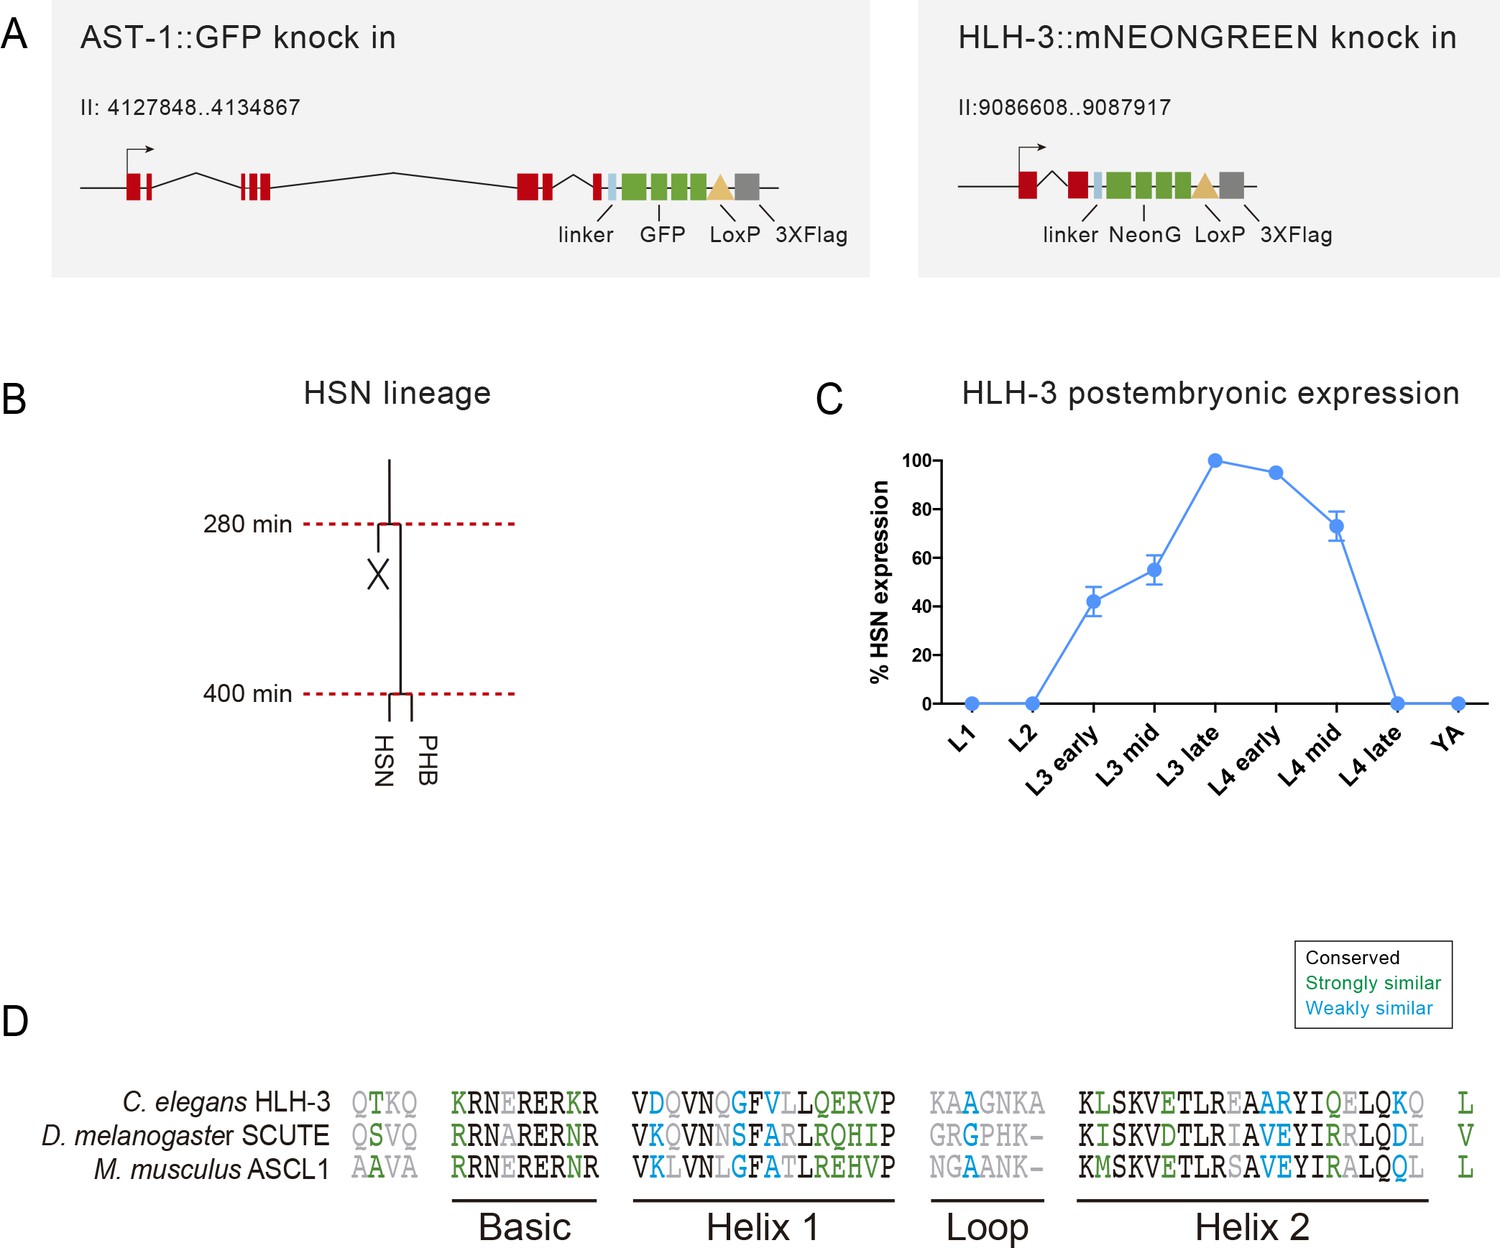
Dynamic HLH-3 expression in the HSN.
(A) Schema of the modified ast-1 and hlh-3 locus to produce the corresponding fluorescent fusion proteins. (B) HSN lineage representation. (C) HLH-3 expression reappears postembryonically at L3 stage, peaks at late L3 and quickly disappears at the end of L4 stage. N > 100 cells each stage. (D) Alignment of the bHLH domain of C. elegans HlH-3, D. melanogaster SCUTE and M. musculus ASCL1 (EMBOSS Needle alignment tool default parameters). HLH-3 shows 48.3% identity and 63.8% similarity with SCUTE and 56.9% identity and 65.5% similarity with ASCL1.
Figure 3 with 1 supplement
UNC-86 is a master regulator of the HSN transcription factor combination.
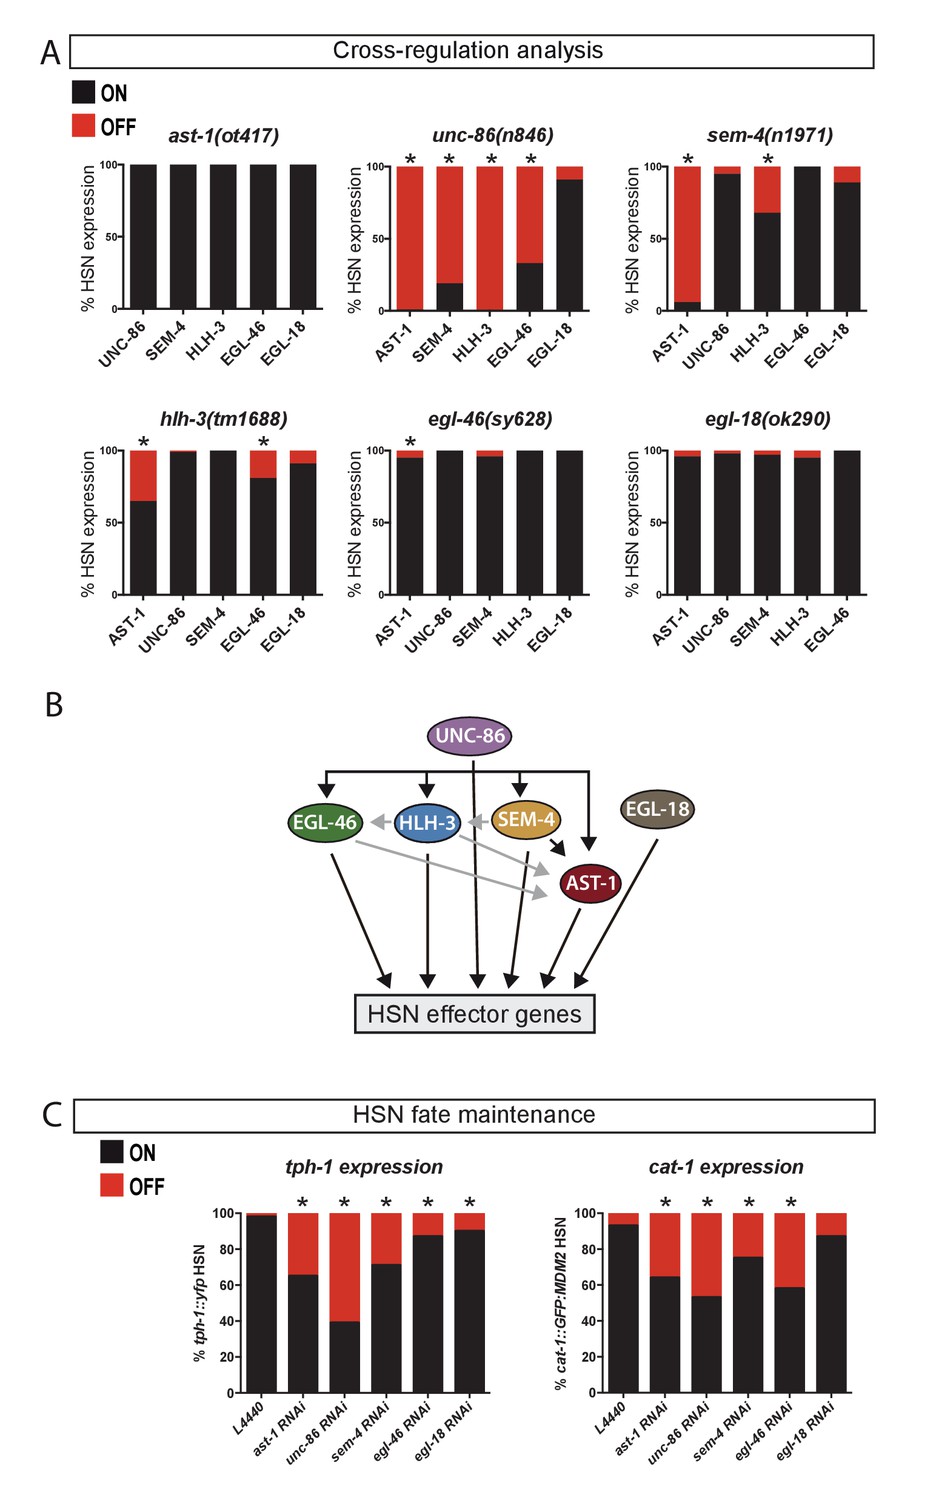
(A) Expression of the HSN TFs in different mutant backgrounds. All scorings were performed at adult stages except for HLH-3, where early L4 larvae were scored. Embryonic HLH-3 expression is unaffected in unc-86 mutants (data not shown). Graphs show the percentage of TF expression in mutant animals relative to wild type expression. n > 100 cells per condition, Fisher's exact test, *: p-value<0.05, See Source data 1 for raw data and exact p-values. (B) Summary of relationships among the HSN TF combination, black arrows mean strong effect (more than 50% loss of expression) and grey arrows depicts the rest of significant defects. (C) Loss-of-function (RNAi) experiments after HSN differentiation show that AST-1, UNC-86, SEM-4, EGL-46 and EGL-18 are required to maintain proper tph-1::yfp and cat-1::MDM2::gfp (unstable GFP) reporter expression. Worms were also scored prior to RNAi treatment to confirm correct HSN differentiation before starting the experiment. n > 100 cells per condition, Fisher's exact test, *: p-value <0.05. See Source data 1 for raw data and Figure 3—figure supplement 1 for maintenance analysis with temperature-sensitive alleles.
Figure 3—figure supplement 1
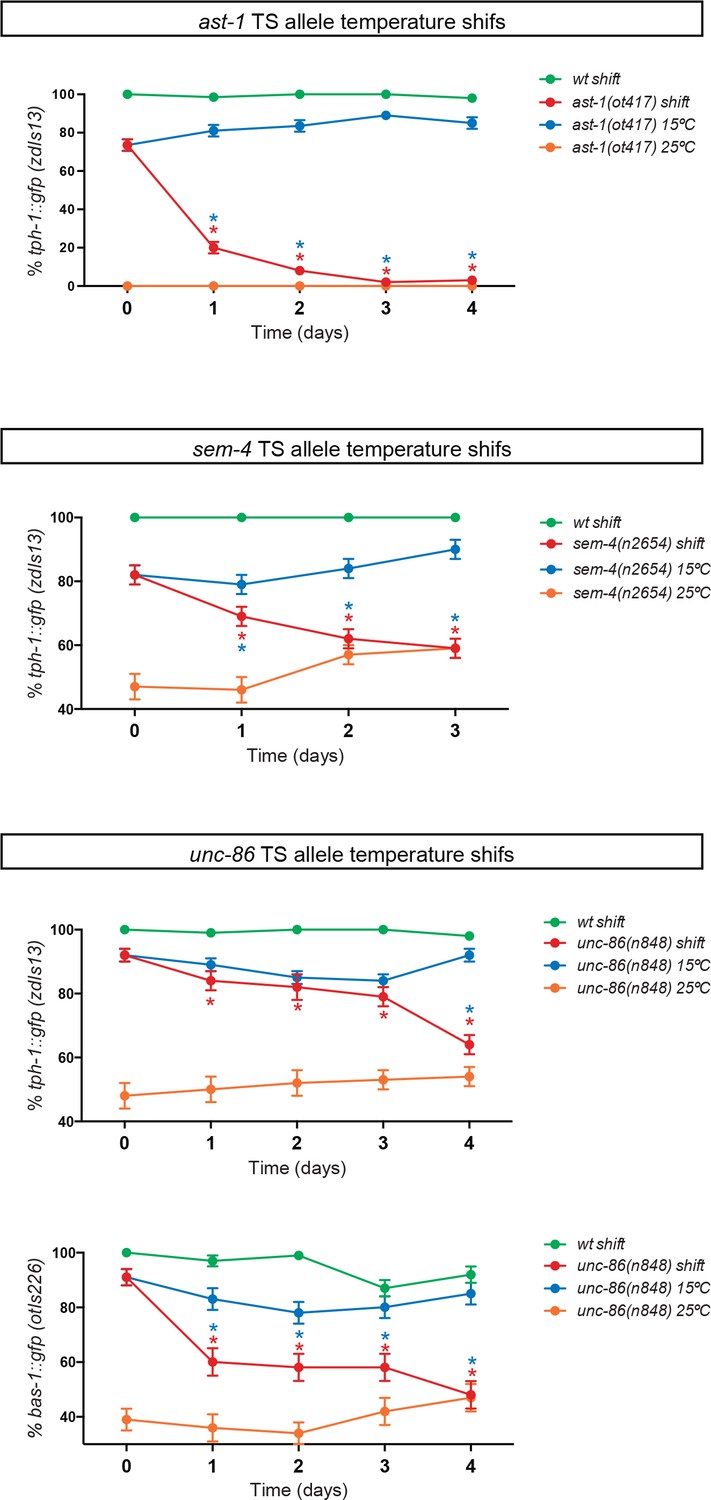
AST-1, UNC-86 and SEM-4 are required to maintain the HSN differentiated state.
Three temperature-sensitive alleles ast-1(ot417), unc-86(n848) and sem-4(n2654) were used to perform temperature shifts to restrictive temperatures after HSN has fully differentiated (young adult). Temperature shifts (red lines) lead to reporter expression defects. Red asterisks refer to the comparison between mutant values before and after the temperature shift and blue asterisks refer to the comparison at the same time point between shifted animals (red line) and animals kept at permissive temperature (blue line) (n > 100 cells per condition). Fisher's exact test, *: p-value<0.05. Related to Figure 3.
Figure 4 with 1 supplement
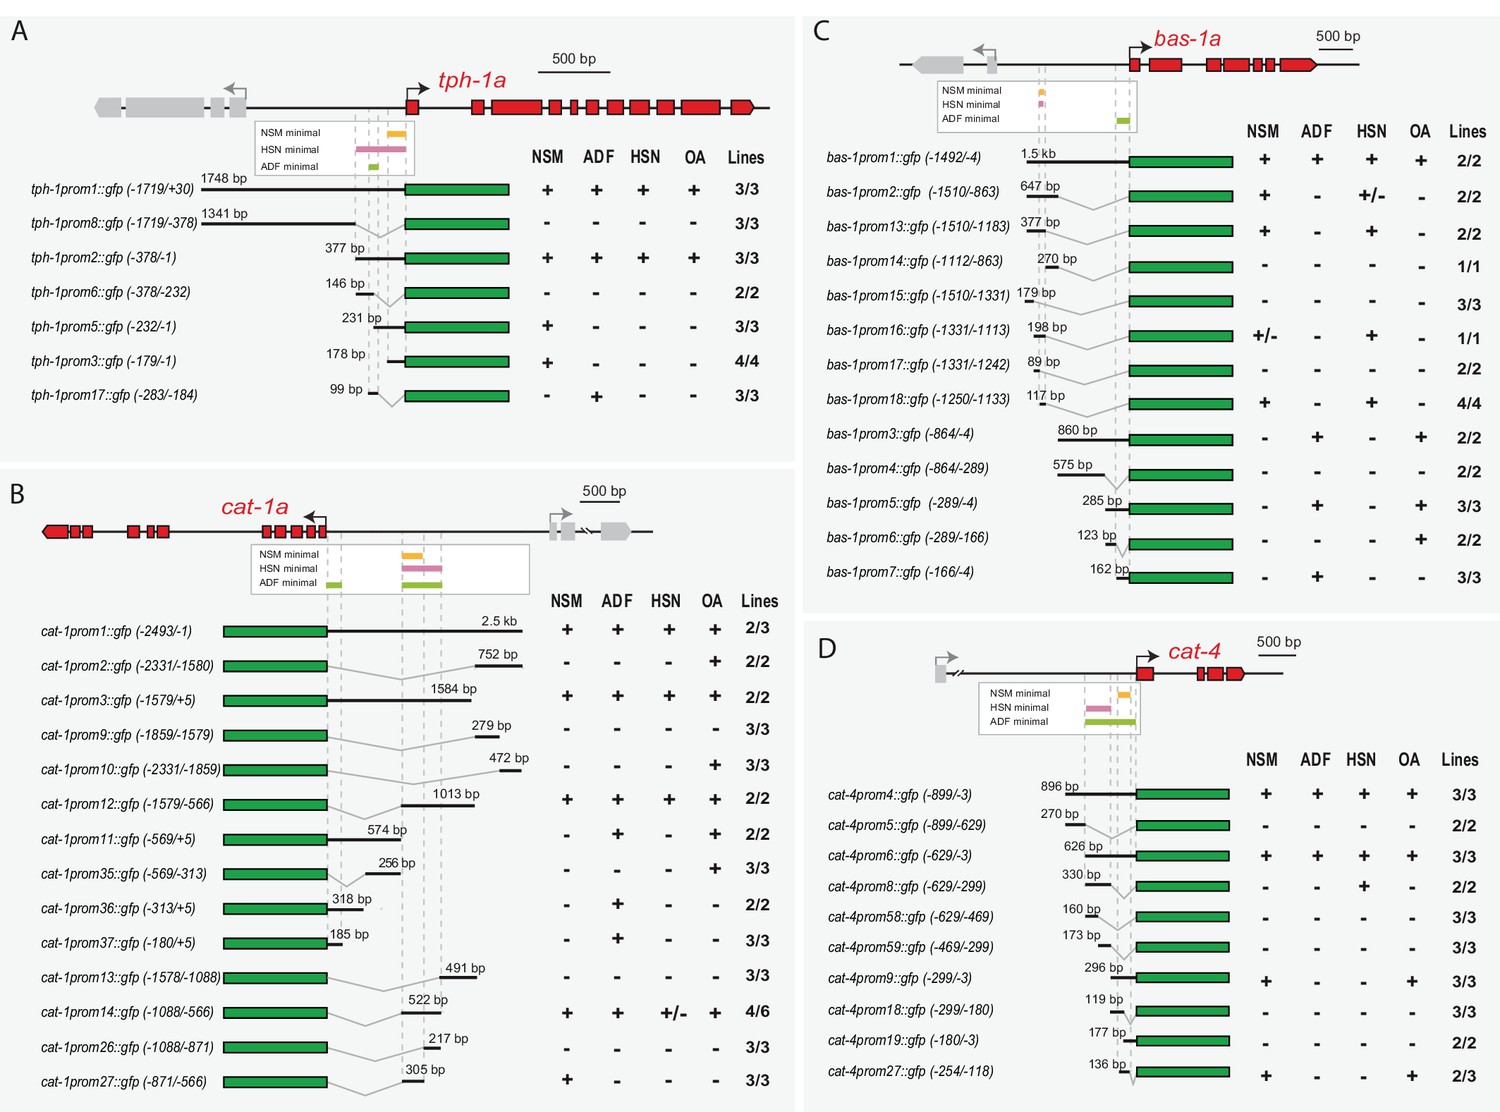
Distinct cis-regulatory modules control serotonin pathway gene expression in different subclasses of serotonergic neurons (A–D) cis-regulatory analysis of the 5HT pathway genes.
White boxes underneath each gene summarize the smallest CRM that drive expression in each serotonergic neuron subclass. Thick black lines symbolize the genomic region placed upstream of GFP (green box) and dashed lines are used to place each construct in the context of the locus. OA: other aminergic cells (RIC, RIM, AIM, RIH, CEPs, ADE, PDE, VC4/5) that also share the expression of some 5HT pathway genes. Numbers in brackets represent the coordinates of each construct referred to the ATG. +: >60% GFP positive cells; +/−: 20–60% GFP cells; −: <20% GFP cells. x/y represents the number of lines with the expression pattern (x) from the total lines analyzed (y). n > 60 cells per line. See Figure 4—figure supplement 1 for raw values.
Figure 4—figure supplement 1

5HT pathway gene CRM analysis.
Thick black lines symbolize the genomic region placed in front of GFP (green box) and dashed lines are used to place each construct in the context of the locus. White boxes underneath each gene summarize the smallest CRM that drives expression in each serotonergic neuron subclass. Numbers in brackets represent the coordinates of each construct referred to the ATG. Each number represents the % of GFP cells in a particular transgenic line. +: >60% GFP-positive cells; +/−: 20–60% GFP cells; - < 20% GFP cells. n > 60 cells per line.
Figure 5 with 2 supplements
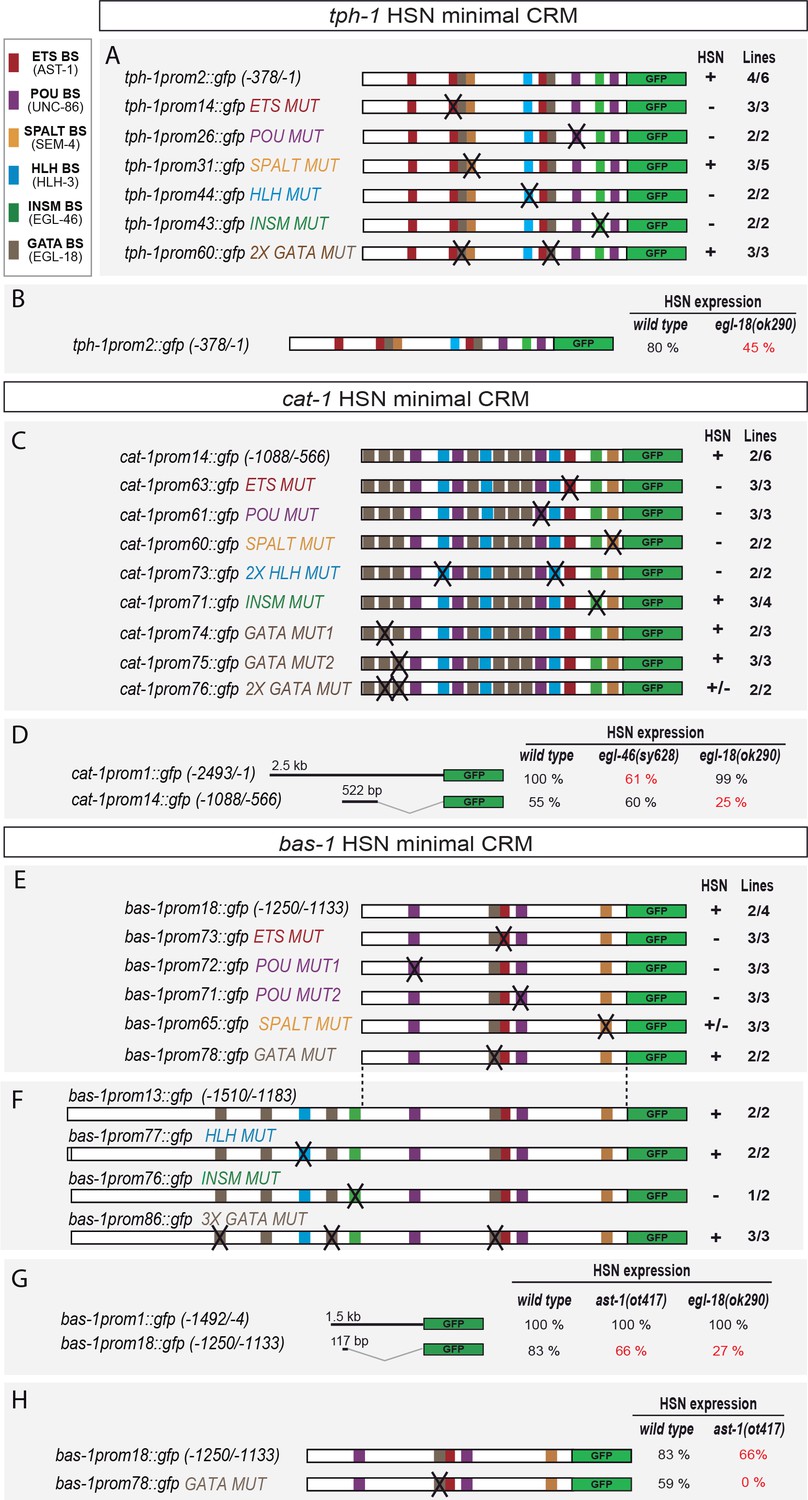
HSN transcription factor combination acts directly on target genes.
(A) tph-1 minimal HSN CRM (tph-1prom2) mutational analysis. Black crosses represent point mutations to disrupt the corresponding TFBS. +: > 60% of mean wild type construct values; +/−: expression values 60–20% lower than mean wild type expression values; −: values are less than 20% of mean wild type values. n > 60 cells per line. x/y represents the number of lines with the expression pattern (x) from the total lines analyzed (y). See Figure 5—figure supplement 1 for raw values and nature of the mutations and Figure 5—figure supplement 2 for in vitro binding. (B) tph-1prom2::gfp expression is partially affected in egl-18(ok290) mutants. In red, significant defects relative to wild type. n > 100 cells for each genotype. (C) cat-1 minimal HSN CRM (cat-1prom14) mutational analysis. (D) cat-1prom14::gfp expression is unaffected in egl-46 mutants, which coincides with the lack of phenotype when INSM binding sites are mutated in this construct. cat-1prom14::gfp contains functional GATA sites and, as expected, its expression is affected in egl-18 mutants. Expression of a longer reporter (cat-1prom1::gfp) is independent of egl-18 revealing compensatory effects in the context of big regulatory sequences. (E) bas-1 minimal HSN CRM (bas-1prom18) mutational analysis. (F) A longer bas-1 construct (bas-1prom13) is more robustly expressed in HSN (90% expression compared to mean 48% expression of bas-1prom18 reporter lines). This construct contains functional INSM binding sites. (G) bas-1prom18::gfp expression is affected in ast-1(ot417) and egl-18(ok290) mutants. Expression of a longer reporter (bas-1::prom1) is independent of ast-1 and egl-18 revealing compensatory effects in the context of big regulatory sequences. (H) GATA-binding site point mutation does not significantly affect bas-1::gfp expression in the wild type background (no significant difference between mean expression of three lines of bas1prom1 and three lines of bas1prom18). However, it synergizes with ast-1 mutant background leading to a complete loss of GFP expression. These results unravel a direct role for GATA sites in bas-1 gene expression and synergy between egl-18 and ast-1.
Figure 5—figure supplement 1
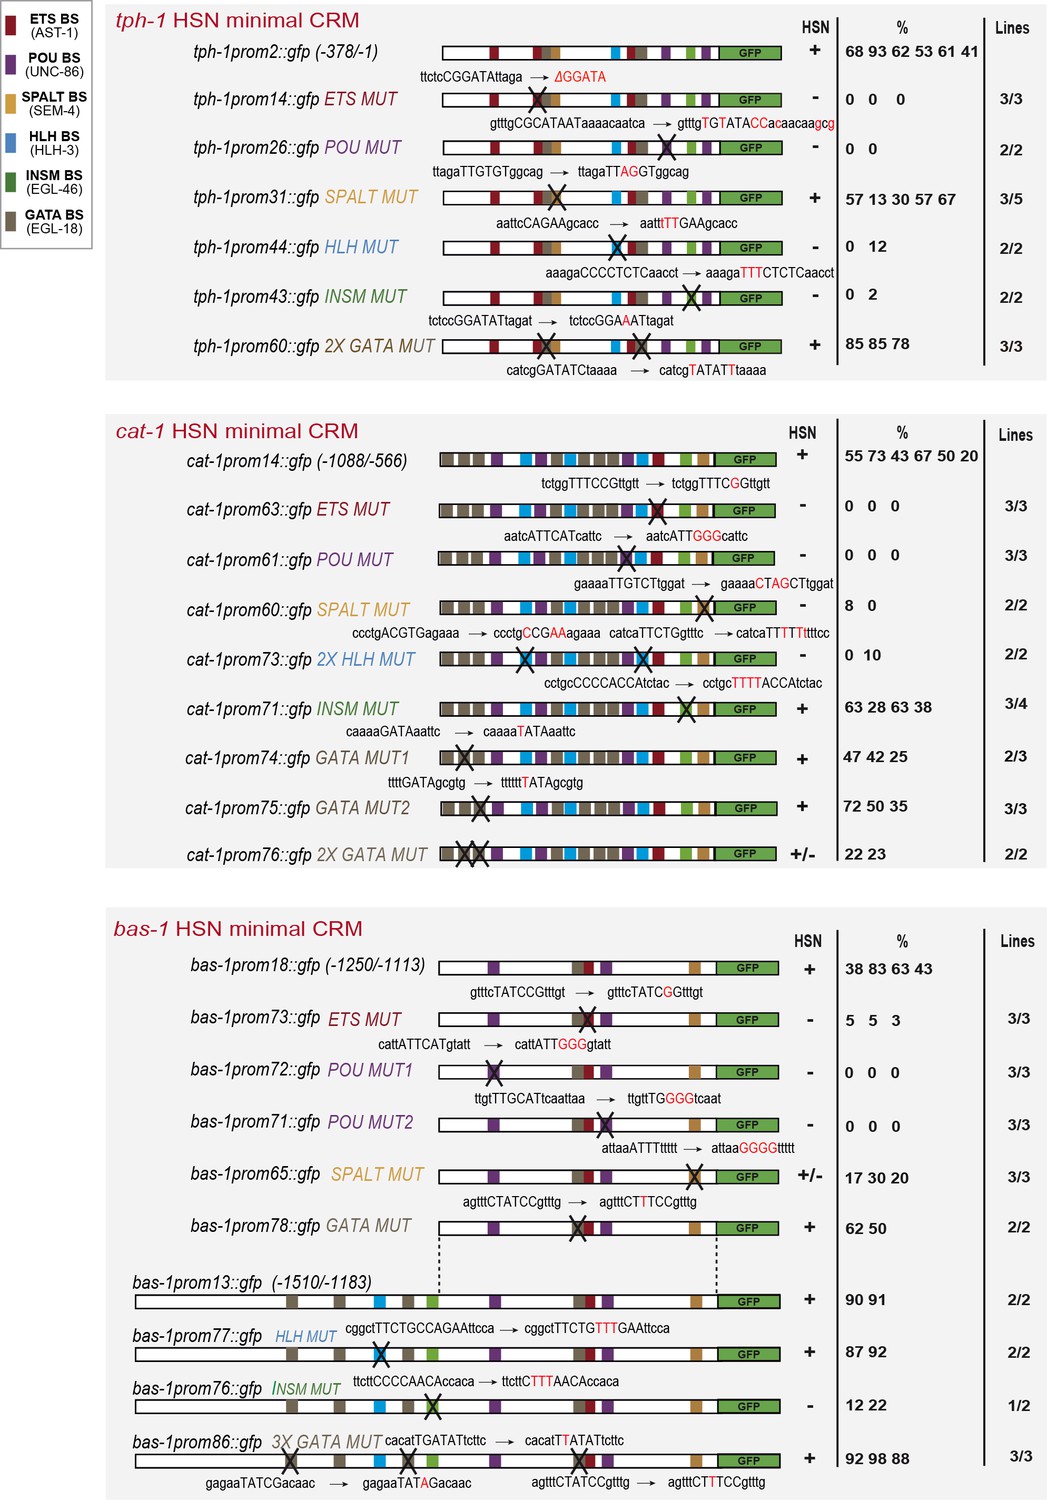
Primary data from the mutagenesis analysis (Figure 5).
Each number represents the % of GFP cells in a particular transgenic line. +: > 60% of mean wild type construct expression, +/−: values indicate a penetrance of 20–60% the mean wild type expression value; −: values are less than 20% of mean wild type values. n > 60 cells per line. Above each construct, the wild type consensus sequences are included in capital letters in a longer region context and after the arrow the point mutations are highlighted in red. Related to Figure 5.
Figure 5—figure supplement 2
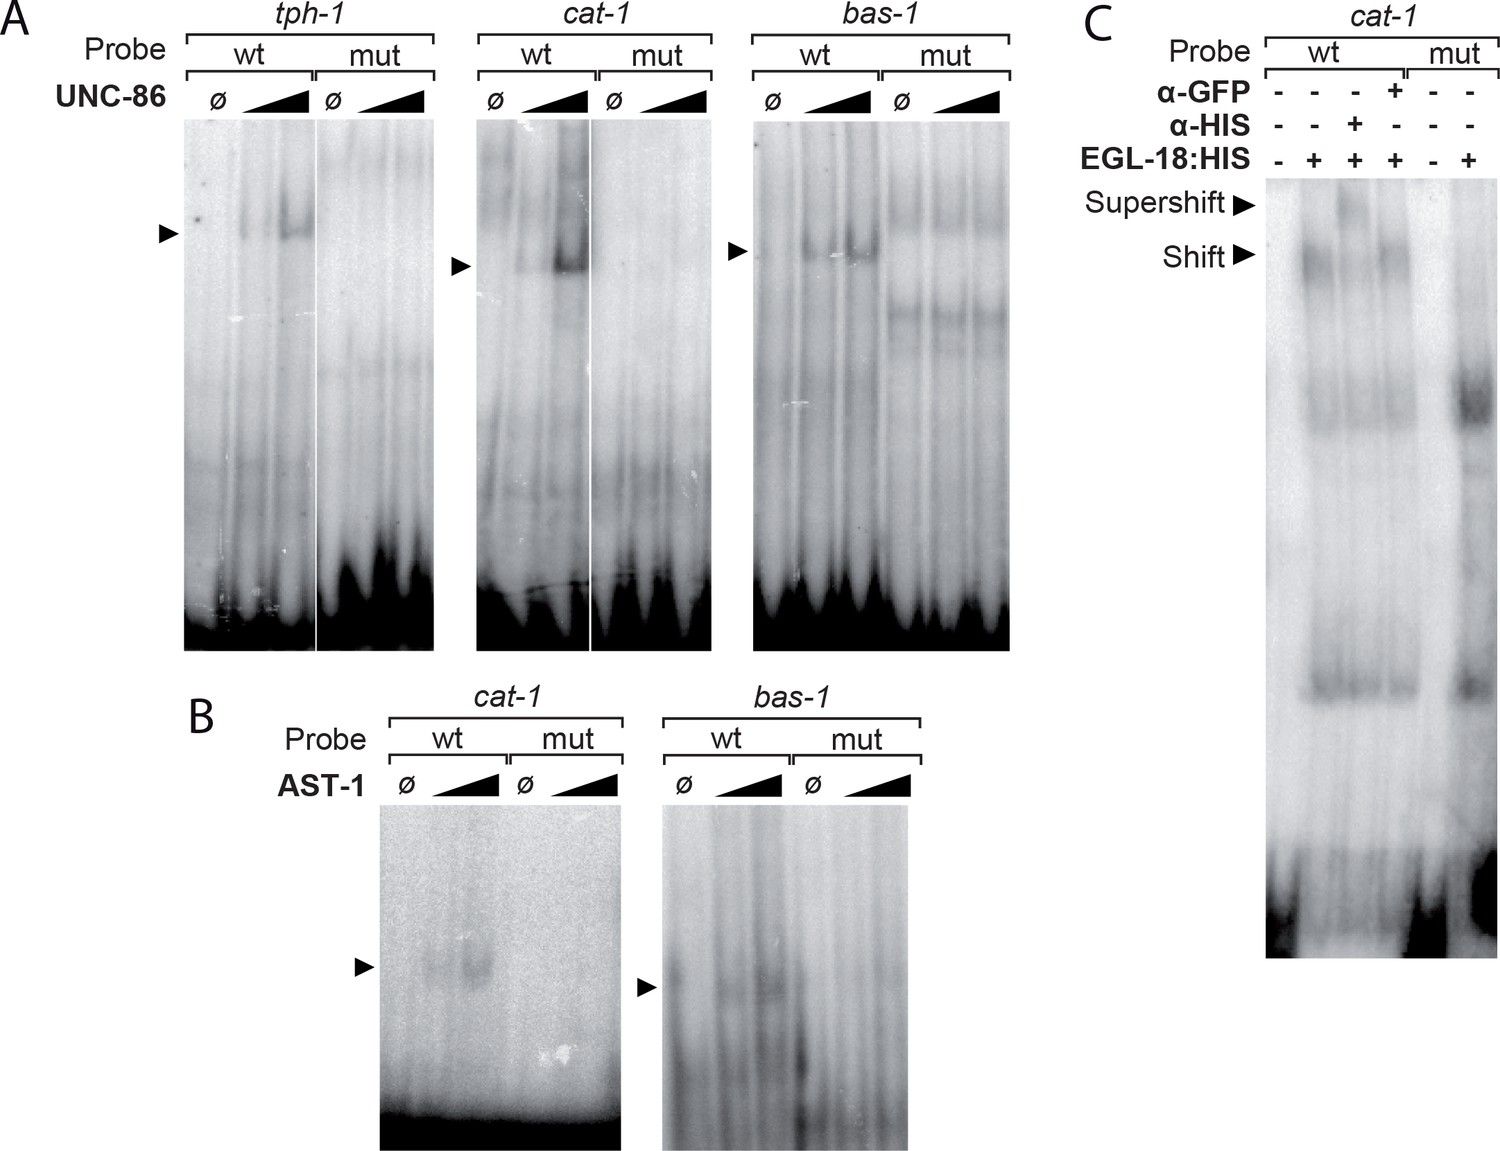
UNC-86, EGL-18 and AST-1 bind to the 5HT pathway gene CRMs in electrophoretic mobility assays.
(A) Purified UNC-86 binds tph-1, cat-1 and bas-1 CRMs in a concentration dependent manner (depicted by arrowheads). UNC-86 binding is aboDlished by point mutation in the POU-binding site (mut lanes). (B) Similarly, purified AST-1 binds to cat-1 and bas-1 CRMs in a concentration-dependent manner (arrowheads). AST-1 binding is lost upon ETS-binding site mutation (mut lanes). (C) Cellular extracts from HEK293T cells overexpressing EGL-18:HIS bind the cat-1 CRM. HIS antibody but not GFP antibody causes a shift in EGL-18:HIS band (compare Shift to Supershift bands) indicating that binding involves EGL-18 protein. Moreover, point mutation of GATA site abolishes cat-1 sequence binding by the cellular extract (mut lanes).
Figure 6 with 1 supplement
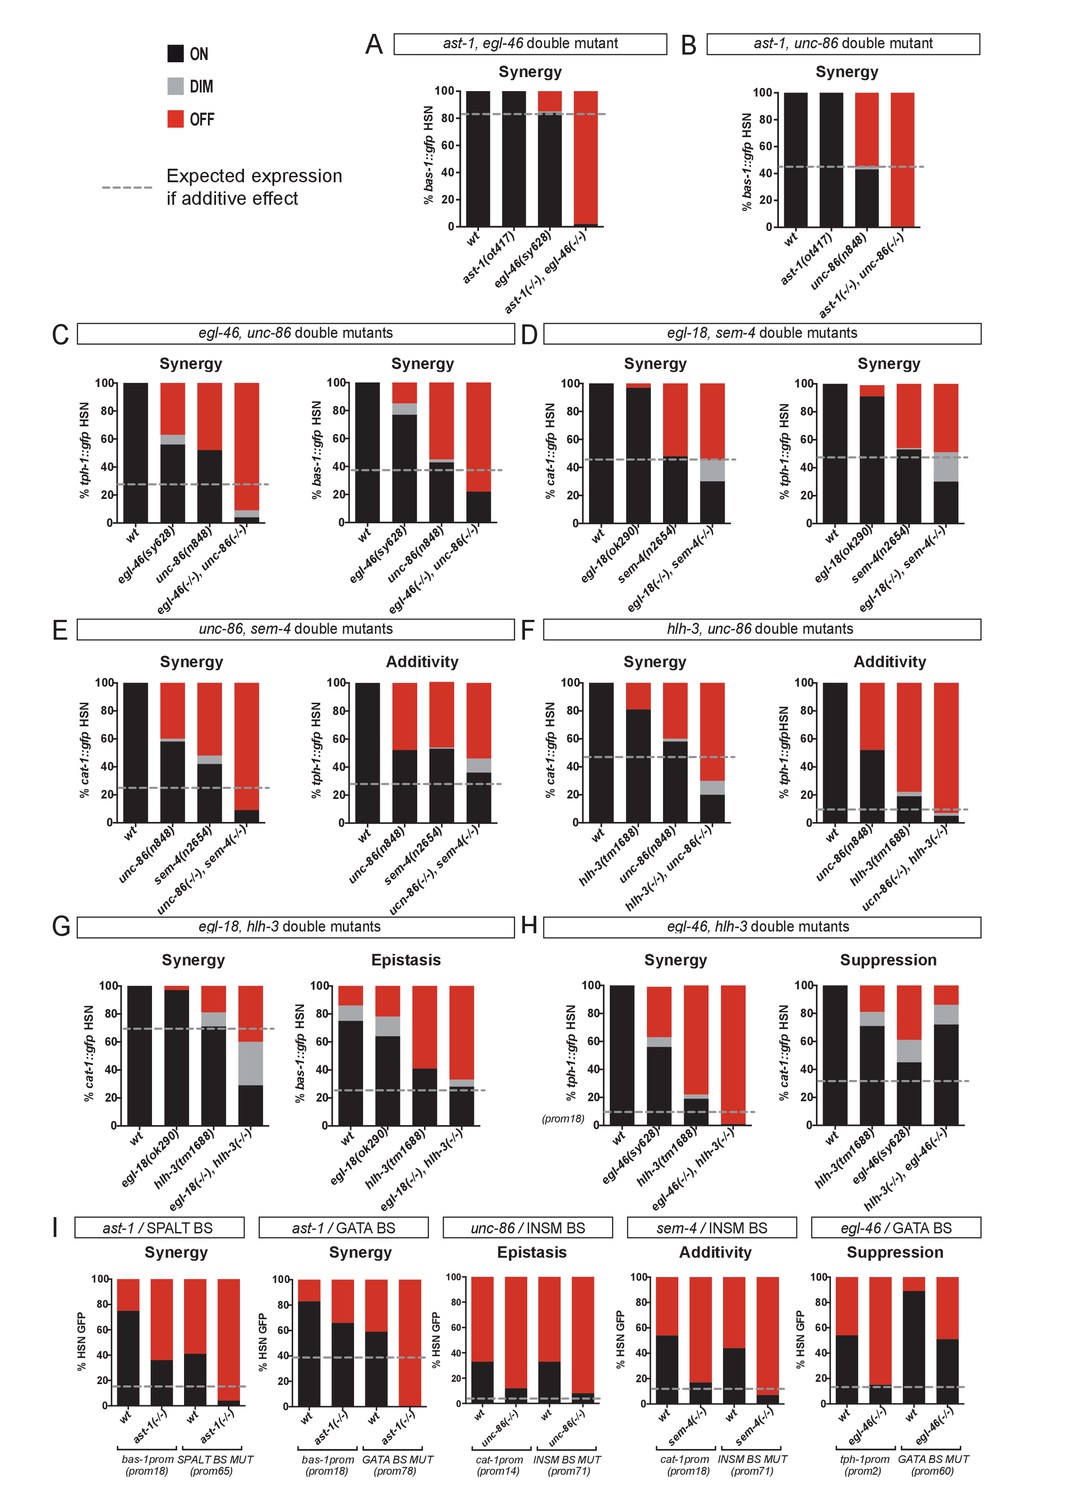
HSN TF collective shows enhancer-context dependent synergistic relationships.
(A–H) Double mutant analysis of different pairs of the HSN TF collective. Expression level expected from additive effects (calculated as the product of single mutant expression values) is marked with a dotted line. Double mutant phenotypes statistically different from additive effect (Pearson’s chi-squared test) are classified as synergistic (if phenotype is stronger than additive), epistatic (if phenotype is similar to one of the single mutants) or suppression (if phenotype is milder than the expected for additivity or the single mutants). The majority of the double mutant combinations show synergistic effects. n > 100 cells each genotype. See Figure 6—figure supplement 1 and Figure 6—source data 1 for raw values, statistics and additional double mutant combinations. (I) Cis-trans mutant analysis. TFBS mutations are combined with single mutants of the HSN TF collective. n > 100 cells each genotype. See Figure 6—source data 1 raw values and statistics.
-
Figure 6—source data 1
Raw scoring data and statistical analysis of double mutant and double cis/trans analysis.
Related to Figure 6.
- https://doi.org/10.7554/eLife.32785.017
Figure 6—figure supplement 1
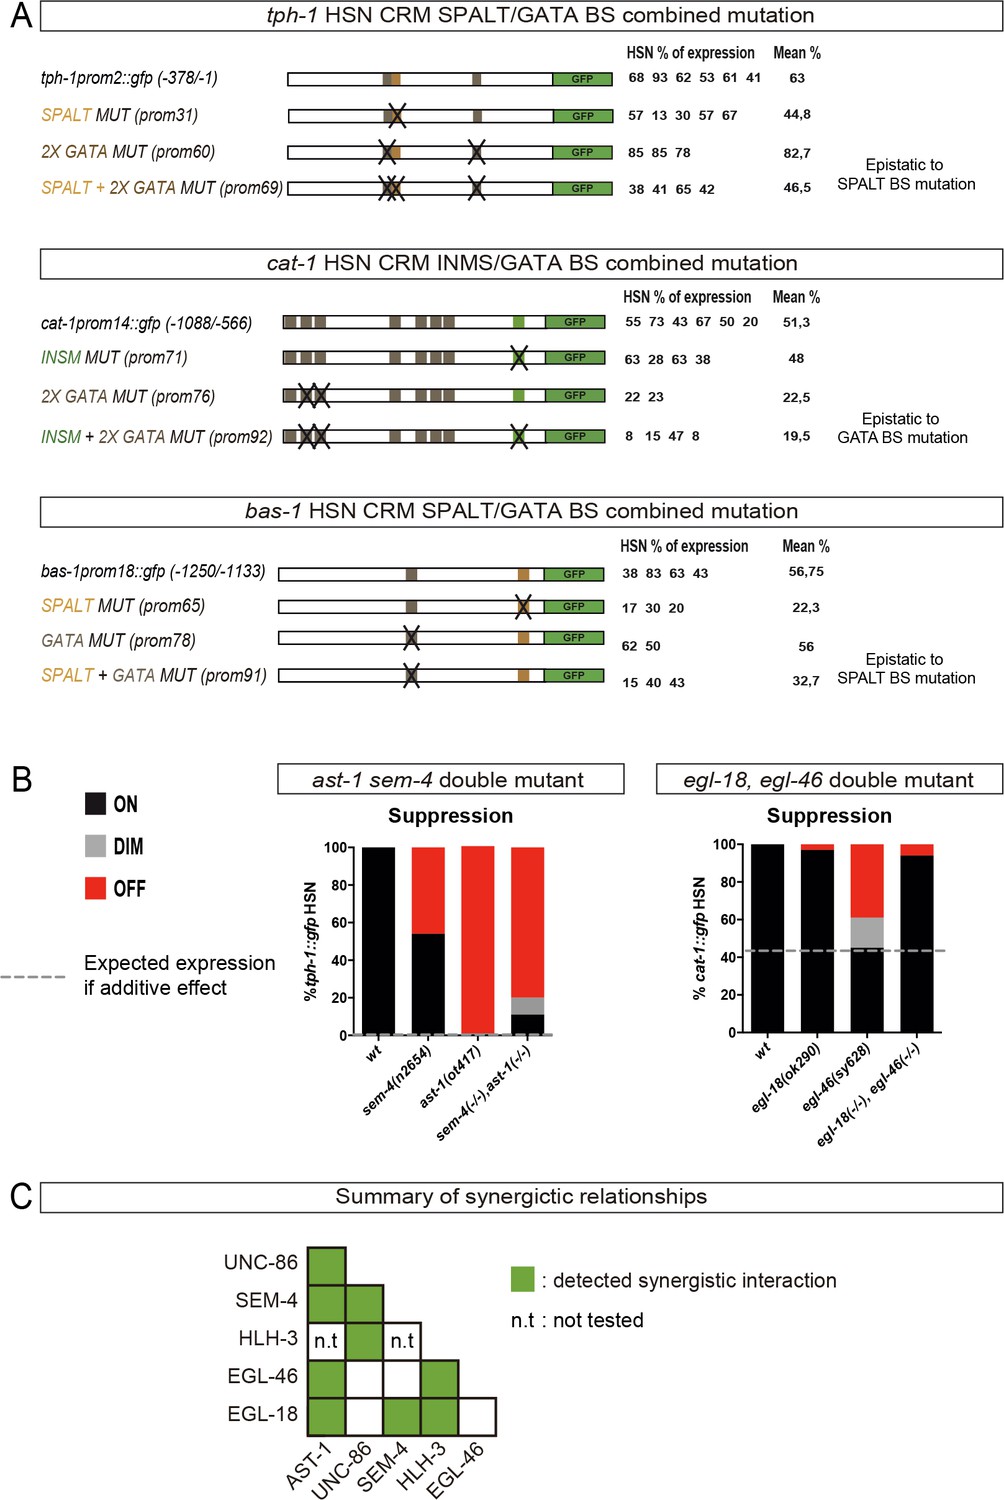
HSN TF collective genetic interactions.
(A) TFBS whose mutation leads to partial or no defects on gene expression were combined in double TFBS mutations. Combined mutations are epistatic to single TFBS mutation effects. (B) Two additional examples of HSN TF collective double mutants that show genetic suppression. (C) Summary of the HSN TF collective pairs in which we were able to identify synergistic effects. See Figure 6—source data 1 for raw values and statistics.
Figure 7 with 3 supplements
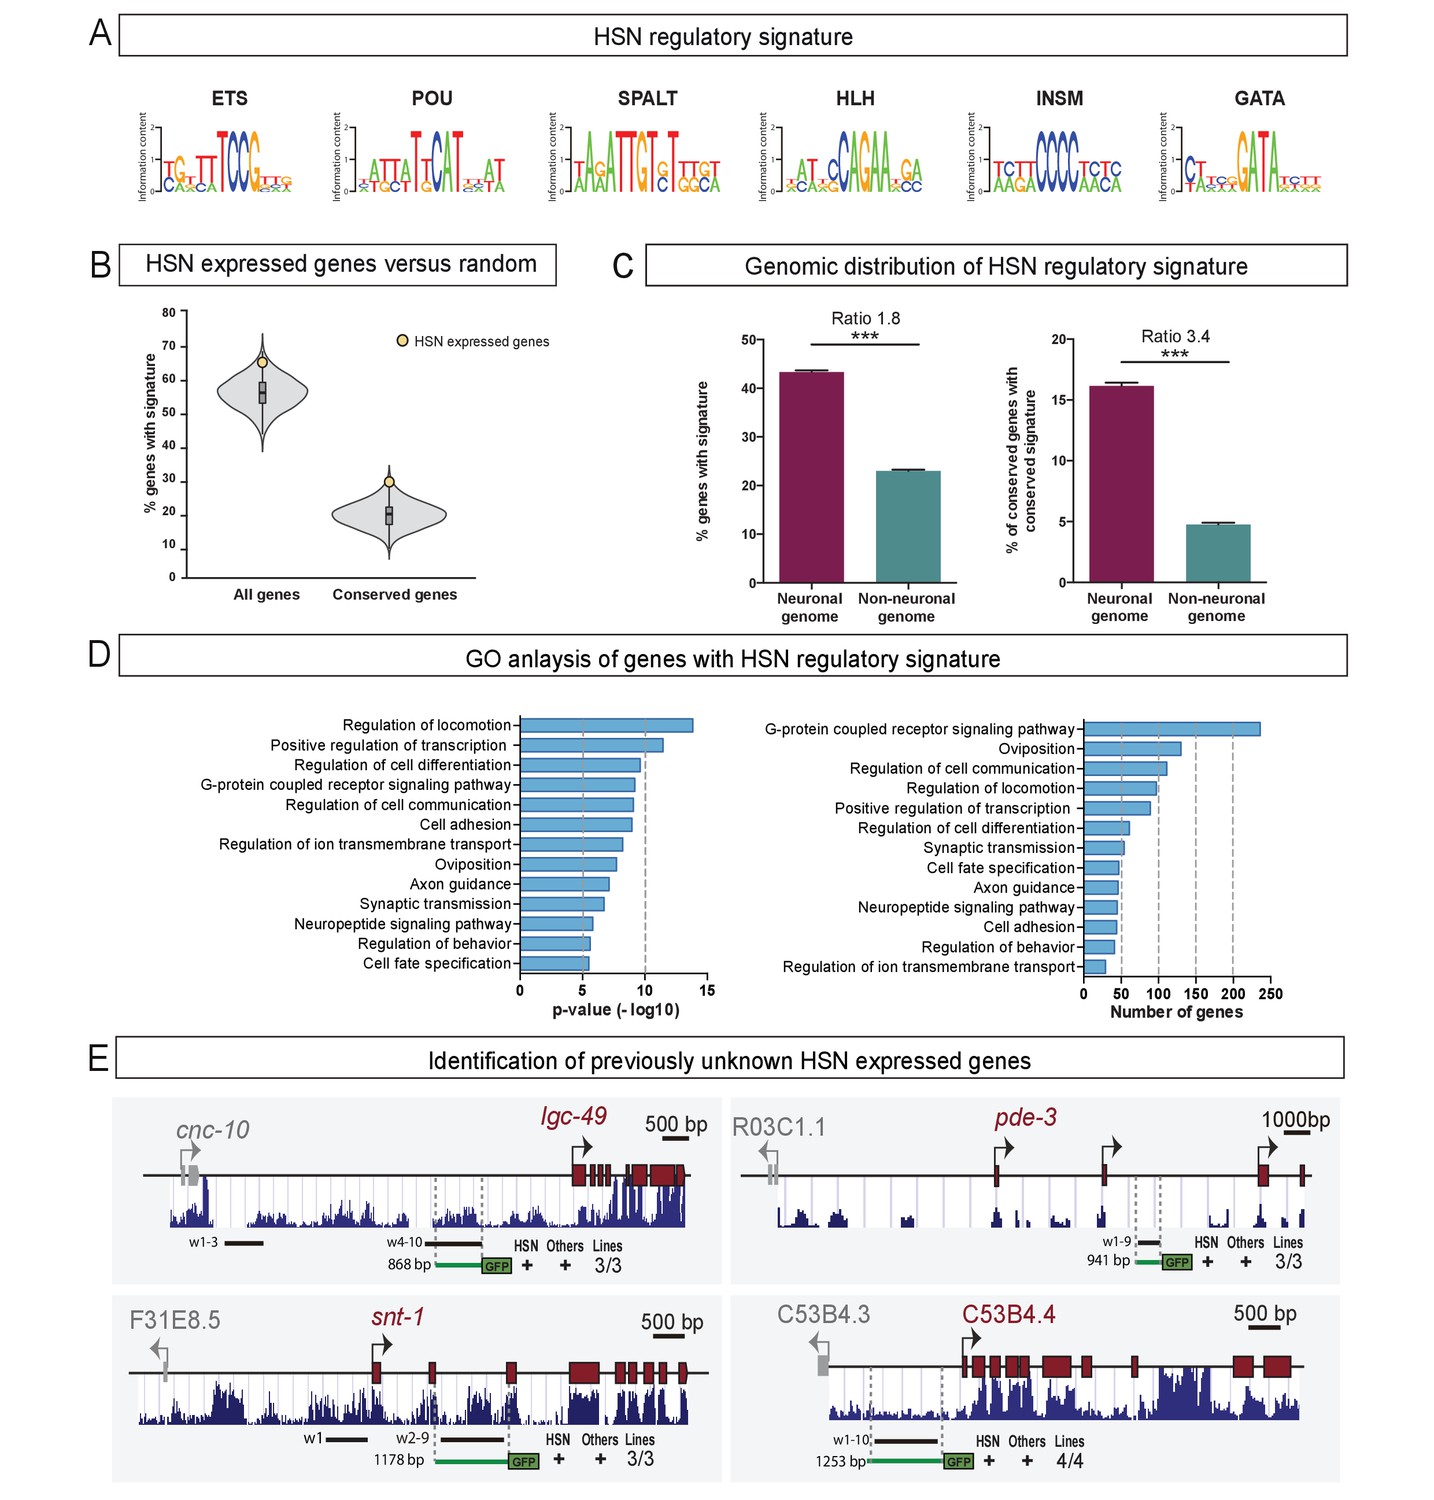
The HSN regulatory signature can be used to de novo identify HSN expressed genes.
(A) Position weight matrix logos of the HSN TF collective calculated from the functional binding sites in Figure 5. (B) HSN regulatory signature is more prevalent in the set of 96 known HSN expressed genes (yellow dot) compared to the distribution in 10,000 sets of random comparable genes (grey violin plot) (p<0.05). Considering phylogenetic conservation of HSN regulatory signature increases the enrichment of the HSN regulatory signature in the HSN expressed genes (p<0.01). See also Figure 7—figure supplement 1 for additional data. (C) HSN regulatory signature is enriched in neuronal genes compared to the non-neuronal genome. Inclusion of the conservation criteria in the HSN regulatory signature analysis strongly increases the difference between neuronal and non-neuronal genome. Pearson’s chi-squared test. ***p-value<0.0001. See also Figure 7—figure supplement 2 for additional data. (D) Gene ontology analysis of genes with HSN regulatory signature. p-values and number of genes corresponding to the biological processes enriched in genes with HSN regulatory signature. (E) Four representative examples of de novo identified HSN active enhancers. Black lines represent the coordinates covered by bioinformatically predicted HSN regulatory signature windows (indicated by ‘w’ and a number). Green lines mark the region used in our analysis. Dark blue bar profiles represent sequence conservation in C. briggsae, C. brenneri, C. remanei and C. japonica. n > 60 cells per line. See Figure 7—source data 1 for a list of all reporters and raw scoring data. Expression level of most of these reporters is regulated by unc-86 (Figure 7—figure supplement 3).
-
Figure 7—source data 1
Scripts for HSN regulatory signature analysis.
Related to Figure 7.
- https://doi.org/10.7554/eLife.32785.022
-
Figure 7—source data 2
Raw scoring data of de novo finding of HSN enhancers and dependency on unc-86 function.
Related to Figure 7.
- https://doi.org/10.7554/eLife.32785.023
Figure 7—figure supplement 1

HSN regulatory signature distribution in HSN expressed genes.
(A) No significant difference was found in the functional distribution of all HSN expressed genes compared tothe subset og genes with HSN regulatory signature or HSN expressed genes with conserved signature (chi-squared test computing p-values by Monte Carlo simulation p-value=0.59). (B) Reporter analysis to test functionality of HSN signature windows in HSN expressed genes. Black lines represent the coordinates covered by bioinformatically predicted HSN signature windows (indicated by w and a number). Light blue lines indicate the published reporter construct(PMID:18408008, PMID: 15177025, PMID: 10926783 and PMID:19675228) . Green lines mark the region used in our analysis. Dark blue bar profiles represent sequence conservation in C. briggsae, C. brenneri, C. remanei and C. japonica. See Figure 7—source data 1 for a list of all reporters and raw scoring data.
Figure 7—figure supplement 2
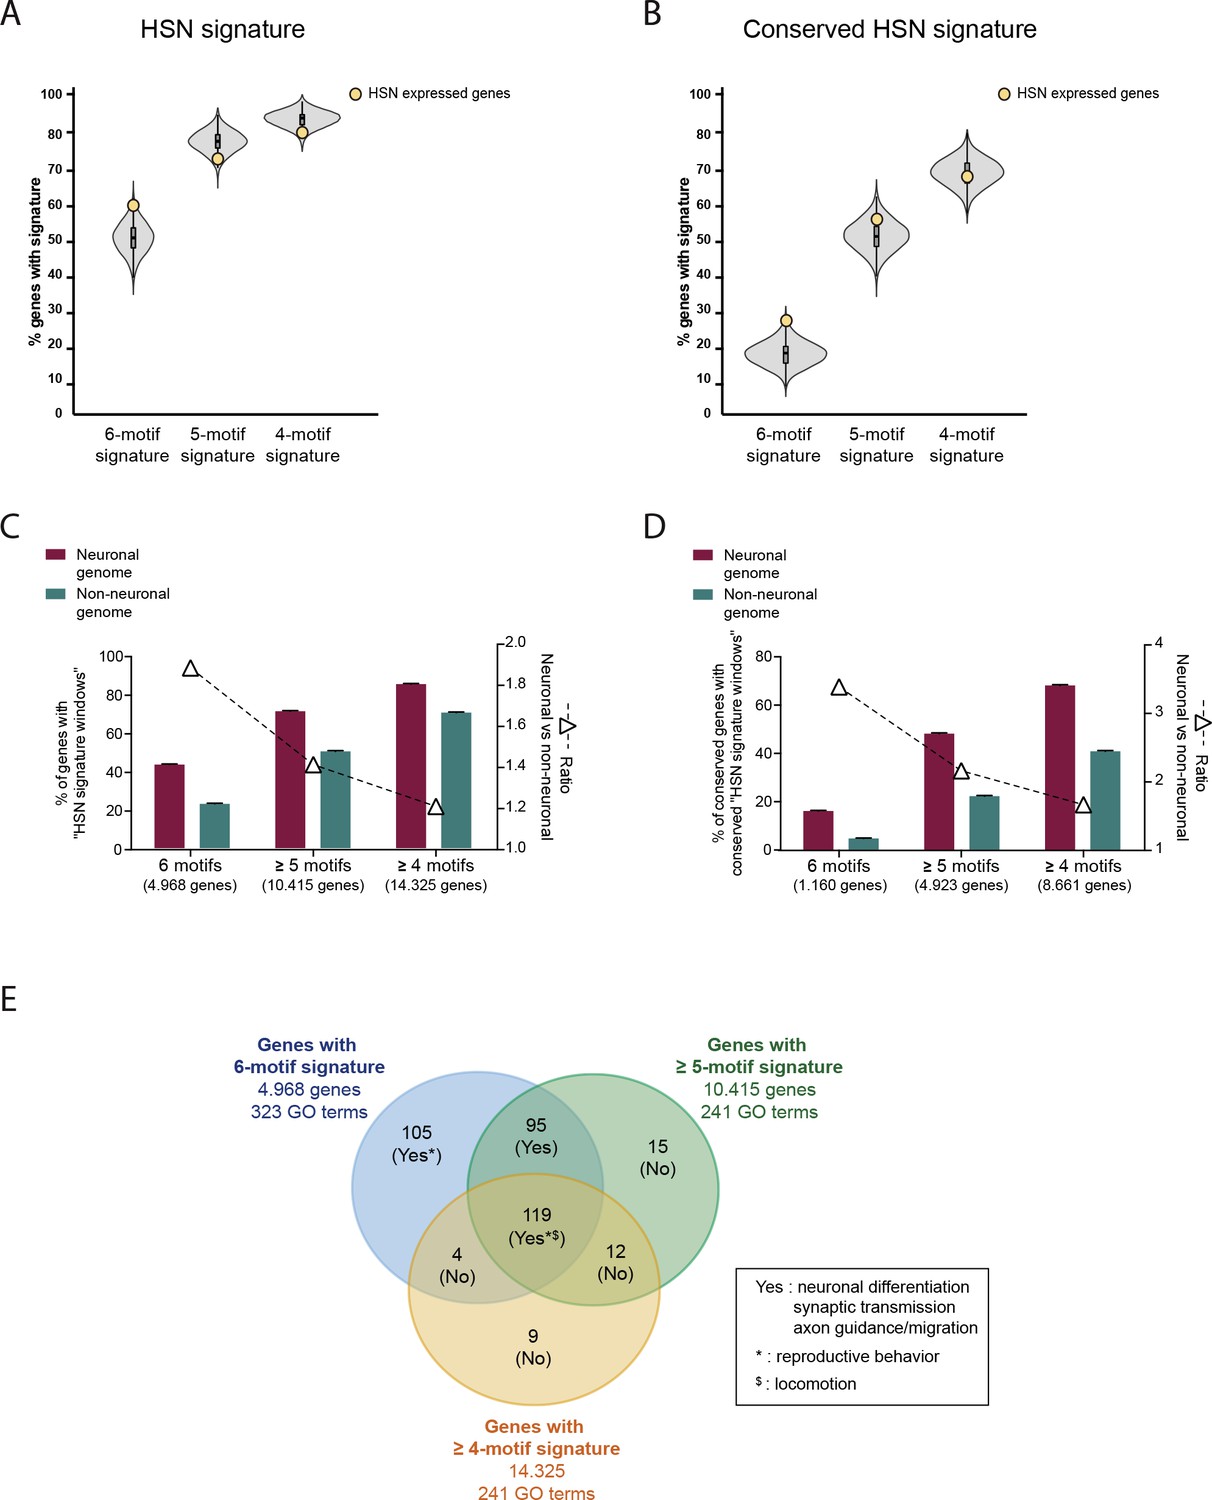
Analysis of the HSN regulatory signature including windows missing one or two TFBS motifs.
(A) HSN regulatory signature distribution in HSN expressed gene set (yellow dot) compared to 10,000 random sets of genes (grey violin plot). HSN signature windows with all six types of motifs (6-motif regulatory signature) are more prevalent in HSN expressed genes compared to random sets but this difference is not present when analyzing windows with only five types or four types of motifs (5-motif and 4-motif regulatory signature). (B) 5-motif and 4-motif regulatory signature is not preferentially found in HSN expressed genes even after filtering for conservation. (C) Genome distribution of 6-motif HSN regulatory signature windows compared to the signature distribution considering windows with five or more different types of motifs and windows with four or more types of motifs. Distribution of windows with six different motifs shows the highest enrichment in neuronal genes compared to the rest of the genome. (D) After filtering for conservation 6-motif windows still show the strongest bias towards neuronal genome. (E) Comparative GO term analysis of genes with 6-motif, >5-motif or >4-motif HSN regulatory signature. 6-motif signature distribution is associated with neuronal functions related to HSN while new GO terms identified by including >5-motif or >4-motif HSN windows are not related to neuronal functions.
Figure 7—figure supplement 3
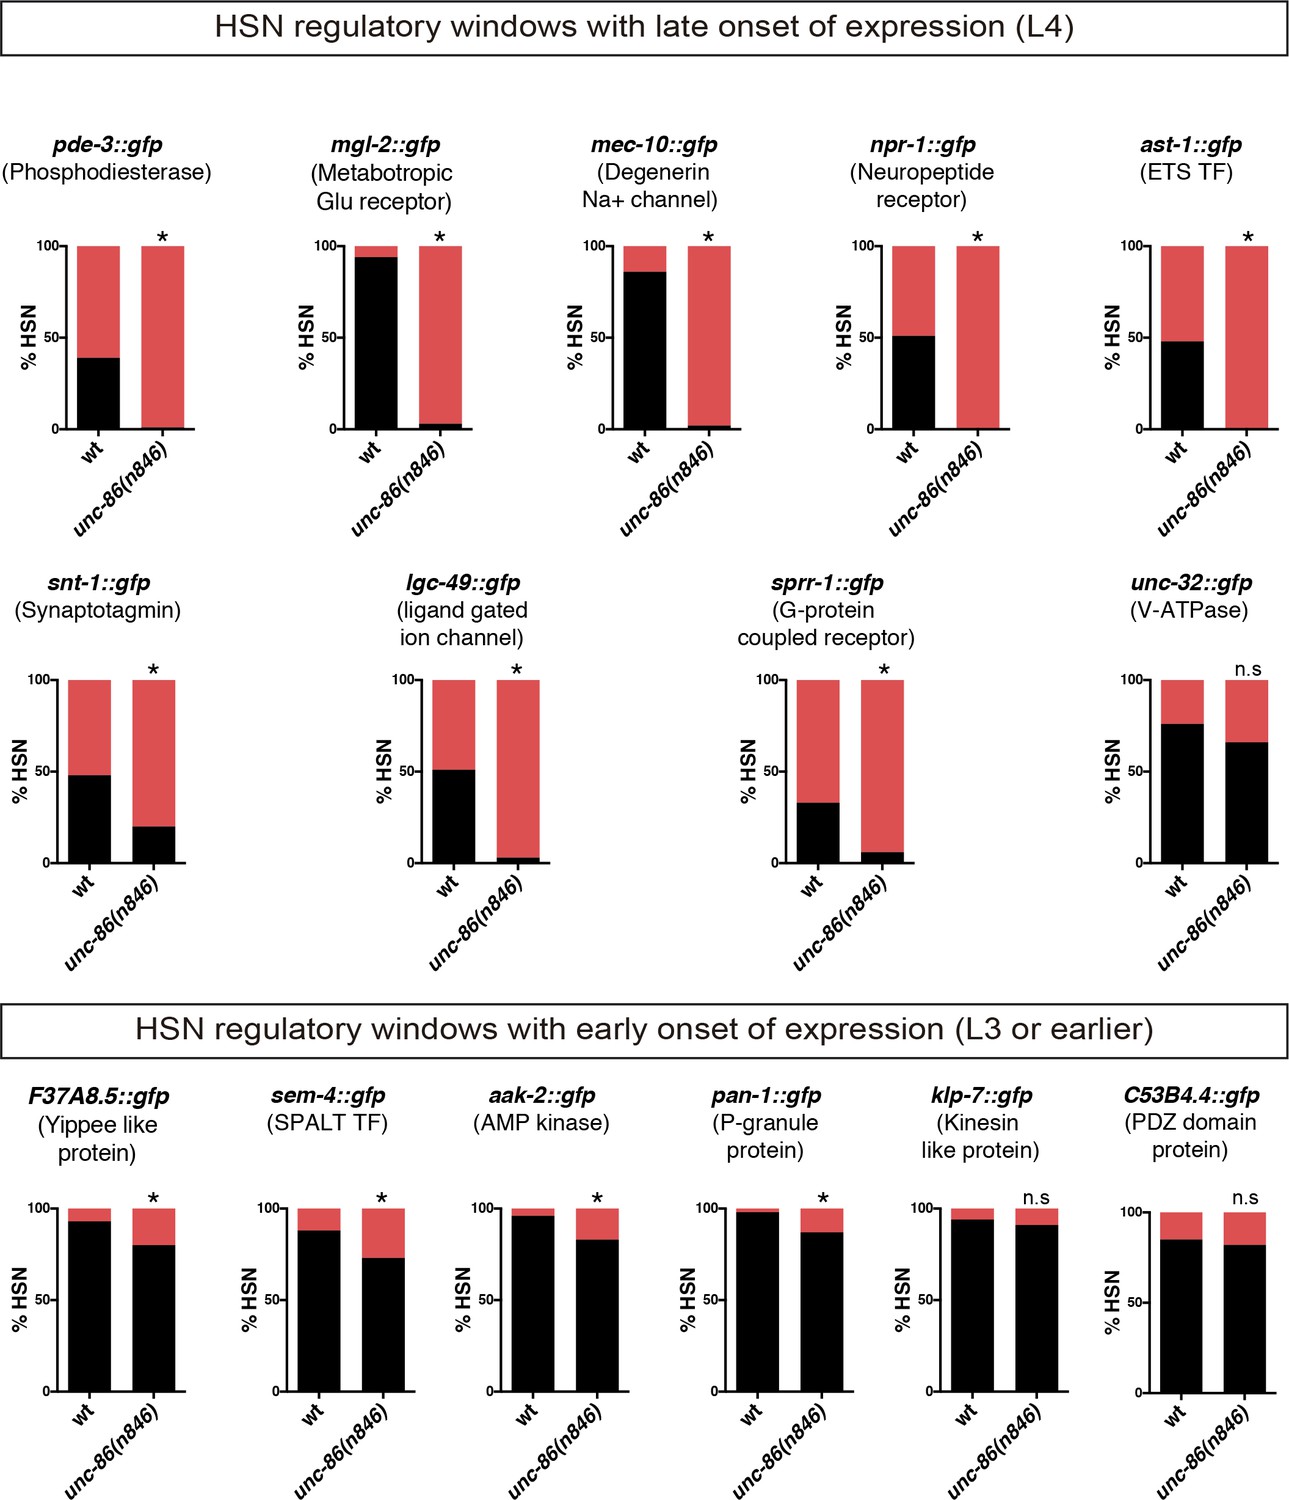
Expression of identified HSN regulatory windows depends on unc-86.
Expression of HSN regulatory window reporter constructs is affected in unc-86(n846) mutants. Reporter constructs with onset of expression at larval L4 are more dependent on unc-86 function than constructs already expressed at earlier stages. n > 100 cells per condition. Fisher's exact test, *: p-value<0.05.
Figure 8 with 1 supplement

Deep homology between HSN and mouse serotonergic raphe neurons.
(A) Micrograph of mouse embryonic day 11.5 hindbrain coronal section with DAPI staining. Square box indicates the region in A', B and C panels. VZ: ventricular zone, where progenitors are located. Scale bar: 100 μm. (B) BRN2 and 5HT co-staining. BRN2 is expressed in progenitors and differentiating serotonergic neurons. Arrowheads indicate double labeled cells. Scale bar: 20 μm. (C) SALL2 and 5HT co-staining. SALL2 is expressed in progenitors and differentiating serotonergic neurons. Arrowheads indicate double labeled cells. Scale bar: 20 μm. (D) Hierarchical clustering analysis of C. elegans neuron expression profiles with mouse serotonergic raphe neurons shows that HSN (in green) is closest to mouse serotonergic neurons (in blue). Other C. elegans serotonergic neuron classes (ADF and NSM in red) do not show a close relationship with mouse serotonergic raphe. R1D: Dorsal serotonergic neurons from rhombomere r1; R1M: Medial serotonergic neurons from rhombomere r1; R2: serotonergic neurons from rhombomere r2; R3: serotonergic neurons from rhombomere r3; R5: serotonergic neurons from rhombomere r5; R6: serotonergic neurons from rhombomere r6. See also Figure 8—figure supplement 1. (E) Micrographs showing tph-1::gfp expression in wild type animals, ast-1(ot417) mutants, and ast-1(ot417) mutants rescued with ast-1 cDNA or mouse Pet1 cDNA expressed under the bas-1 promoter whose expression in not affected in this mutant background. (F) Quantification of tph-1::gfp HSN expression rescue of different HSN TF collective mutants with worm and mouse ortholog cDNAs. n > 100 cells per condition. Fisher's exact test, *: p-value<0.05. ‘L’ indicates the transgenic line number.
-
Figure 8—source data 1
Scripts for C.elegans and mouse neuron comparison.
Related to Figure 8.
- https://doi.org/10.7554/eLife.32785.026
Figure 8—figure supplement 1
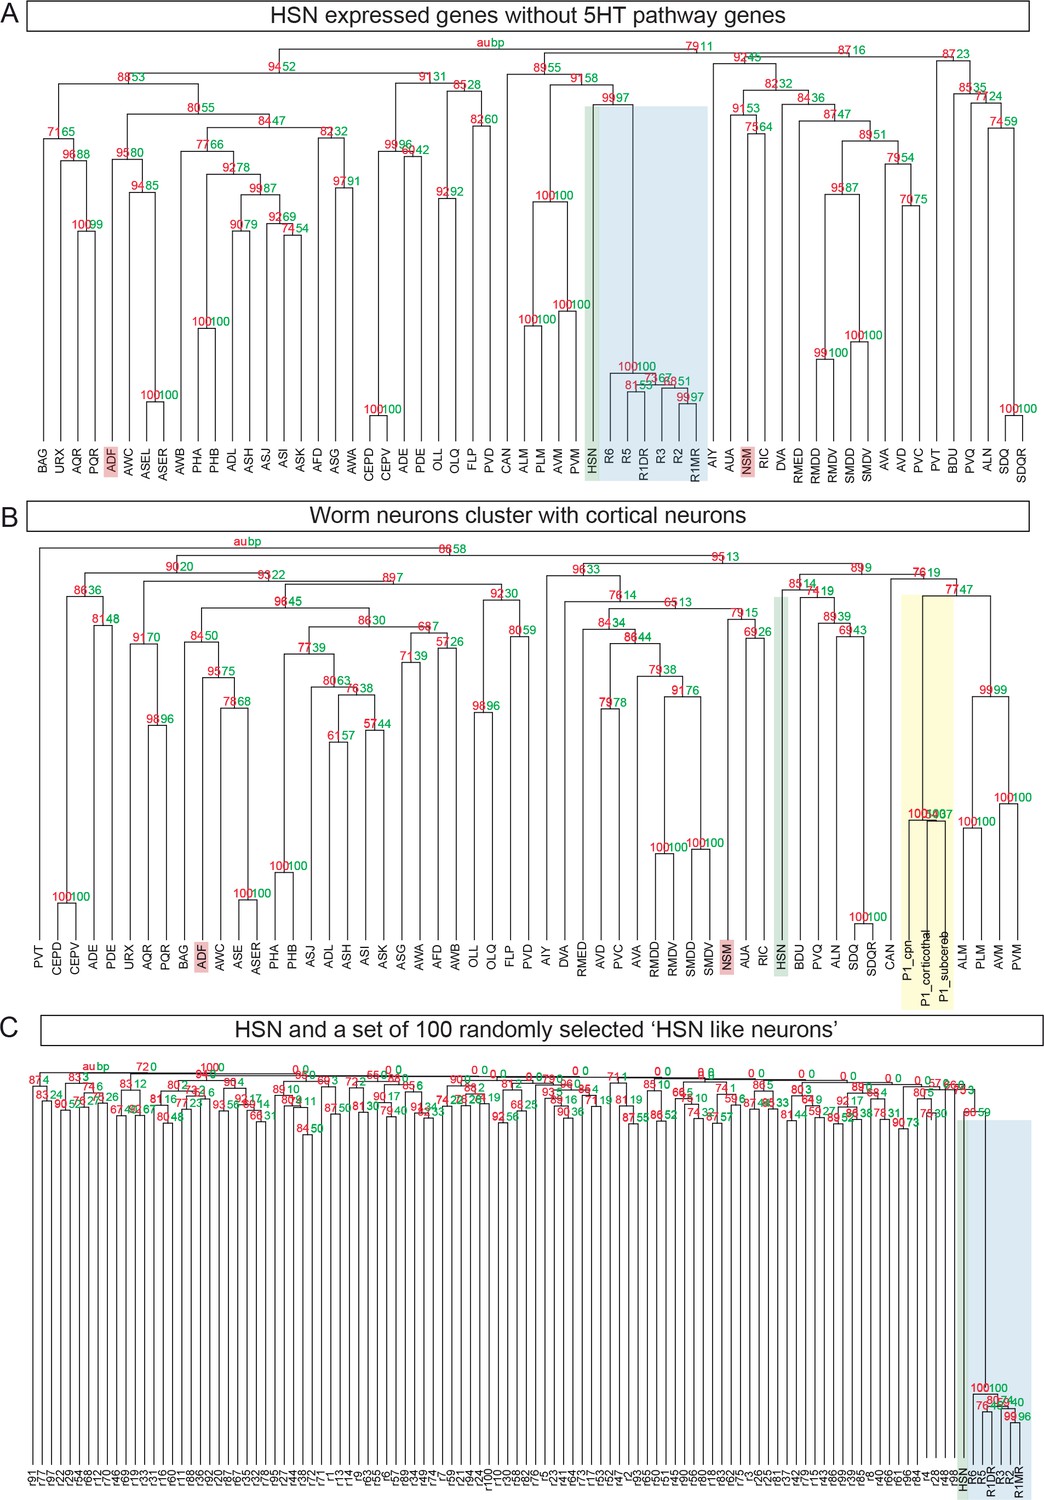
HSN neuron is the C. elegans neuron molecularly closest to mouse raphe serotonergic neurons.
(A) pvclust was performed after removing 5HT pathway genes (cat-1, tph-1, bas-1 and cat-4) from the HSN to show that proximity between HSN and mouse raphe is not only due to 5HT pathway genes. (B) Clustering of worm neurons and mouse non-serotonergic control regions [cortical neurons from (Molyneaux et al., 2015) show that HSN expression data cluster with raphe transcriptome is specific as it does not occur with other mouse transcriptomic data. P1_cpn: Postnatal day 1 cortical projection neurons; P1_corticothal: Postnatal day 1 cortical thalamic neurons; P1_subcereb: Postnatal day 1 cortical subcerebral neurons. (C) 100 simulated 'HSN-like' neurons were obtained by assigning to each one the four 5HT pathway genes (cat-1, tph-1, bas-1 and cat-4) and 92 additional genes at random. None of these random profiles shows close proximity to the Raphe mouse neurons.
Tables
Table 1
C. elegans HSN and mouse raphe serotonergic neuron homology
https://doi.org/10.7554/eLife.32785.027| C. elegans gene name | Description | Mammalian gene name |
|---|---|---|
| Serotonergic biosynthetic pathway | ||
| bas-1 a | Dopamine decarboxylase | Ddc |
| cat-1a | Vesicular monoamine transporter | Slc18a2 |
| cat-4 | GTP cyclohydrolase 1 | Gch1 |
| tph-1 a | Tryptophan hydroxylase | Tph2 |
| Axon guidance and Migration | ||
| ebax-1 a | Elongin-B/C E3 ligase | Zswim5/6/8 |
| egl-43 a | PR domain containing | Prdm16 |
| fmi-1 | Flamingo homolog | Celsr2/3, Fat1/3, Dchs1 |
| madd-2 a | Trim protein | Trim9/36/46, Fsd1/1 l, Mid2 |
| mau-2 a | Chromatid cohesion factor | Mau2 |
| mig-10 a | Protein with an RA-like, PH domains and proline-rich motif | Raph1, Grb10 |
| nck-1 | SH2/SH3 domain-containing protein | Nck1 |
| rig-6 a | neuronal IgCAM | Cntn1, 2, 3, 4, 5, 6 |
| tbb-4 a | Tubulin | Tubb2a/2b/4a/4b/5 |
| unc-40 a | Netrin receptor | Dcc, Neo1 |
| unc-51 a | Serine/threonine protein kinase | Ulk1/2 |
| unc-53 a | Neuron navigator | Nav1/2/3 |
| Neurotransmission/Synaptogenesis | ||
| abts-1 a | Anion/Bicarbonate Transporter family | Slc4a7/8/10 |
| clh-3 | Voltage sensitive cloride channel | Clcn2 |
| eat-16 | Regulator of G protein signaling | Rgs11/19 |
| gar-2 a | G-protein-coupled acetylcholine receptor | Hrh3 |
| ggr-2 a | GABA/Glycine Receptor | Glra1/2, Glrb |
| glr-5 a | Glu Receptor | Grid1/2, Grik1 |
| gsa-1 a | G protein, Subunit Alpha | Gnal, Gnas |
| ida-1 a | Protein tyrosine phosphatase-like receptor | Ptprn, Ptpm2 |
| irk-1 a | Inward Rectifying K (potassium) channel family | Kcnj3/5/6/9/11/16/ |
| kcc-2 a | K/Cl cotransporter | Slc12a5/6 |
| mpz-1 a | Multiple PDZ domain protein | Mpdz, Pdzd2, Inadl, Lnx1 |
| nhx-5 | Na/H exchanger | Slc9a6/7/9 |
| nid-1 a | Nidogen (basement membrane protein) | Lrp1/1b |
| nra-4 | Nicotinic Receptor Associated | Nomo1 |
| rsy-1 | Regulator of synapse formation | Pnisr |
| syg-1 a | Ig transmembrane protein | Kirrel, Kirrel3 |
| nlg-1 a | Neuroligin family | Nlg1/2/3 |
| unc-2 a | Calcium channel alpha subunit | Cacna1a/1b/1e |
| unc-77 | Voltage-insensitive cation leak channel | Nalcn |
| unc-103 a | K + channel | Kcnh2/7 |
| Transcriptional regulation | ||
| ceh-20 a | PBX TF | Pbx1/2/3 |
| egl-44 a | TEA domain TF | Tead1 |
| gei-8 | Nuclear receptor co-repressor | Ncor1 |
| hlh-3 a | bHLH TF | Ascl1 |
| ife-4 a | Initiation factor 4E | Eif4e2 |
| sem-4 a | Spalt TF | Sall2,Zfp236/Znf236 |
| Morphogenetic pathways | ||
| dsh-1 a | Homolog of disheveled | Dvl1/3 |
| plr-1 a | Ring finger protein | Rnf215 |
| prkl-1 a | Drosophila Prickle homolog | Prickle1/2 |
| sel-10 a | Suppressor/Enhancer of Lin-12(Notch) | Fbxw7 |
| Others | ||
| aak-2 a | AMP-activated protein kinases | Prkaa1/2 |
| ags-3 | G protein singalling modulator | Gpsm1 |
| aho-3 a | Hydrolase | Abhd17a/17b |
| ari-1 | Ubiquitin-protein transferase | Arih1 |
| arr-1 | G protein singaling adaptor | Arrb1/2 |
| arrd-17 a | Arrestin domain protein | Arrdc3 |
| baz-2 | Bromodomain adjacent to zinc finger domain | Baz2a/2b |
| elpc-1 | Elongator complex protein component | Ikbkap |
| elpc-3 | Elongator complex protein component | Elp3 |
| goa-1 a | G protein,O, Alpha subunit | Gnao1 |
| kin-20 | Protein kinase | Csnk1d/1e |
| puf-9 | Pumilio/FBF domain-containing | Pum1/2 |
| pxf-1 a | Rap guanine nucleotide exchange factor | Rapgef2/6 |
| rep-1 | Rab escort protein | Chm, Chml |
| ten-1 a | Type II transmembrane EGF-like repeats | Tenm1/3/4 |
| top-1 a a : gene with assigned HSN regulatory signature | Topoisomerase | Top1/1mt |
Key resources table
| Reagent type (species) or resource | Designation | Source or reference | Identifiers |
|---|---|---|---|
| Strain, strain background (Caenorhabditis elegans) | C. elegans: Strain N2 | Caenorhabditis Genetics Center | WormBase: N2 |
| Strain, strain background (Caenorhabditis elegans) | Strain names and genotypes | Supplementary file 3 | |
| Strain, strain background (Mus musculus) | Mouse: C57Bl/6JRccHsd strain | ENVIGO, Harlan. (Huntingdon, Cambridgeshire, UK) | C57Bl/6JRccHsd |
| Strain, strain background (Escherichia coli) | Strain OP50 | Caenorhabditis Genetics Center | OP50 |
| Strain, strain background (Escherichia coli) | Rosetta 2(DE3) Singles Competent Cells: BL21 derivatives | Novagen, Merck Group. (Darmstadt, Germany) | Cat#71400 |
| Strain, strain background (Escherichia coli) | Strain: HT115(DE3) | Caenorhabditis Genetics Center | HT115 |
| Cell line (human) | Human: HEK293T | Laboratory of Oliver Hobert | ATCC: CRL-3216 |
| Transfected construct (C.elegans) | Plasmid: pCDNA3-egl-18 | This paper | N/A |
| Antibody | Mouse anti-GFP IgG1K | Sigma Aldrich, Merck Group. (Darmstadt, Germany) | Cat#11814460001 |
| Antibody | Anti-6X His tag antibody [HIS.H8] | Abcam (Cambridge, UK) | Cat#ab18184 |
| Antibody | Rabbit anti-5HT | Sigma Aldrich | S5545 |
| Antibody | Goat anti-5HT | Abcam | Ab66047 |
| Antibody | Rabbit anti-Sall2 | Sigma Aldrich | sc-6029 |
| Antibody | Alexa 555-conjugated donkey anti-rabbit | Molecular Probes, Invitrogen (Eugene, OR) | A-31572 |
| Antibody | Alexa 555-conjugated donkey anti-goat | Molecular Probes | A-21432 |
| Antibody | Alexa 488-conjugated donkey anti-rabbit | Molecular Probes | A-21206 |
| Antibody | Alexa 488-conjugated donkey anti-goat | Molecular Probes | A-11055 |
| Recombinant DNA reagent | Plasmid: pPD95.75 | Dr Oliver Hobert Laboratory | Addgene Plasmid #1494 |
| Recombinant DNA reagent | Plasmid: pRF4 (rol-6 (su1006)) | (Mello et al., 1991) | N/A |
| Recombinant DNA reagent | Plasmid: ttx-3prom::mcherry | (Bertrand and Hobert, 2009) | N/A |
| Recombinant DNA reagent | Plasmid: pBluescript | Dr Oliver Hobert Laboratory | N/A |
| Recombinant DNA reagent | Plasmid pJJR82 | Dr Mike Boxem Laboratory | Addgene #75027 |
| Recombinant DNA reagent | Plasmid pDD162 | Dr Mike Boxem Laboratory | Addgene #4754 |
| Recombinant DNA reagent | Plasmid pDD268 | (Dickinson et al., 2015) | N/A |
| Recombinant DNA reagent | Plasmid pJW1219 | (Ward, 2015) | Addgene # #61250 |
| Recombinant DNA reagent | Plasmid pCFJ90 | Dr Mike Boxem Laboratory | Addgene #19328 |
| Recombinant DNA reagent | Plasmid pPD129.36 (L4440) | Dr Andrew Fire Laboratory | Addgene #1654 |
| Recombinant DNA reagent | Plasmid: pET-21b-ast-1 | This paper | N/A |
| Recombinant DNA reagent | Plasmid: pET-21b-unc-86 | (Zhang et al., 2014) | N/A |
| Recombinant DNA reagent | Plasmid: HSNearlyprom::ast-1 | This paper | N/A |
| Recombinant DNA reagent | Plasmid: HSNearlyprom::hlh-3 | This paper | N/A |
| Recombinant DNA reagent | Plasmid: HSNearlyprom::ast-1, HSNearlyprom::hlh-3 | This paper | N/A |
| Recombinant DNA reagent | Plasmid: bas-1prom::ast-1 | This paper | N/A |
| Recombinant DNA reagent | Plasmid: bas-1prom::Pet1 | This paper | N/A |
| Recombinant DNA reagent | Plasmid: cat-4prom::hlh-3 | This paper | N/A |
| Recombinant DNA reagent | Plasmid: cat-4prom::Ascl-1 | This paper | N/A |
| Recombinant DNA reagent | Plasmid: cat-4prom::egl-46 | This paper | N/A |
| Recombinant DNA reagent | Plasmid: cat-4prom::Insm1 | This paper | N/A |
| Recombinant DNA reagent | Plasmid: cat-4prom::Gata2 | This paper | N/A |
| Recombinant DNA reagent | Plasmid: kal-1prom::Sall2 | This paper | N/A |
| Sequence-based reagent | oligonucleotides | Supplementary file 4 | |
| Commercial assay or kit | HisTrap HP Column | GE Healthcare Life Sciences (Marlborough, MA) | Cat#17-5248-01 |
| Commercial assay or kit | QuikChange XL Site-Directed Mutagenesis Kit | Agilent (Santa Clara, CA) | Cat# 200516 |
| Chemical compound, drug | EasyTides Adenosine 5'-triphosphate (ATP [γ−32P]) | Perkin Elmer (Waltham, MA) | Cat#NEG502A250UC |
| Chemical compound, drug | Power Broth Medium | Molecular Dimensions (Maumee, OA) | Cat#MD12-106-1 |
| Chemical compound, drug | Lipofectamine 2000 | Invitrogen (Carlsbad, CA) | Cat#11668027 |
| Chemical compound, drug | Isopropyl-β-D-thiogalactopyranoside (IPTG) | Acros Organics, ThermoFisher Scientific (Waltman, MA) | Cat#BP1755-100 |
| Chemical compound, drug | Collagenase type IV | Sigma Aldrich | C-5138 |
| Chemical compound, drug | FluorSaveReagent | Merck Millipore (Darmstadt, Germany) | 345789–20 ML |
| Software, algorithm | Gorilla | (Eden et al., 2009) | http://cbl-gorilla.cs.technion.ac.il |
| Software, algorithm | R | (Team, 2016) | https://www.r-project.org/ |
| Software, algorithm | Bioconductor | (Huber et al., 2015) | https://www.bioconductor.org/ |
| Software, algorithm | pvclust (R package) | (Suzuki and Shimodaira, 2006) | www.sigmath.es.osaka-u.ac.jp/shimo-lab/prog/pvclust |
Additional files
-
Source data 1
Raw scoring data and statistical analysis.
- https://doi.org/10.7554/eLife.32785.028
-
Supplementary file 1
Phenotypic characterization of additional alleles of the HSN TF combination.
Related to Figure 1.
- https://doi.org/10.7554/eLife.32785.029
-
Supplementary file 2
HSN expressed, neuronal genome and non-neuronal genome gene lists.
Related to Figure 7.
- https://doi.org/10.7554/eLife.32785.030
-
Supplementary file 3
Strains.
Related to Materials and methods.
- https://doi.org/10.7554/eLife.32785.031
-
Supplementary file 4
Primers.
Related to Materials and methods.
- https://doi.org/10.7554/eLife.32785.032
-
Transparent reporting form
- https://doi.org/10.7554/eLife.32785.033
Download links
A two-part list of links to download the article, or parts of the article, in various formats.
Downloads (link to download the article as PDF)
Open citations (links to open the citations from this article in various online reference manager services)
Cite this article (links to download the citations from this article in formats compatible with various reference manager tools)
A transcription factor collective defines the HSN serotonergic neuron regulatory landscape
eLife 7:e32785.
https://doi.org/10.7554/eLife.32785


