Tumor-derived CSF-1 induces the NKG2D ligand RAE-1δ on tumor-infiltrating macrophages
- University of California, Berkeley, United States
Figures
Figure 1 with 3 supplements
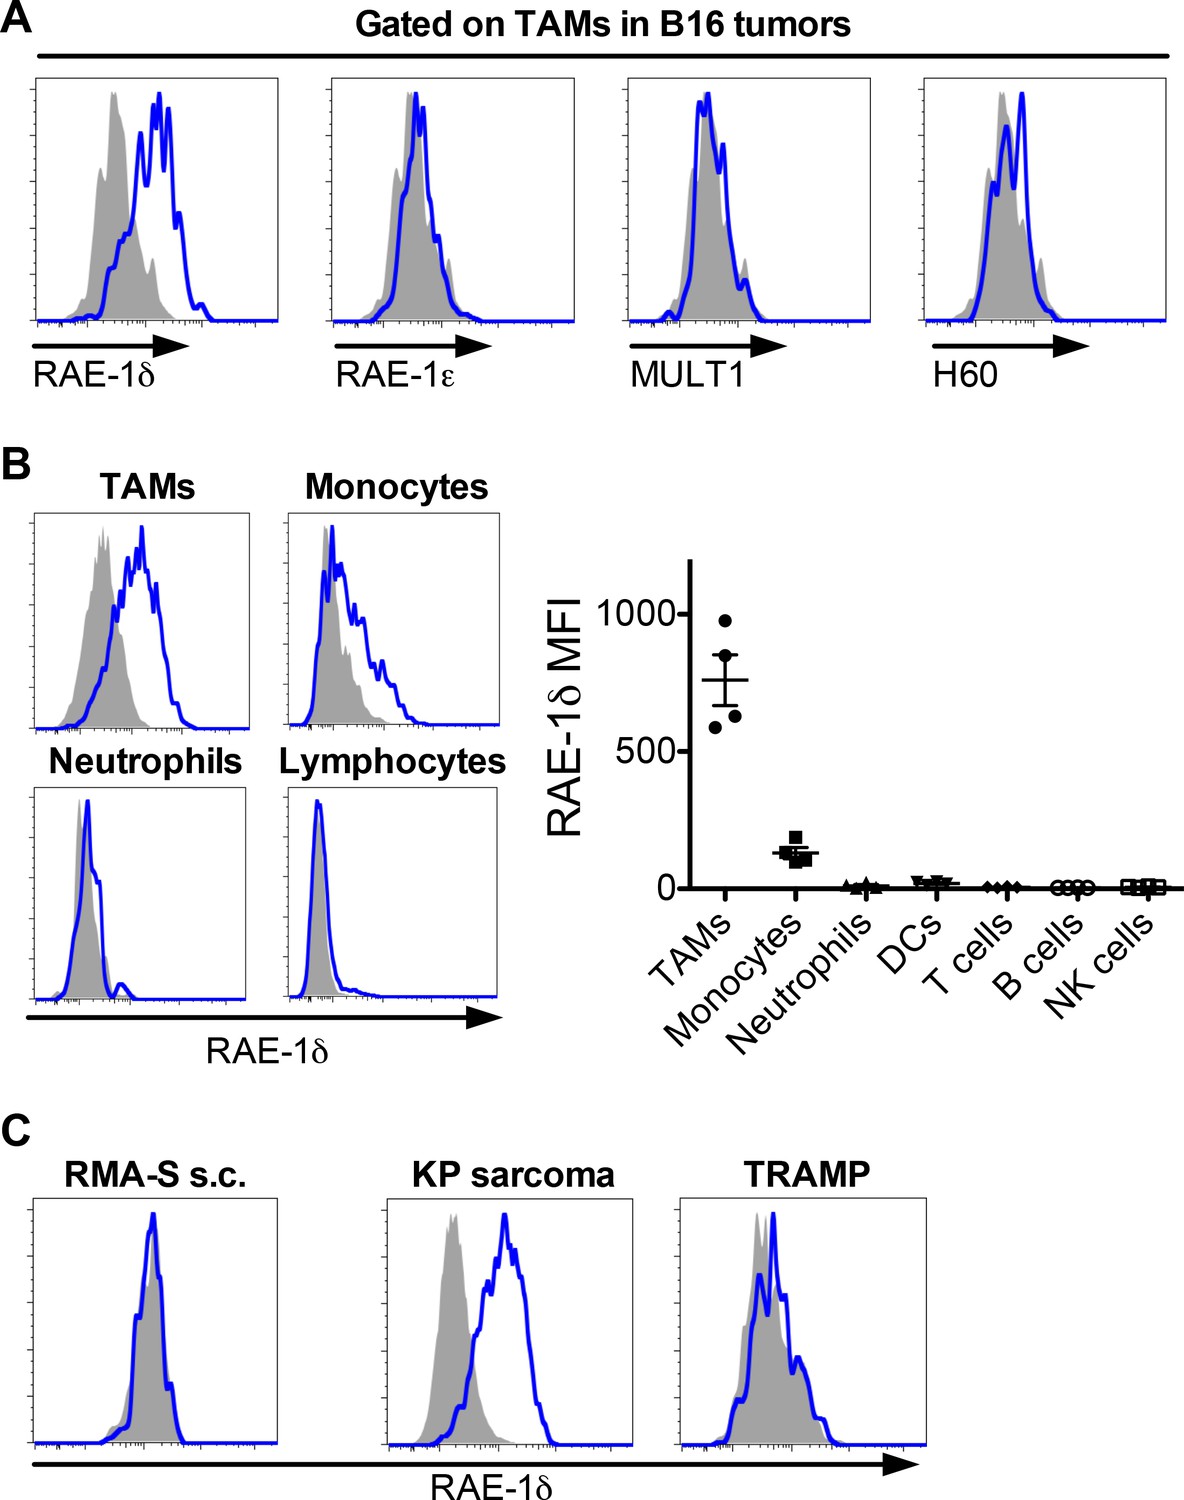
RAE-1δ is induced on tumor-associated macrophages in subcutaneously transferred and spontaneous tumors.
(A) Established B16 S.C. tumors were dissociated and analyzed for NKG2D ligand expression on tumor-associated macrophages. (B) RAE-1δ expression (left) and MFI quantification (right) on the indicated cell types in B16 tumors. (C) RAE-1δ expression on TAMs in spontaneous KP sarcoma, but not in spontaneous TRAMP prostate adenocarcinoma or transferred RMA-S lymphoma. Data are representative of >3 independent experiments.
Figure 1—figure supplement 1
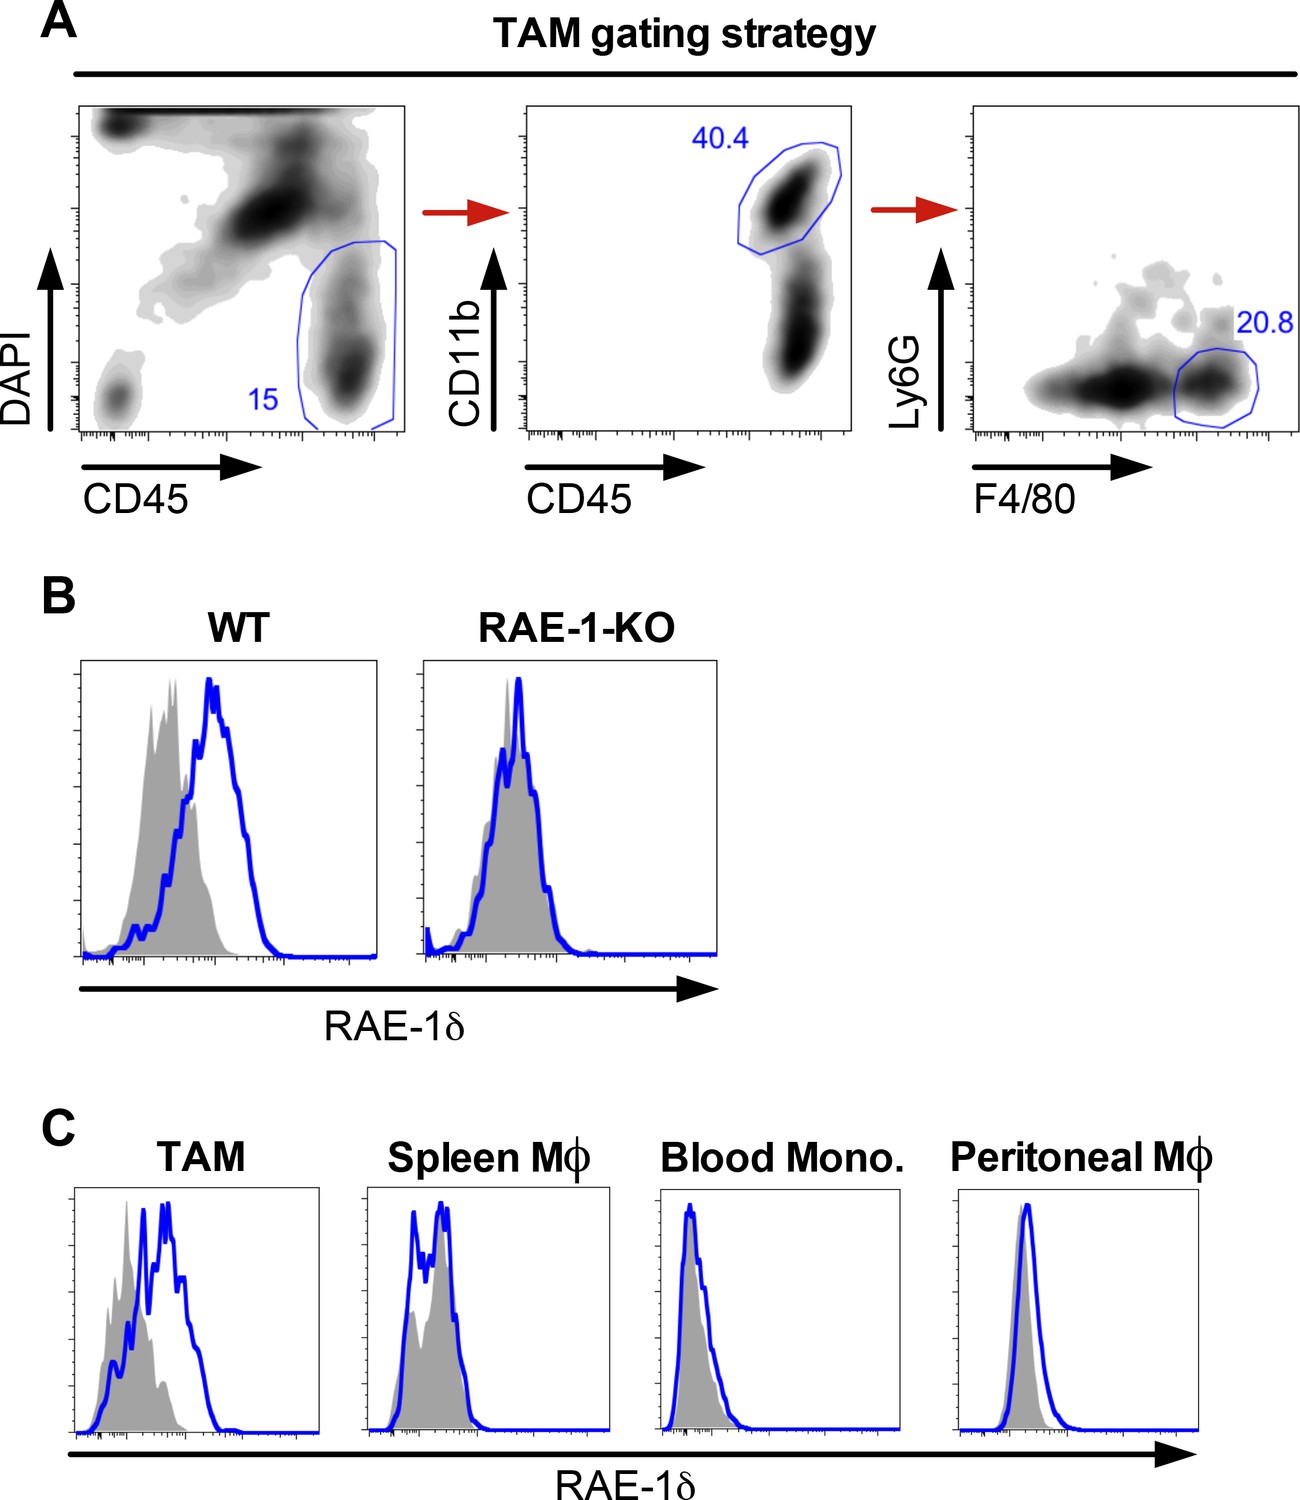
Gating strategy and RAE1δ expression on tumor-associated macrophages and monocytes in mice with B16 tumors.
(A) Gating strategy to identify tumor-associated macrophages in B16 tumors. (B) Expression of RAE-1δ on TAMs in B16 S.C. tumors in WT and RAE-1-KO mice. (C) RAE-1δ expression on TAMs, splenic macrophages, blood monocytes, or peritoneal macrophages in WT mice with established B16 S.C. tumors. Data are representative of >3 independent experiments.
Figure 1—figure supplement 2
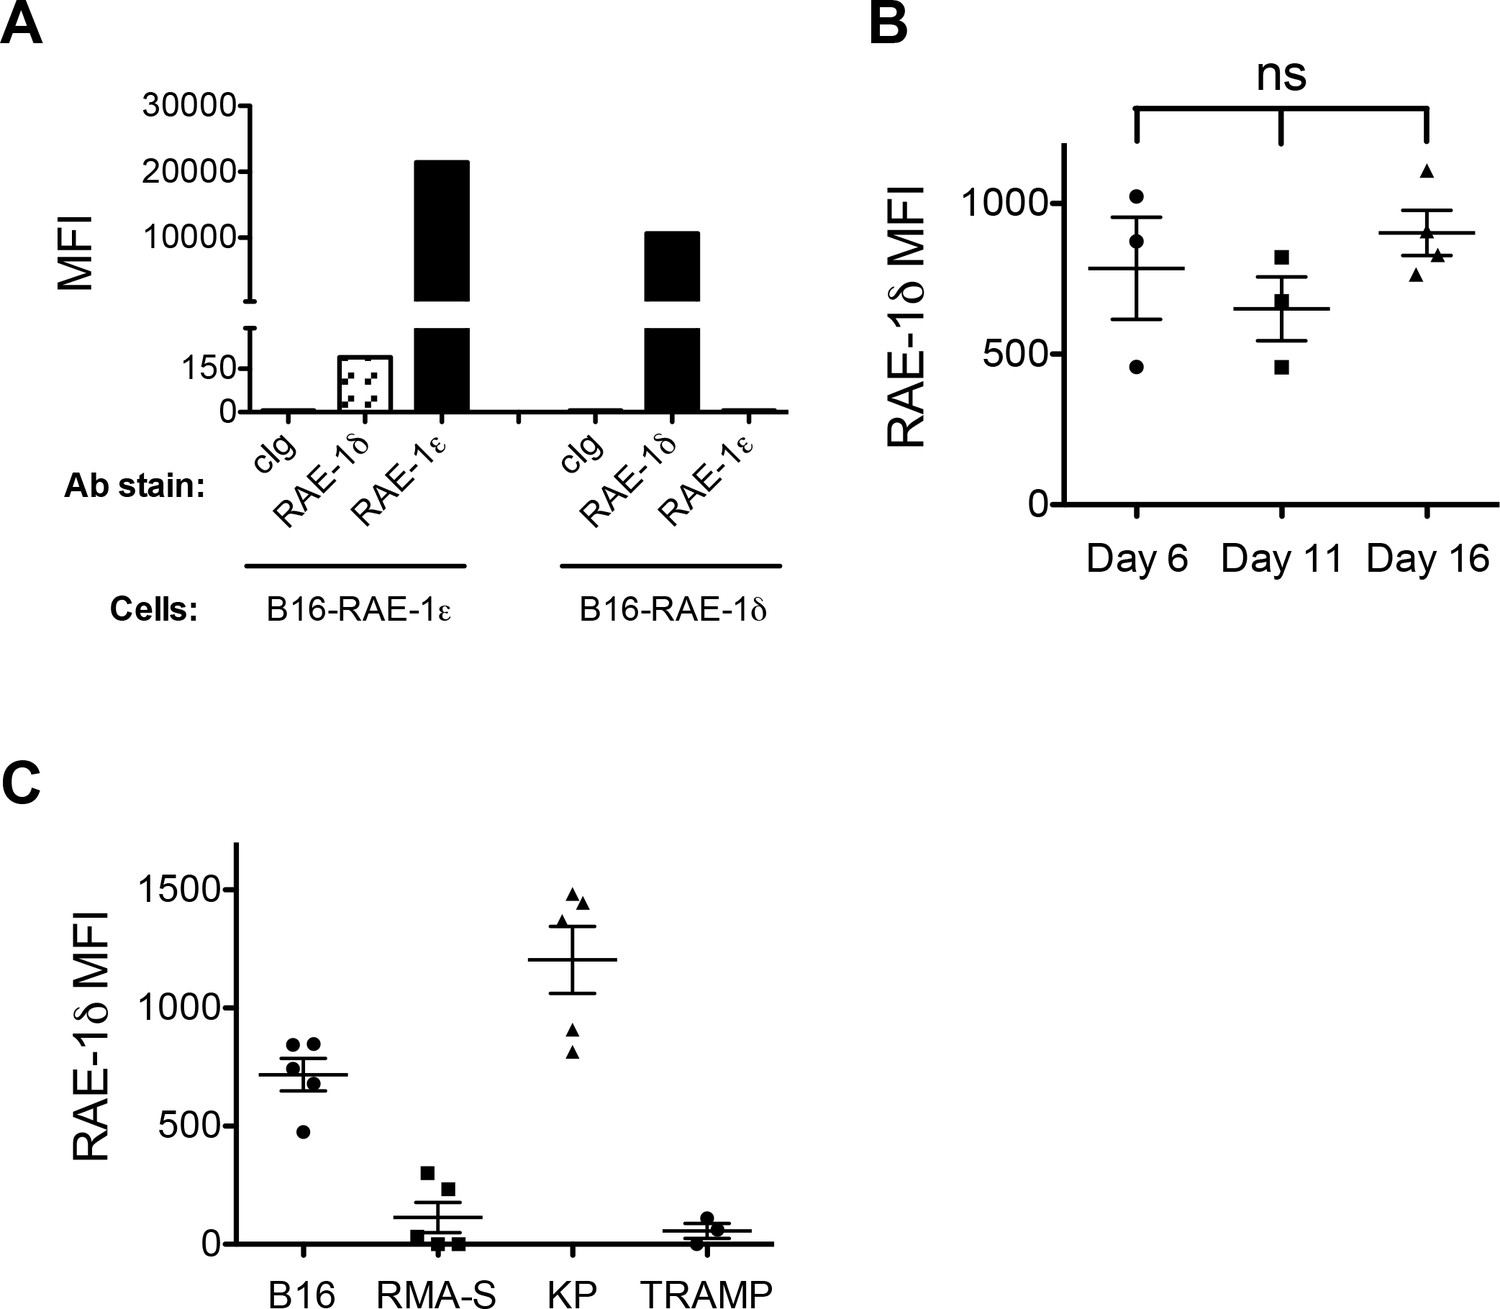
RAE-1 antibody validation and RAE-1δ staining on TAMs in different tumors.
(A) B16 cells transduced to stably express RAE-1δ or RAE-1ε were stained with biotinylated antibodies against RAE-1δ or RAE-1ε, followed by fluorophore-conjugated streptavidin. (B) Expression of RAE-1δ on TAMs in B16 S.C. tumors in WT mice at the indicated time after injection of 1 × 10⁶ tumor cells. (C) Expression of RAE-1δ on TAMs in S.C. B16 and RMA-S tumors and autochthonous KP and TRAMP tumors. Data are compiled from several independent experiments.
Figure 1—figure supplement 3
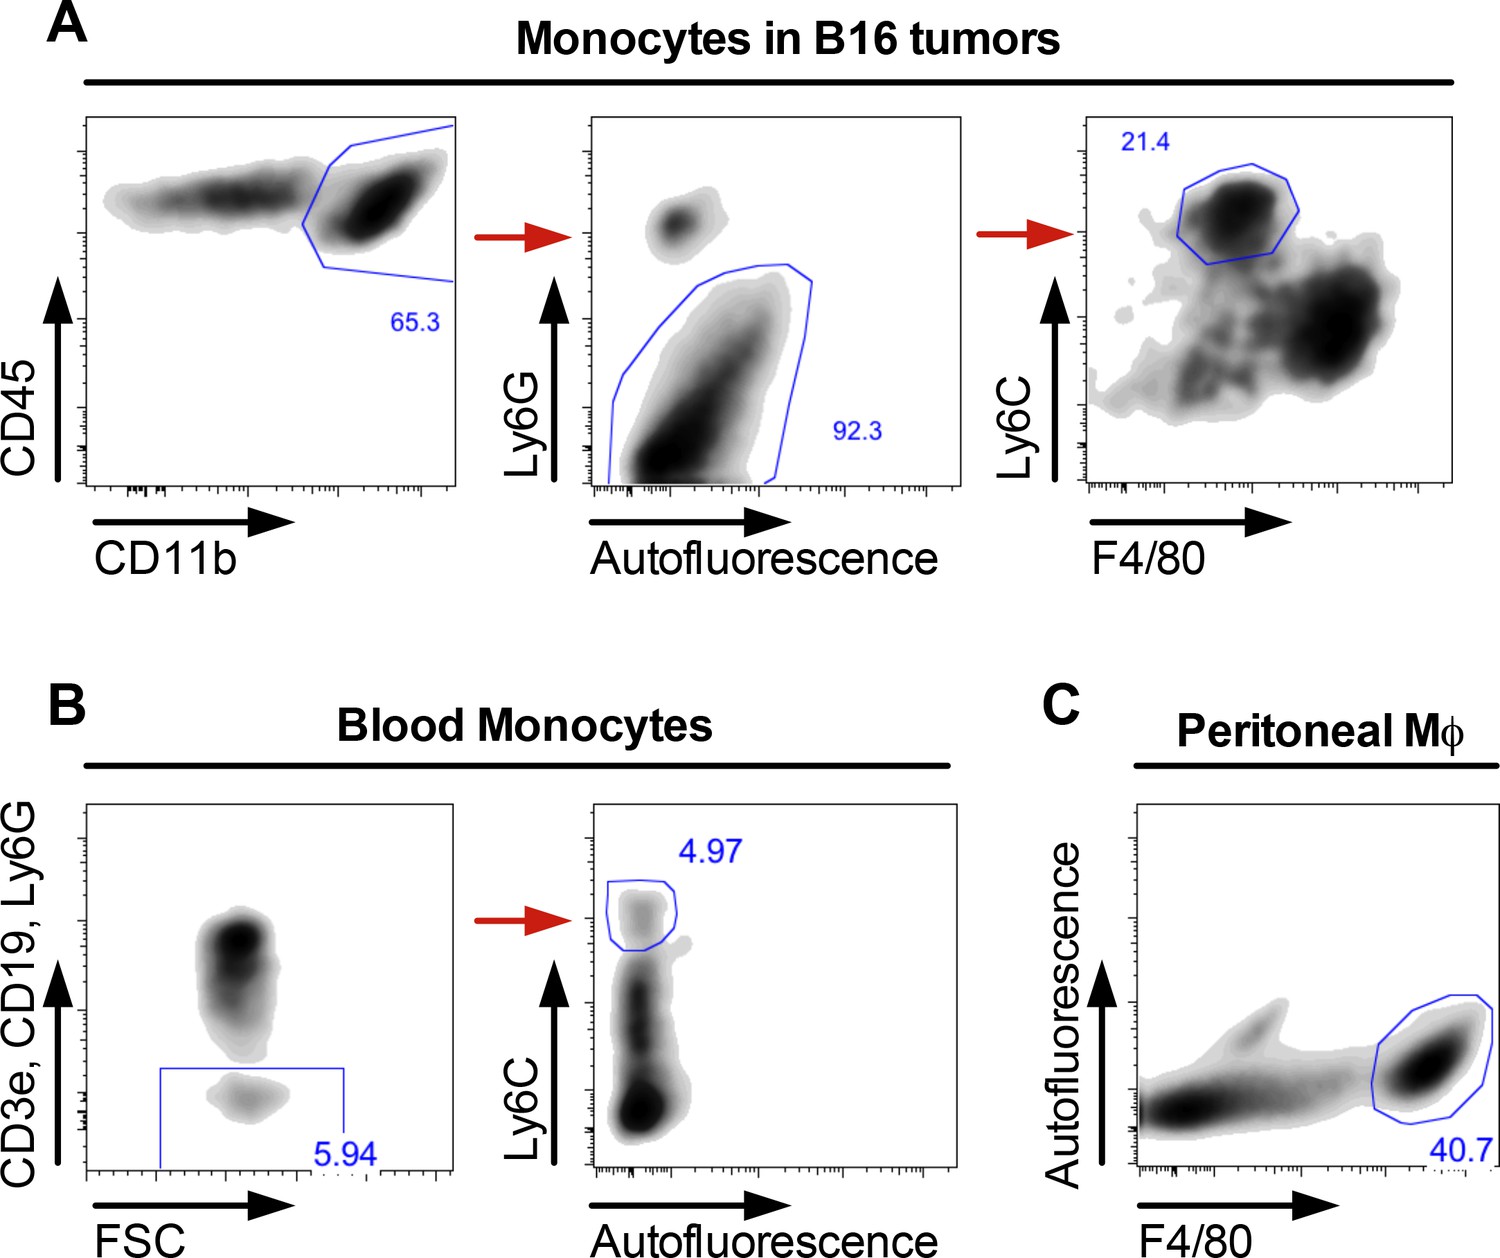
Gating strategies for blood and tumor-associated monocytes and peritoneal macrophages.
Gating strategies for (A) monocytes in B16 tumors, (B) blood monocytes, and (C) peritoneal macrophages.
Figure 2 with 1 supplement
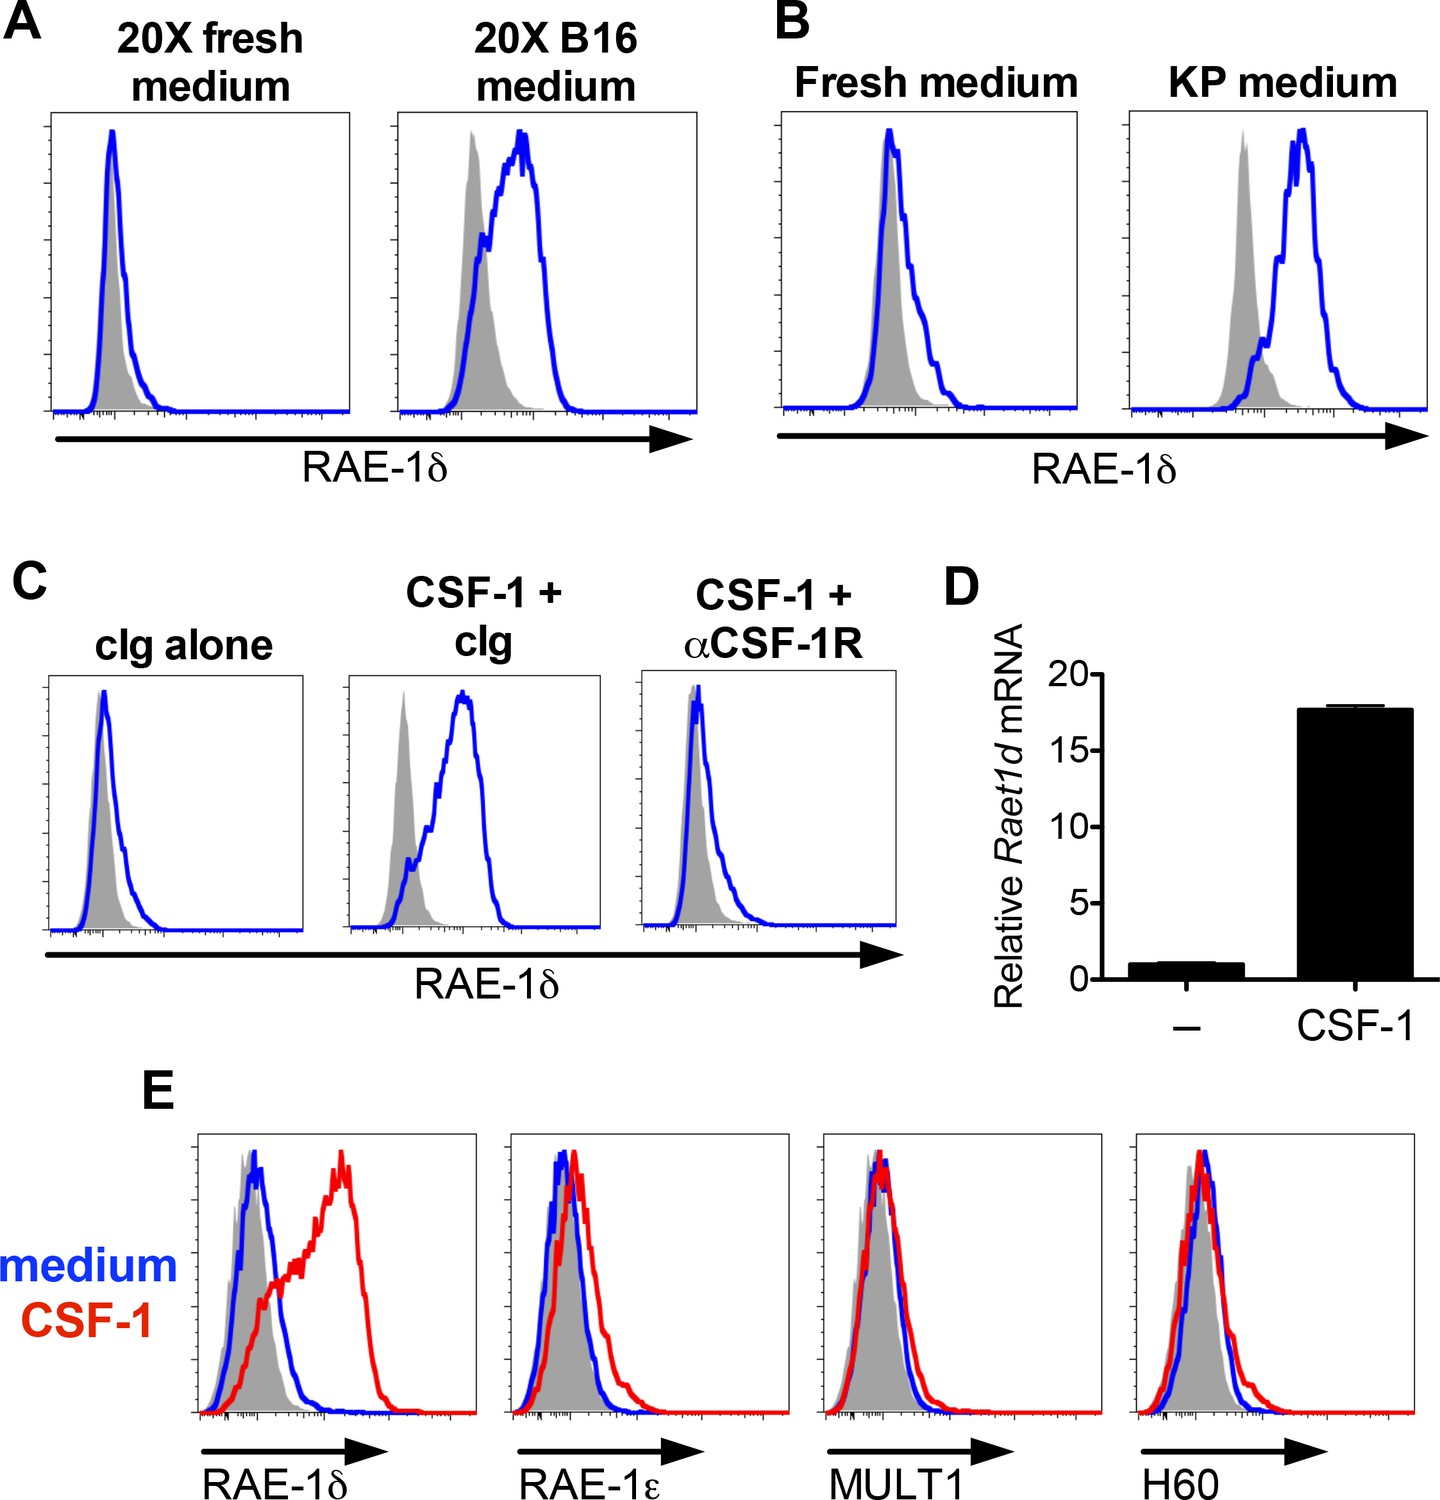
B16 and KP cell line conditioned medium and CSF-1 induces RAE-1δ on macrophages.
(A) Peritoneal wash cells were cultured with a 1:1 mixture of fresh medium plus 20X concentrated fresh medium or 20X concentrated B16 cell culture supernatants, and macrophage RAE-1δ was analyzed by flow cytometry 48 hr later. (B) Peritoneal wash cells were stimulated 48 hr ex vivo with a 1:1 mixture of fresh medium supplemented with fresh medium or conditioned medium from cultures of a KP sarcoma cell line generated from a primary KP sarcoma, and macrophage RAE-1δ was analyzed 48 hr later by flow cytometry. (C) Peritoneal wash cells were cultured with or without 10 ng/ml CSF-1, with the addition of control Ig or CSF-1R antibody (1 μg/ml), and macrophage RAE-1δ was analyzed 48 hr later by flow cytometry. (D) Peritoneal macrophage Raet1d mRNA 48 hr after stimulation with or without the addition of CSF-1 (10 ng/ml). (E) Peritoneal macrophage expression of the indicated NKG2D ligands 48 hr after stimulation with CSF-1 or control medium. Data are representative of >3 independent experiments.
Figure 2—figure supplement 1
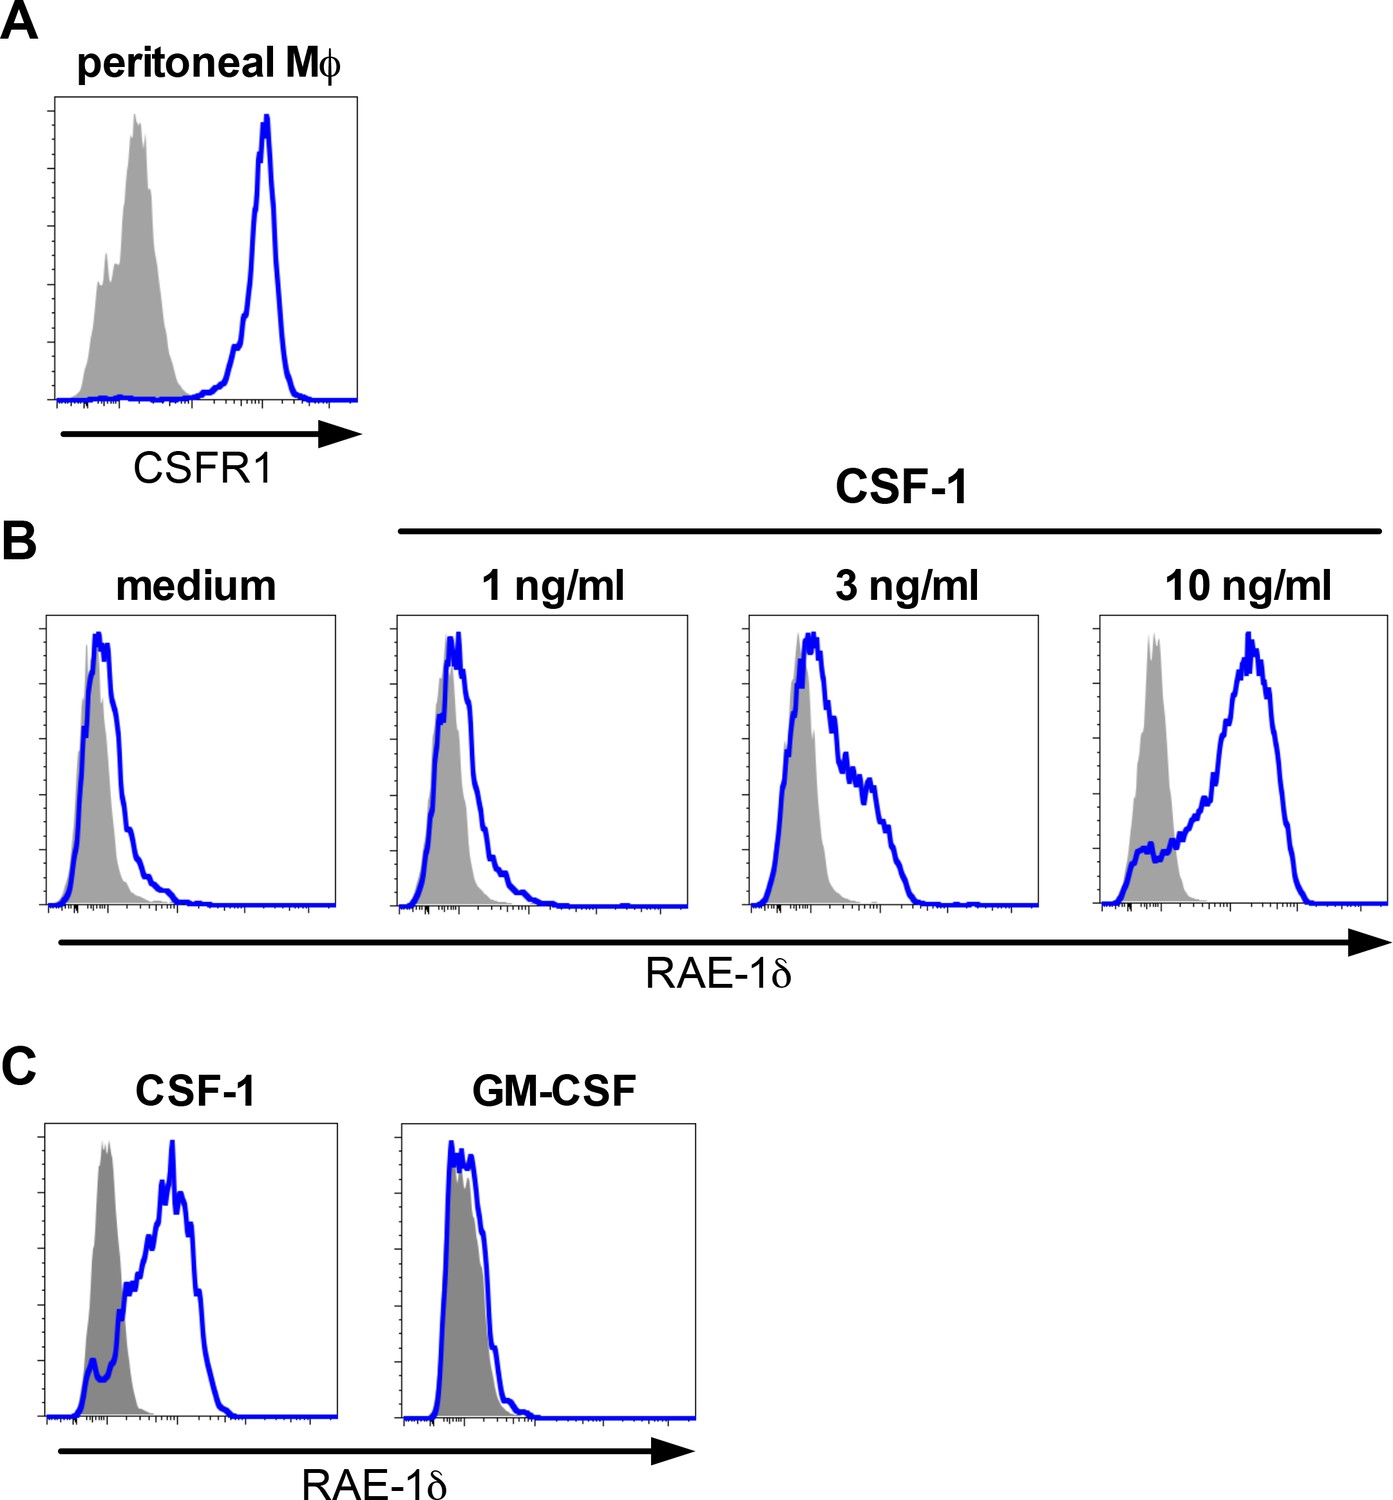
Peritoneal macrophage CSFR1 expression and dose-dependent RAE-1δ induction by CSF-1, and bone marrow macrophage stimulation with CSF-1 or GM-CSF.
(A) CSF-R1 expression on peritoneal macrophages ex vivo. (B) RAE-1δ expression on peritoneal macrophages cultured 48 hr with the indicated concentration of CSF-1. (C) RAE-1δ expression on bone-marrow-derived-macrophages generated using 10 ng/ml CSF-1 or GMCSF. Data are representative of 2–3 independent experiments.
Figure 3 with 1 supplement
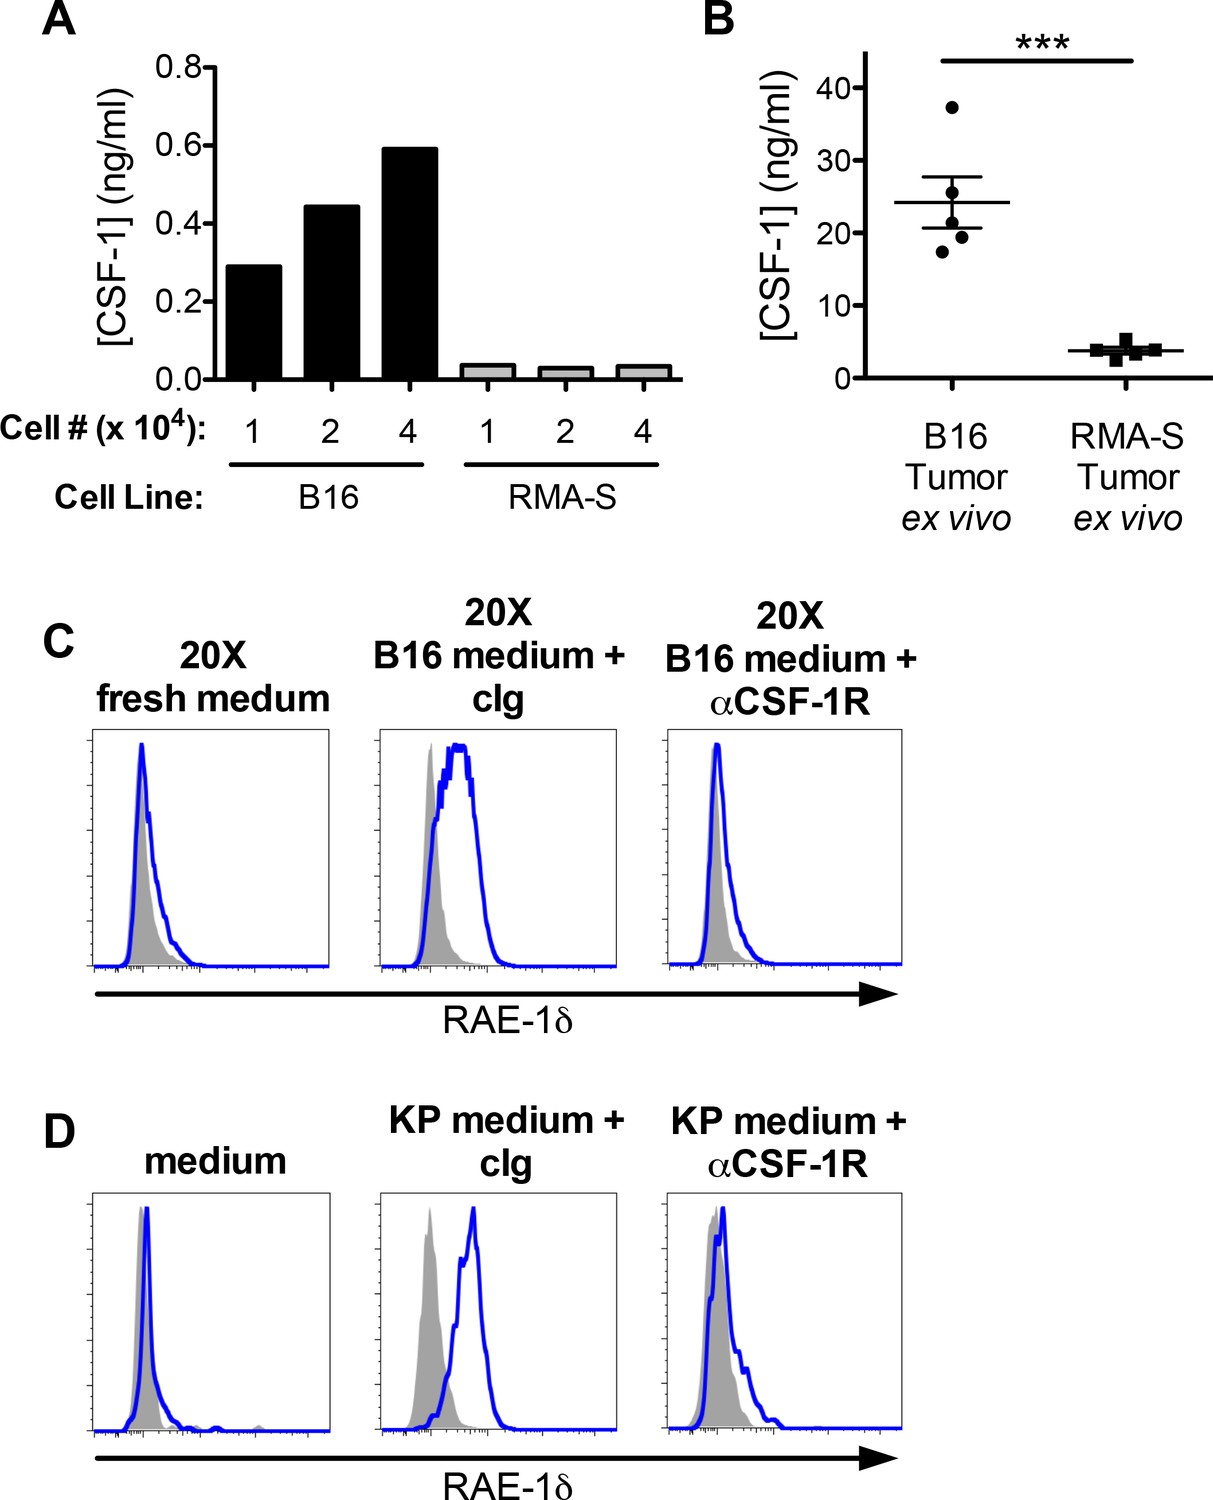
CSF-1 is necessary for macrophage RAE-1δ induction by tumor conditioned media.
(A) The indicated numbers of B16 or RMA-S cells were seeded in 12-well plates, and CSF-1 levels in the supernatants were measured by ELISA 48 hr later. (B) Established B16 or RMA-S tumors were dissociated, and CSF-1 levels in dissociation supernatants were measured by ELISA; intra-tumoral concentrations were calculated using tumor volume measurements (total ng of CSF-1 divided by the tumor volume at time of harvest). (C) Peritoneal macrophage RAE-1δ expression 48 hr after culture with concentrated fresh medium, concentrated B16 conditioned medium plus control Ig (1 ug/ml), or concentrated B16 conditioned medium plus anti-CSF-1R (1 ug/ml). (D) Peritoneal macrophage RAE-1δ 48 hr after culture with fresh medium, KP conditioned medium plus control Ig, or KP conditioned medium plus anti-CSF-1R (1 ug/ml). Data are representative of >3 independent experiments.
Figure 3—figure supplement 1
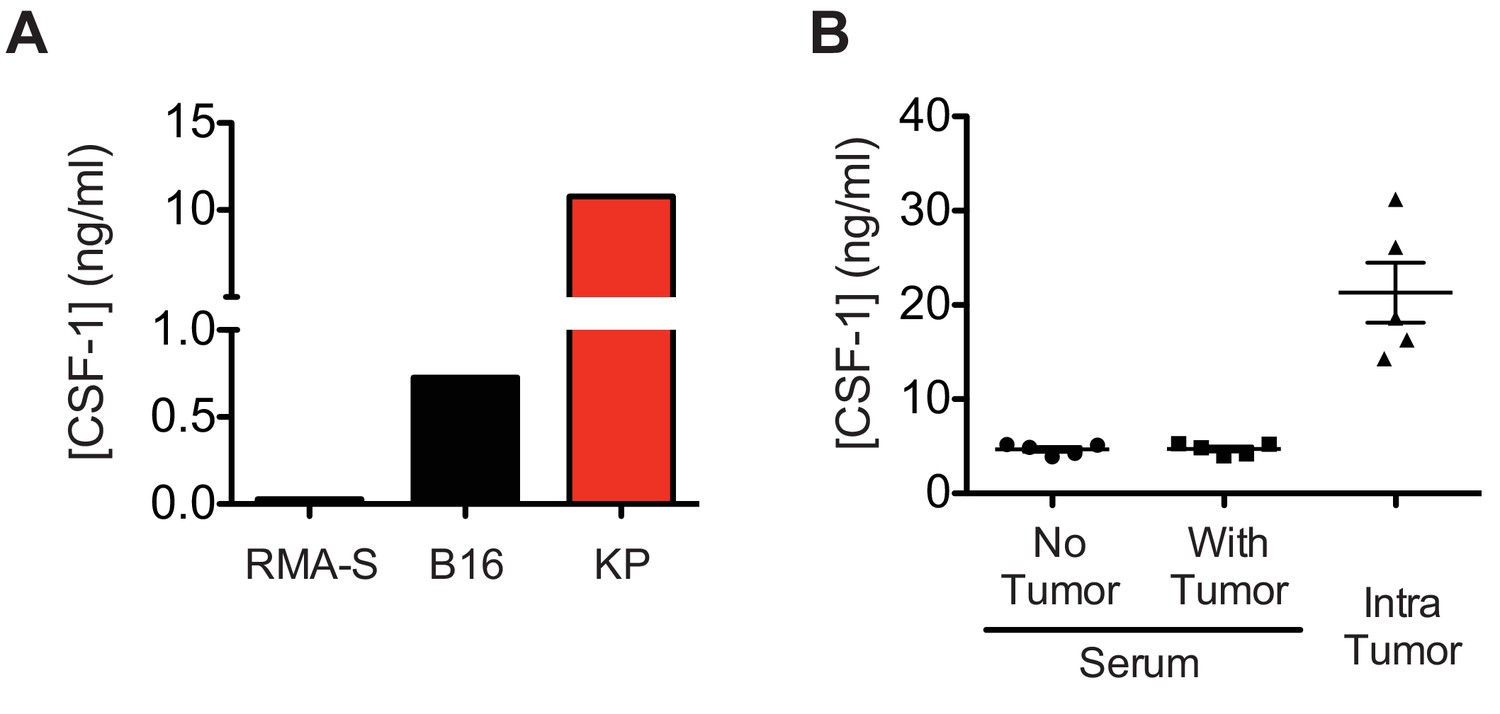
In vitro and in vivo CSF-1 production in tumors.
(A) CSF-1 concentrations in the indicated cell line culture supernatants. (B) CSF-1 concentrations in B16 tumors or serum of naïve or tumor-bearing mice. Data are representative of 2–3 independent experiments. Concentrations in tumors are depicted as total ng of CSF-1 per tumor dissociate divided by volume of tumor at time of harvesting.
Figure 4 with 1 supplement
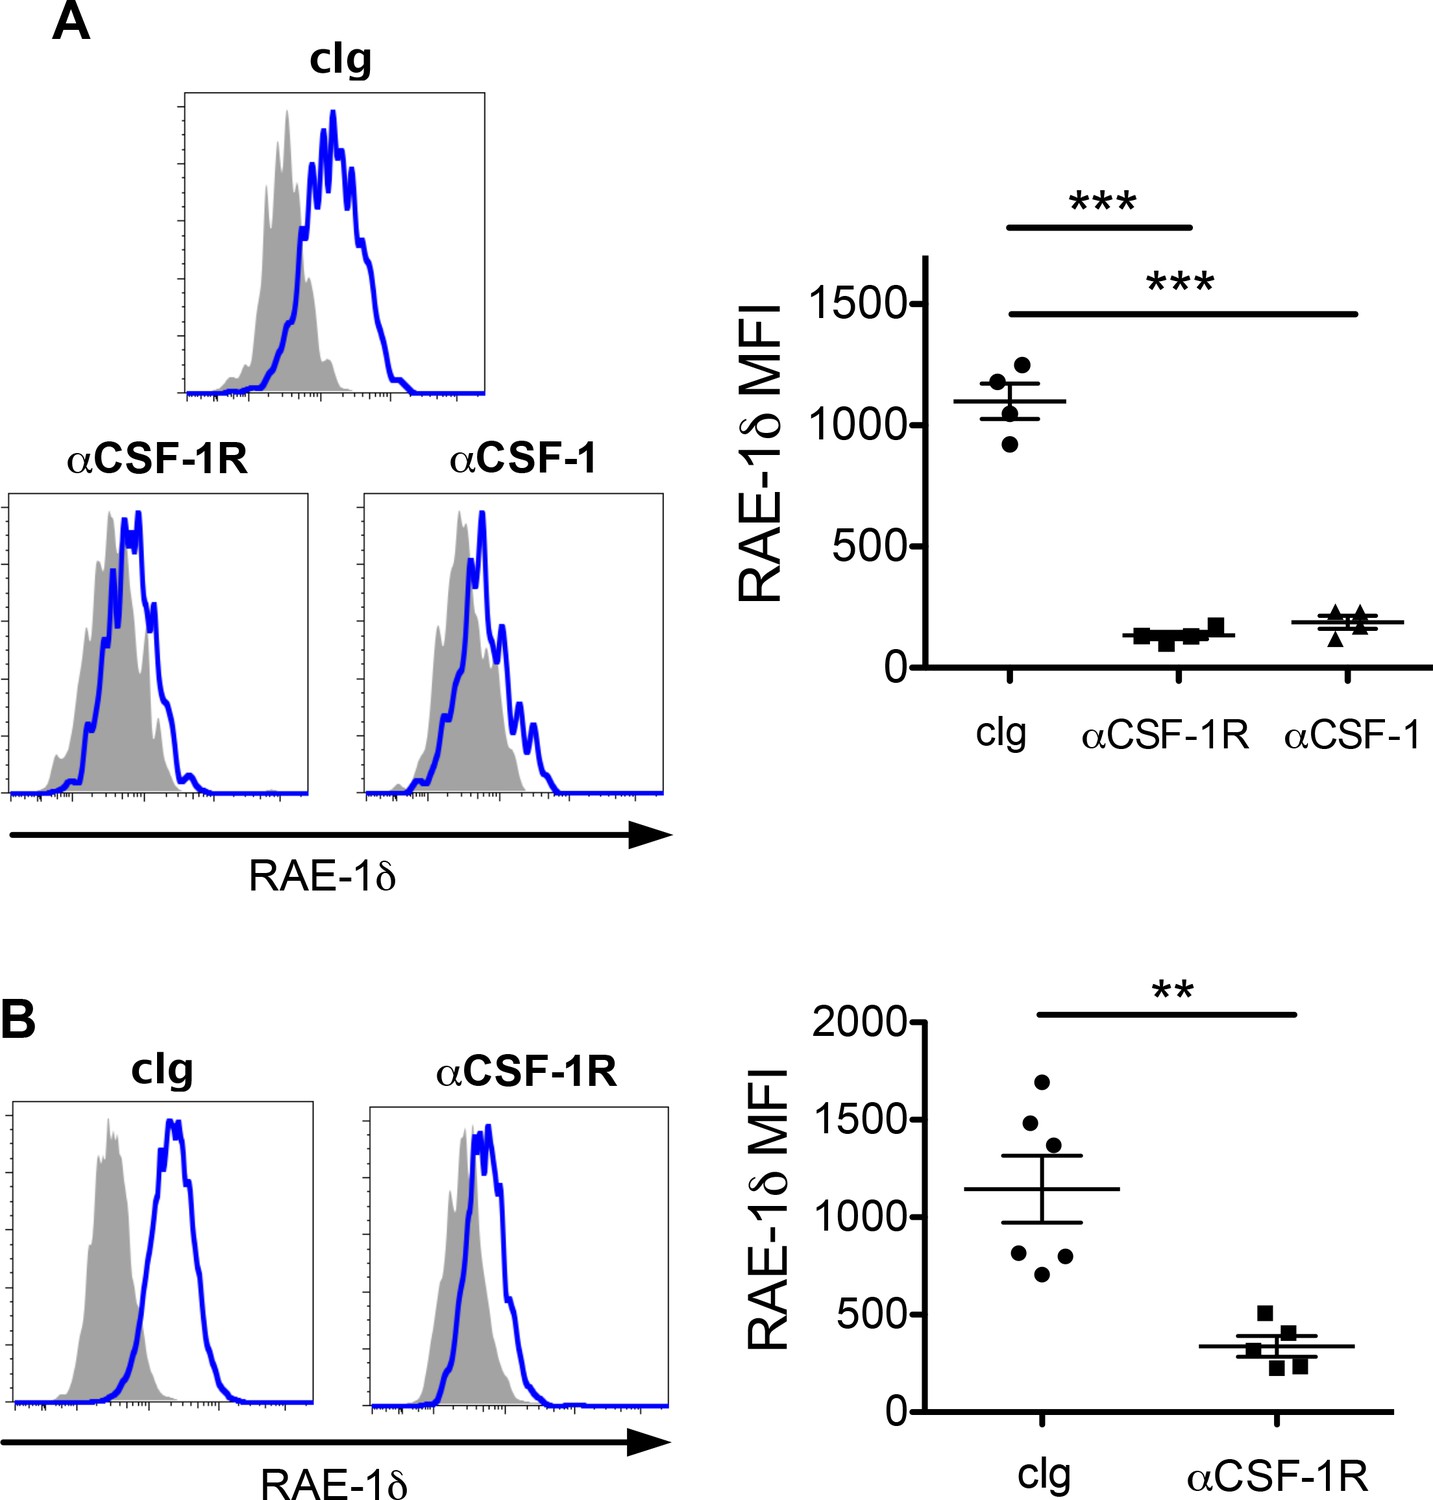
Blockade of CSF-1 or CSF-1R abrogates RAE-1δ expression by TAMs in vivo.
(A) Mice with established B16 tumors were injected i.p. with 200 ug of the indicated antibody, and RAE-1δ on TAMs was analyzed 48 hr later. (B) KP mice with established sarcomas were injected i.p. with 200 ug of the indicated antibody, and RAE-1δ on TAMs was analyzed 48 hr later. Statistical significance was determined using one-way ANOVA with Bonferroni post-tests (A) or a two-tailed unpaired Student’s t test (B). Data represent means ±SEM. Data are representative of >3 independent experiments.
Figure 4—figure supplement 1
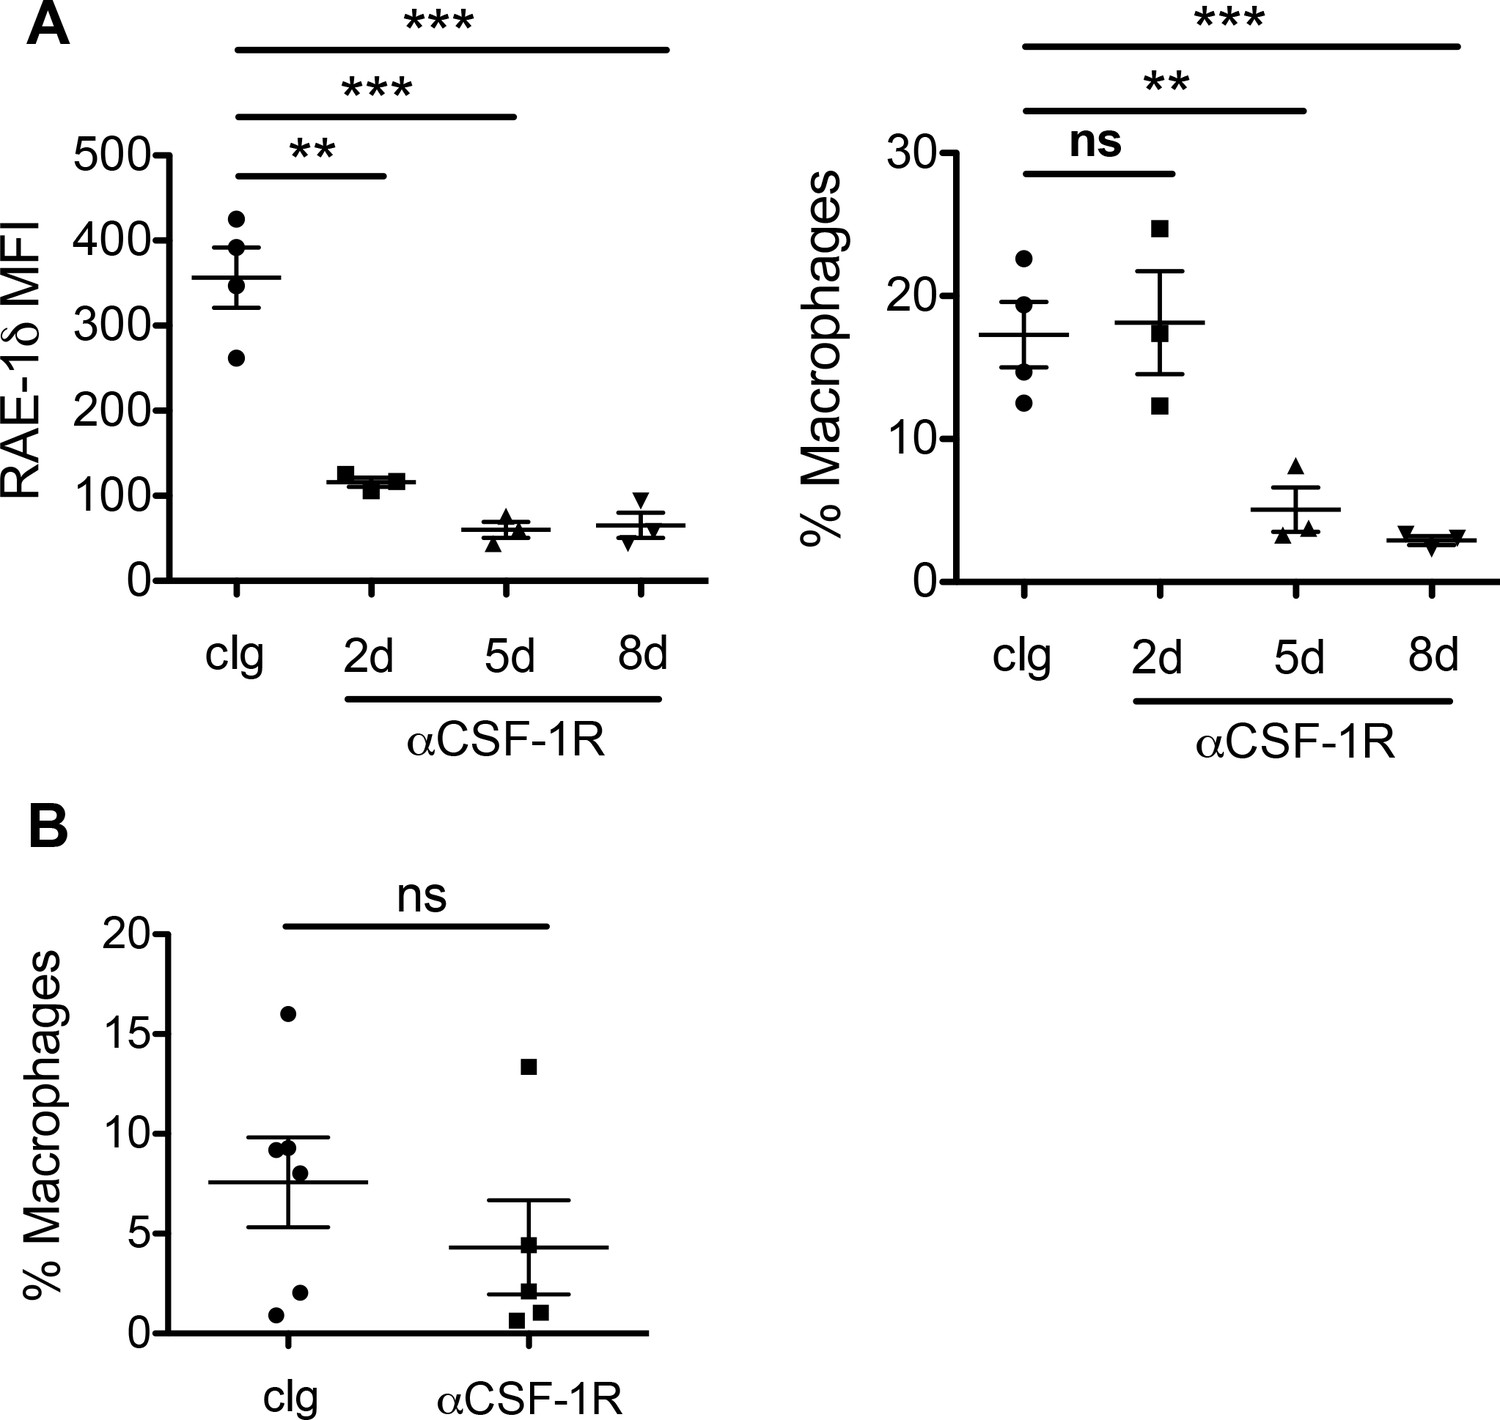
Tumor associated macrophage numbers and RAE-1δ expression after treatments with anti-CSF-1R.
(A) RAE-1δ on TAMs in B16 tumors from mice given control Ig or anti-CSF-1R at days −1, 2, and 5 and harvested at the indicated time point. (B) TAMs as a percent of total live cells in B16 tumors from mice given control Ig or anti-CSF-1R for 48 hrs. Statistical significance was determined using one-way ANOVA with Bonferroni post-tests. Data are representative of 2 independent experiments.
Figure 5
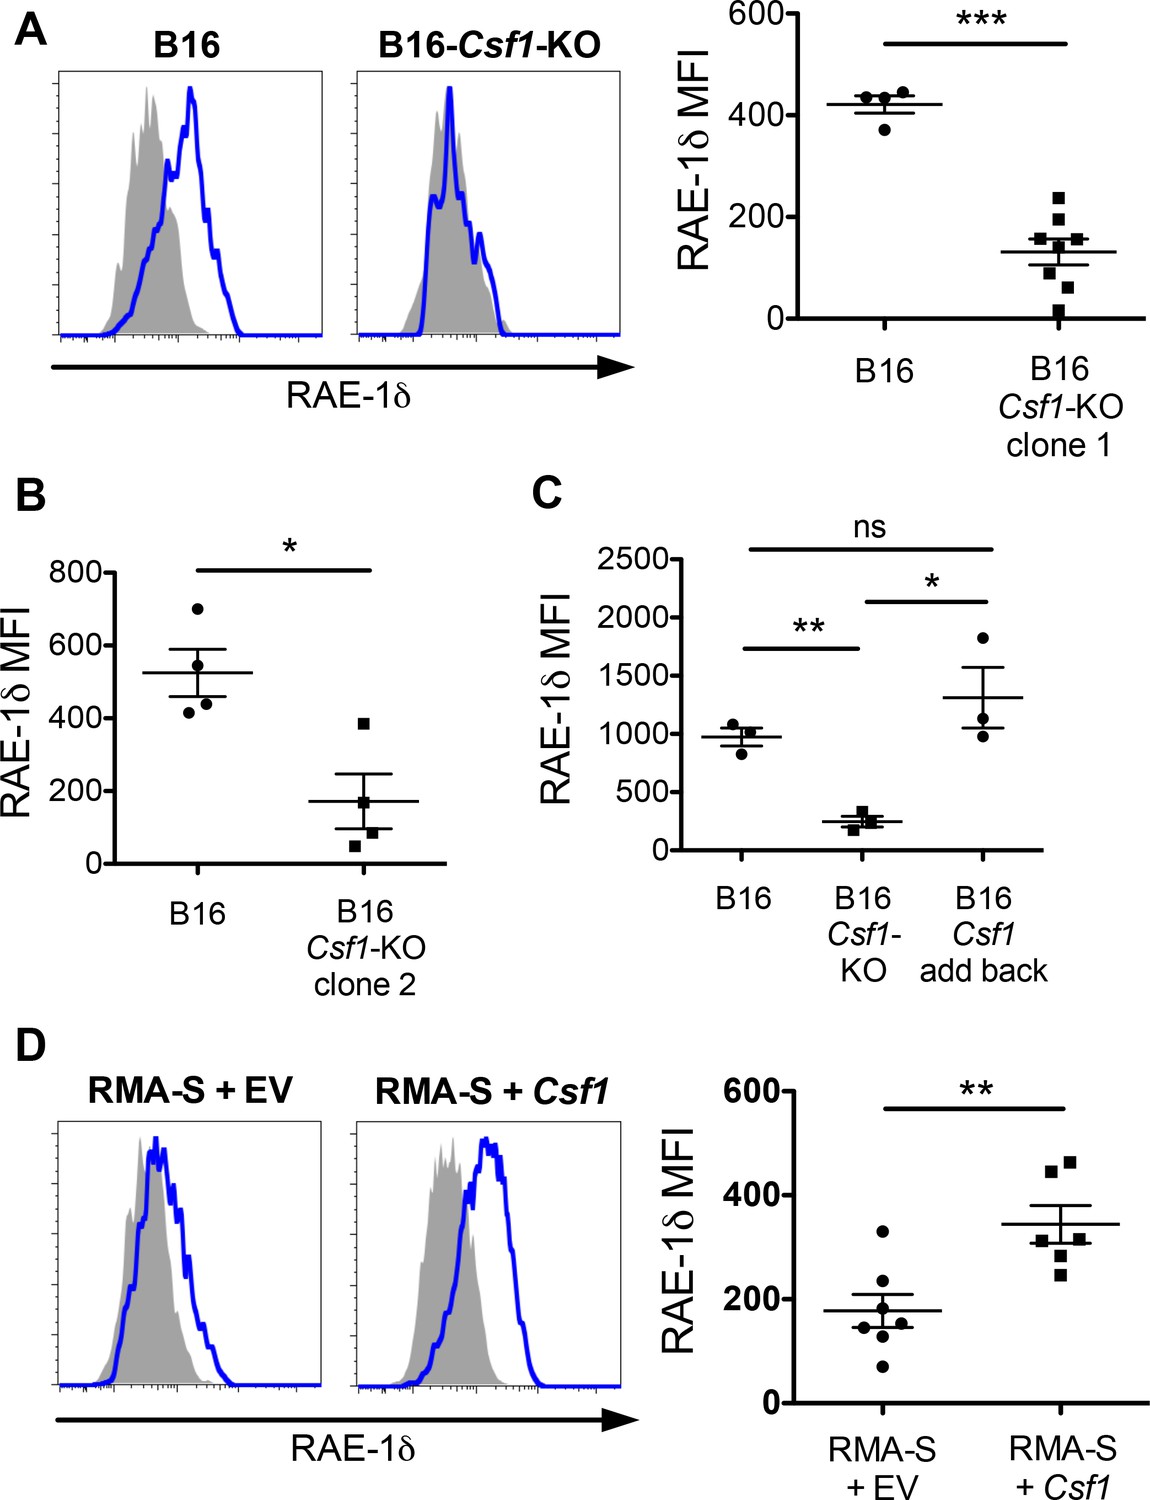
Tumor-derived CSF-1 is required for TAM RAE-1δ expression in vivo.
(A) RAE-1δ expression on TAMs in established B16 or B16-Csf1-KO tumors. (B) RAE-1δ on TAMs in mice with established B16 tumors or tumors of a second clone of B16-Csf1-KO cells. (C) RAE-1δ on TAMs in mice with established B16, B16 Csf1-KO, or B16 Csf1-KO tumors in which CSF-1 expression had been restored by transduction (add-back tumors). (D) RAE-1δ on TAMs in mice with established RMA-S or RMA-S-Csf1-overexpressing tumors. Statistical significance was determined using one-way ANOVA with Bonferroni post-tests (C) or a two-tailed unpaired Student t test (A, B, D). Data represent means ±SEM, and are representative of 2–4 independent experiments.
Figure 6 with 1 supplement
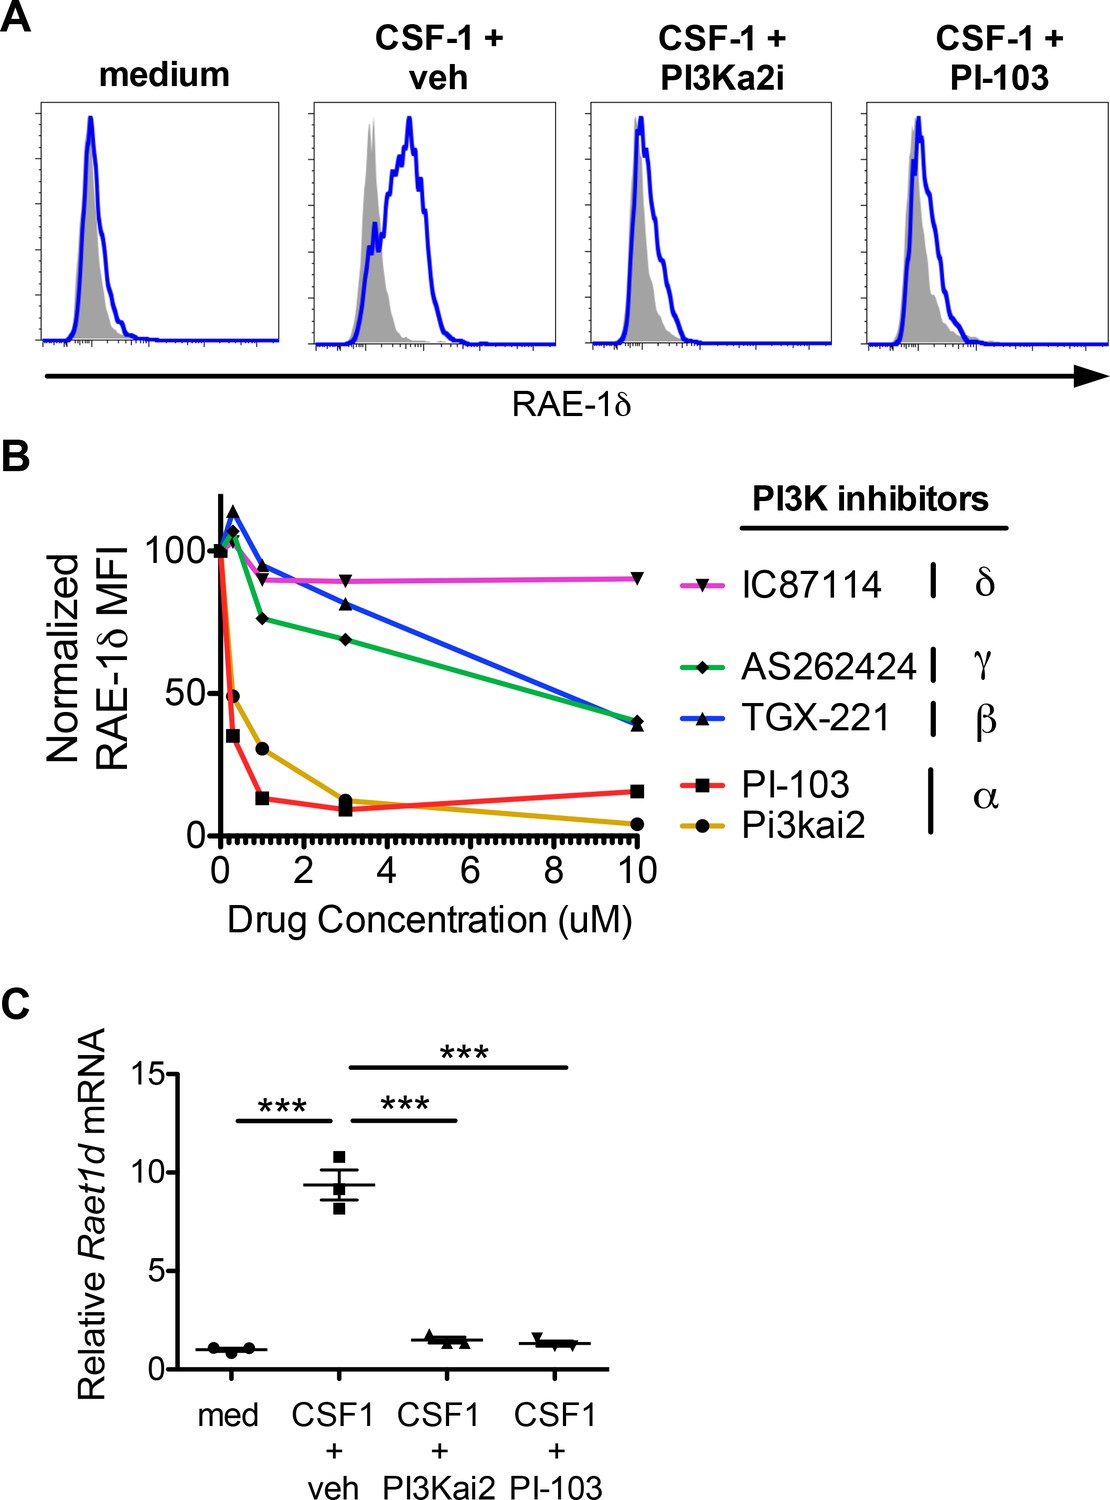
PI3Kα signals are required for macrophage RAE-1δ induction by CSF-1.
(A) Peritoneal wash cells were stimulated with CSF-1 plus vehicle control or PI3Kα inhibitors at 3 μM, and macrophage RAE-1δ was analyzed at 24 hr. (B). Relative macrophage RAE-1δ MFI 24 hr after stimulation with CSF-1 plus the indicated concentrations of the indicated PI3K inhibitors. (C) Relative Raet1d mRNA levels 24 hr after macrophage stimulation with CSF-1 plus vehicle control or PI3Kα inhibitors at 3 μM. Statistical significance was determined using one-way ANOVA with Bonferroni post-tests. Data are representative of 3–4 independent experiments.
Figure 6—figure supplement 1
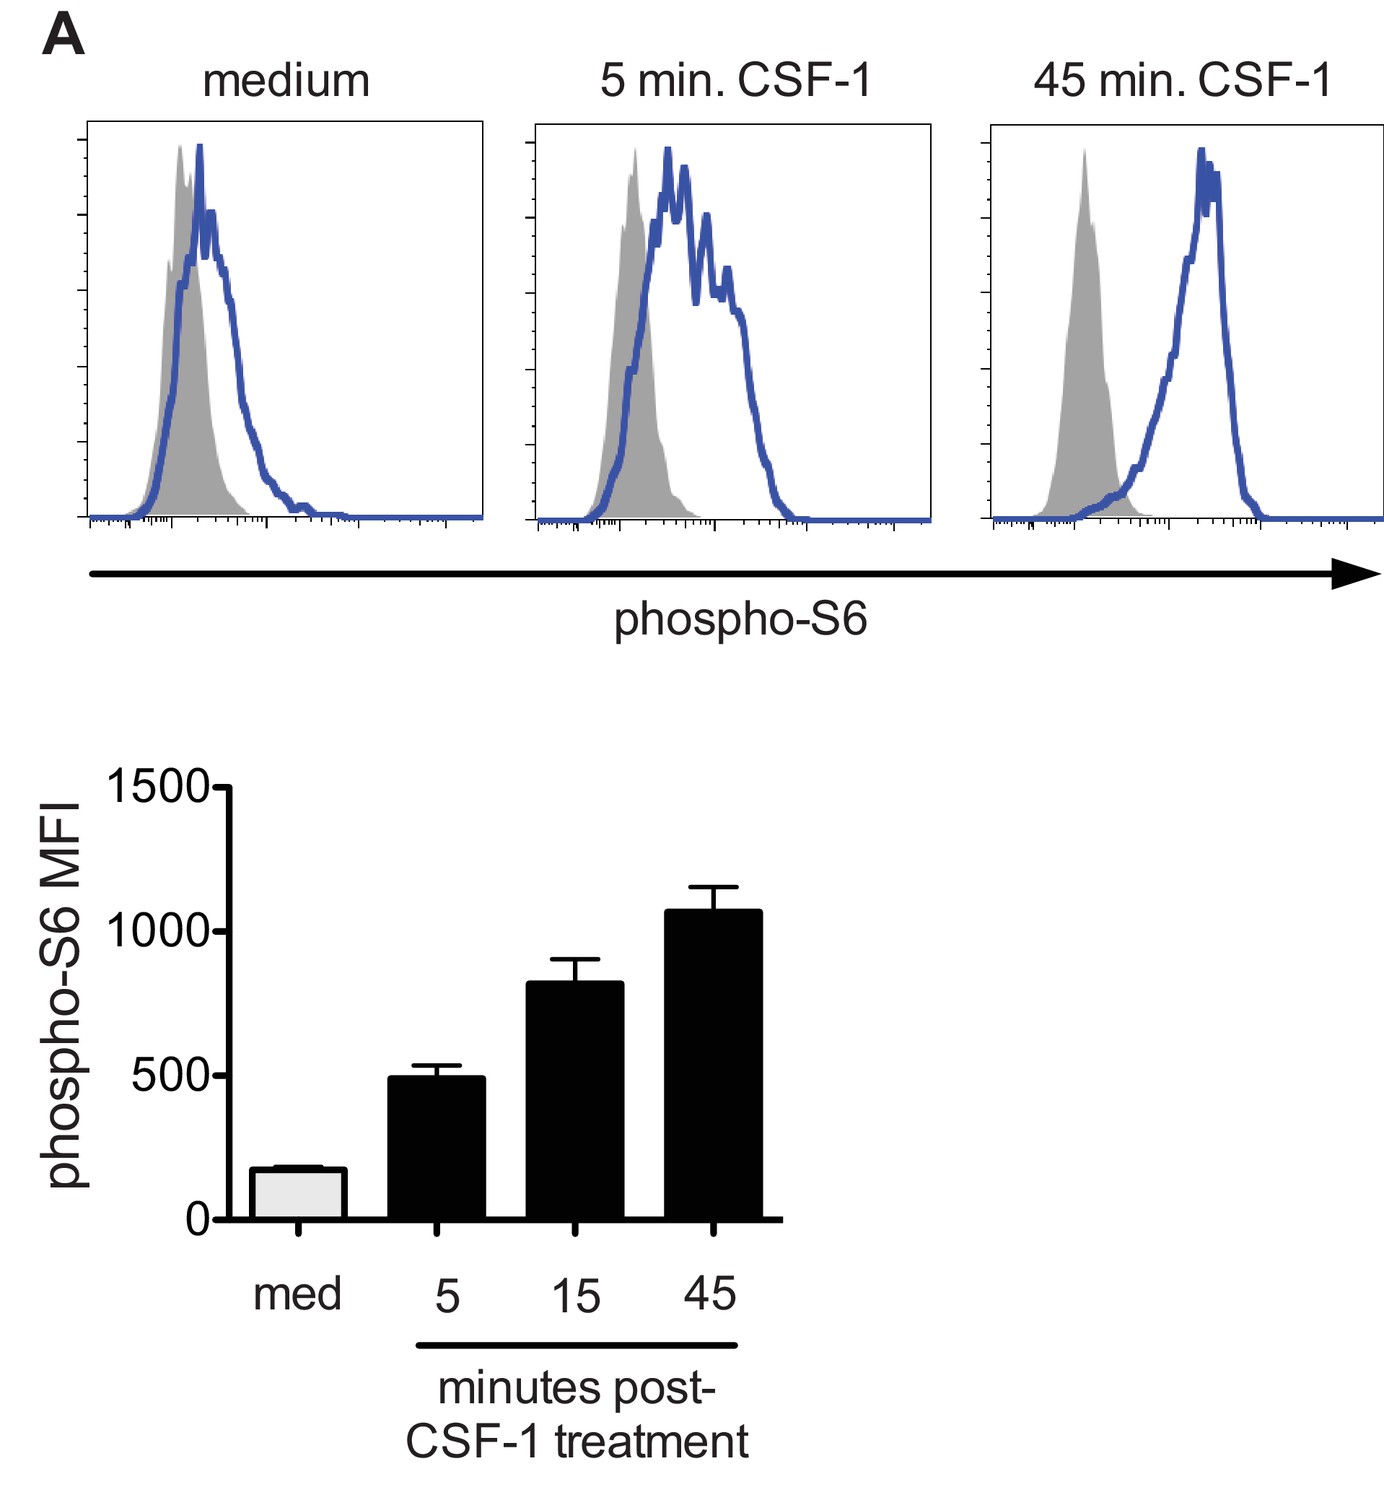
Induction of phospho-S6 by CSF-1.
(A) Phospho-S6 staining (top) and MFI quantification (bottom) in macrophages stimulated with control medium or 10 ng/ml CSF-1 for the indicated times. Data are representative of 3 independent experiments.
Figure 7 with 1 supplement
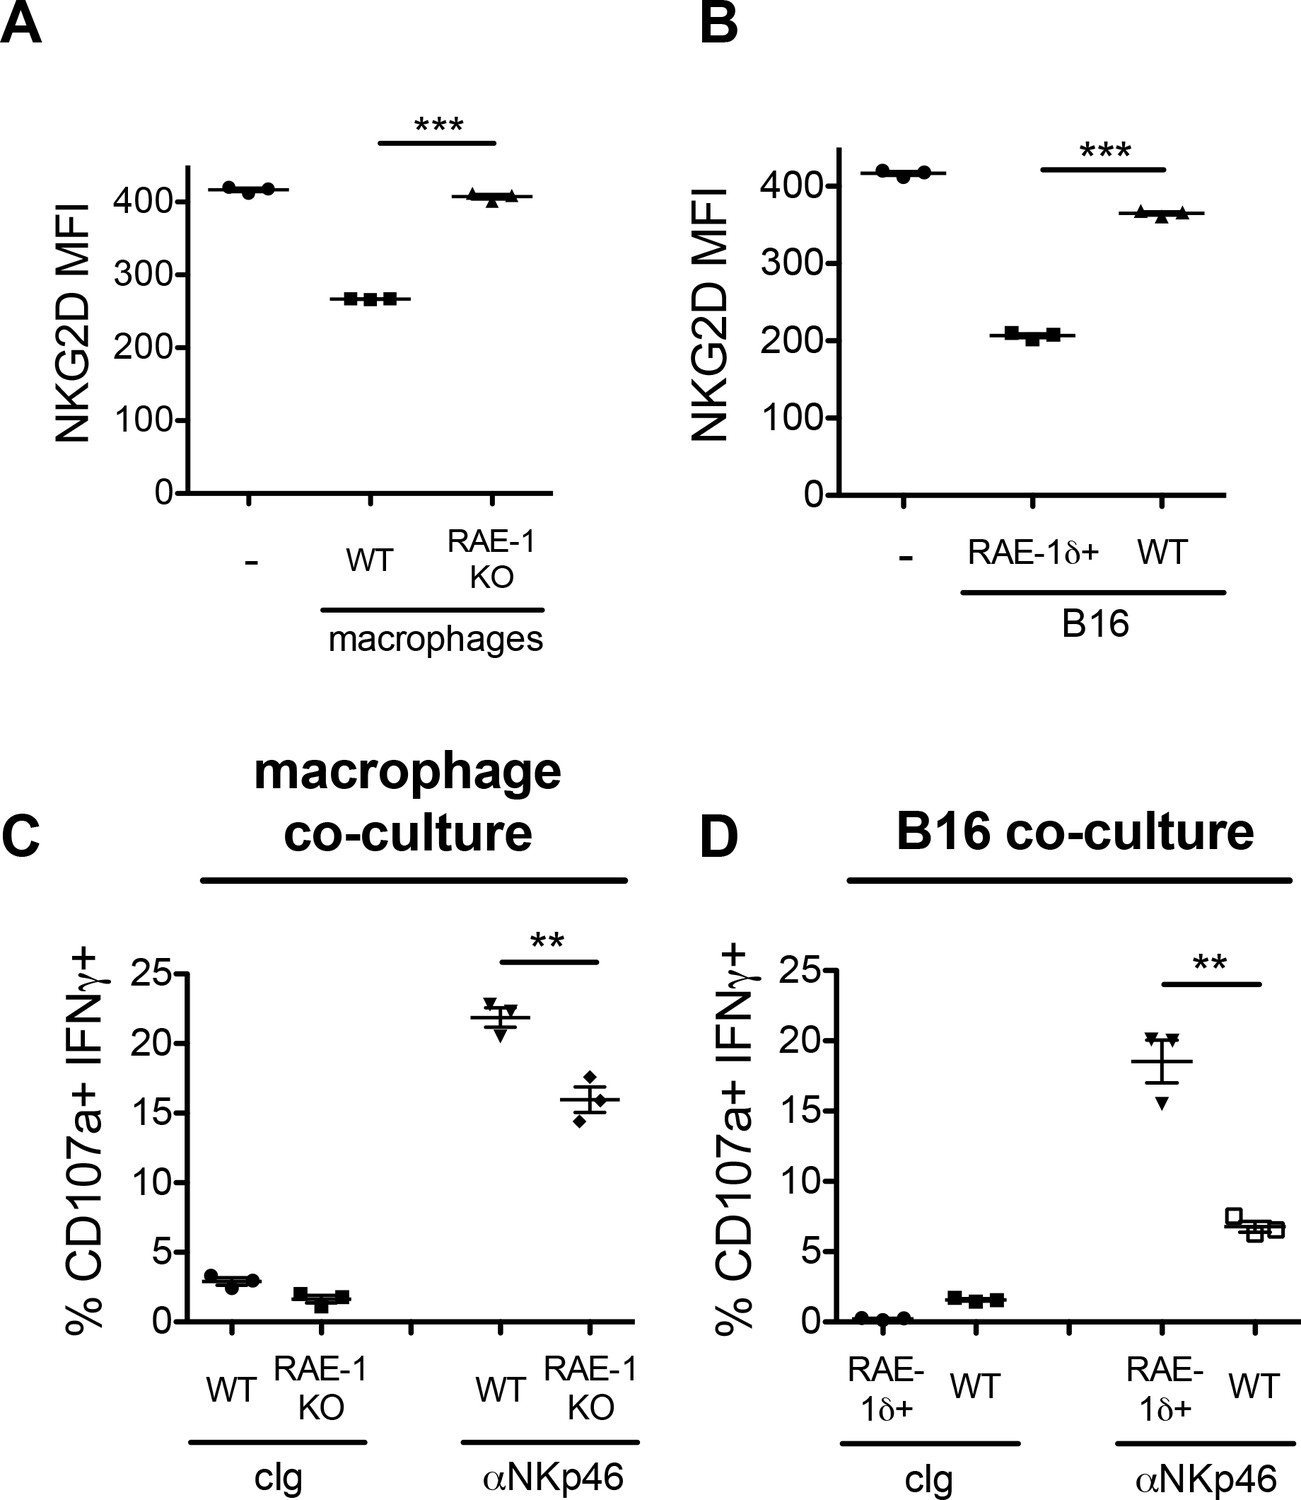
Co-culture of NK cells with RAE-1δ-expressing macrophages and tumor cells.
(A) Peritoneal macrophages from WT or RAE-1-KO mice or were stimulated with 10 ng/ml CSF-1 for 48 hr and then co-cultured with WT splenocytes for 18 hr, and NKG2D levels were analyzed by flow cytometry. (B) B16 or B16-RAE-1δ cells were co-cultured with WT splenocytes for 18 hr, and NKG2D levels on NK cells were analyzed by flow cytometry. (C) WT splenocytes were co-cultured with CSF-1-stimulated WT or RAE-1-KO macrophages for 18 hr, followed by 5 hr stimulation with plate-bound antibody against the NK cell activating receptor NKp46, or control Ig, and NK cell IFNγ and degranulation were analyzed by flow cytometry. (D) WT splenocytes were co-cultured with B16 or B16-RAE-1δ cells for 18 hr, followed by 5 hr stimulation with plate-bound antibody against the NK cell activating receptor NKp46, and NK cell IFNγ and degranulation were analyzed by flow cytometry.
Figure 7—figure supplement 1
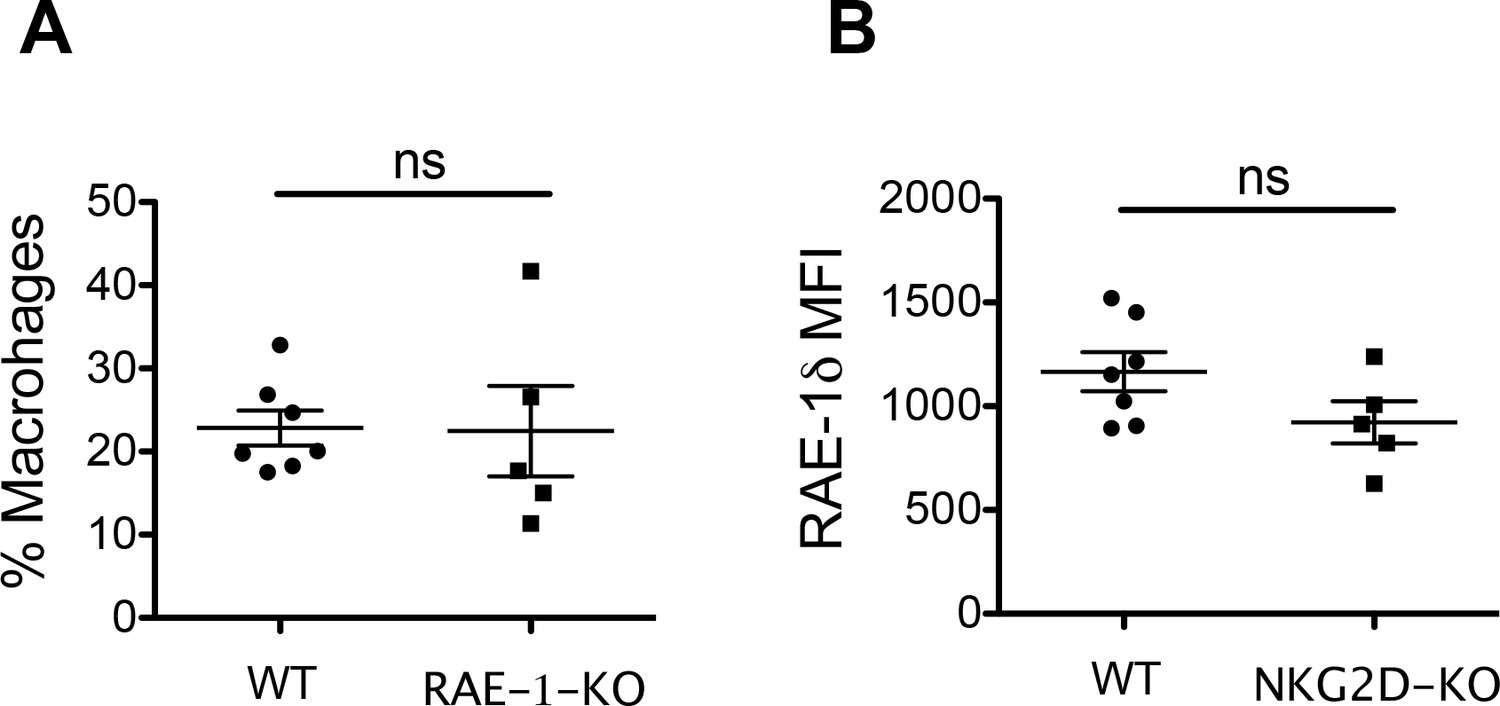
Tumor associated macrophage numbers and RAE-1δ expression in RAE-1-KO and NKG2D-KO mice.
(A) TAMs as a percentage of CD45 + cells in established B16 tumors in WT and RAE-1-KO mice. (B) RAE-1δ on TAMs in B16 tumors in WT and NKG2D-KO mice.
Author response image 1
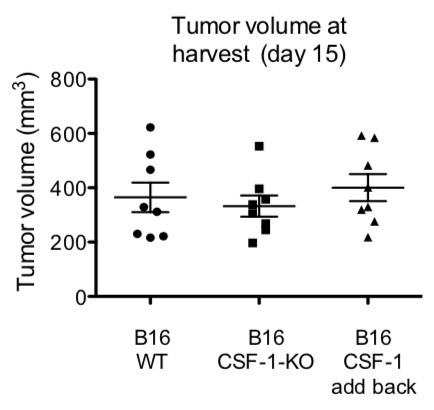
WT mice were injected with 1 x 10⁶ of the indicated tumors.
Volumes were analyzed at day of harvest (day 15).
Tables
Table 1
Cytokine stimulation of macrophages for RAE-1δ induction.
https://doi.org/10.7554/eLife.32919.008| Treatment | Macrophage RAE-1δ induction? |
|---|---|
| IL-1α | |
| IL-1β | |
| IL-4 | |
| IL-6 | |
| IL-12 | |
| IFNβ | |
| IFNγ | |
| TNFα | |
| CSF1 |
Additional files
-
Transparent reporting form
- https://doi.org/10.7554/eLife.32919.018
Download links
A two-part list of links to download the article, or parts of the article, in various formats.
Downloads (link to download the article as PDF)
Open citations (links to open the citations from this article in various online reference manager services)
Cite this article (links to download the citations from this article in formats compatible with various reference manager tools)
Tumor-derived CSF-1 induces the NKG2D ligand RAE-1δ on tumor-infiltrating macrophages
eLife 7:e32919.
https://doi.org/10.7554/eLife.32919


