ZFP36 RNA-binding proteins restrain T cell activation and anti-viral immunity
- Howard Hughes Medical Institute, The Rockefeller University, United States
- New York Genome Center, United States
- Howard Hughes Medical Institute, Ludwig Center at Memorial Sloan Kettering Cancer Center, United States
Figures
Figure 1 with 3 supplements
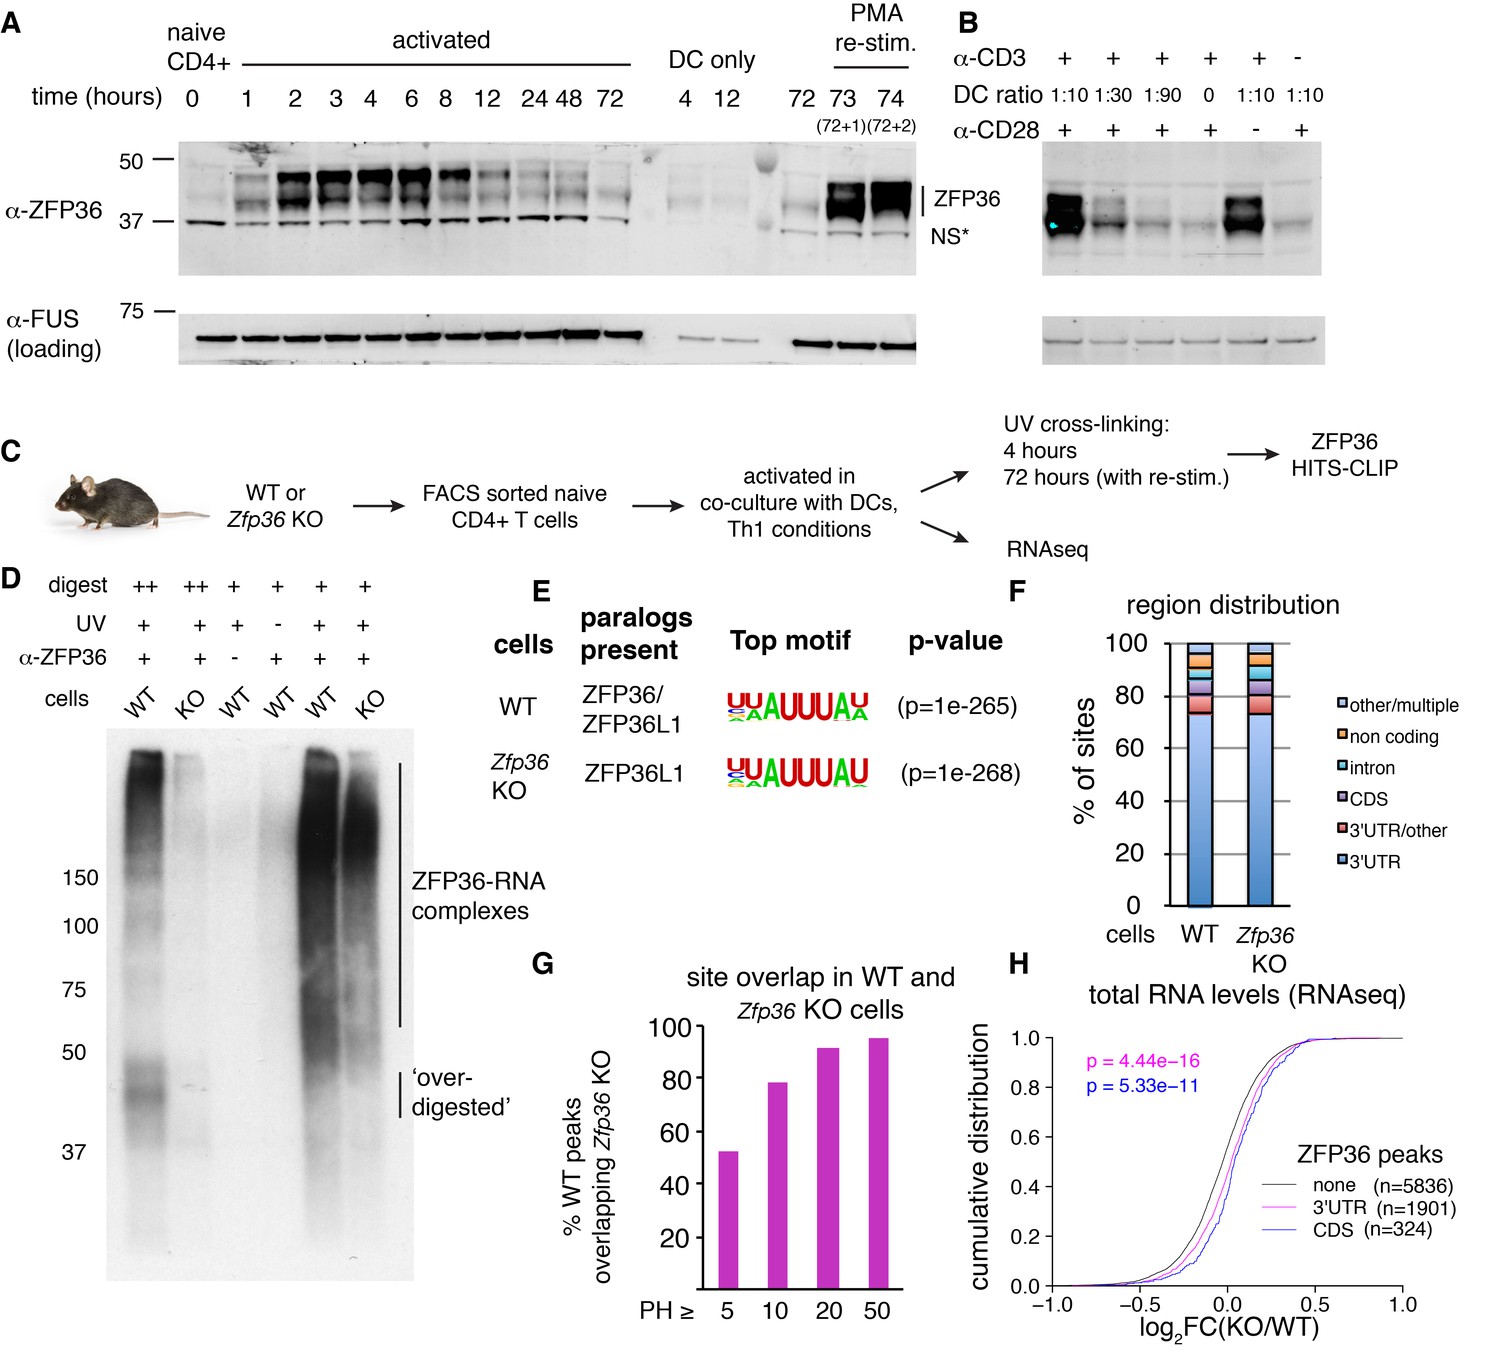
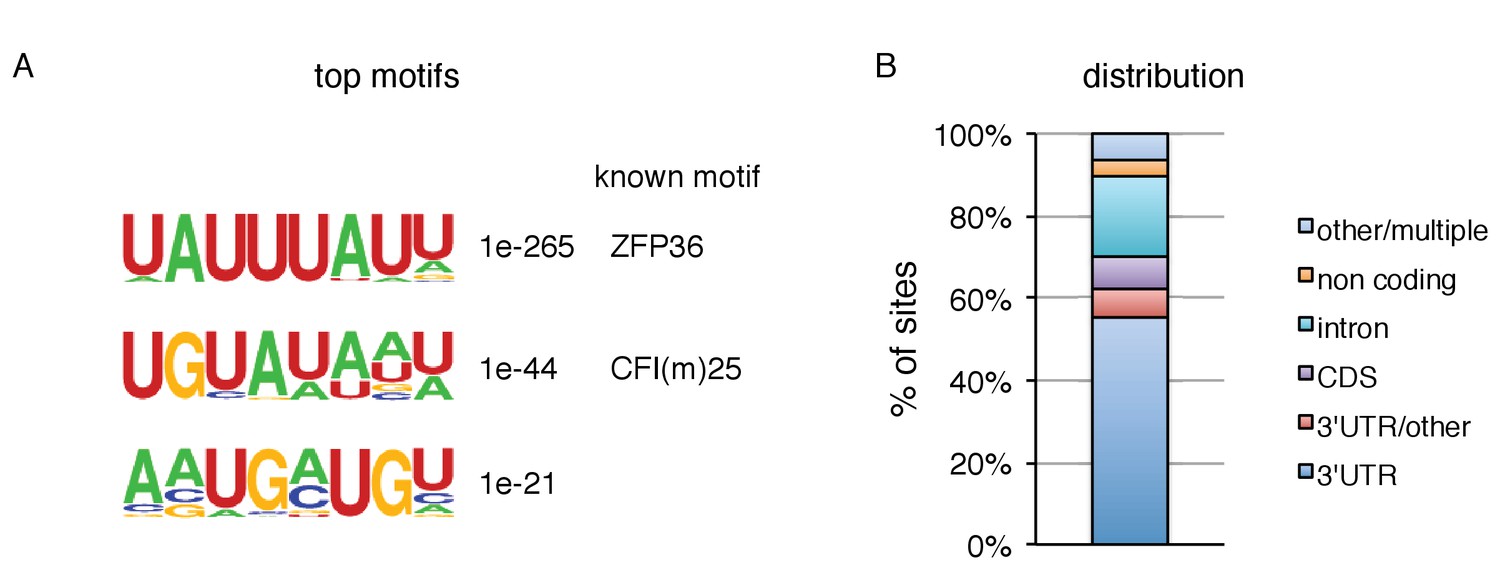
HITS-CLIP as a transcriptome-wide screen for ZFP36 function in T cells.
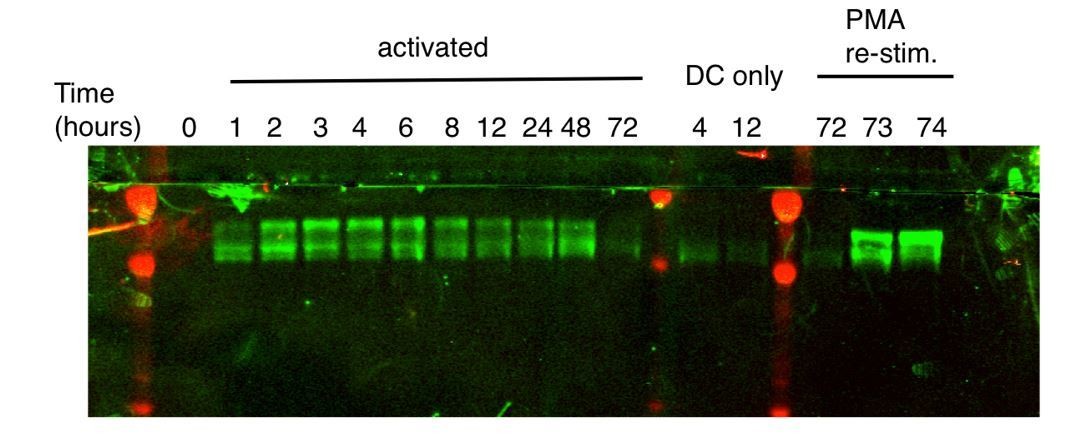
(A) Immunoblots with pan-ZFP36 antisera after activation of naïve CD4 +T cells in DC co-cultures, and with re-stimulation at day 3. Antibody and MW markers are shown on the left. NS* indicates a non-specific band. (B) Immunoblotting with pan-ZFP36 antisera 4 hr after activation of naïve CD4 +T cells, testing dependence on TCR stimulation (α-CD3), and co-stimulation (DCs or α-CD28). (C) ZFP36 HITS-CLIP design. (D) Representative autoradiogram of ZFP36 CLIP from activated CD4 +T cells using pan-ZFP36 antisera, with pre-immune and no-UV controls. Signal in Zfp36 KO cells is due to capture of ZFP36L1 RNP complexes. (E) The most enriched binding motifs and (F) annotation of binding sites from WT and Zfp36 KO cells. (G) Overlap of binding sites in WT and Zfp36 KO cells, stratified by peak height (PH). CLIP data are compilation of 4 experiments, with 3–5 total biological replicates were condition. (H) RNAseq in WT and Zfp36 KO CD4 +T cells activated under Th1 conditions for 4 hr. Log2-transformed fold-changes (KO/WT) are plotted as a cumulative distribution function (CDF), for mRNAs with 3’UTR, CDS, or no significant ZFP36 HITS-CLIP sites. Numbers of mRNAs in each category (n) and p-values from two-tailed Kolmogorov-Smirnov (KS) tests are shown. RNAseq data is a compilation of 2 experiments, with 3–4 biological replicates per condition.
Figure 1—figure supplement 1
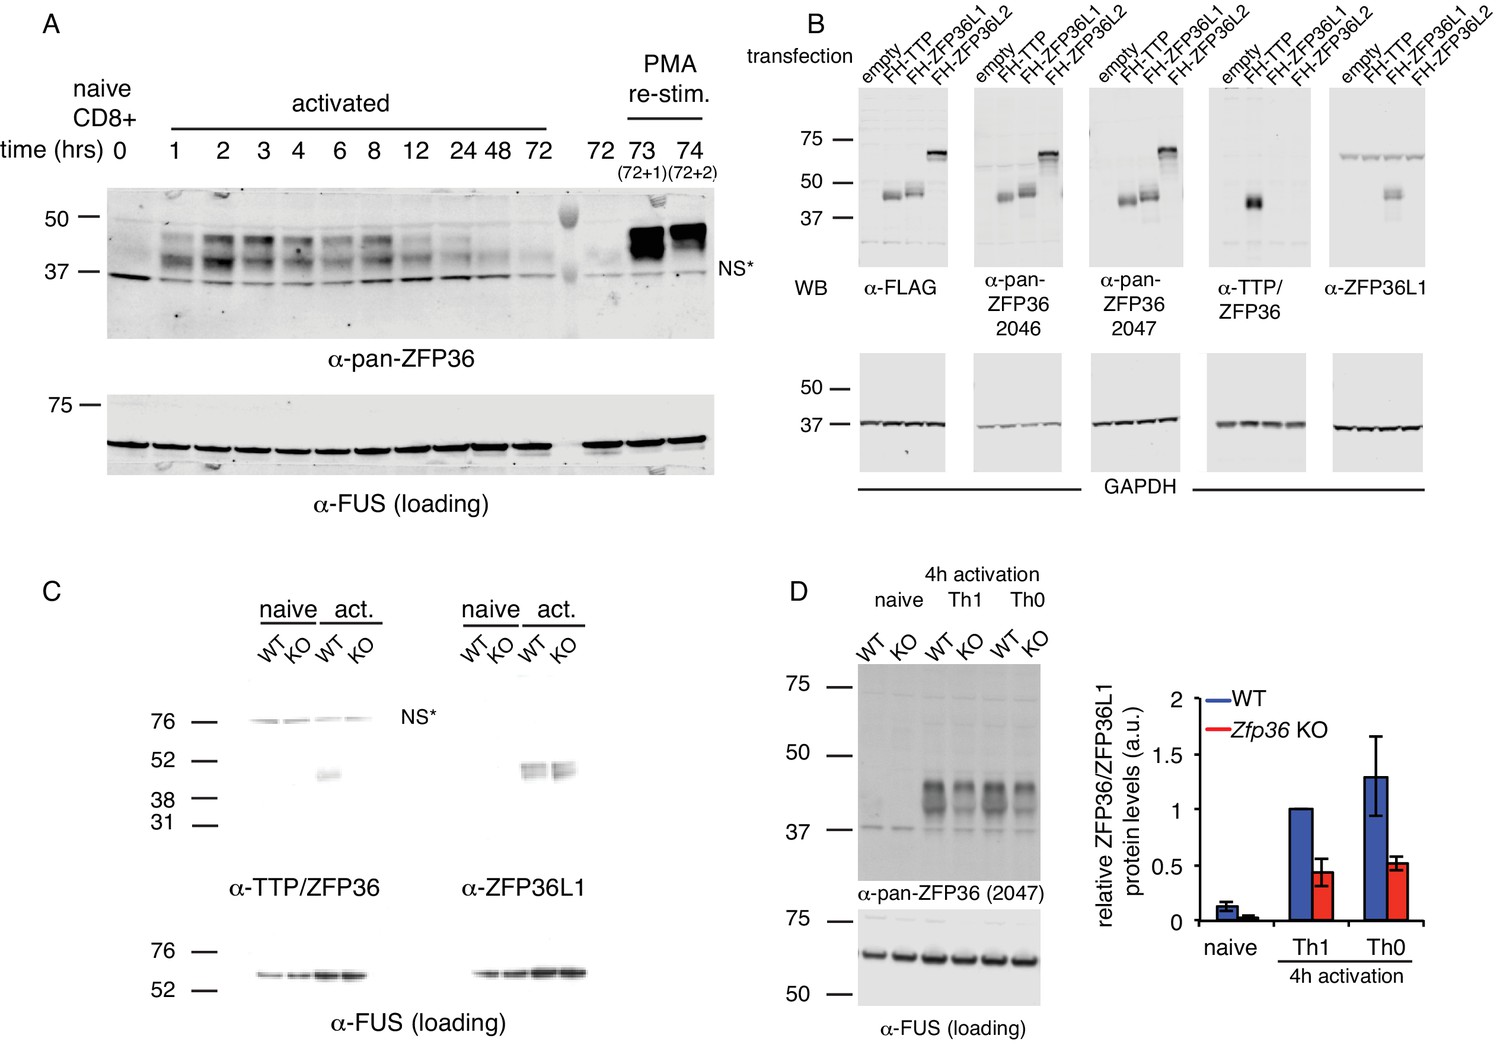
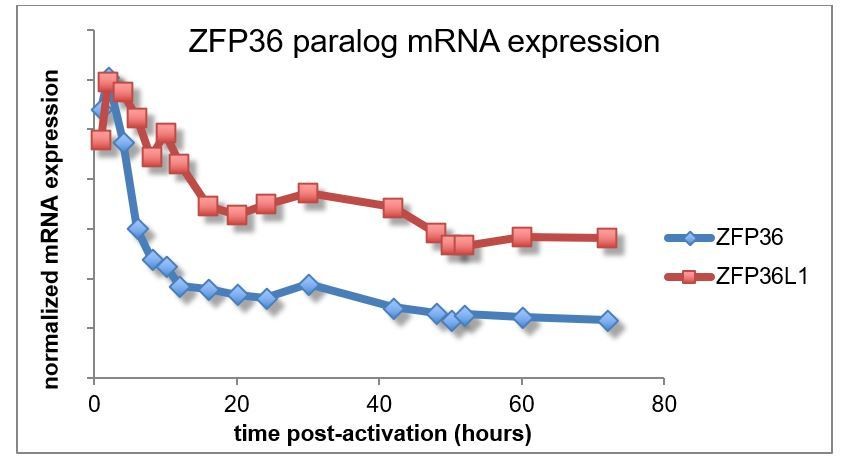
ZFP36 paralog expression in T cells.
(A) ZFP36 expression was measured by immunoblotting in a time course of CD8 +T -cell activation using pan-ZFP36 antisera. NS *indicates a presumed non-specific band. (B) 293T cells were transfected with indicated constructs expressing FLAG-HA (FH) tagged ZFP36 paralogs. Lysates were analyzed by immunoblotting with antibodies indicated below panels: anti-FLAG; two custom antisera (RF2046 and RF2047) raised against a C-terminal peptide of mouse ZFP36; commercial anti-ZFP36; and commercial anti-ZFP36L1/2. NS* indicates a presumed non-specific band. (C) Lysates from naïve or Th1-activated WT and Zfp36 KO CD4 +T cells were analyzed by immunoblotting with ZFP36- and ZFP36L1-specific antibodies. (D) Lysates from naïve, Th1-, or Th0-activated WT and Zfp36 KO CD4 +T cells (4 hr) were analyzed by immunoblotting with pan-anti-ZFP36. A representative blot is shown (left), with quantification across three independent experiments.
Figure 1—figure supplement 2
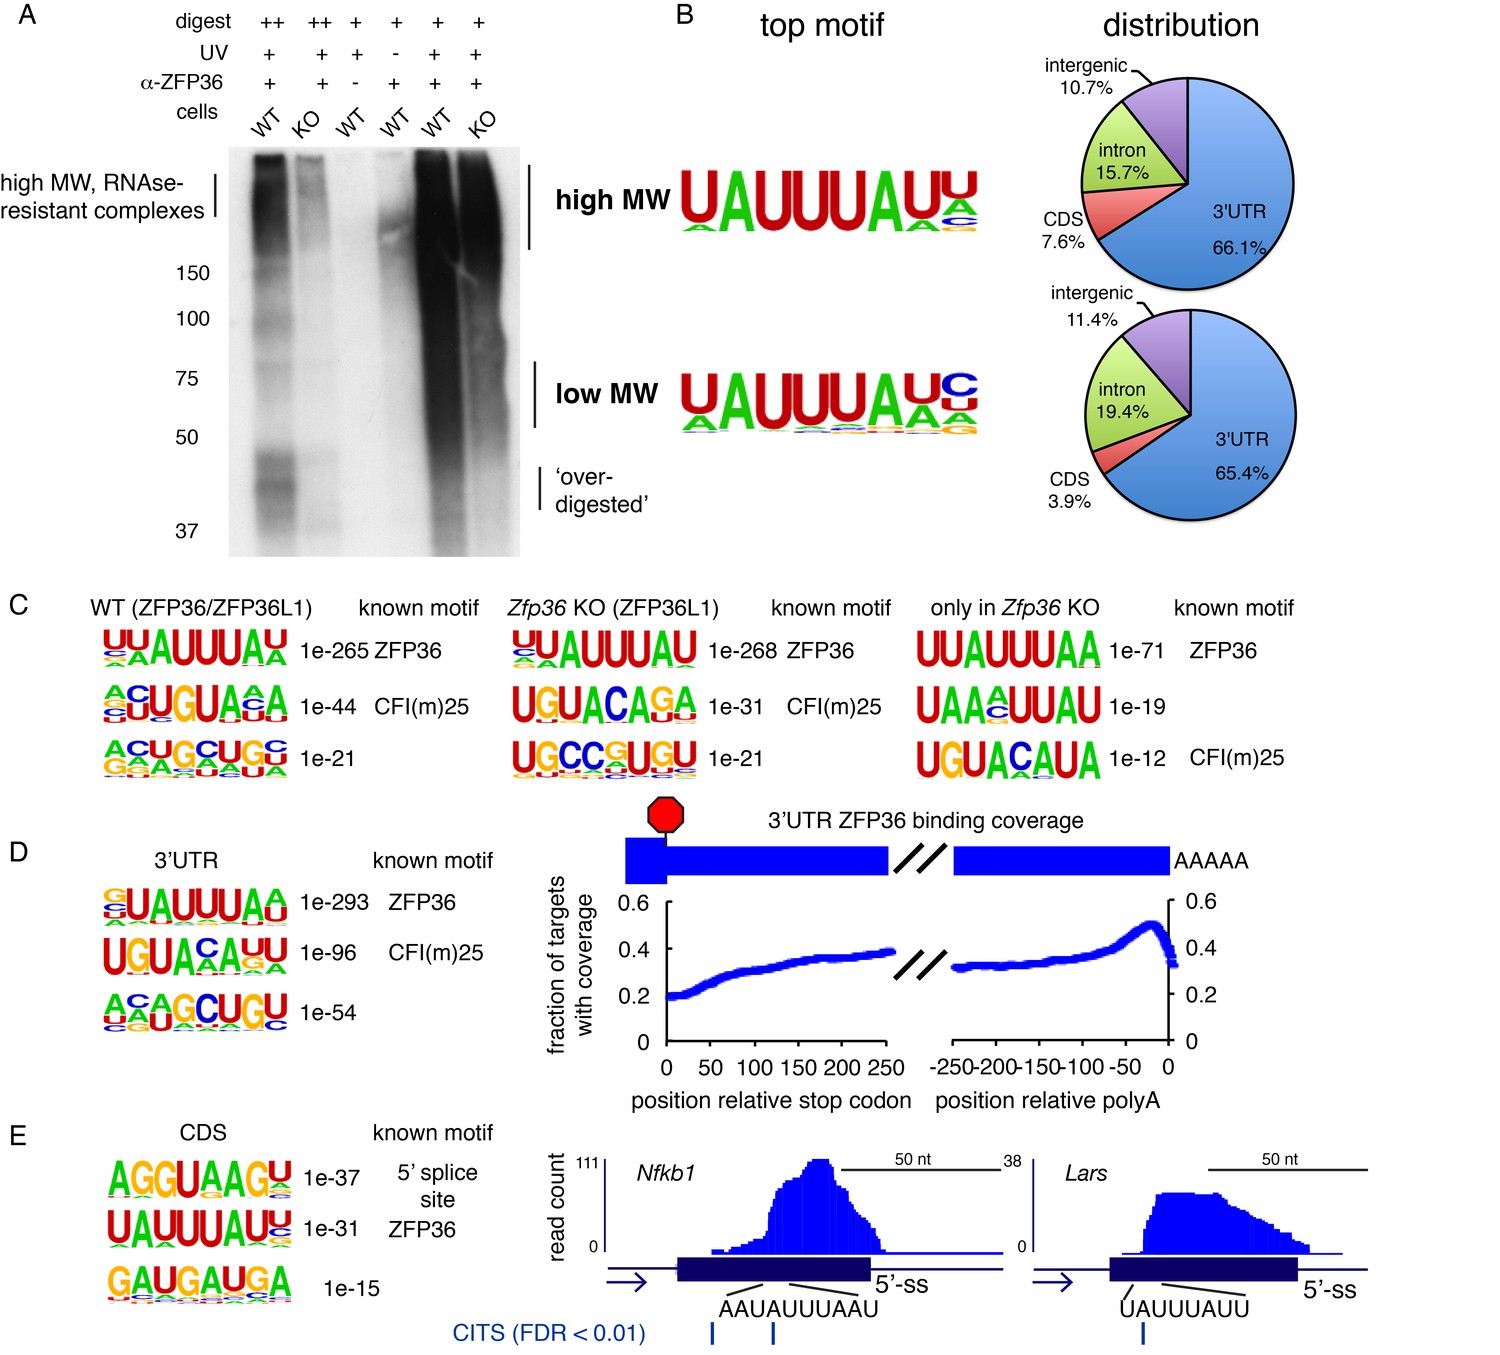
ZFP36 HITS-CLIP.
(A) ZFP36 HITS-CLIP autoradiogram with a second pan-ZFP36 antisera (RF2046) is shown, with similar results to RF2047 (Figure 1D). (B) High MW and low MW ZFP36-RNA complexes were analyzed separately, yielding sites with very similar enriched motifs and transcript distribution. (C) Top three enriched motifs from HITS-CLIP sites in WT cells (left), Zfp36 KO cells (middle), and sites only identified in Zfp36 KO cells (right). Correspondence to previously known motifs is shown. (D) Motif analysis of ZFP36 HITS-CLIP sites from WT cells in 3’UTR (left), and the position of ZFP36 binding sites in 3’UTR depicted as a coverage map (right). (E) Motif analysis of ZFP36 HITS-CLIP sites from WT cells in CDS (left), and representative CDS binding sites visualized in UCSC Genome Browser. CLIP reads supporting CDS binding sites span exon-intron boundaries, consistent with 5’-ss motif enrichment. Cross-link-induced truncations (CITS) are shown, confirming that binding occurs within the coding exon.
Figure 1—figure supplement 3
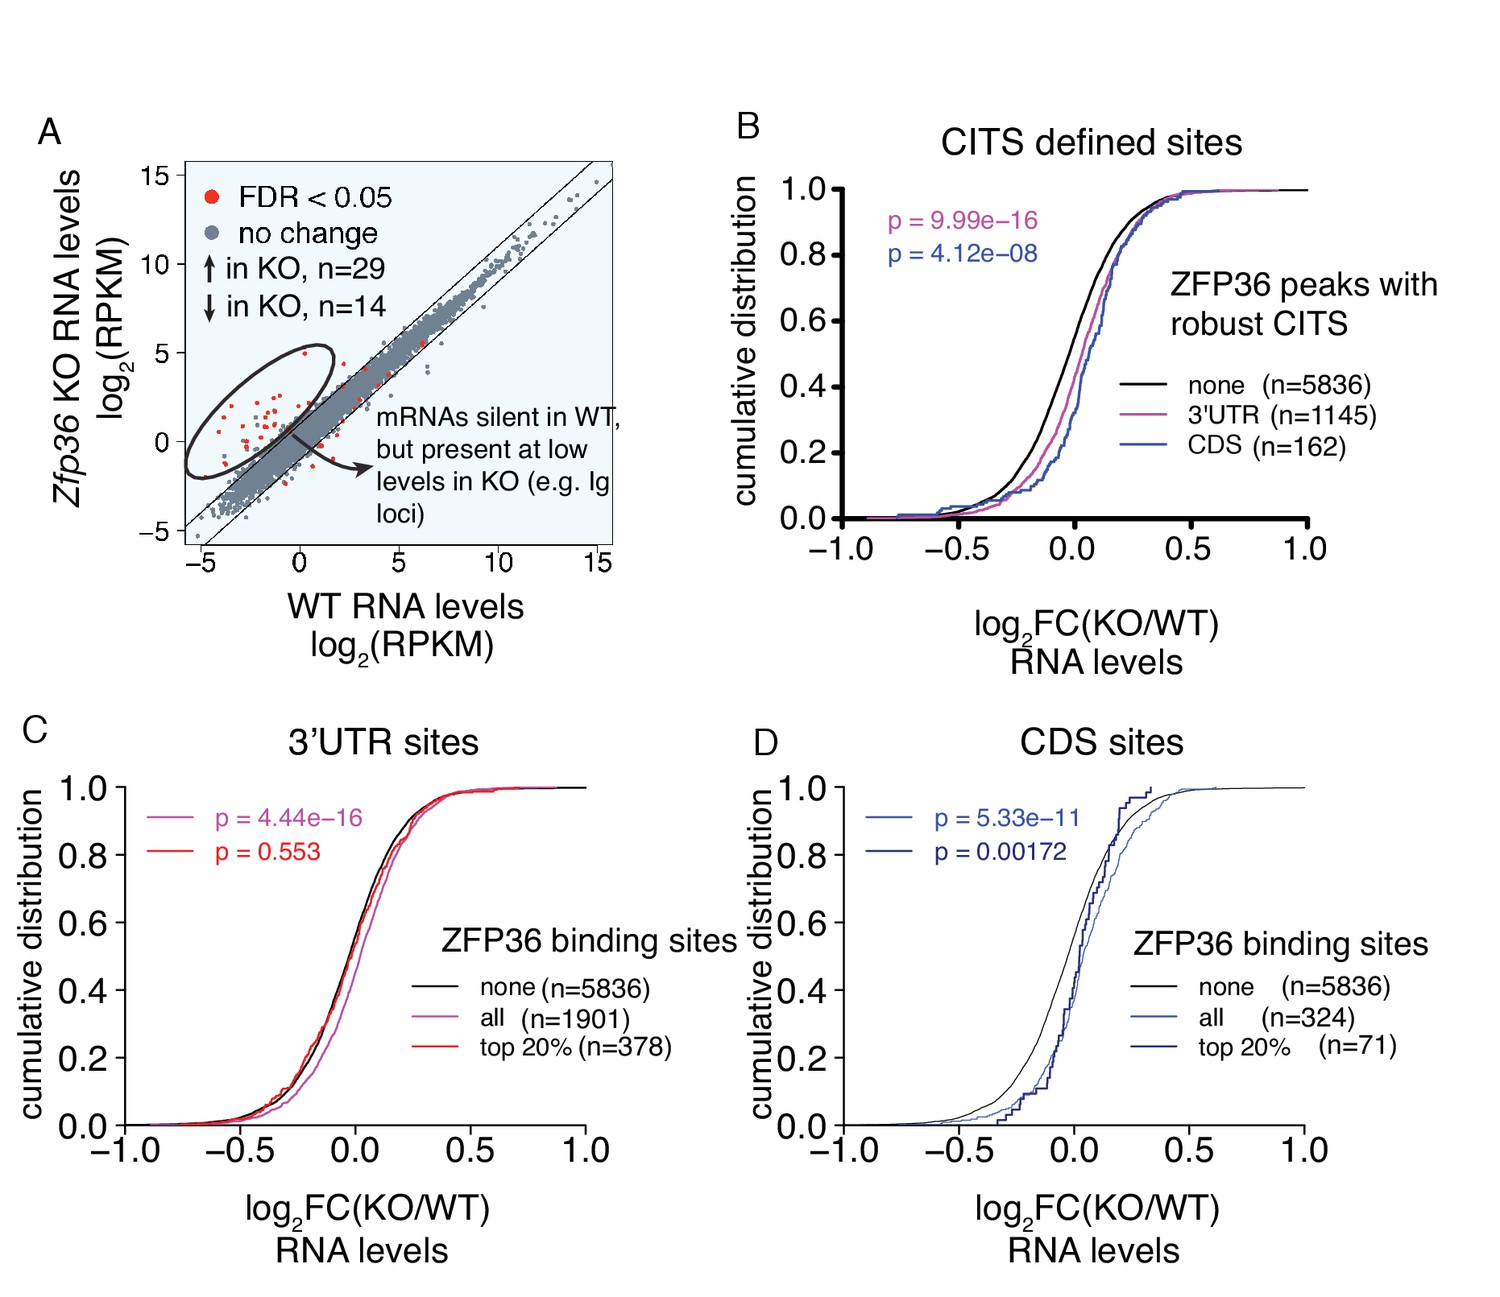
Regulation of mRNA abundance by ZFP36.
(A) Transcriptome profiling data plotted as RPKM in Zfp36 KO cells versus RPKM in WT cells. Few large changes were observed, with the exception of highlighted mRNAs (e.g. Ig mRNAs) that were silent in WT cells, but show expression in KO cells. The absence of CLIP binding sites and ZFP36 consensus motifs in this subset suggests secondary effects. (B) Transcriptome profiling results are depicted as a CDF as in Figure 1 for sites further supported by CITS. (C) Transcriptome profiling results are depicted as a CDF as in Figure 1, further stratified by the magnitude of ZFP36 binding in 3’UTR. 3’UTR target mRNAs overall (violet) show a significant shift relative to non-targets (black), but the top 20% of sites defined by peak height (red) show no significant shift. Numbers of mRNAs in each category (n) and p-values from two-tailed Kolmogorov-Smirnov (KS) tests are shown. (D) Analysis as in (C) for mRNAs with ZFP36 binding in CDS.
Figure 2 with 1 supplement
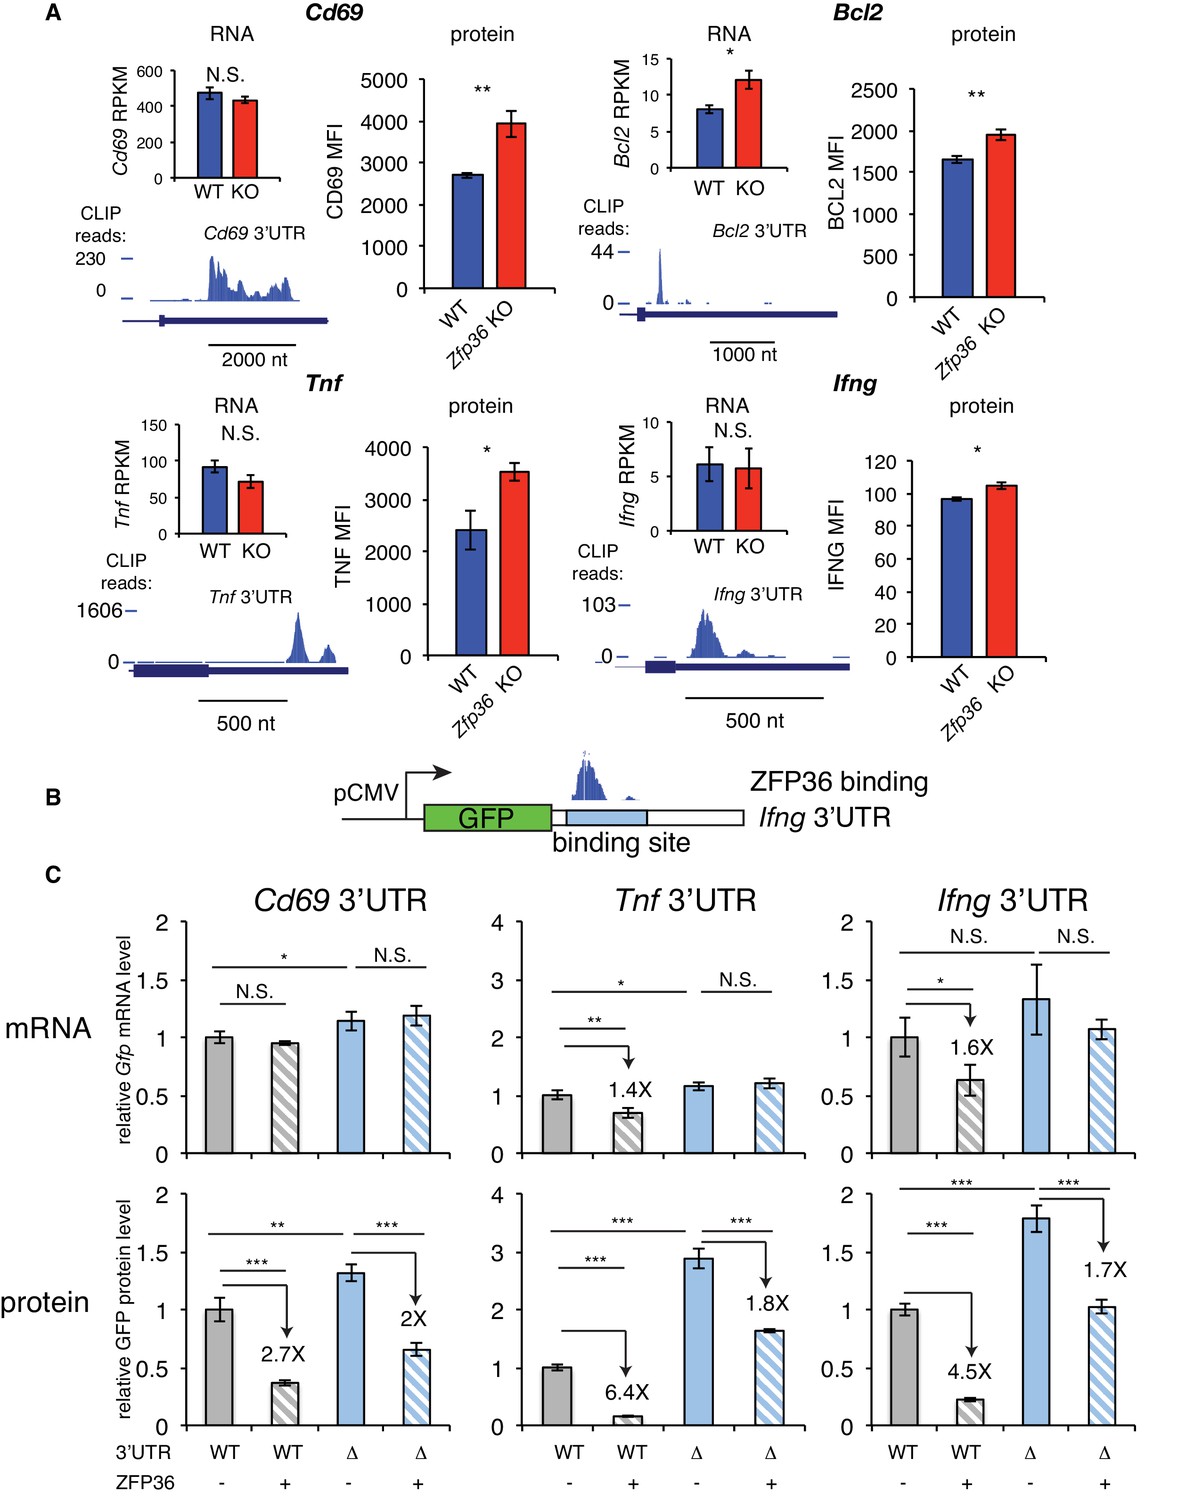
ZFP36 regulates target protein levels in T cells.
(A) Levels of mRNA and protein in Zfp36 KO and WT T cells and ZFP36 CLIP tracks measured 4 hr post-activation for targets with robust 3’UTR ZFP36 binding. RNA values are mean RPKM ± S.E.M. of 4 biological replicates. Protein values are mean fluorescence intensities (MFI) ± S.E.M. for 3–4 mice per condition. (B) Design of GFP reporters with WT 3’UTR (WT-UTR) or one lacking the ZFP36 binding site (Δ-UTR). (C) WT-UTR or Δ-UTR reporters were co-transfected into 293 cells with Zfp36 (+) or vector alone (-). 24 hr post-transfection, reporter mRNA and protein levels were measured by RT-qPCR and flow cytometry, respectively. Values are mean ± S.D. of 4 biological replicates in each condition. Data for Ifng reporters show one representative experiment of three performed. Tnf and Cd69 reporters were analyzed in one experiment. Results of two-tailed t-tests: *=p < 0.05; **=p < 0.01; ***=p < 0.001.
Figure 2—figure supplement 1
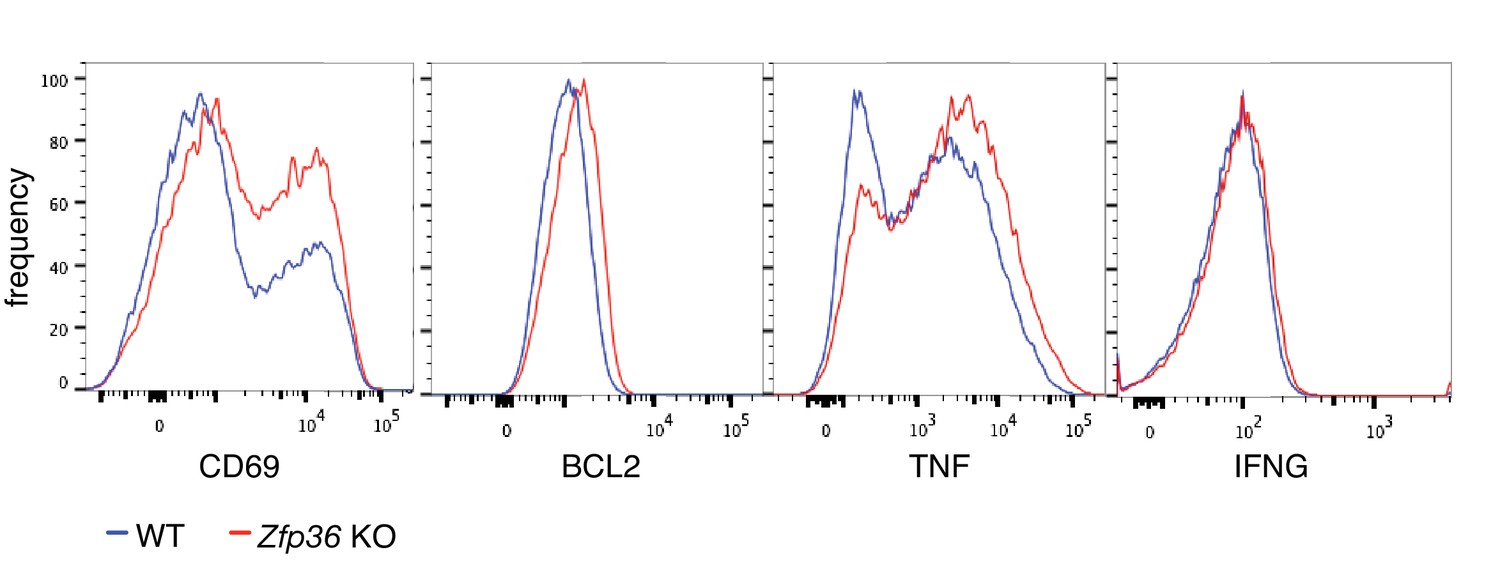
Protein levels of ZFP36 CLIP targets.
Representative flow cytometry data for analyses in Figure 2A.
Figure 3 with 1 supplement
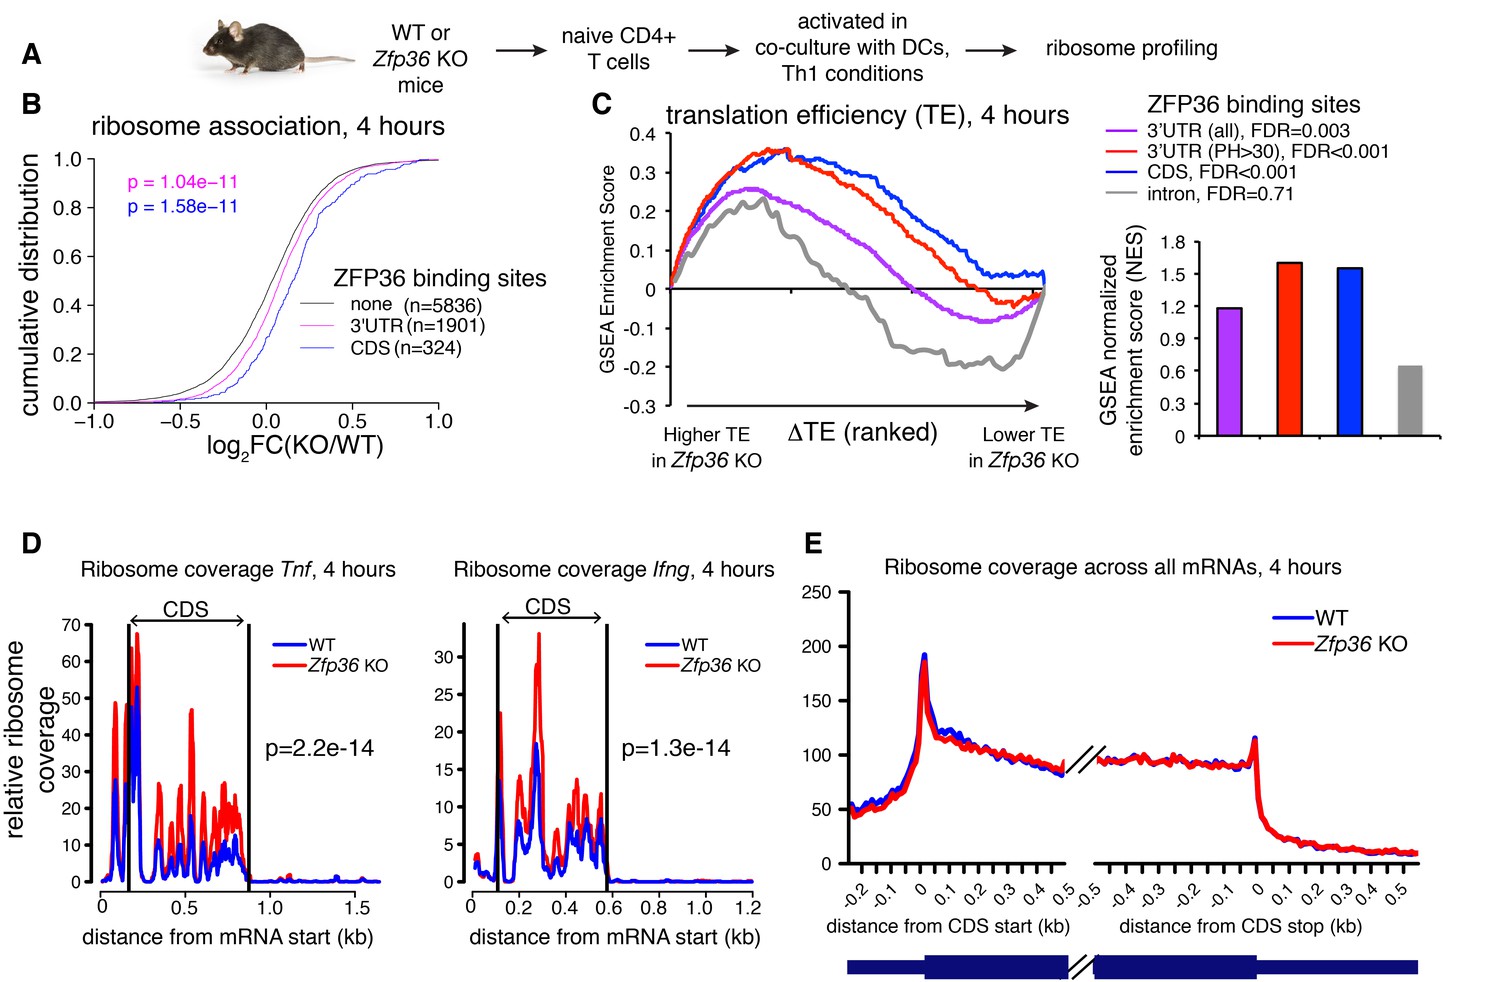
ZFP36 regulates target ribosome association.
(A) Ribosome profiling of Zfp36 KO and WT CD4 +T cells. (B) Changes in ribosome association between Zfp36 KO and WT cells plotted as a CDF. (C) Change in translation efficiency (ΔTE) between Zfp36 KO and WT was calculated as a delta between log2(KO/WT) from ribosome profiling and RNAseq datasets. The distribution of ZFP36 targets in mRNAs ranks by ΔTE is shown (left), along with normalized enrichment scores and FDRs from GSEA (right). Intron-bound mRNAs are shown as a representative gene set that show no enhanced TE in Zfp36 KO cells. (D) Normalized coverage of ribosome profiling reads for Tnf and Ifng mRNAs in Zfp36 KO and WT cells, with p-values from binomial tests. (E) Normalized coverage of ribosome profiling reads across all mRNAs for Zfp36 KO and WT cells. Ribosome profiling data are a compilation of two experiments, with four total biological replicates per conditions.
Figure 3—figure supplement 1
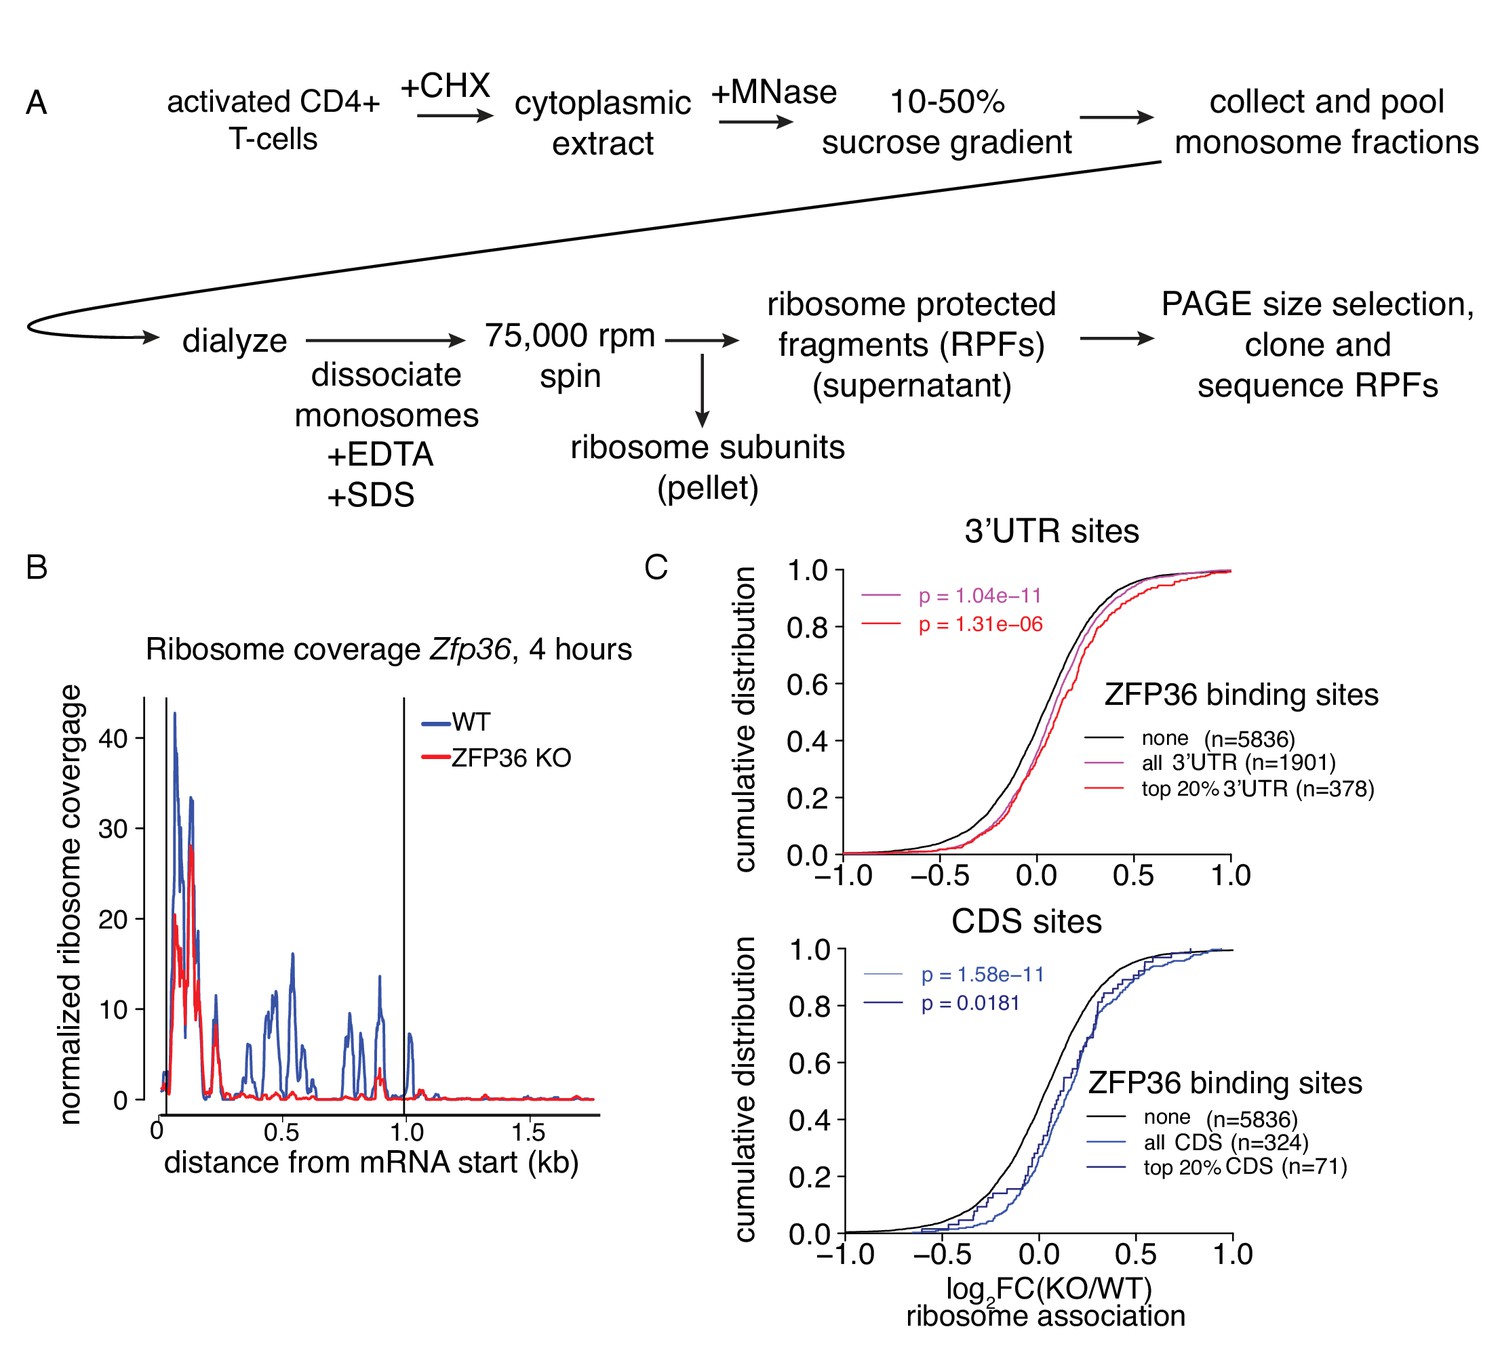
Analysis of ZFP36 translational control by ribosome profiling.
(A) Outline of biochemical strategy to isolate ribosome-protected fragments (RPFs), corresponding to ribosome associated mRNAs. (B) Normalized RPF read coverage is shown for ZFP36 mRNA in WT and Zfp36 KO cells. RPF coverage is lost in Zfp36 KO cells downstream of the site of gene disruption (Taylor et al., 1996), confirming our biochemical strategy faithfully identifies translating mRNAs. (C) Analysis of shifts in ribosome association is shown as in Figure 3B, further stratified by the magnitude of ZFP36 binding. The top 20% of sites (red) show similar shifts to sites overall (violet) for both 3’UTR (top panel) and CDS (bottom panel) in ribosome profiling experiments.
Figure 4 with 2 supplements

ZFP36 regulates T-cell activation kinetics.
(A) Gene expression patterns from a T-cell activation time course (Yosef et al., 2013) were partitioned by k-means, and enrichment of ZFP36 3’UTR and CDS targets was determined across clusters (Fisher’s Exact Test). Mean expression of genes in the three clusters most enriched (left) or depleted (right) for ZFP36 targets is plotted. (B) Enriched GO terms among ZFP36 HITS-CLIP targets (full results in Supplementary File 2). (C) Proliferation of naïve CD4 +Zfp36 KO and WT T cells in the indicated time windows after activation, measured by 3H-thymidine incorporation (D) Fractions of apoptotic annexin-V+ and (E) proliferating Ki67 +CD4+T cells 24 hr post-activation. Mean ± S.E.M. is shown; circles are individual mice (n = 3–4 per genotype). (F) Proliferation of BG2 TCR-transgenic CD4 +T cells cultured with DCs pulsed with cognate (β-gal) or irrelevant (OVA) peptide. Mean ± S.E.M. is shown (n = 5 mice per genotype). (G) Proliferation of CD4 +T cells co-cultured with syngeneic (C57BL6/J) or allogeneic (Balb-c) DCs. Mean ± S.E.M. of three replicate cultures is shown. (H) Levels of CD69 and CD25 after activation of Zfp36 KO and WT naïve CD4 +T cells. Mean ± S.E.M. is shown (n = 3–4 mice per genotype). (I) Naïve and effector subsets 40 hr post-activation in Zfp36 KO and WT CD4 +T cells. Representative plots are shown (top), along with mean ± S.E.M and circles for individual mice (n = 4 per genotype). For (C–I), results of two-tailed t-tests: *=p < 0.05; **=p < 0.01; ***=p < 0.001. Data are representative of three (H) or two (C–G, I) independent experiments.
Figure 4—figure supplement 1
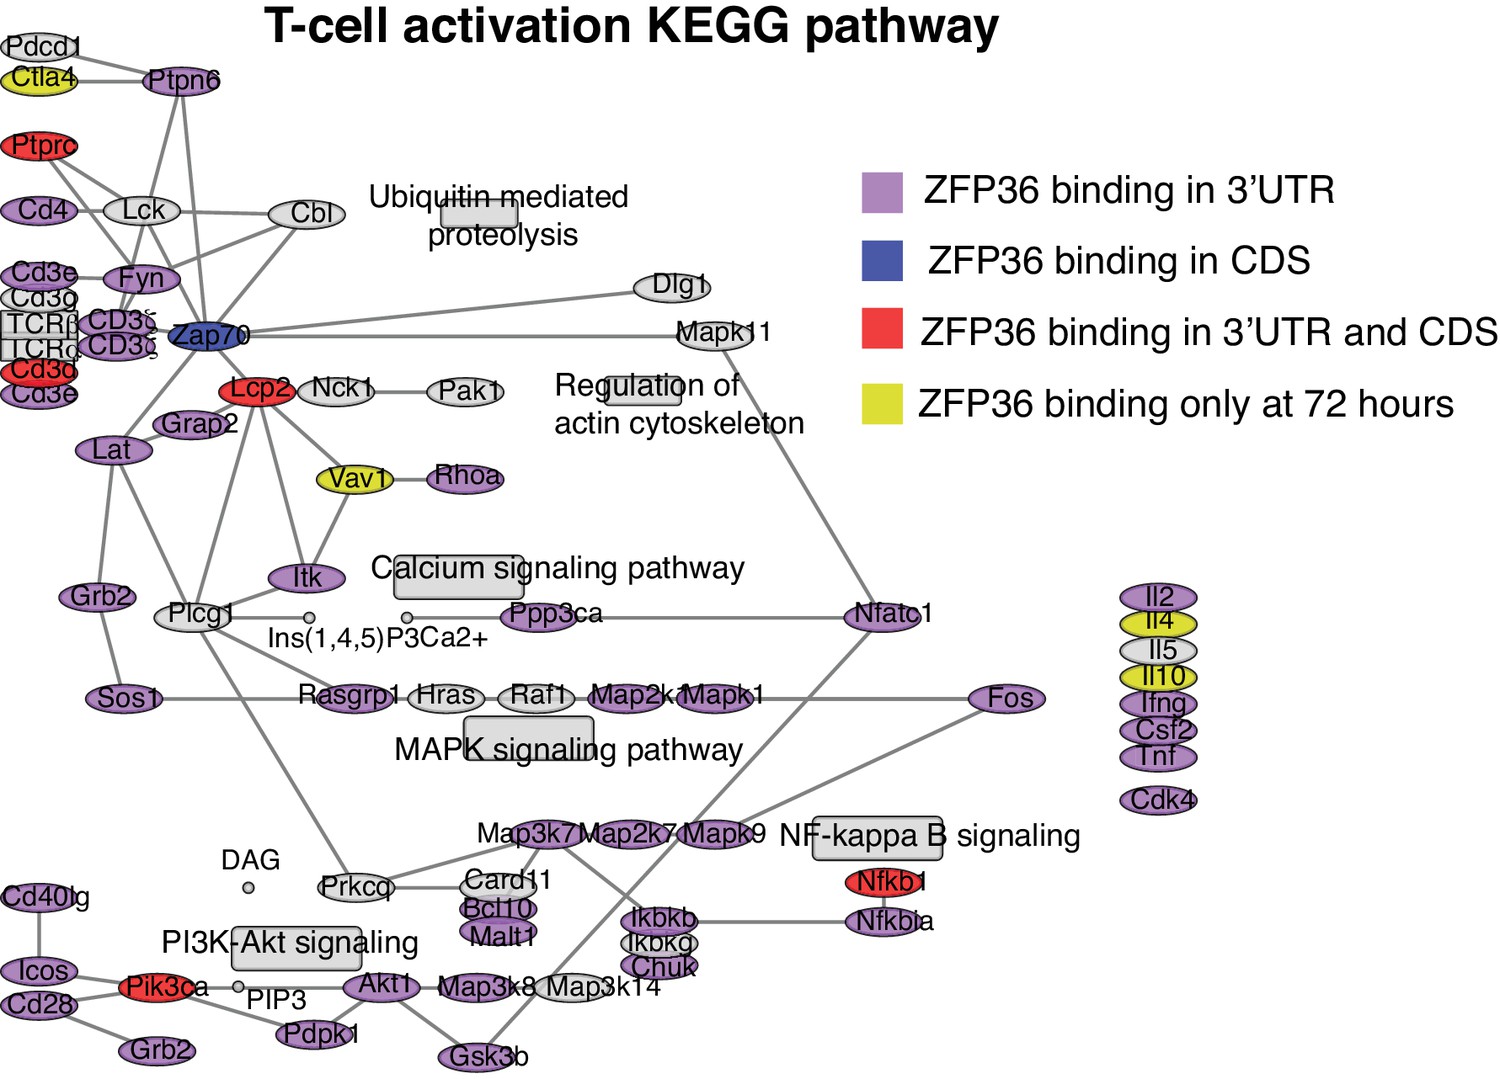
ZFP36 targets regulate T-cell activation.
The T cell activation KEGG pathway is shown with robust ZFP36 CLIP targets shaded based on the location and timing of ZFP36 binding.
Figure 4—figure supplement 2

ZFP36 regulates early activation across T cell lineages.
(A) Measurement of proliferation after activation of CD8 +T cells, varying TCR signal strengths (anti-CD3); co-stimulation (DCs); and the presence of recombinant IL-2. The mean c.p.m. ± S.E.M. of three replicate cultures per condition is shown. (B) Measurement of proliferation by thymidine incorporation after activation of naïve CD4 +T cells is shown in the presence or absence of excess recombinant IL-2; the presence of neutralizing IL-2 antibodies; and (C) under various Th skewing conditions. Mean ± S.E.M. is shown, with circles indicating individual mice (n = 3–4 per genotype). For (A–C), results of two-tailed t-tests are shown above relevant comparisons: *=p < 0.05; **=p < 0.01; ***=p < 0.001. One representative experiment of two performed is shown.
Figure 5
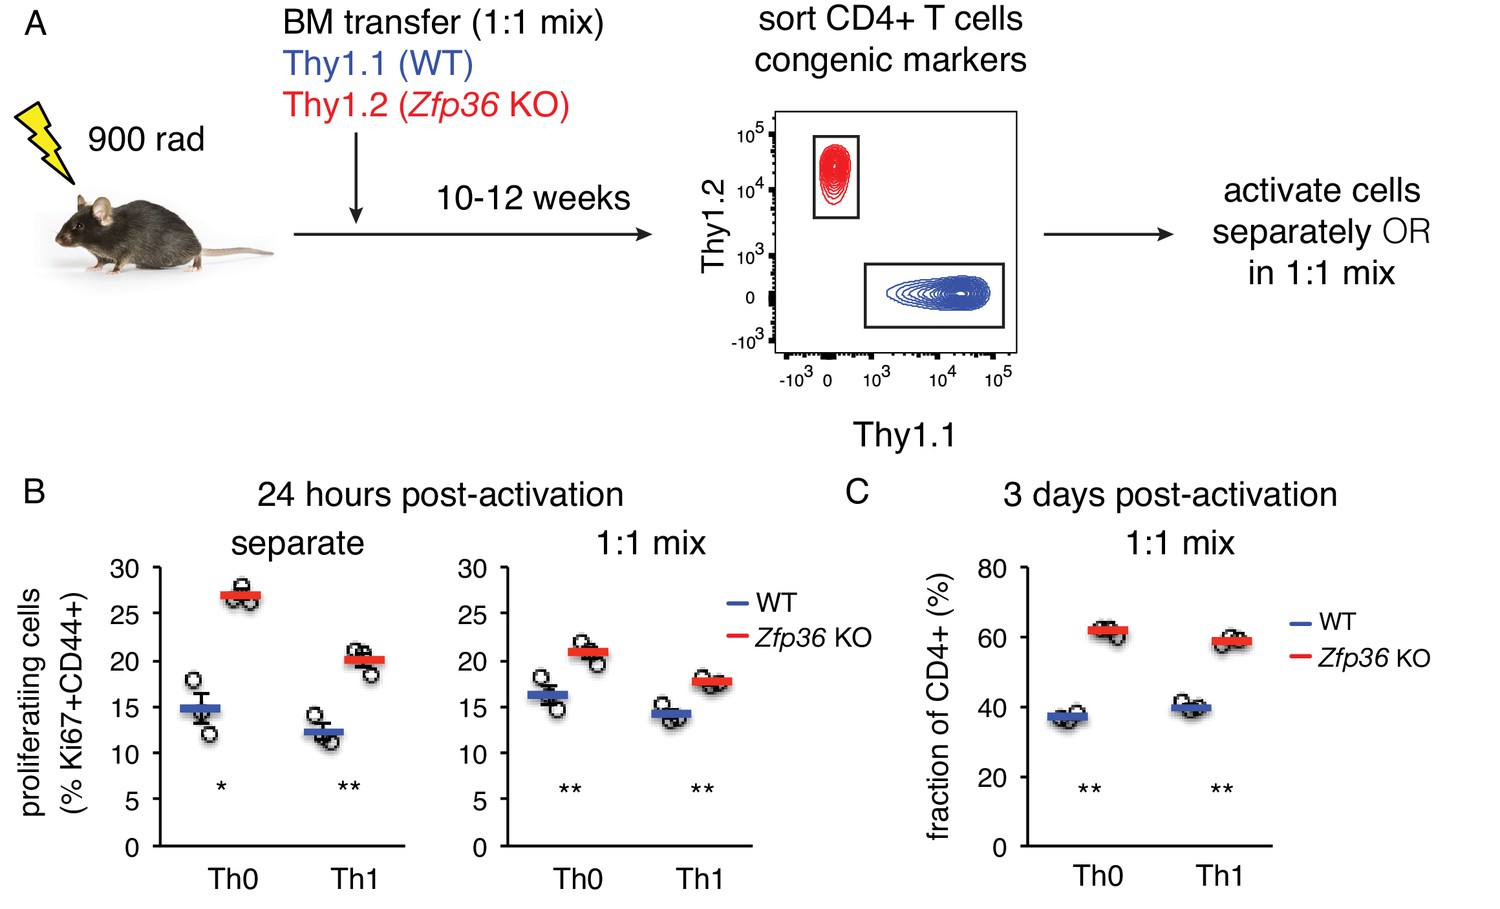
ZFP36 regulation of T cell activation kinetics cell-intrinsic.
(A) Lethally irradiated mice were reconstituted with congenically marked WT and Zfp36 KO BM to generate mixed chimeras. 10–12 weeks after reconstitution, naïve CD4 +WT and Zfp36 KO T cells were sorted, then activated ex vivo separately or mixed 1:1. (B) Proliferating Ki67 +cells were measured 24 hr after activating naïve CD4 +T cells under Th0 or Th1 conditions. (C) Cultures with a 1:1 starting ratio of naïve WT and Zfp36 KO CD4 +T cells were examined 3 days post-activation. Data from one experiment of two performed are shown.
Figure 6 with 2 supplements
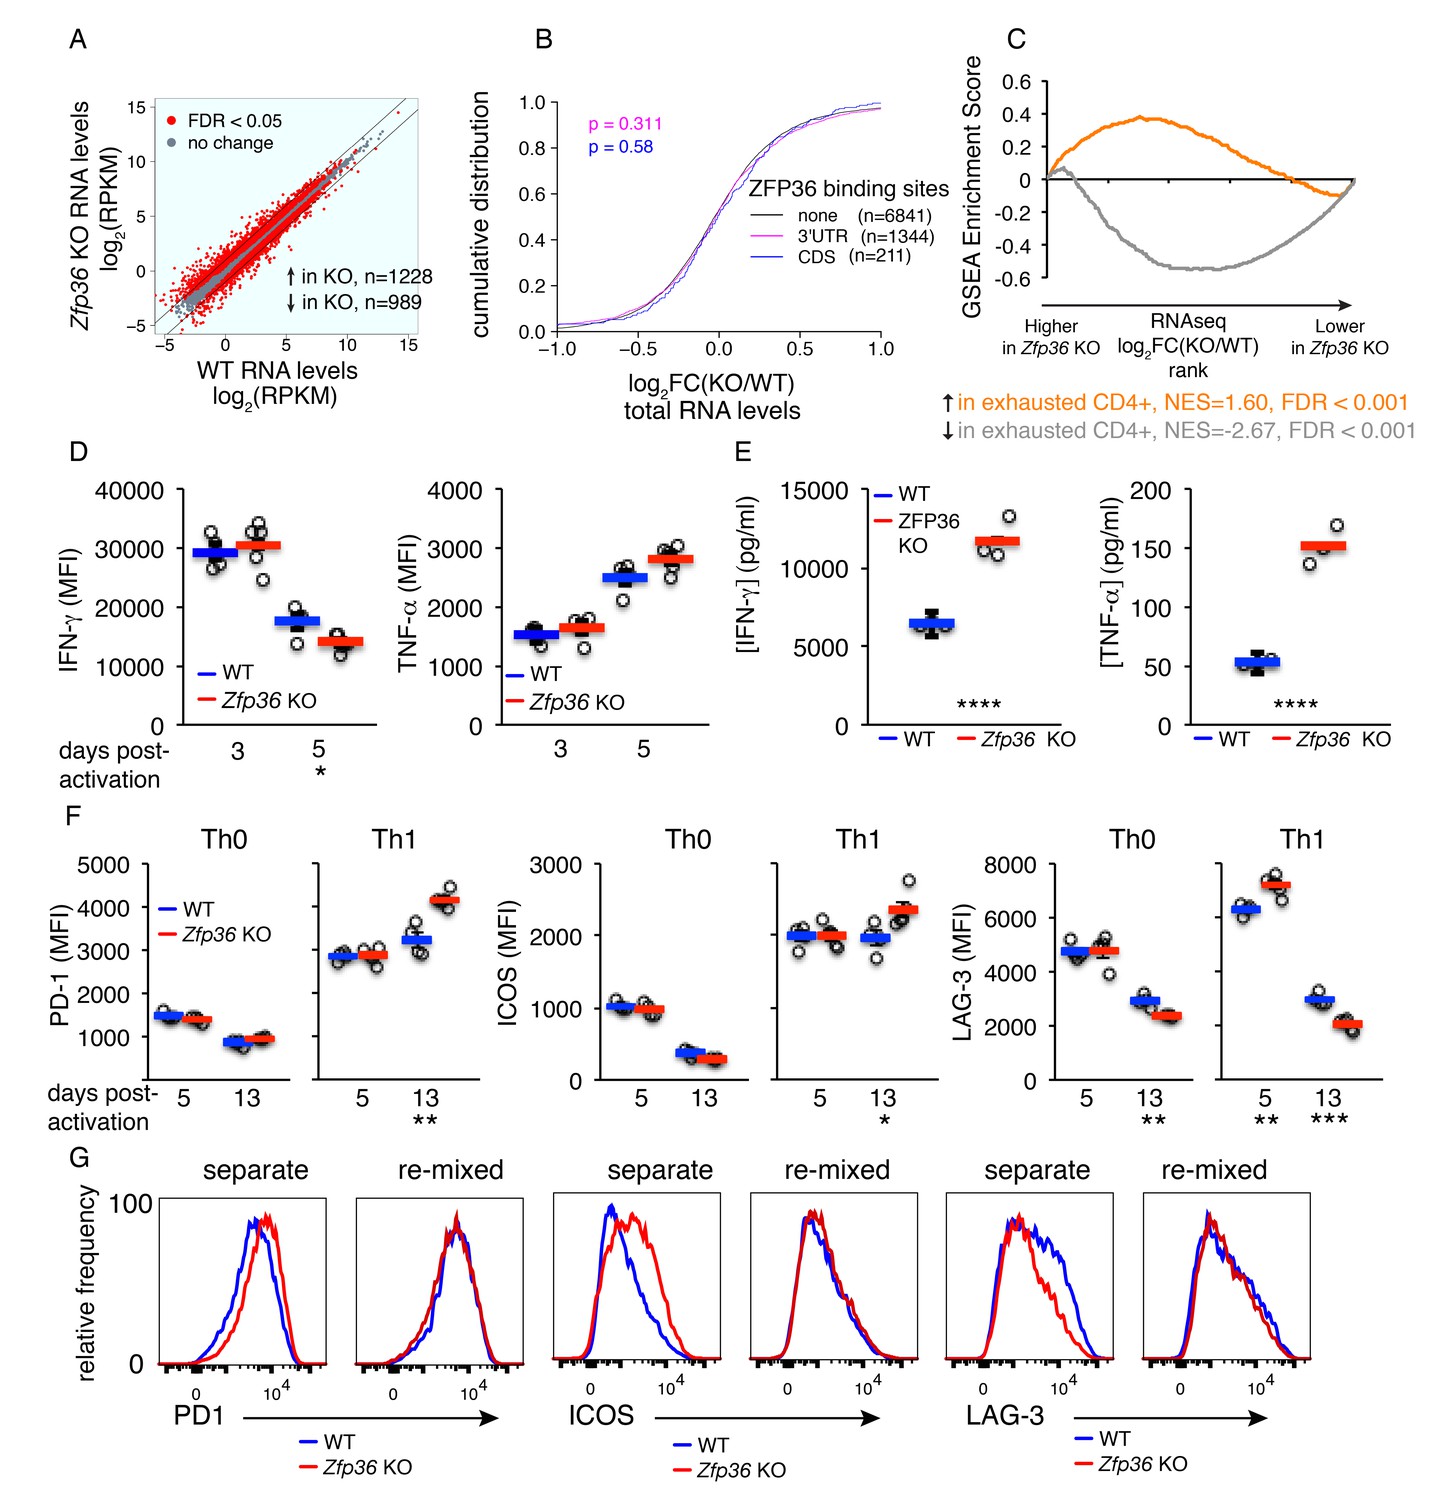
Accelerated signs of in vitro T cell exhaustion in absence of ZFP36.
(A) Log2-transformed RPKM values from Zfp36 KO versus WT CD4 +Th1 cell RNAseq 72 hr post-activation, with red indicating differential expression (FDR < 0.05). Lines mark 2-fold changes. RNAseq data represent one experiment with three biological replicates per condition. (B) Log2-transformed fold-changes (KO/WT) plotted as a CDF, for mRNAs with 3’UTR, CDS, or no significant ZFP36 HITS-CLIP. Numbers of mRNAs in each category (n) and p-values from KS tests are indicated. (C) The gene expression profile in Zfp36 KO CD4 +T cells 72 hr post-activation was compared to reported profiles of CD4 +T cell exhaustion using GSEA. Upregulated (orange) and downregulated (gray) gene sets in exhausted T cells showed strong overlap with corresponding sets from Zfp36 KO T cells (FDR < 0.001, hypergeometric test). (D) IFN-γ and TNF-α measured by ICS 3 and 5 days after activation of naïve CD4 +T cells. (E) IFN-γ and TNF-α in culture supernatants 3 and 5 days after activation of naïve CD4 +T cells. (F) PD-1, ICOS, and LAG-3 expression 5 and 13 days after activation under Th0 or Th1 conditions. (D–F) show mean ± S.E.M.; circles are individual mice (n = 3–5 per genotype). (G) Measurements as in (F) for Zfp36 KO and WT CD4 +T cells derived from mixed BM chimeras. Cells were activated under Th1 conditions for 13 days, either separately or mixed 1:1. For (D–G), one representative experiment of two performed is shown. Results of two-tailed t-tests: *=p < 0.05; **=p < 0.01; ***=p < 0.001; ****=p < 0.0001.
Figure 6—figure supplement 1
Analysis of ZFP36 function 3 days after T cell activation.
(A) Top enriched motifs and (B) annotation of ZFP36 HITS-CLIP sites from CD4 +T cells activated for 3 days under Th1 conditions. Site distribution was similar to the 4 hr time point, except for increased intronic binding, which may reflect increased nuclear permeability in these rapidly cycling cultures.
Figure 6—figure supplement 2
Dysfunction of Zfp36 KO T cells at late time points.
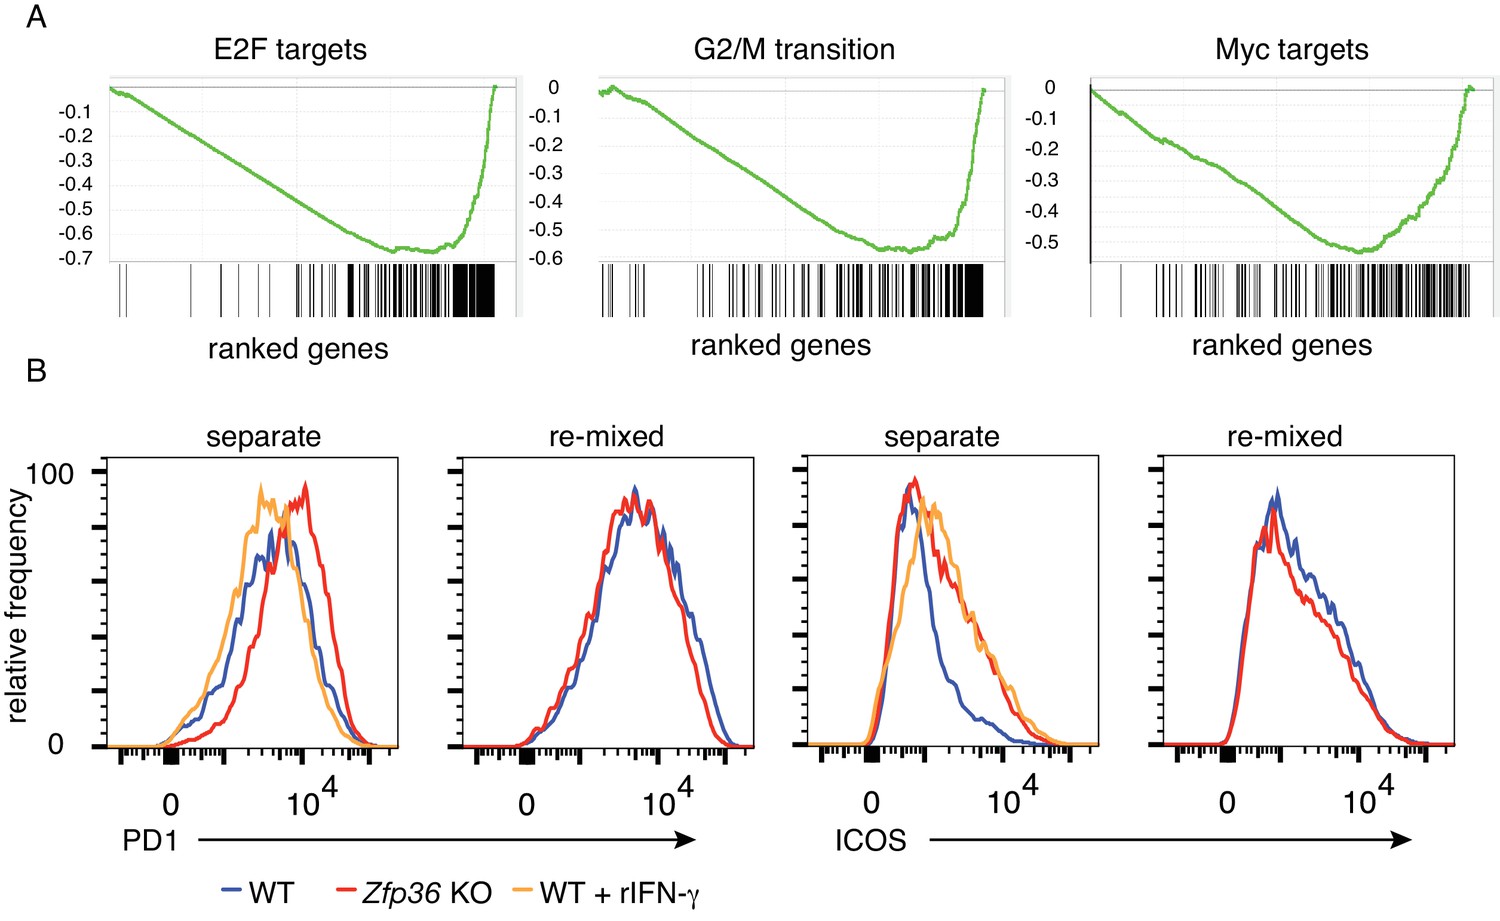
(A) GSEA analysis found that genes promoting proliferation and cell division, including transcriptional targets of E2F and Myc, were down-regulated in Zfp36 KO Th1 cells versus WT 3 days after activation. Enrichment score distributions are plotted, with the distribution of interrogates genes shown below. (B) WT and Zfp36 KO CD4 +T cells sorted from mixed BM chimeras were analyzed for PD-1 and ICOS expression after long-term (13 days) activation under Th1 conditions. Separated cultures of WT and Zfp36 KO confirmed differential expression of these receptors, but expression was similar in 1:1 ‘re-mixed’ cultures. Adding recombinant IFN-γat 20 ng/ml (similar to levels measured in KO culture supernatants) did not shift PD-1 expression in WT cells toward levels observed in Zfp36 KO, but did so for ICOS expression. Data from one representative experiment of two are shown.
Figure 7 with 3 supplements

ZFP36 regulates anti-viral immunity.
(A) Virus-specific CD4 + or (B) CD8 +T cells were tracked in peripheral blood using MHC-tetramers after LCMV Armstrong infection (n = 8–9 mice per genotype). (C) Virus-specific CD4 +T cells and CD69 expression on CD4 +T cells in peripheral blood at early time points post-infection (p.i.) (n = 7–8 mice per genotype). (D) Virus-specific CD8 +T cells and CD69 expression on CD8 +T cells in peripheral blood at early time points p.i. (n = 7–8 mice per genotype). (E) Virus-specific CD4 +and (F) CD8 +T cells in spleen after LCMV infection (n = 5–8 mice per genotype). (G) Fraction of CD4 +T cells producing IFN-γ and TNF-α in splenic CD4 +T cells 6 days p.i., after ex vivo stimulation with GP66-77 peptide (n = 7–8 mice per genotype). (H) Levels of IFN-γ and TNF-α(gated on cytokine-producing CD4 +cells) 6 days p.i. after ex vivo stimulation with GP66-77 (n = 7–8 mice per genotype). (I) Raw percentage of bifunctional IFN-γ+TNF-α+CD4+cells in spleen 6 days p.i. after ex vivo stimulation with GP66-77 (left), or normalized to percentage of GP66-77 tetramer +cells (n = 7–8 mice per genotype). (J) Levels of LCMV genomic RNA in spleen measured by RT-qPCR (n = 9–14 per group). For (A–J), mean values ± S.E.M. are shown, with circles as individual mice. Results of two-tailed t-tests: *=p < 0.05; **=p < 0.01; ***=p < 0.001; ****=p < 0.0001. In each panel, one representative experiment of two is shown.
Figure 7—figure supplement 1

The T cell compartment in naïve Zfp36 KO mice is largely normal.
(A) Counts of CD4 +and CD8+T cells in peripheral blood of WT and Zfp36 KO mice (n = 9–10 per genotype). Mean values ± S.E.M are shown; circles are individual mice (n = 9–10 per genotype) (B) Counts of thymocytes and distribution among T cell development stages in WT and Zfp36 KO mice (n = 11 per genotype; DN = double negative; DP = double positive; CD4-SP = CD4 single positive; CD8-SP = CD8 single positive) (C) Counts of CD4 + and CD8+T cells in spleen or (D) as a proportion of splenocytes in WT and Zfp36 KO mice (n = 5 mice per genotype). (E) Percentages of naïve CD4 +and CD8+T cells in spleen, defined as CD25-CD62L-hiCD44-lo (n = 11 per genotype). For (A–E), mean values ± S.E.M are shown with circles as individual mice. (F) Percentages of CD4 +CD25 hi cells in spleen (n = 11 per genotype). For (A–F), mean values ± S.E.M are shown with circles as individual mice. (G) Percentages of FoxP3 +iTreg cells from WT and Zfp36 KO FoxP3-GFP transgenic mice indicated skewing conditions (mean ±S.E.M. is shown for n = 2 mice per genotype). (H) Percentages of CD4 + and CD8+cells producing the indicated cytokines by intracellular flow cytometry, following 5 hr of PMA/ionomycin stimulation of splenocytes directly ex vivo (mean ± S.E.M. is shown for n = 6 per genotype). (I) Percentages of CD4 +T cells producing the indicated lineage-specific effector cytokines is shown under various skewing conditions (mean ± S.E.M. is shown for n = 3 mice per genotype). For (A–I) results of two-tailed t-tests are shown beneath relevant panels when significant differences were observed: *=p < 0.05. Otherwise, differences were not significant.
Figure 7—figure supplement 2

ZFP36 regulates anti-viral immunity.
(A) The fraction of CD8 +T cells producing IFN-γ and IFN-γ proteins levels were measured splenic CD8 +T cells by ICS 6 days post-infection, after ex vivo stimulation with the LCMV antigenic peptide GP33-41 (n = 5–7 per genotype). (B) The fraction of CD8 +T cells producing TNF-α and TNF-α proteins levels were measured in splenic CD8 +T cells by ICS 6 days post-infection, after ex vivo stimulation with the LCMV antigenic peptide GP33-41 (n = 5–7 per genotype). (C) The raw percentage of bifunctional IFN-γ+TNF-α+CD8+cells in spleen 6 days post-infection after ex vivo stimulation with GP33-41 (left), or normalized to percentage of GP33-41 tetramer +cells (right) (n = 5–7 per genotype). (D) Plots depicting the relationship between LCMV load and levels of tetramer +virus specific T cells in spleens of WT and Zfp36 KO animals, 6 days post-infection. R-squared and p-values are shown for linear regression analysis. For (A–D), mean values ± S.E.M are shown with circles as individual mice. Results of two-tailed t-tests are shown beneath relevant panels when significant differences were observed: *=p < 0.05; **=p < 0.01; ***=p < 0.001, ****=p < 0.0001. Data from one representative experiment of two are shown.
Figure 7—figure supplement 3
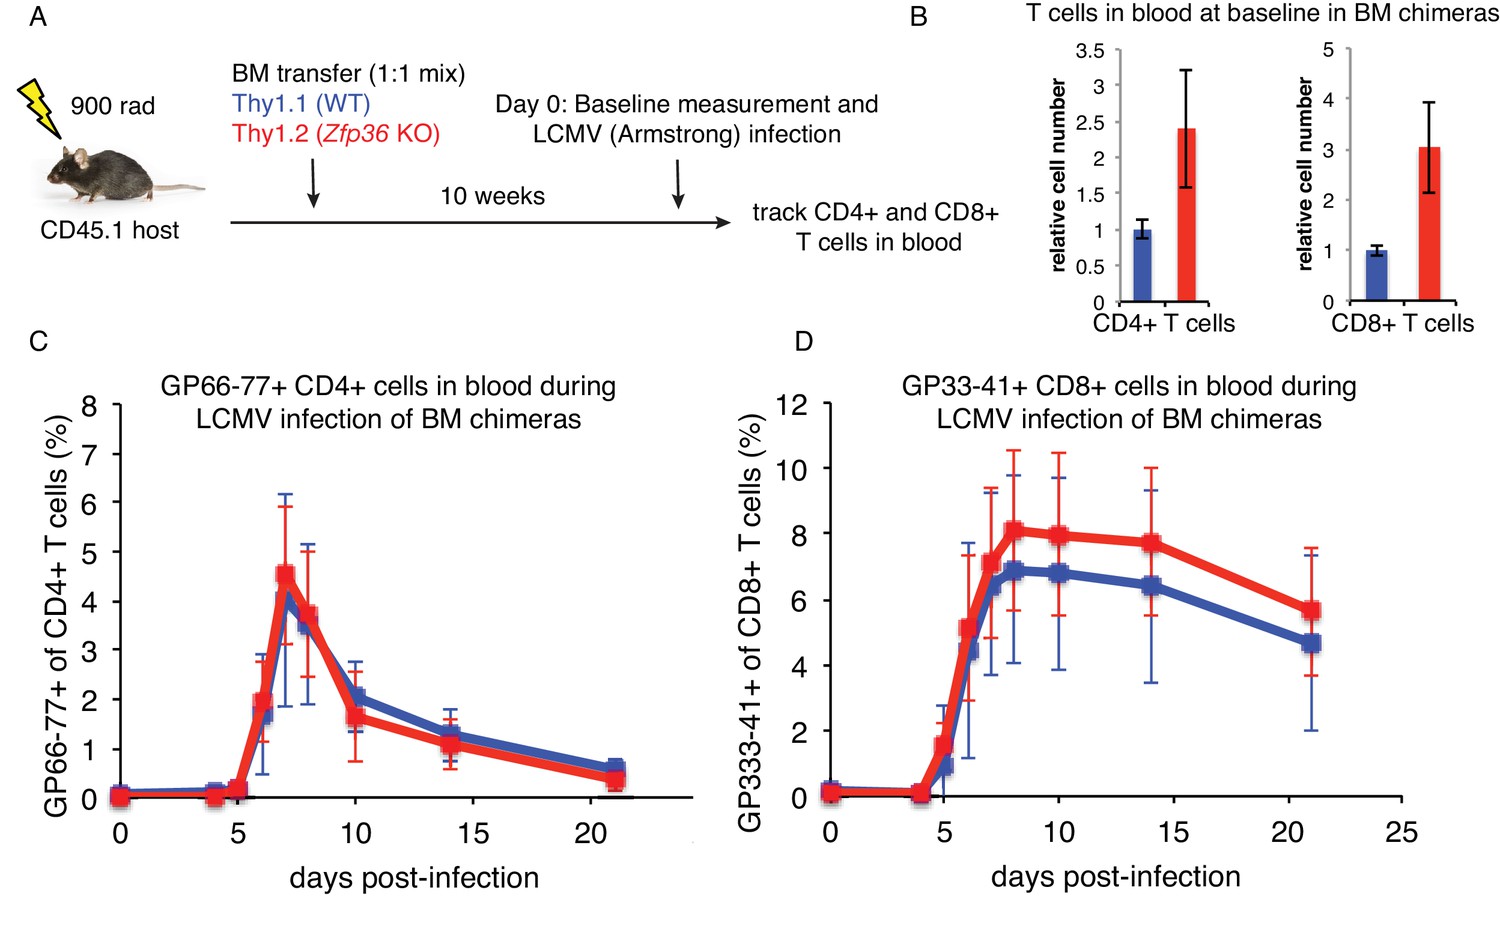
LCMV infection in mixed bone marrow chimeras.
(A) Schematic of mixed chimeric experiments. (B) Analysis of T cell numbers in peripheral blood in mixed bone marrow chimeras 10 weeks after constitution. Values were normalized to levels of Thy1.1 WT T cells, and the mean ± S.D. are shown (n = 15 mice). (C) Levels of LCMV-specific CD4 + and (D) CD8 +T cells were determined in peripheral blood by MHC-tetramer staining over a time course of LCMV Armstrong infection. Values are mean ± S.D (n = 15 mice). Data are shown for one representative experiment. A second experiment analyzing d0-d10 showed similar results.
Author response image 1
Author response image 2
Tables
Key resources table
| Reagent type (species) or resource | Designation | Source or reference | Identifiers | Additional information |
|---|---|---|---|---|
| Gene (Mus musculus) | Zfp36 | NA | Entrez ID: 22695 | |
| Gene (M. musculus) | Zfp36l1 | NA | Entrez ID: 12192 | |
| Gene (M. musculus) | Zfp36l2 | NA | Entrez ID: 12193 | |
| Strain (M. musculus), strain background (C57BL6/J) | C57BL6/J | Jackson Laboratory | Stock No: 000664 | |
| Strain (M. musculus), strain background (C57BL6/J) | ZFP36 KO | PMID:8630730 | gift from P. Blackshear | |
| Strain (M. musculus), strain background (C57BL6/J) | BG2 | PMID:19478869 | gift from N. Restifo | |
| Strain (M. musculus), strain background (C57BL6/J) | Thy1.1 | Jackson Laboratory | Stock No: 000406 | |
| Strain (M. musculus), strain background (C57BL6/J) | CD45.1 | Jackson Laboratory | Stock No: 002014 | |
| Strain (M. musculus), strain background (C57BL6/J) | FoxP3-EGFP | Jackson Laboratory | Stock No: 006769 | |
| Strain (Lymphocytic Choriomeningitis Virus, LCMV), strain background (Armstrong) | LCMV Arm | PMID:6875516 | ||
| Cell line (Homo sapien) | 293 T-rex | Life Technologies | Cat# R71007 | |
| Cell line (H. sapien) | 293T | ATCC | ATCC Cat# CRL-3216, RRID:CVCL_0063 | |
| Cell line (M. musculus) | J558L/GM-CSF | PMID:1460426 | ||
| Transfected construct (M. musculus) | pOZ-N-FH-ZFP36 | This study | mouse Zfp36 ORF in pOZ-N vector | |
| Transfected construct (M. musculus) | pOZ-N-FH-ZFP36L1 | This study | mouse Zfp36l1 ORF in pOZ-N vector | |
| Transfected construct (M. musculus) | pOZ-N-FH-ZFP36L2 | This study | mouse Zfp36l2 ORF in pOZ-N vector | |
| Transfected construct | pOZ-N-FH vector | PMID:14712665 | ||
| Transfected construct | pcDNA3.1(+) | Life Technologies | Cat# V79020 | |
| Transfected construct | pcDNA3.1(+)-Acgfp1- IFNG-WT-UTR | This paper | Acgfp1 with mouse Ifng 3'UTR | |
| Transfected construct | pcDNA3.1(+)-Acgfp1- IFNG-WT-UTR | This paper | Acgfp1 with mouse Ifng 3'UTR with Zfp36 binding site deleted | |
| Transfected construct | pcDNA5/FRT/TO | Life Technologies | Cat# V652020 | |
| Transfected construct | pcDNA5/FRT/TO/ Acgfp1-TNF-WT-UTR | This paper | Acgfp1 with mouse Tnf 3'UTR | |
| Transfected construct | pcDNA5/FRT/TO/ Acgfp1-TNF-Δ-UTR | This paper | Acgfp1 with mouse Tnf 3'UTR with Zfp36 binding site deleted | |
| Transfected construct | pcDNA5/FRT/TO/ Acgfp1-CD69-WT-UTR | This paper | Acgfp1 with mouse Cd69 3'UTR | |
| Transfected construct | pcDNA5/FRT/TO/ Acgfp1-CD69-Δ-UTR | This paper | Acgfp1 with mouse Cd69 3'UTR with Zfp36 binding site deleted | |
| Antibody | Rabbit anti-pan- ZFP36 RF2046 | This paper | Covance custom service | 1:2000 for Western |
| Antibody | Rabbit anti-pan- ZFP36 RF2047 | This paper | Covance custom service | 1:2000 for Western |
| Antibody | anti-Br-dU | Millipore | Millipore Cat# MAB3222; RRID:AB_11212494 | 5 μg per IP |
| Antibody | rabbit anti-TTP/ZFP36 | Sigma | Sigma-Aldrich Cat# T5327; RRID:AB_1841222 | 1:500 |
| Antibody | rabbit anti-ZFP36L1/2 (BRF1/2) | CST | Cell Signaling Technology Cat# 2119S; RRID:AB_10695874 | 1:500 |
| Antibody | mouse anti-FLAG | Sigma | Sigma-Aldrich Cat# F3165; RRID:AB_259529 | 1:500 |
| Antibody | mouse anti-FUS | Santa Cruz | Santa Cruz Biotechnology Cat# sc-47711; RRID:AB_2105208 | 1:1000 |
| Antibody | rabbit anti-FUS | Novus | Novus Cat# NB100-562; RRID:AB_10002858 | 1:10000 |
| antibody | goat anti-rabbit-IgG- 680RD | LICOR | LI-COR Biosciences Cat# 925–68071; RRID:AB_2721181 | 1:25000 |
| Antibody | goat anti-rabbit-IgG- 800CW | LICOR | LI-COR Biosciences Cat# 925–32211; RRID:AB_2651127 | 1:25000 |
| Antibody | goat anti-mouse-IgG- 800CW | LICOR | LI-COR Biosciences Cat# 925–32210; RRID:AB_2687825 | 1:25000 |
| Antibody | anti-CD4-PerCP-Cy5.5 | BD Biosciences | BD Biosciences Cat# 550954; RRID:AB_393977 | 1:400 |
| Antibody | anti-CD25-PE/Cy7 | Biolegend | BioLegend Cat# 102016; RRID:AB_312865 | 1:400 |
| Antibody | anti-CD62L-APC | BD Biosciences | BD Biosciences Cat# 561919; RRID:AB_10895379 | 1:800 |
| Antibody | anti-CD44-PE | BD Biosciences | BD Biosciences Cat# 560569; RRID:AB_1727484 | 1:1000 |
| Antibody | anti-CD8-BV510 | Biolegend | BioLegend Cat# 100752; RRID:AB_2563057 | 1:400 |
| Antibody | anti-Thy1.2-BUV395 | BD Biosciences | BD Biosciences Cat# 565257 | 1:200 |
| Antibody | anti-Thy1.1-FITC | Biolegend | BioLegend Cat# 202504; RRID:AB_1595653 | 1:400 |
| Antibody | anti-CD19-eFlour780 | eBiosciences | Thermo Fisher Scientific Cat# 47-0193-82; RRID:AB_10853189 | 1:200 |
| Antibody | anti-CD11b-eFlour780 | eBiosciences | Thermo Fisher Scientific Cat# 47-0112-82; RRID:AB_1603193 | 1:200 |
| Antibody | anti-CD11c-eFlour780 | eBiosciences | Thermo Fisher Scientific Cat# 47-0114-80; RRID:AB_1548663 | 1:100 |
| Antibody | anti-NK1.1-eFlour780 | eBiosciences | Thermo Fisher Scientific Cat# 47–5941; RRID:AB_10853969 | 1:100 |
| Antibody | anti-CD69-FITC | Biolegend | BioLegend Cat# 104506; RRID:AB_313109 | 1:200 |
| Antibody | anti-BCL2-PE/Cy7 | Biolegend | BioLegend Cat# 633512; RRID:AB_2565247 | 1:200 |
| Antibody | anti-TNF-APC/Cy7 | BD Biosciences | BD Biosciences Cat# 560658; RRID:AB_1727577 | 1:200 |
| Antibody | anti-IFNG-Alexa647 | BD Biosciences | BD Biosciences Cat# 557735; RRID:AB_396843 | 1:1000 |
| Antibody | anti-Ki67-PE/Cy7 | Biolegend | BioLegend Cat# 652426; RRID:AB_2632694 | 1:200 |
| Antibody | anti-CD44-BUV737 | BD Biosciences | BD Biosciences Cat# 564392 | 1:400 |
| Antibody | anti-PD-1-PE/Cy7 | Biolegend | BioLegend Cat# 135216; RRID:AB_10689635 | 1:200 |
| Antibody | anti-LAG3-APC | Biolegend | BioLegend Cat# 125210; RRID:AB_10639727 | 1:200 |
| Antibody | anti-ICOS-PE | Biolegend | BioLegend Cat# 107706; RRID:AB_313335 | 1:200 |
| Antibody | anti-mouse-IL-2 (neutralizing) | Biolegend | BioLegend Cat# 503705; RRID:AB_11150768 | 10 μg/ml |
| Antibody | anti-mouse-CD3e (stim) | Biolegend | BioLegend Cat# 100314; RRID:AB_312679 | 0.25 μg/ml |
| Antibody | anti-mouse-CD28 (co-stim) | Biolegend | BioLegend Cat# 102112; RRID:AB_312877 | 1 μg/ml |
| Other, MHC tetramer | LCMV GP33-41-specific H-2Db- MHC-tetramer, PE conjugate | MBL | Cat# TS-M512-1 | 1:400 |
| Other, MHC tetramer | LCMV GP66-77-specific I-Ab- MHC-tetramer, APC conjugate | NIH Tetramer Core Facility | 1:300 | |
| Peptide, recombinant protein | LCMV GP33-41 peptide KAVYNFATM | Life Technologies | Custom synthesis | |
| Peptide, recombinant protein | LCMV GP66-77 peptide DIYKGVYQFKSV | Life Technologies | Custom synthesis | |
| Peptide, recombinant protein | Ovalbumin p257 peptide SIINFEKL | Life Technologies | Custom synthesis | |
| Peptide, recombinant protein | Ovalbumin p323 peptide ISQAVHAAHAEINEAGR | Life Technologies | Custom synthesis | |
| Peptide, recombinant protein | Recombinant mouse TNF-α | R and D Systems | Cat# 410-MT-050 | |
| Peptide, recombinant protein | Recombinant human IL-2 | Peprotech | Cat# 200–02 | |
| Peptide, recombinant protein | Recombinant mouse IL-12 | eBiosciences | Cat# 14-8121-80 | |
| Peptide, recombinant protein | Recombinant mouse IL-23 | eBiosciences | Cat# 14-8231-63 | |
| Peptide, recombinant protein | Recombinant mouse IL-6 | eBiosciences | Cat# 14–8061 | |
| Peptide, recombinant protein | Recombinant human TGF-β1 | R and D Systems | Cat# 240-B-010 | |
| Peptide, recombinant protein | T4 Polynucleotide Kinase | New England Biolabs | Cat# M0201L | |
| Peptide, recombinant protein | T4 RNA ligase 2, truncated KQ | New England Biolabs | Cat# M0373L | |
| Peptide, recombinant protein | CircLigase | Epicentre | Cat# CL4115K | |
| Peptide, recombinant protein | Phusion Polymerase | New England Biolabs | Cat# M0530L | |
| Peptide, recombinant protein | Micrococcal nuclease | New England Biolabs | Cat# M0247S | |
| Peptide, recombinant protein | RNAsin Plus | Promega | Cat# N2611 | |
| Peptide, recombinant protein | RNAse A | Affymetrix | Cat# 70194Y | |
| Peptide, recombinant protein | RNAse I | Thermo Fisher | Cat# EN0601 | |
| Peptide, recombinant protein | alkaline phosphatase | Roche | Cat# 10 713 023 001 | |
| Commercial assay or kit | Xtremegene 9 Transfection Reagent | Roche | Cat# 06 365 787 001 | |
| Commercial assay or kit | Mouse CD4 microbeads | Miltenyi | Cat# 130-049-201 | |
| Commercial assay or kit | Mouse CD8 microbeads | Miltenyi | Cat# 130-049-401 | |
| Commercial assay or kit | Mouse CD11c microbeads | Miltenyi | Cat# 130-108-338 | |
| Commercial assay or kit | Mouse CD19 microbeads | Miltenyi | Cat# 130-052-201 | |
| Commercial assay or kit | Mouse CD11b microbeads | Miltenyi | Cat# 130-049-601 | |
| Commercial assay or kit | Mouse CD4 + CD62L + T cell isolation kit | Miltenyi | Cat# 130-093-227 | |
| Commercial assay or kit | Trizol Reagent | Life Technologies | Cat# 15596026 | |
| Commercial assay or kit | High Pure RNA Isolation Kit | Roche | Cat# 11828665001 | |
| Commercial assay or kit | Truseq RNA Library Kit | Illumina | Cat# RS-122–2001 | |
| Commercial assay or kit | Ribo-Zero rRNA removal kit | Illumina | Cat# MRZH11124 | |
| Commercial assay or kit | Cytofix/Cytoperm Kit | BD Biosciences | Cat# 554722 | |
| Commercial assay or kit | Ampure XP beads | Beckman-Coulter | Cat# A63881 | |
| Commercial assay or kit | Quant-IT dsDNA Assay Kit, High Sensitivity | Life Technologies | Cat# Q33120 | |
| Commercial assay or kit | iQ SYBR Green SuperMix | Biorad | Cat# 1708880 | |
| Commercial assay or kit | iScript cDNA Synthesis Kit | Biorad | Cat# 1708891 | |
| Chemical compound, drug | doxycycline | Sigma | Cat# D9891 | |
| Chemical compound, drug | DAPI | Sigma | Cat# 32670 | |
| Chemical compound, drug | dimethylpidilate (DMP) | Life Technologies | Cat# 21666 | |
| Chemical compound, drug | 5-bromo2’-deoxyuridine | Sigma | Cat# B9285 | |
| Chemical compound, drug | Denhardt’s Solution (50X) | Life Technologies | Cat# 750018 | |
| Chemical compound, drug | cycloheximide | Sigma | Cat# C104450 | |
| Chemical compound, drug | Ribonucleoside vanadyl complexes (RVC) | New England Biolabs | Cat# S1402S | |
| Chemical compound, drug | Live-Dead Fixable Aqua | Life Technologies | Cat# L34957 | |
| Chemical compound, drug | TO-PRO-3 Iodide | Life Technologies | Cat# T3605 | |
| Software, algorithm | CLIP Toolkit (CTK) | PMID:27797762 | ||
| Software, algorithm | STAR Aligner | PMID:23104886 | ||
| Software, algorithm | Bowtie2 | PMID:22388286 | ||
| Software, algorithm | HOMER | PMID:20513432 | ||
| Software, algorithm | GenomicRanges (R Bioconductor) | PMID:23950696 | ||
| Software, algorithm | TxDb.Mmusculus. UCSC.mm10.ensGene (R Bioconductor) | DOI: 10.18129/B9.bioc. TxDb.Mmusculus.UCSC. mm10.knownGene | ||
| Software, algorithm | TopGO (R Bioconductor) | DOI: 10.18129/B9.bioc. topGO | Adrian Alexa, Jorg Rahnenfuhrer | |
| Software, algorithm | edgeR (R Bioconductor) | PMID:19910308 | ||
| Software, algorithm | HTseq | PMID:25260700 | ||
| Software, algorithm | Cluster 3.0 | PMID:14871861 | ||
| Software, algorithm | Java Treeview | PMID:15180930 | ||
| Software, algorithm | Gene Set Enrichment Analysis (GSEA) | PMID:16199517 |
Table 1
Oligonucleotide sequences
https://doi.org/10.7554/eLife.33057.022| Primer name | Sequence | Description |
|---|---|---|
| cloning | ||
| MJM9 | ATGACTCGAGGATCTCTCTGCCATCTACGAGAGCC | mouse ZFP36 forward XhoI primer |
| MJM10 | ATGAGCGGCCGCTCACTCAGAGACAGAGATACGATTGAAGATGG | mouse ZFP36 reverse NotI primer |
| MJM266 | ATGACTCGAGACCACCACCCTCGTGTCC | mouse ZFP36L1 forward XhoI primer |
| MJM267 | ATGAGCGGCCGCTTAGTCATCTGAGATGGAGAGTCTGC G | mouse ZFP36L1 reverse NotI primer |
| MJM270 | ATGACTCGAGTCGACCACACTTCTGTCACCC | mouse ZFP36L2 forward XhoI primer |
| MJM271 | ATGAGCGGCCGCTCAGTCGTCGGAGATGGAGAGG | mouse ZFP36L2 reverse NotI primer |
| RT-qPCR | ||
| GP-f | CATTCACCTGGACTTTGTCAGACTC | LCMV RNA forward qPCR |
| GP-r | GCAACTGCTGTGTTCCCGAAAC | LCMV RNA reverse qPCR |
| MJM432 | GATTGTGGGACATCCTGGTC | mouse RPL10A forward qPCR |
| MJM433 | TCAGACCCATGACTGCTGAG | mouse RPL10A reverse qPCR |
| MJM500 | AACATCGAAGACGGCTCTGT | IFNG reporter forward qPCR |
| MJM501 | GCGCTCTGTGTGGACAAGTA | IFNG reporter reverse qPCR |
| MJM504 | CCACTACCTGAGCACCCAGT | CD69 and TNF reporters forward qPCR |
| MJM505 | GAACTCCAGCAGGACCATGT | CD69 and TNF reporters reverse qPCR |
| GAPDH-f | GTCTCCTCTGACTTCAACAGCG | human GAPDH forward qPCR |
| GAPDH-r | ACCACCCTGTTGCTGTAGCCAA | human GAPDH reverse qPCR |
| HITS-CLIP and ribosome profiling | ||
| preA-L32 | /5rApp/GTGTCAGTCACTTCCAGCGG/3ddc/ | Pre-Adenylated 3' ligation linker |
| RT1 | /5Phos/DDDCGATNNNNNNNAGATCGGAAGAGCGTCGT/iSp18/CACTCA/iSp18/CCGCTGGAAGTGACTGAC | Indexed RT primer |
| RT2 | /5Phos/DDDTAGCNNNNNNNAGATCGGAAGAGCGTCGT/iSp18/CACTCA/iSp18/CCGCTGGAAGTGACTGAC | Indexed RT primer |
| RT3 | /5Phos/DDDATCGNNNNNNNAGATCGGAAGAGCGTCGT/iSp18/CACTCA/iSp18/CCGCTGGAAGTGACTGAC | Indexed RT primer |
| RT4 | /5Phos/DDDGCTANNNNNNNAGATCGGAAGAGCGTCGT/iSp18/CACTCA/iSp18/CCGCTGGAAGTGACTGAC | Indexed RT primer |
| RT5 | /5Phos/DDDCTAGNNNNNNNAGATCGGAAGAGCGTCGT/iSp18/CACTCA/iSp18/CCGCTGGAAGTGACTGAC | Indexed RT primer |
| RT6 | /5Phos/DDDGATCNNNNNNNAGATCGGAAGAGCGTCGT/iSp18/CACTCA/iSp18/CCGCTGGAAGTGACTGAC | Indexed RT primer |
| RT7 | /5Phos/DDDAGTCNNNNNNNAGATCGGAAGAGCGTCGT/iSp18/CACTCA/iSp18/CCGCTGGAAGTGACTGAC | Indexed RT primer |
| RT8 | /5Phos/DDDTCGANNNNNNNAGATCGGAAGAGCGTCGT/iSp18/CACTCA/iSp18/CCGCTGGAAGTGACTGAC | Indexed RT primer |
| DP5-PE | AATGATACGGCGACCACCGAGATCTACACTCTTTCCCTACACGACGCTCTTCCGATCT | forward PCR primer, Illumina adapter |
| SP3-PE | CAAGCAGAAGACGGCATACGAGATCTCGGCATTCCTGCCGCTGGAAGTGACTGACAC | reverse PCR primer, Illumina adapter |
| PE-R1 | ACACTCTTTCCCTACACGACGCTCTTCCGATCT | sequencing primer (standard Illumina read 1) |
Additional files
-
Supplementary file 1
ZFP36 binding sites in CD4 +T cells 4 hr post-activation (attached spreadsheet).
Pan-ZFP36 HITS-CLIP peaks (A) in WT CD4 +T cells 4 hr post-activation (B) in Zfp36 KO CD4 +T cells 4 hr post-activation. (C) identified only in Zfp36 KO and not WT cells, and (D) pooled from WT and Zfp36 KO samples. (E) Cross-link induced truncation (CITS) cites from all pooled ZFP36 HITS-CLIP data (FDR < 0.01).
- https://doi.org/10.7554/eLife.33057.023
-
Supplementary File 2
Gene Ontology enrichments for ZFP36 target mRNAs in CD4 +T cells, 4 hr post-activation (attached spreadsheet).
- https://doi.org/10.7554/eLife.33057.024
-
Supplementary File 3
ZFP36 binding sites in CD4 +T cells 72 hr post-activation (attached spreadsheet).
- https://doi.org/10.7554/eLife.33057.025
-
Transparent reporting form
- https://doi.org/10.7554/eLife.33057.026
Download links
A two-part list of links to download the article, or parts of the article, in various formats.
Downloads (link to download the article as PDF)
Open citations (links to open the citations from this article in various online reference manager services)
Cite this article (links to download the citations from this article in formats compatible with various reference manager tools)
ZFP36 RNA-binding proteins restrain T cell activation and anti-viral immunity
eLife 7:e33057.
https://doi.org/10.7554/eLife.33057


