Social interaction-induced activation of RNA splicing in the amygdala of microbiome-deficient mice
- University College Cork, Ireland
Figures
Figure 1
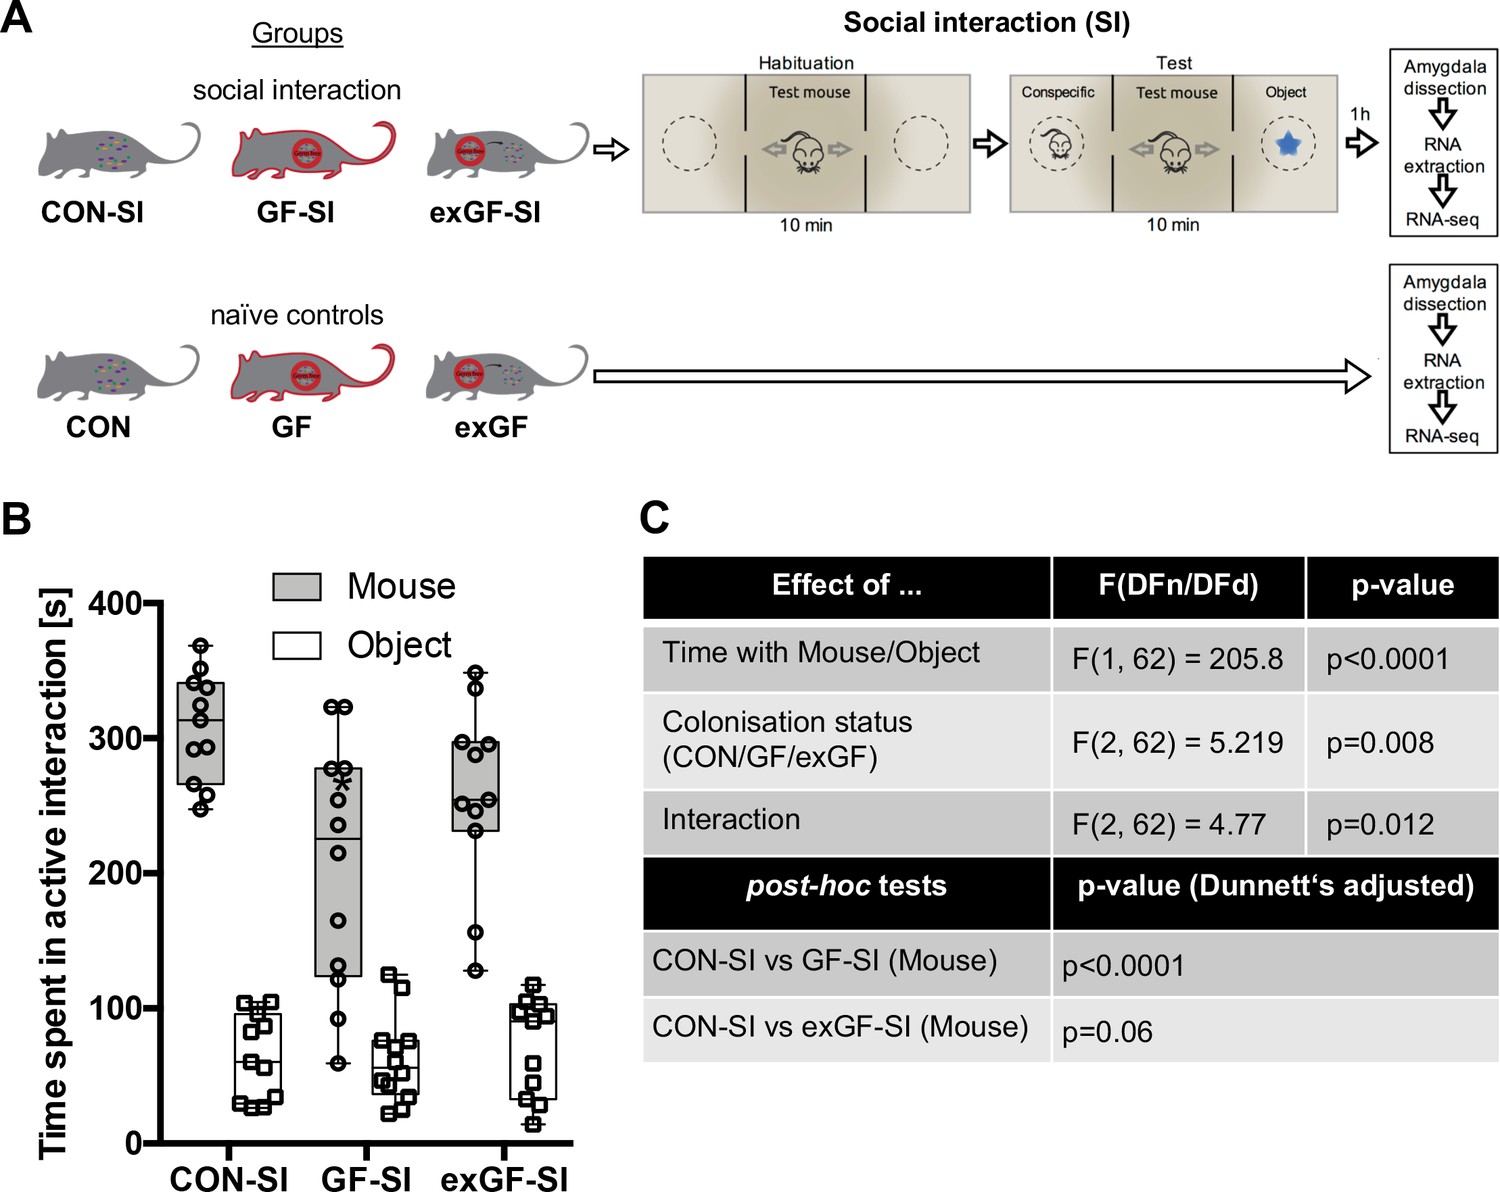
Germ-free (GF) mice display reduced social interaction.
(A) Experimental design. (B) Time spent in active interaction with either a conspecific or non-social object in the 3-chamber social interaction test (3CSIT). Error bars show range, midlines of boxes show medians. (C) Results of the 2-way ANOVA with Dunnets multiple comparison post-hoc test, n = 11–12/group).
Figure 2 with 2 supplements
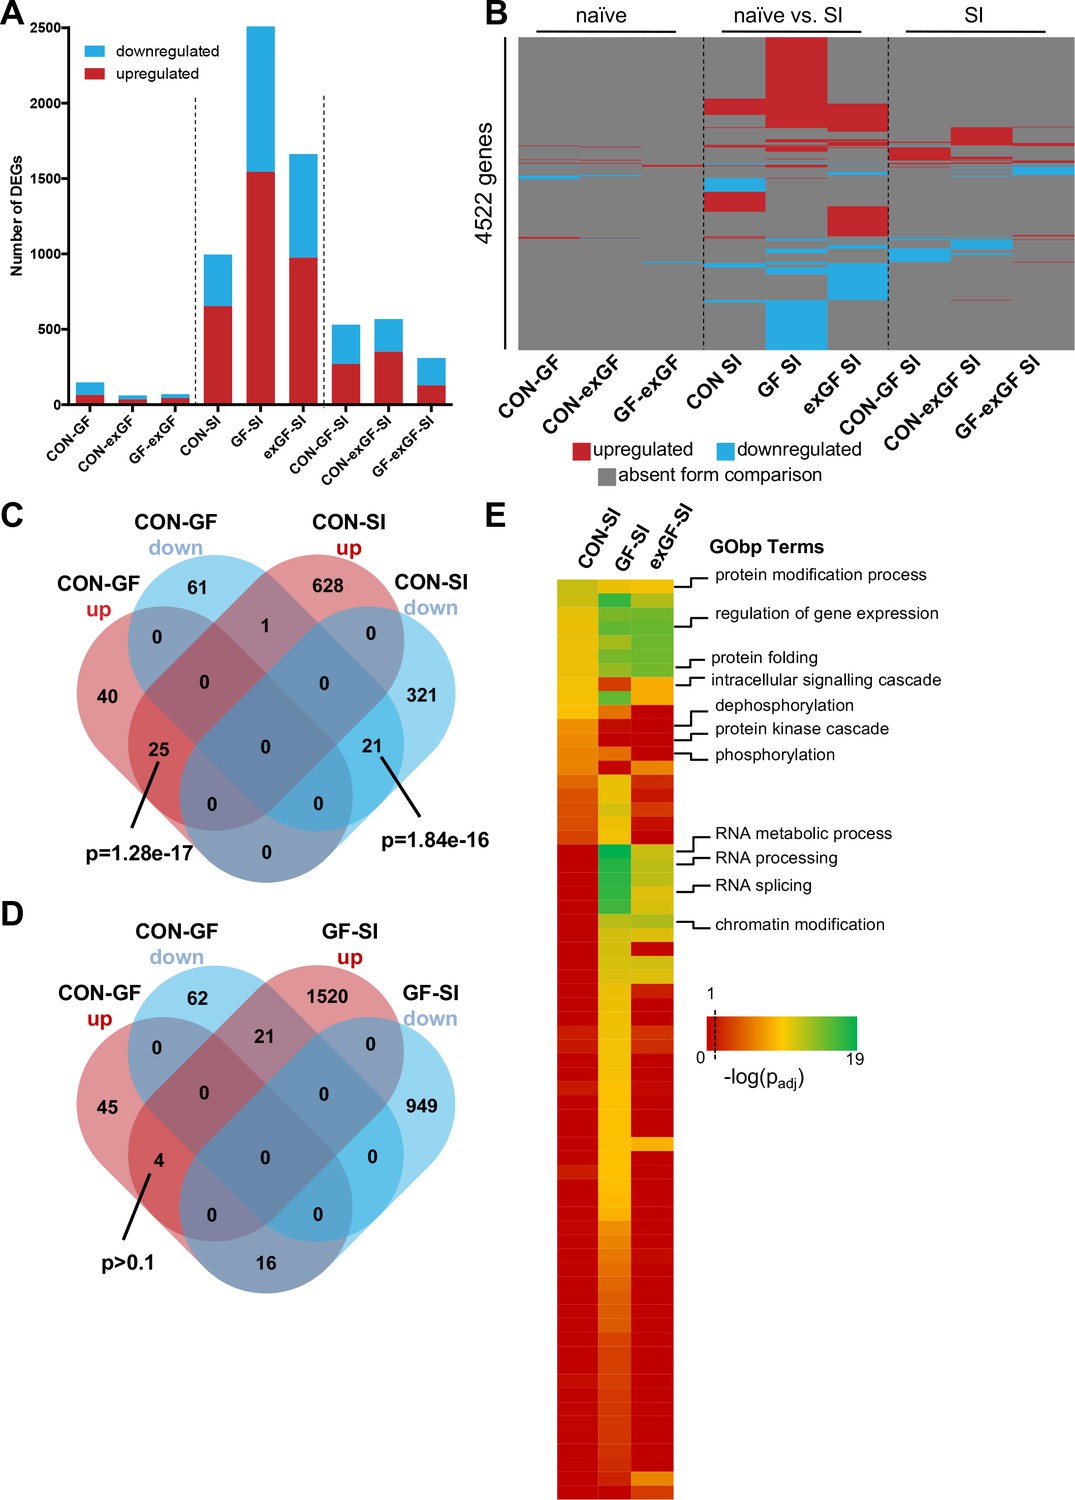
Social interaction induces diverging gene expression patterns in the amygdala.
(A) Number of differentially expressed genes (DEGs) including both up- and downregulated genes for all meaningful pairwise comparisons (see Table 1). (B) Presence-absence plot for all DEGs in all groups. Each line represents one gene that is a DEG in at least one pairwise comparison. (C–D) Venn diagram of upregulated (up, red) and downregulated (down, blue) genes in CON-GF and CON-SI or GF-SI comparisons to test for activation of expression patterns in GF mice under naïve conditions that are similar to activation by social interaction at either CON or GF colonisation status. (E) Heatmap to visualize enriched biological functions in social interaction(SI)-induced (upregulated only) genes. FDR-adjusted p-values were calculated for all enriched (padj <0.1) biological-function GO Terms (GObp), log-transformed (-log10) and colour-coded.
Figure 2—figure supplement 1
Additional data on gene expression analysis.
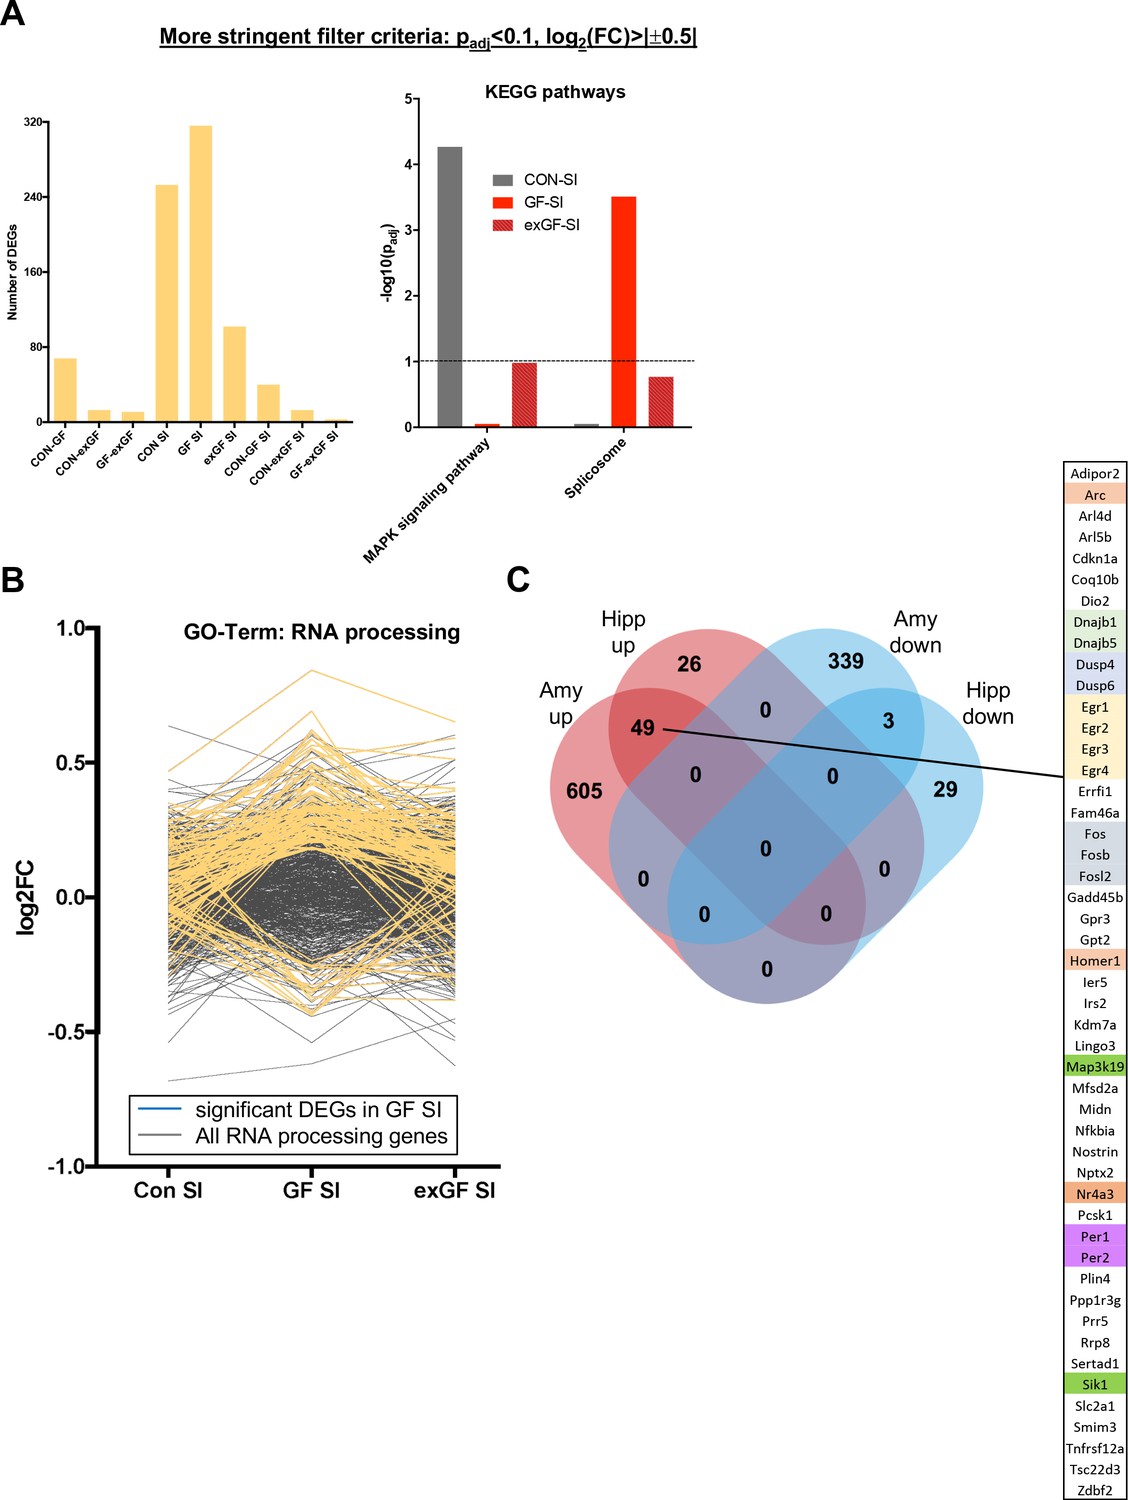
(A) Results of differential gene expression analysis using more stringent filter criteria (padj <0.1 and log2(fold-change) >0.5 or<−0.5) as compared to Figure 1, where filter criteria are padj <0.1. Left panel: Number of differentially expressed genes (DEGs, both directions), right panel: Enrichment of KEGG pathways ‘MAPK sig. pathway’ and ‘Spliceosome’ (expressed as –log10(padj)). (B) Log2(fold-change)-values for all genes associated with the GO-Term ‘RNA processing’ for all comparisons after social interaction (SI). Each line represents one gene, genes significantly up-/downregulated in GF-SI comparison are highlighted in yellow, which are the same genes shown in Figure 3D. (C) Comparison of genes induced by SI in the murine amygdala with genes induced by environmental novelty in the murine hippocampus (see ref. Stilling et al., 2014a), EMBO J). Overlapping upregulated genes are listed and genes with similar function are grouped using different colours.
Figure 2—figure supplement 2
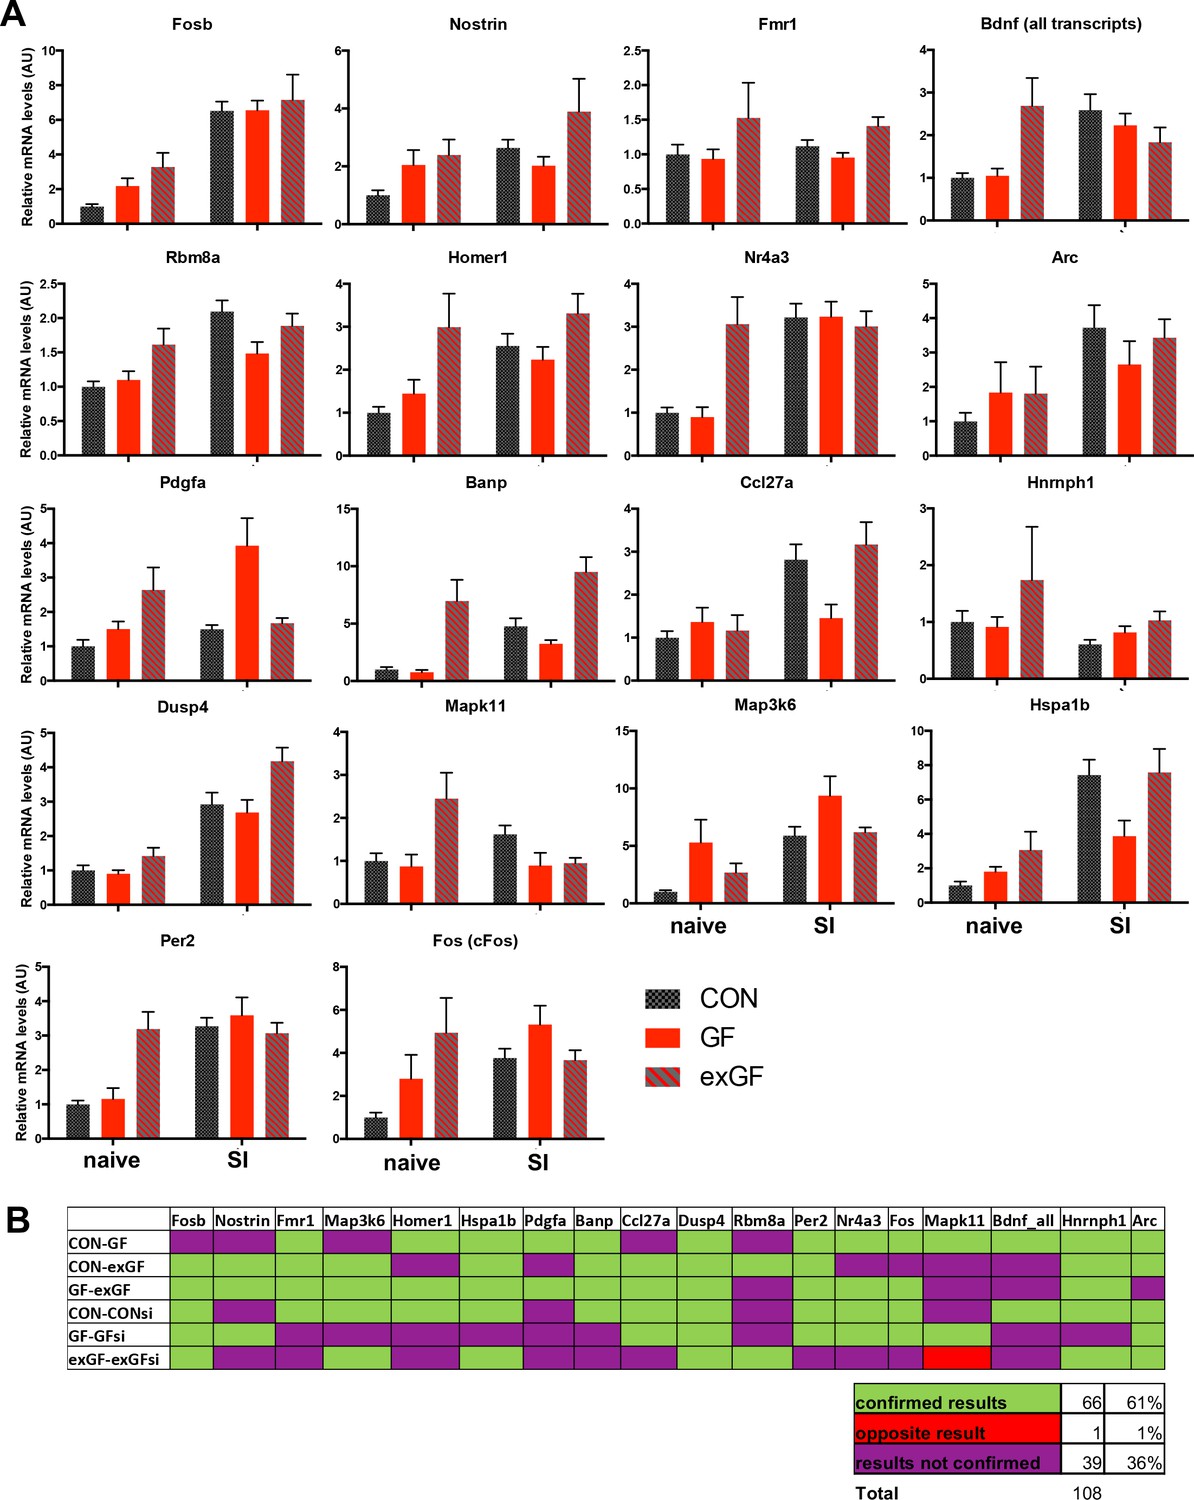
RT-qPCR validation of RNA-seq results.
(A) RT-qPCR validation results for 18 selected genes. n = 4–12 per group. (B) Overview of correspondence of RNAseq and qPCR results for selected genes. RT-qPCR results were analysed by 2-way ANOVA with multiple-testing correction (Tukey correction for effect of colonisation status; Sidak correction for effect of social interaction stimulation (SI)), significance level: padj <0.05.
Figure 3
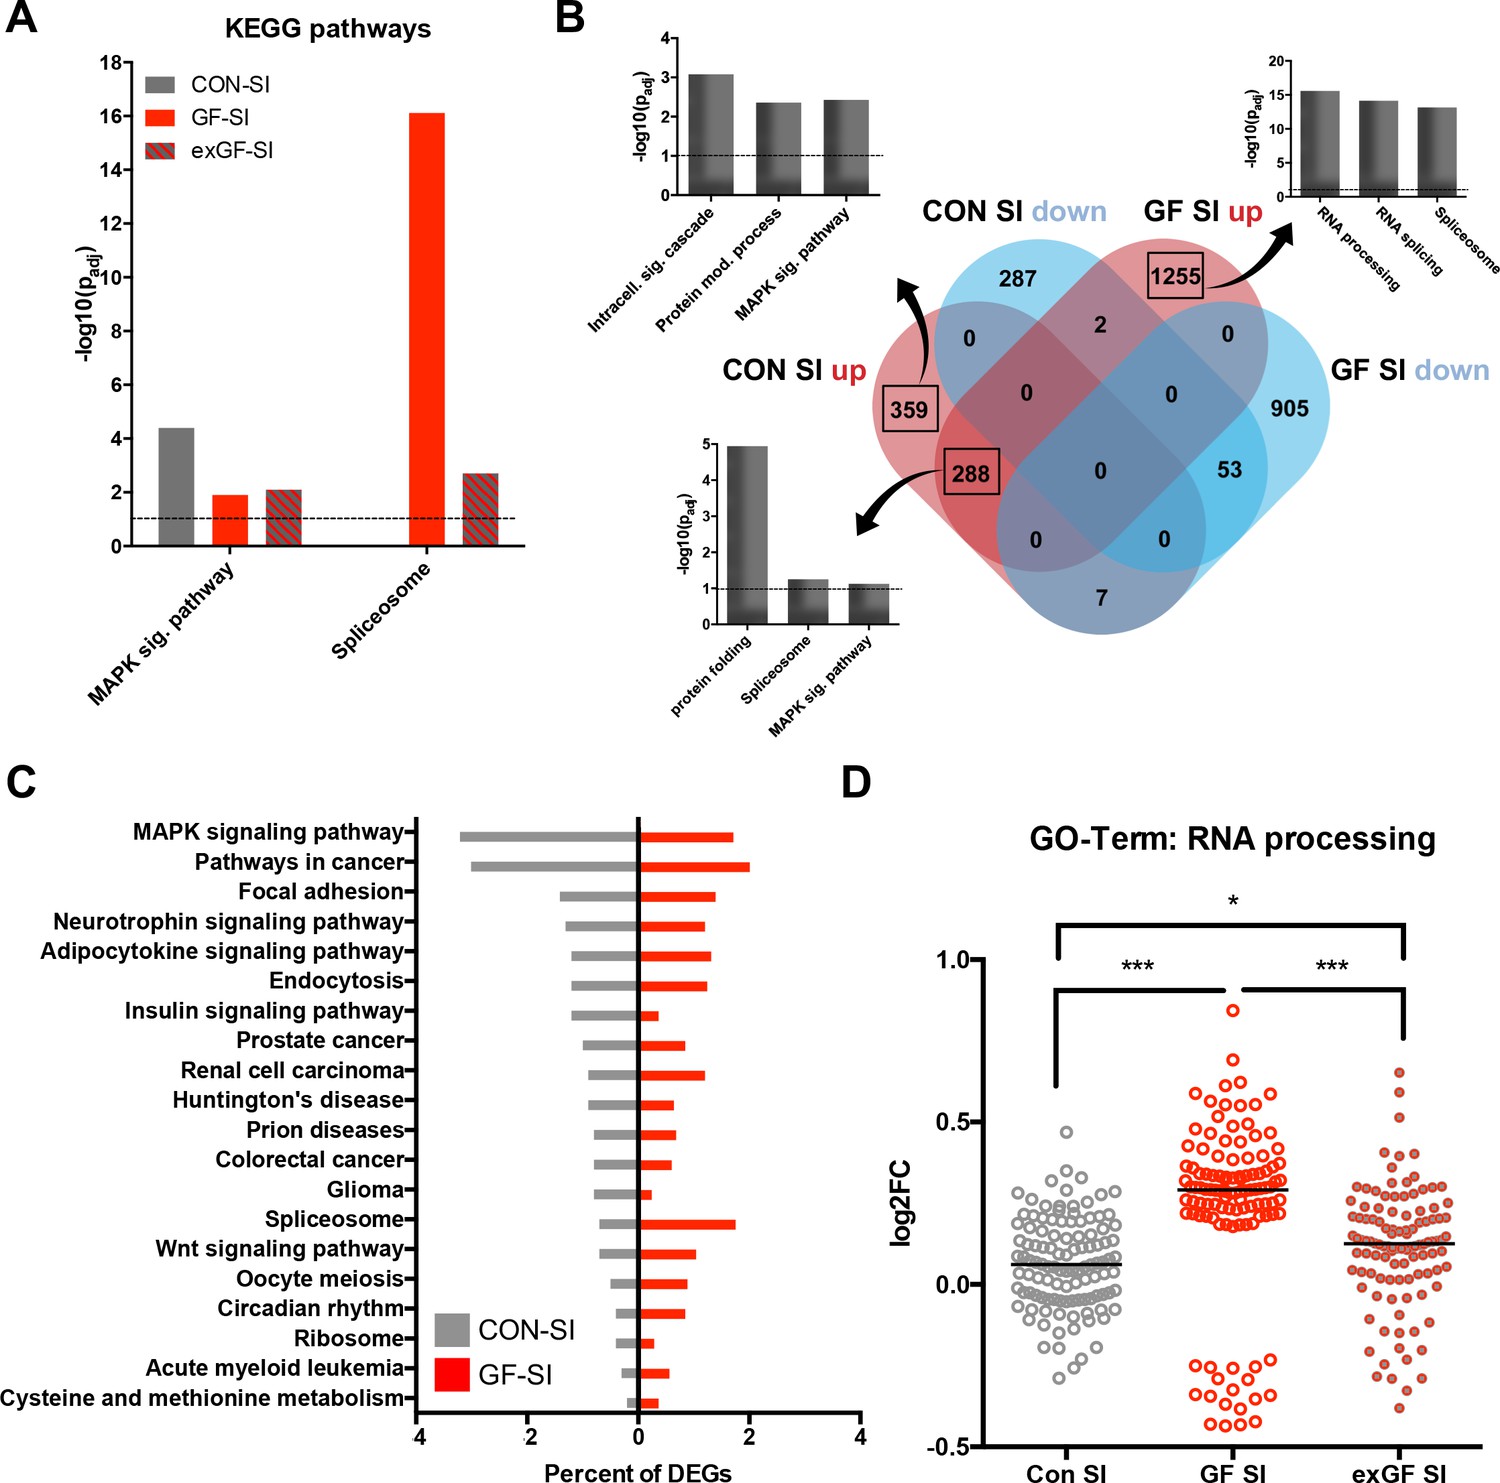
Loss of normal induction of MAP-K pathway is accompanied by upregulation of splicing pathways.
(A) Comparison of enrichment of MAP-K pathway-associated genes and spliceosome-related genes among DEGs between groups. Dotted line: significance level (p=0.1) (B) Functional enrichment analysis of overlapping and uniquely regulated subsets of DEGs between CON-SI and GF-SI comparisons showed shared and different processes transcriptionally activated in the amygdala in response to social stimulation (C) Percentage of DEGs falling into the TOP20 enriched KEGG pathways for CON-SI and GF-SI. (D) Log2(fold change) (Log2FC) values plotted for each of the 112 DEGs in the GF-SI comparison that was associated with GO-Term ‘RNA processing’. black line: median, non-parametric Friedman test F = 65.5, p<1.0e-4; ***p<1.0e-4, *p<0.05, Dunn’s multiple comparisons, n = 112/group.
Figure 4
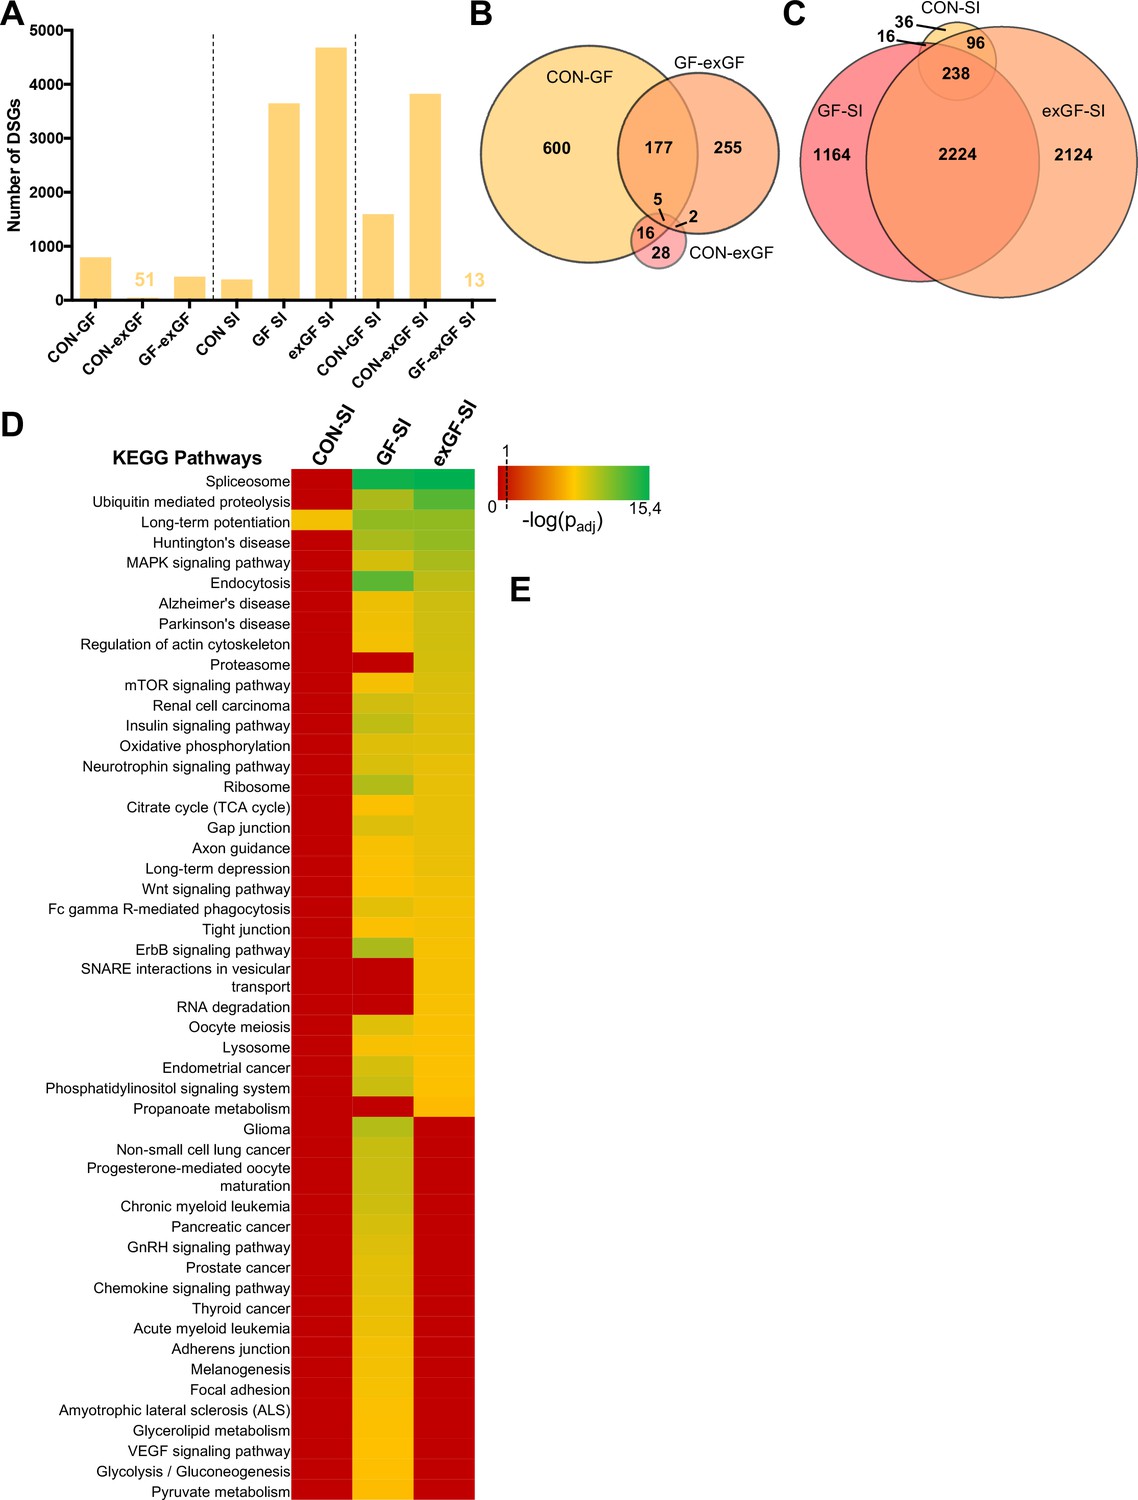
Social interaction leads to a strong increase in alternative splicing in GF and exGF animals.
(A) Number of differentially spliced genes (DSGs) for all meaningful pairwise comparisons (see Table 1). (B–C) Venn diagrams showing overlapping DSGs for naïve (B) and social interaction (SI, (C) comparisons. After stimulation differences become evident. (D) Heatmap to visualize enriched pathways in SI-induced differentially spliced genes. FDR-adjusted p-values were calculated for all enriched (padj <0.1) KEGG pathways, log-transformed (-log10) and colour-coded.
Figure 5

Behavioural performance correlates with expression of RNA processing genes in GF mice.
(A) Design of analysis. A gene list, ranked by Pearson correlation between expression level of a given gene and behavioural performance for each individual mouse, was used for gene-set enrichment analysis (GSEA). The algorithm assigns one or multiple functions to each gene in the list based on the GO-Term or KEGG Pathway databases, then calculates an enrichment score for each function based on the rank of genes associated with this function (B–C) GSEA-generated enrichment plots for two selected significantly enriched functions (KEGG pathway ‘Spliceosome’, GO-Term ‘RNA splicing’). (D) Normalized GSEA enrichment scores for all significantly enriched functions or pathways found in this analysis. (E) Gene-expression analysis within the GF-SI group (GF-SIhigh vs GF-SIlow, n = 6). Shown are expression values for three significantly differentially regulated genes plotted against the animals time spent in active social interaction. r: Pearson correlation coefficient.
Tables
Table 1
Meaningful pairwise comparisons for gene expression changes (nine unique comparisons).
https://doi.org/10.7554/eLife.33070.004| Group | Environmental stimulation | Compared to |
|---|---|---|
| CON (n = 4) | Naïve (n = 4, representing eight animals, per group) | GF, exGF, CON-SI |
| GF (n = 4) | CON, exGF, GF-SI | |
| exGF (n = 4) | CON, GF, exGF-SI | |
| CON-SI (n = 8) | social interaction (SI) | CON, GF-SI, exGF-SI |
| GF-SI (n = 12) | GF, CON-SI, exGF-SI | |
| exGF-SI (n = 8) | exGF, CON-SI, GF-SI |
Additional files
-
Supplementary file 1
Differentially expressed genes
- https://doi.org/10.7554/eLife.33070.011
-
Supplementary file 2
Functional enrichment DEGs
- https://doi.org/10.7554/eLife.33070.012
-
Supplementary file 3
DEGs GO-heatmap
- https://doi.org/10.7554/eLife.33070.013
-
Supplementary file 4
DSGs
- https://doi.org/10.7554/eLife.33070.014
-
Supplementary file 5
Functional enrichment DSGs
- https://doi.org/10.7554/eLife.33070.015
-
Supplementary file 6
DSGs KEGG-heatmap
- https://doi.org/10.7554/eLife.33070.016
-
Supplementary file 7
Correlation gene expression with behaviour
- https://doi.org/10.7554/eLife.33070.017
-
Supplementary file 8
Details on RNA sample quality and sequencing quality control
- https://doi.org/10.7554/eLife.33070.018
-
Supplementary file 9
Raw FastQC quality control files for sequencing data
- https://doi.org/10.7554/eLife.33070.019
-
Transparent reporting form
- https://doi.org/10.7554/eLife.33070.020
Download links
A two-part list of links to download the article, or parts of the article, in various formats.
Downloads (link to download the article as PDF)
Open citations (links to open the citations from this article in various online reference manager services)
Cite this article (links to download the citations from this article in formats compatible with various reference manager tools)
Social interaction-induced activation of RNA splicing in the amygdala of microbiome-deficient mice
eLife 7:e33070.
https://doi.org/10.7554/eLife.33070


