Metabolic interactions between dynamic bacterial subpopulations
- California Institute of Technology, United States
- Princeton University, United States
- Howard Hughes Medical Institute, United States
Figures
Figure 1 with 2 supplements
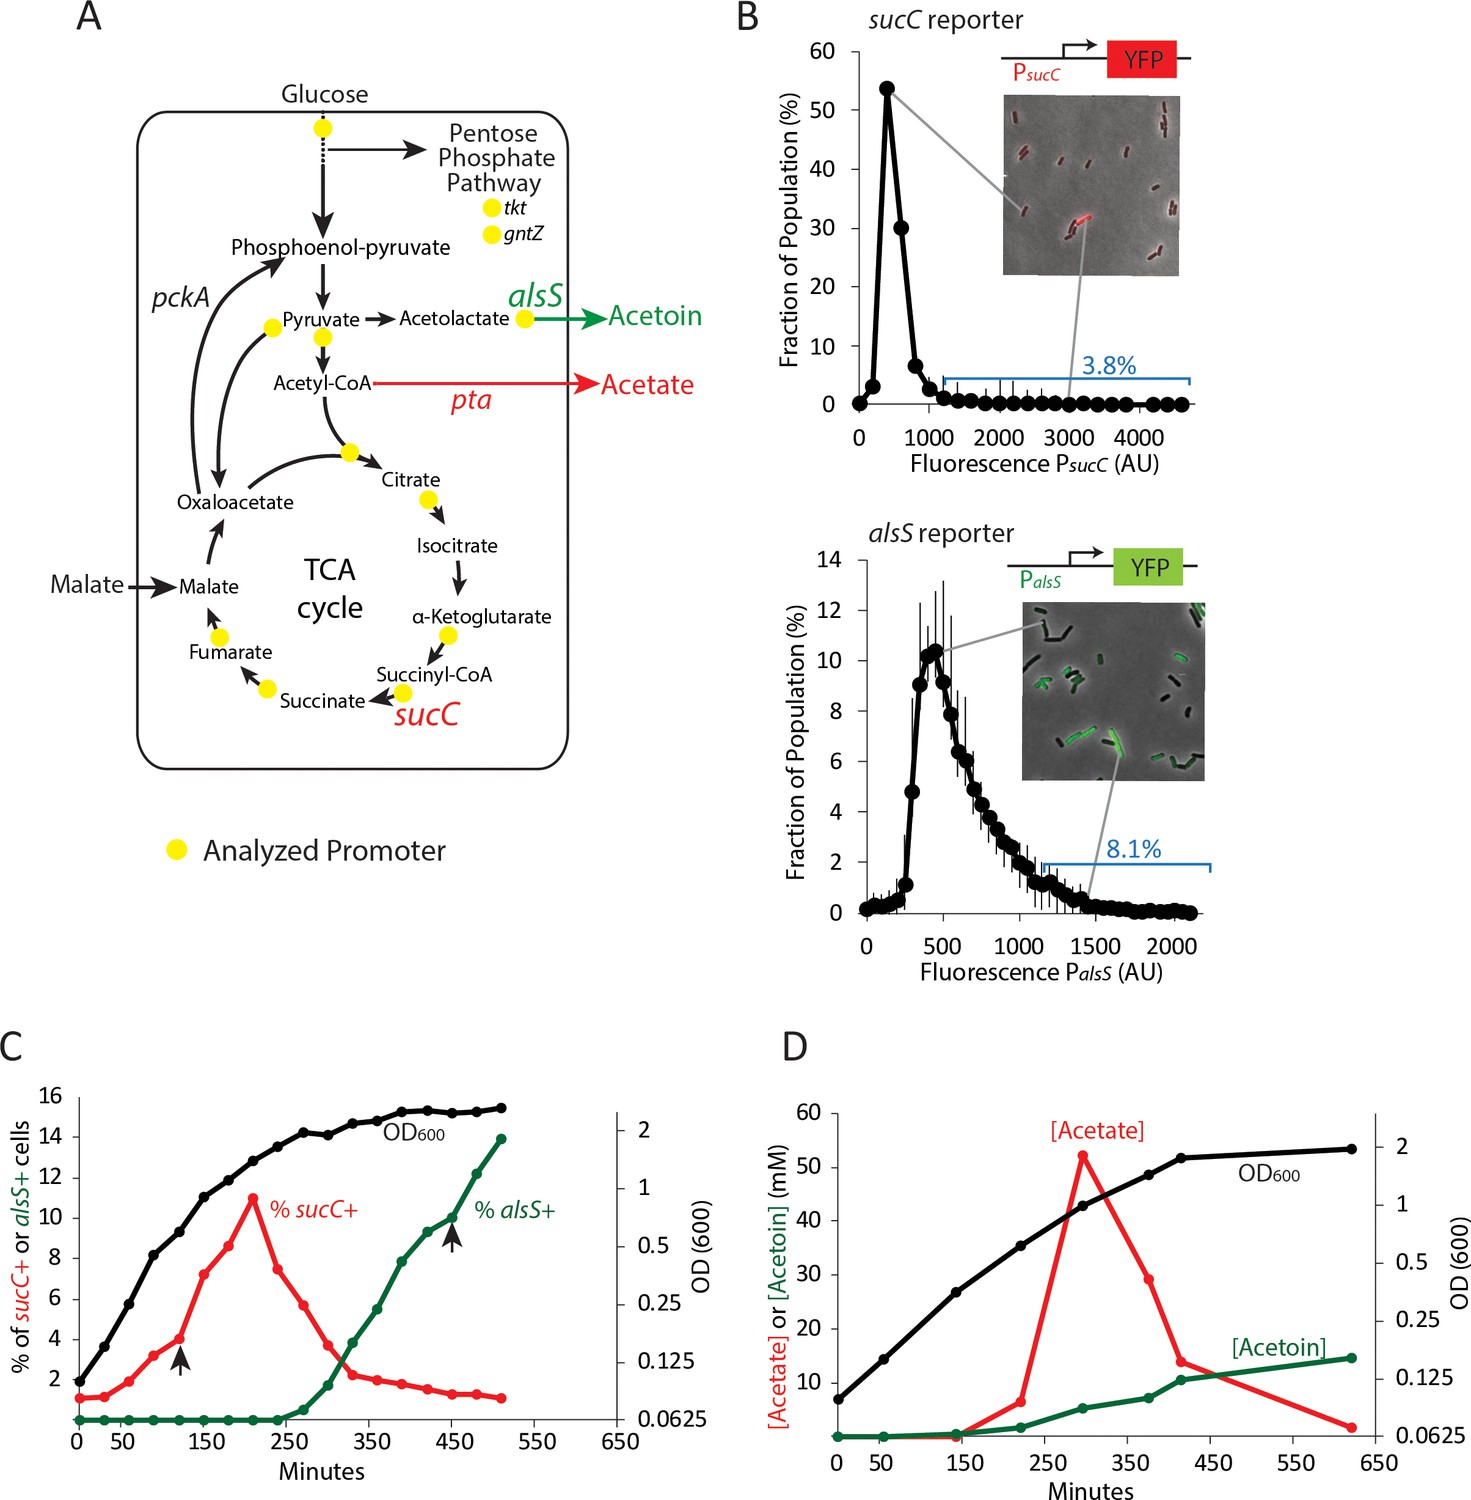
Two genes in central carbon metabolism are heterogeneously expressed in a clonal population of B. subtilis.
(A) B. subtilis uses glucose and malate as preferred carbon sources, and under aerobic culture conditions produces acetate and acetoin as major overflow metabolites. Promoter reporter strains were made for genes participating in the reactions marked with a yellow dot (B) Histograms depict the heterogeneous expression of the central metabolism genes sucC (top panel) and alsS (bottom panel). Insets using merged phase and fluorescence images show typical fields of cells, including cells in the high expressing tail of the distributions. (C) The heterogeneous expression of sucC (red line) and alsS (green line) is maximal at different timepoints along the growth curve (black line). Black arrows denote the sampling timepoints shown in Figure 1B. (D) A line graph depicting the accumulation of extracellular acetate and acetoin in the growth media during exponential and early stationary growth (OD600, black line). Acetate (red line) is released around mid-exponential phase, and is reabsorbed at a later time during which acetoin is produced (green line).
Figure 1—figure supplement 1

Histograms of metabolic promoter reporters made for this study.
The expression levels of promoter reporters for the genes citB, citZ, fumC, odhA, pdhA, ptsG,, and tkt in individual cells are shown from cultures in mid exponential phase (OD6000.8–1.2). Cells with similar expression levels were binned and values for each bin are displayed in the histograms. The histogram panels are ordered based on skew, from largest to smallest. Cells were collected from cultures grown in M9 Glucose/Malate media. Histograms in panel A use normalized X and Y axis values to show details for each promoter reporter.
Figure 1—figure supplement 2
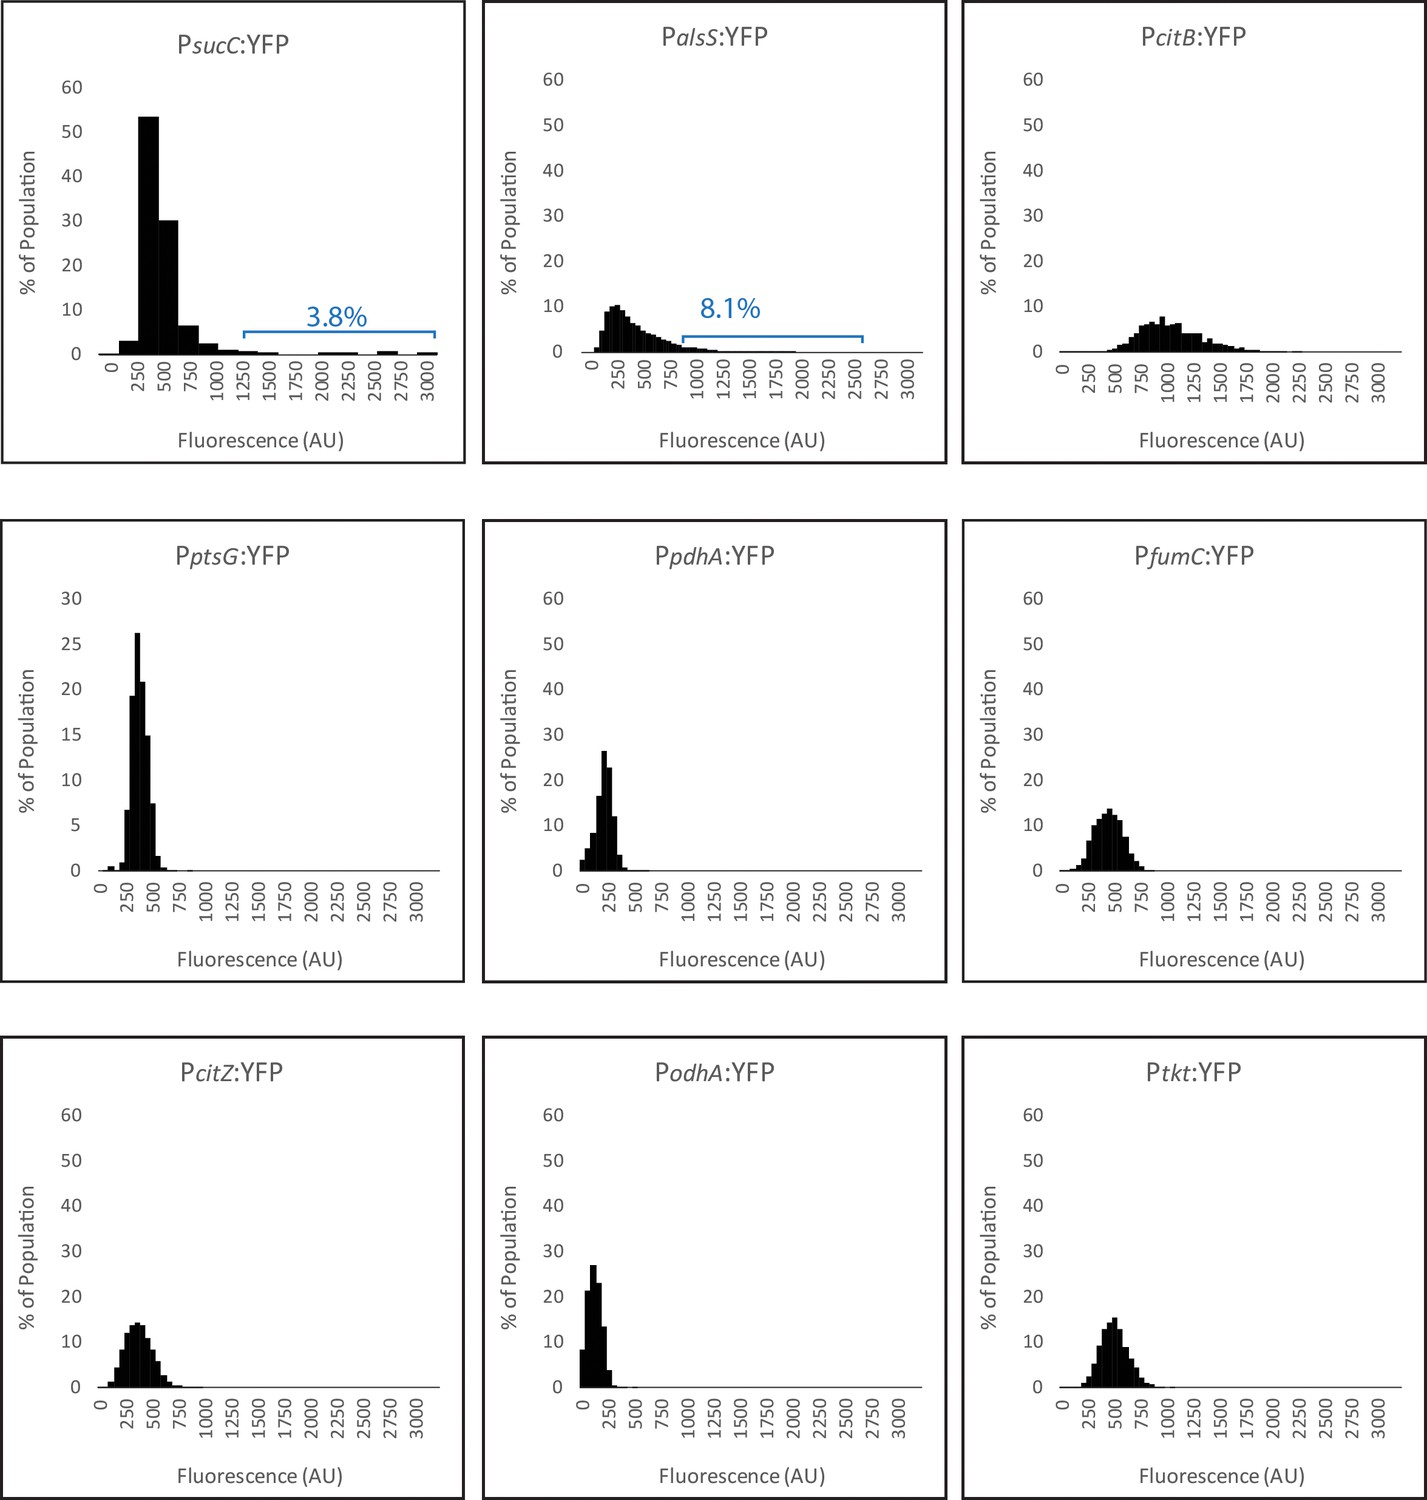
All histograms in panel B use the same X and Y values, allowing easier cross-comparison of expression levels of each reporter.
https://doi.org/10.7554/eLife.33099.005
Figure 2 with 4 supplements
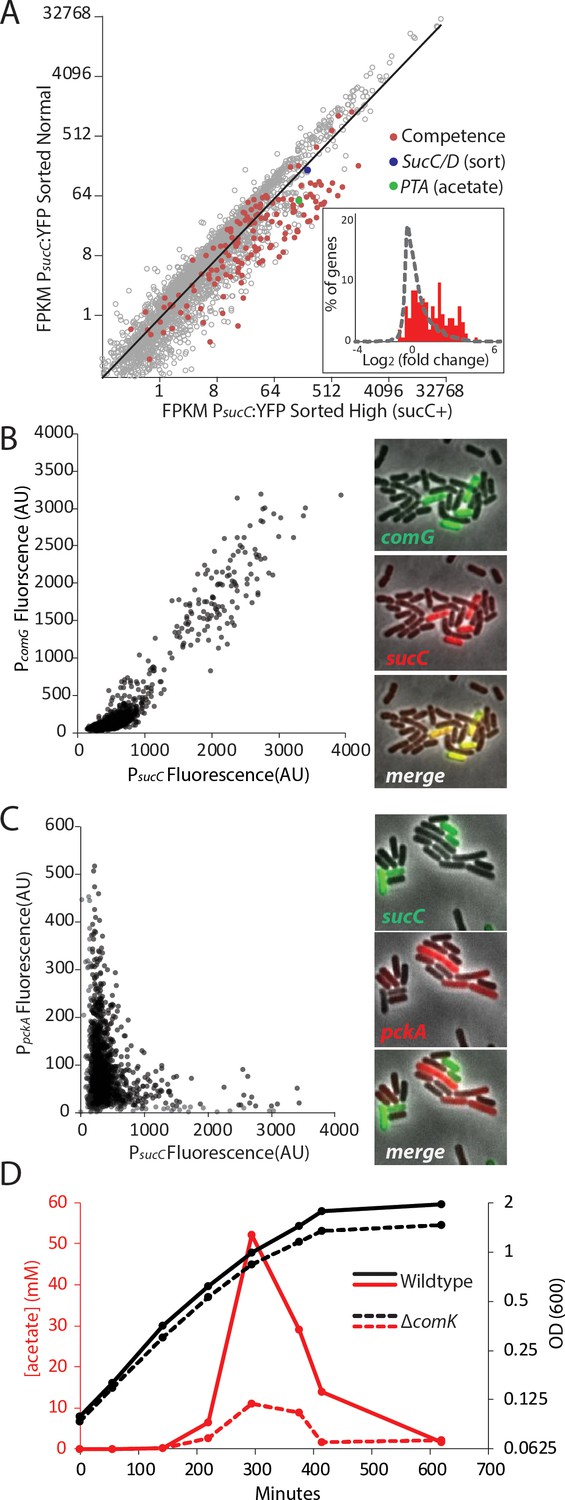
The heterogeneous expression of sucC is correlated with the genetic-competence regulon, and this metabolic state produces extracellular acetate.
(A) RNAseq of cells sorted at either a high or moderate sucC level reveals positive correlation between sucC expression, the competence program, and the acetate metabolism gene pta. Cells expressing YFP under the control of the sucC promoter were sorted at high or normal expression levels. Genes for genetic competence (red) and acetate production (pta – green) are higher in cells expressing high levels of sucC. The inset histogram shows a histogram of log2 fold change for all genes (grey) and the competence program genes (red) (B) A scatter plot shows that the expression of sucC reporter is positively correlated with the comG reporter, a marker for the competence program. Each dot represents a single cell centered on the mean fluorescence of reporters for sucC and comG. The right panel shows fluorescent microscopy images taken from a typical field of cells (C) A scatter plot shows that the expression of the sucC reporter is negatively correlated with expression of the metabolic gene pckA. Each dot represents a single cell centered on the mean fluorescence of reporters for sucC and pckA. Right panel shows fluorescent microscopy images taken from a typical field of cells. (D) The competence gene expression program is necessary for the buildup of high levels of extracellular acetate. Growth curves demonstrate only a small difference in growth of wildtype strain (solid black line) or the competence-null ∆comK strain (dashed black line). However, maximal acetate buildup is approximately five fold higher in the wildtype strain (solid red line) than in a strain that is unable to produce the competent cell population (∆comK dashed red lines).
Figure 2—figure supplement 1
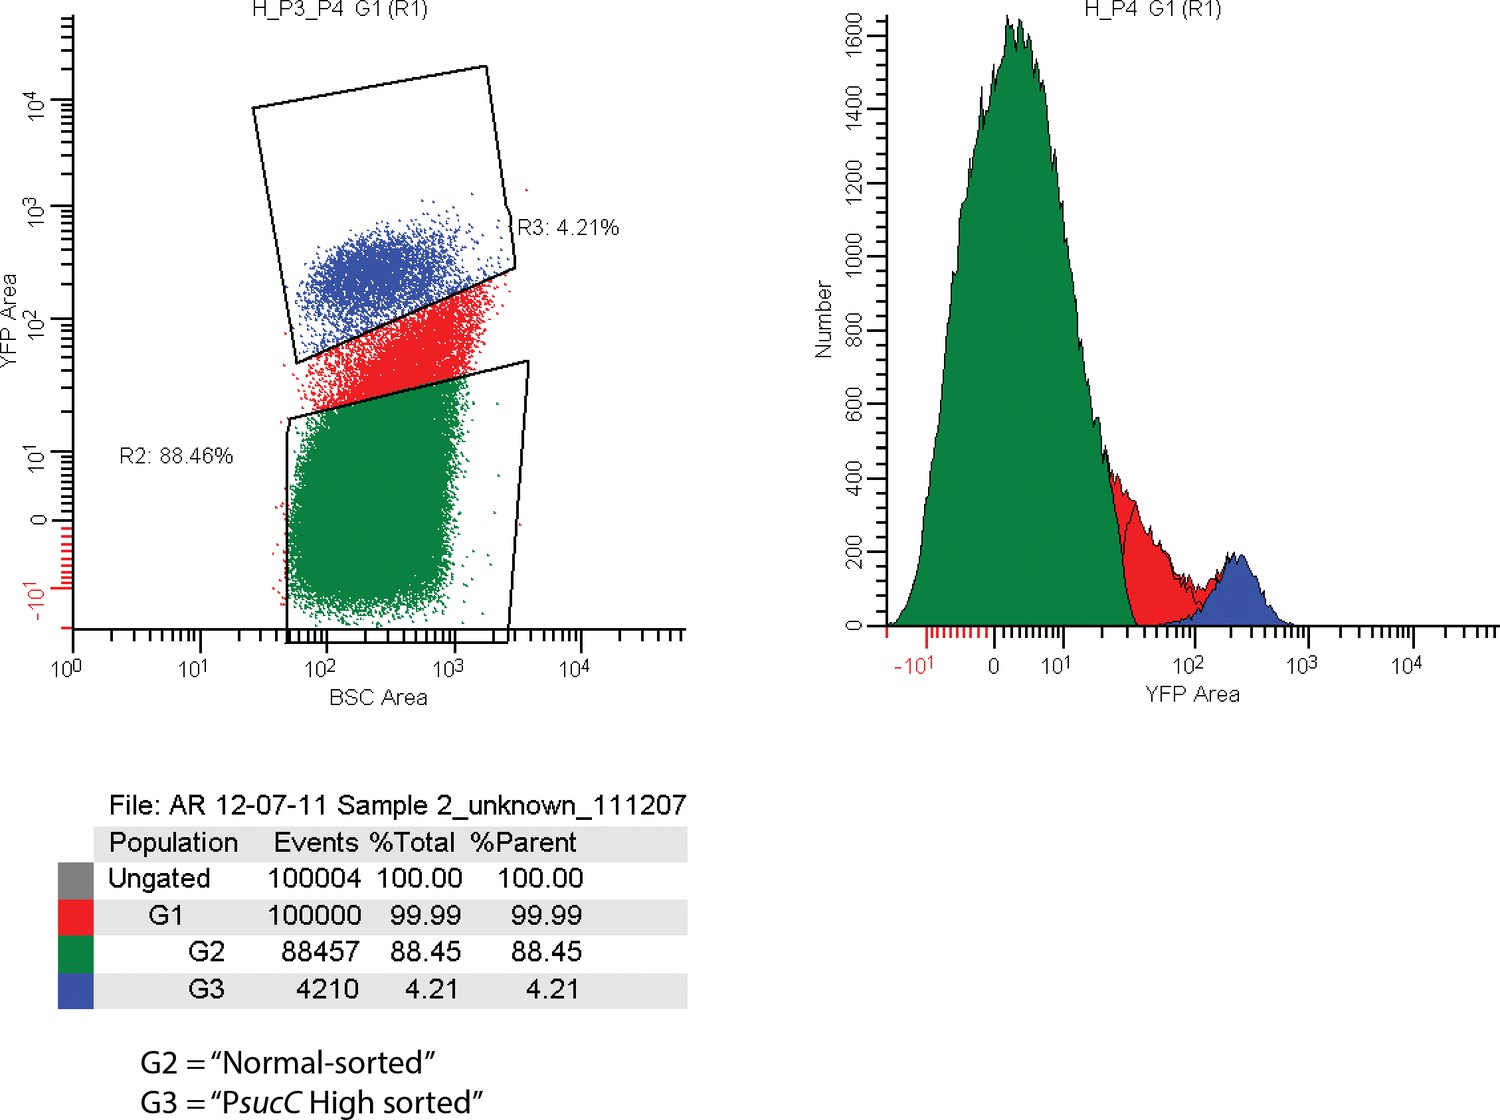
FACS sorting parameters for sorting sucC+ and normal cells for RNAseq experiments.
Cells carrying a promoter reporter expressing YFP under control of the sucC promoter were sorted based on relative YFP fluorescence. The G3 sorting gate (blue regions corresponding to 4.3% of analyzed events) was designated ‘PsucC High’. The G2 sorting gate (green region corresponding to 88.45% of analyzed events) was designated ‘PsucC Normal’.
Figure 2—figure supplement 2
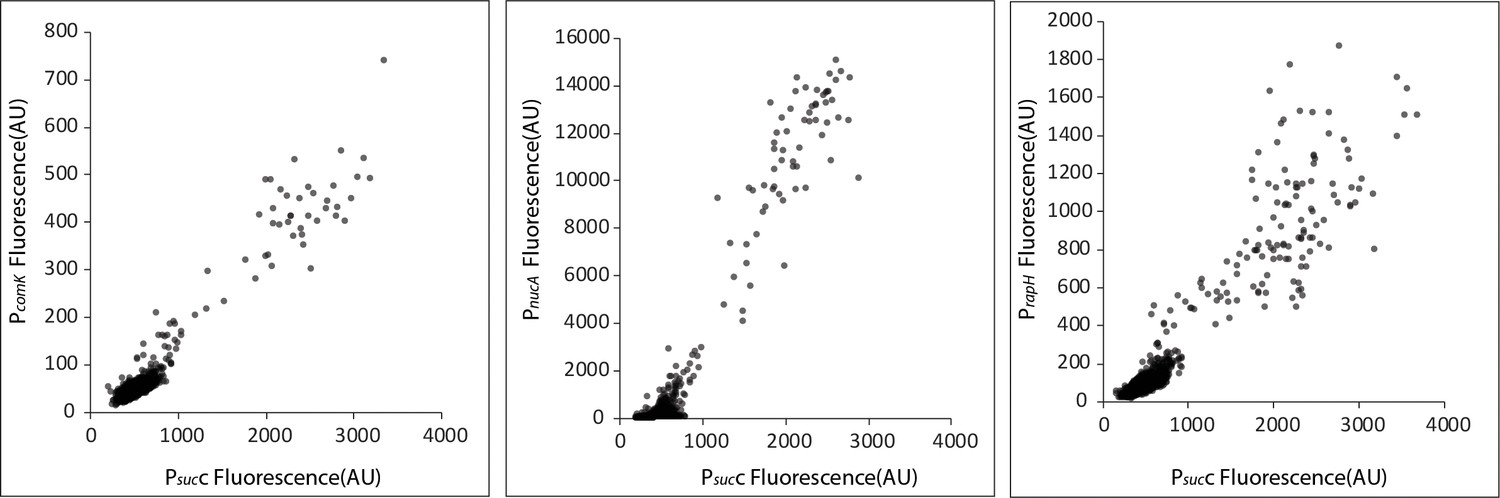
Competence genes are positively correlated with the TCA cycle gene sucC.
Scatter plots show that the expression of sucC reporter (CFP) is positively correlated with expression of the YFP promoter reporters for the classical competence program genes comK, nucA, and rapH in single cells. Each dot represents a single cell centered based on the mean fluorescence of fluorescent reporters for sucC and the competence gene.
Figure 2—figure supplement 3
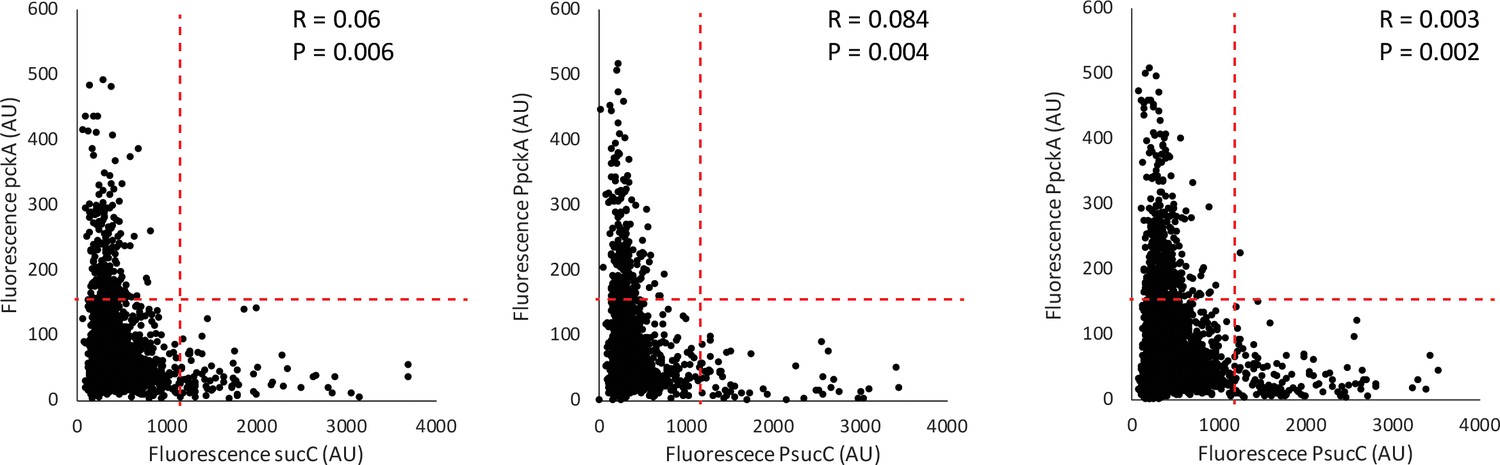
Competence genes are negatively correlated with the metabolic gene pckA.
Three replicate scatter plots show that the expression of sucC reporter (CFP) is negatively correlated with expression of the YFP promoter reporter for the Phosphoenolpyruvate metabolism gene pckA in single cells. Each dot represents a single cell centered based on the mean fluorescence of fluorescent reporters for sucC and the competence gene. The red dashed lines show regions used in the figure to test for anticorrelation using the Fisher Exact Test. P values for the Fisher exact test (anticorrelation) are displayed for each replicate, as well as R values.
Figure 2—figure supplement 4
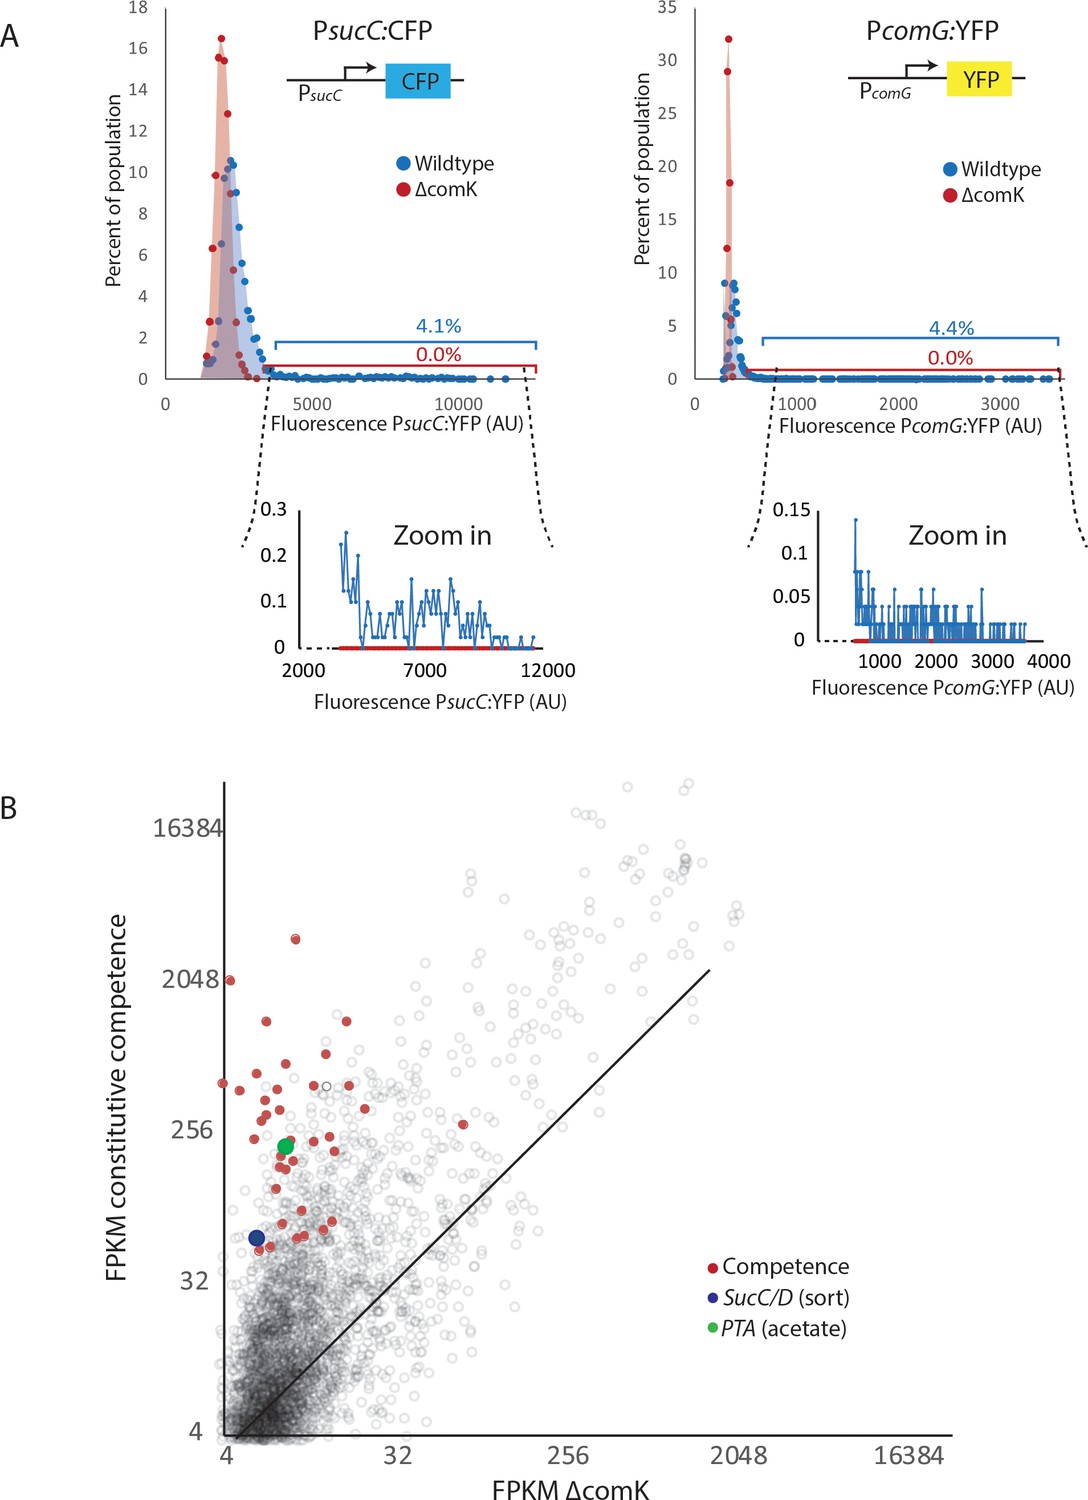
The heterogeneous expression of sucC, comG, and pta are dependent on the competence master regulator comK.
(A) The expression levels of promoter reporters for the genes sucC (CFP), and comG (YFP) in individual cells were determined in wildtype cells (blue dots and blue shading) as well as in cells in which the master competence regulator comK was deleted (ΔcomK) (red dots and red shading). Cells with similar expression levels were binned and values for each bin are displayed in the histograms. Cells were collected from cultures grown in M9 Glucose/Malate media. The wildtype cultures had greater than 4% of cells expressing the reporter at levels > 2 standard deviations above the mean. Values in this tail of the distribution are shown in the zoom-in windows below the main panels. (B) Global gene expression of strains with a deletion of the competence master regulator comK is compared to cells displaying induced competence (constitutively activated comK) using RNAseq. Competence genes, pta, and sucC are elevated in samples that are in the competent state.
Figure 3 with 1 supplement
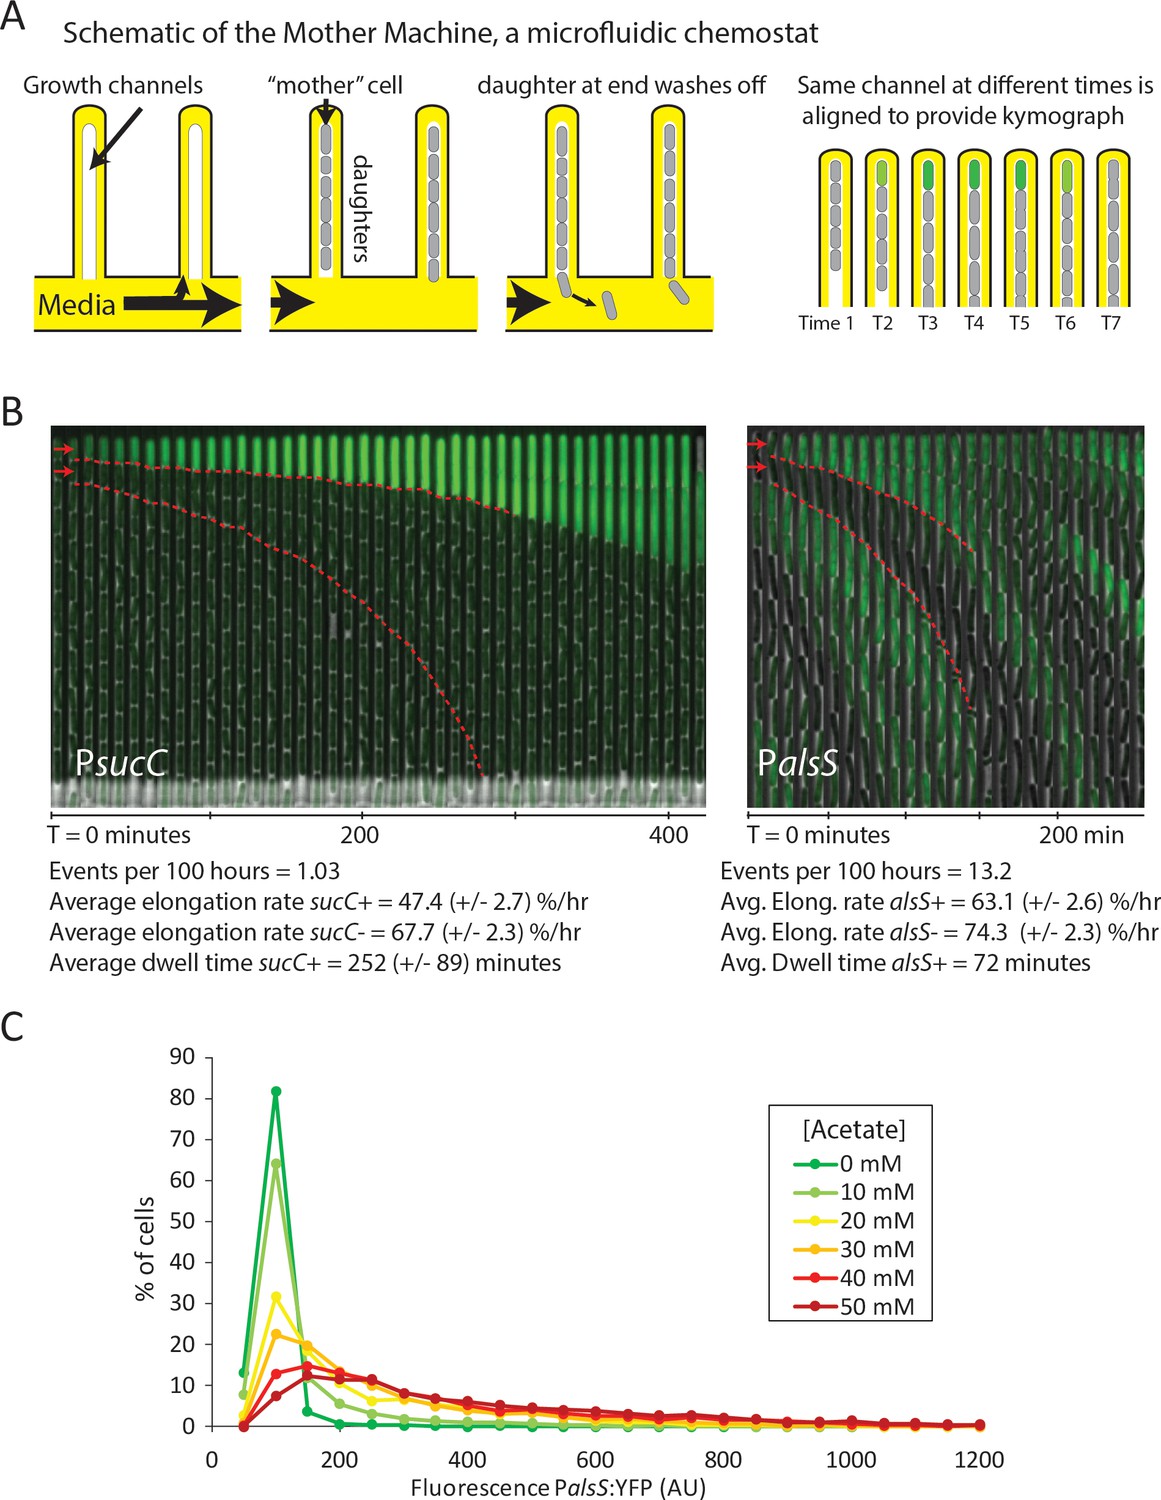
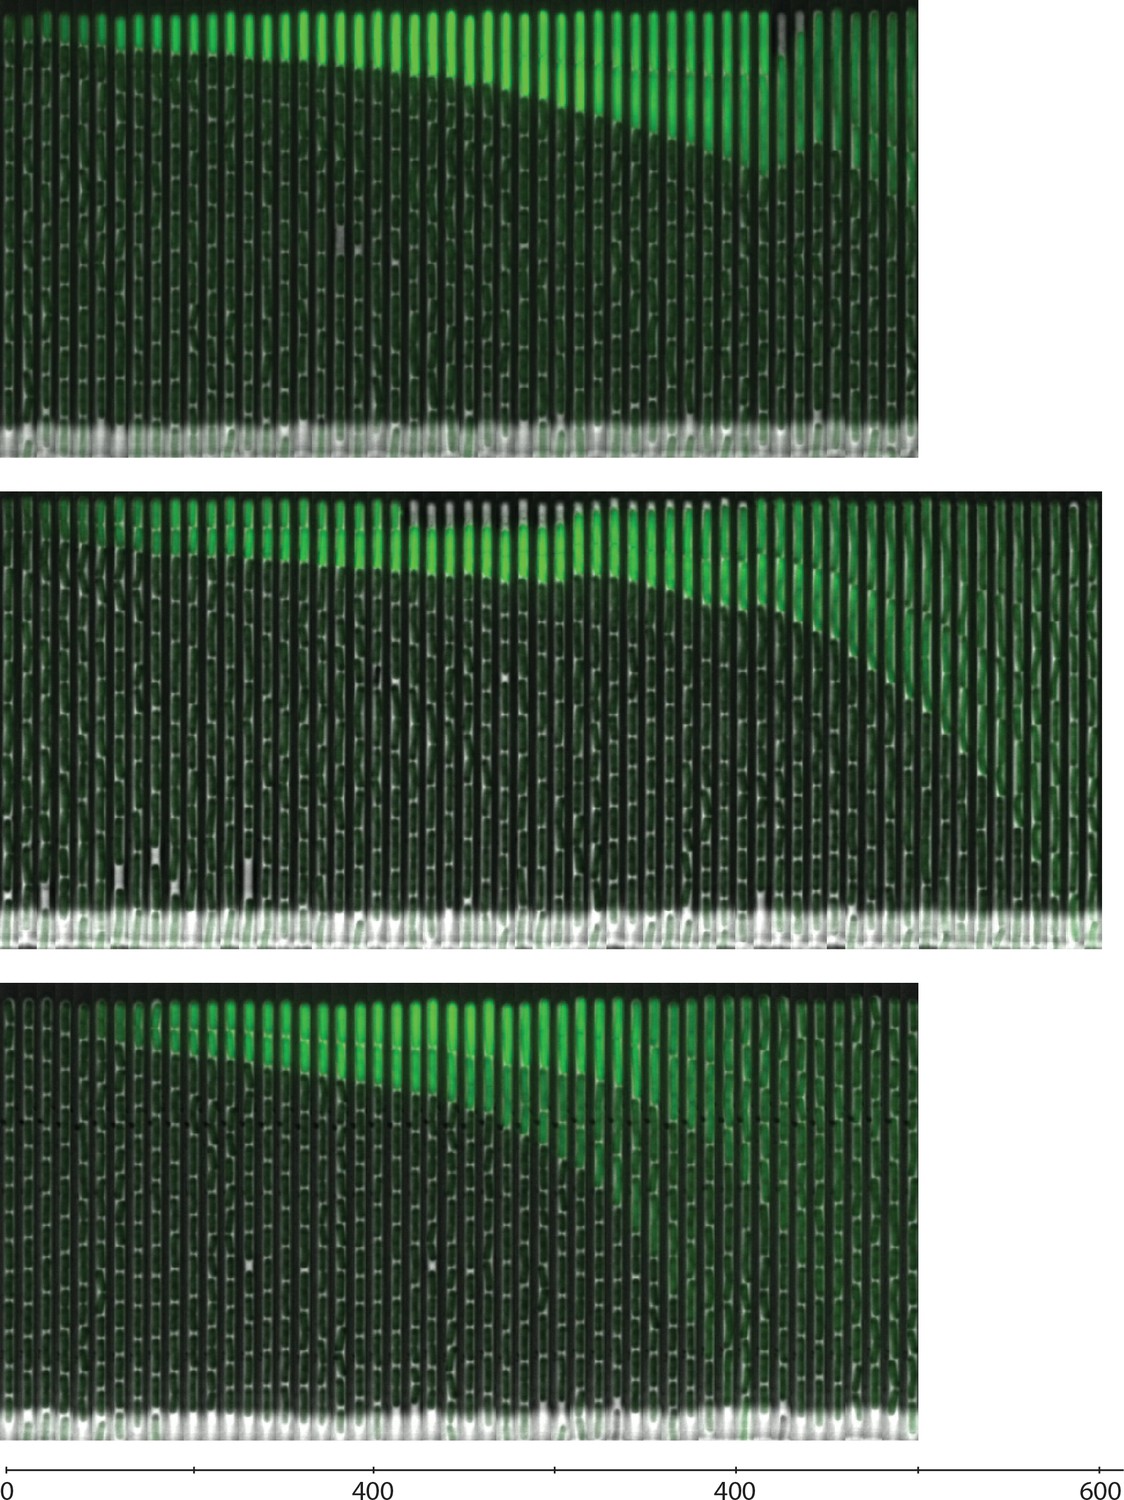
Cells switch in and out of the slower growing sucC+ and alsS+ states based on media conditions.
(A) A schematic of the Mother Machine microfluidic experiment. Cells are loaded into growth channels that are capped on one end and surrounded by flowing media. A ‘mother’ cell settles at the capped end, and produces daughters. The daughters at the uncapped end of the growth channel are washed away by the current of media. Positions were filmed for up to 4 days, and for visualization purposes the images from each growth channel were cropped and aligned to generate a kymograph depicting time on the x-axis. (B) Filmstrip kymographs from representative mother-machine experiments using conditioned media at OD600 0.8 and sucC reporter strain (left panel) or conditioned media at OD600 2.0 using alsS reporter strain (right panel). Dashed red lines show the trend of growth of two daughters, a sucC+ and sucC- pair on the left panel and a alsS+ and alsS- pair on the right panel. As seen from the slope of the trend lines and as indicated below the kymographs, the elongation rates of both sucC+ and alsS+ cells are slower than their counterparts. All values reported (events per 100 hr, elongation rate, and dwell time) were averaged from at least three separate movies per condition. Representative mother machine movies are available in the supplement. (C) Extracellular acetate levels activate heterogeneous expression of the alsS promoter. A histogram shows the population of cells expressing different levels of YFP under control of the alsS promoter. When no acetate is added (green line), practically all cells are in the low expressing portion of the histogram. When extracellular acetate levels are added to mimic the maximal amount produced in the growth curve (orange and red lines), some cells remain in the low expressing portion of the histogram, but a correspondingly larger number of cells are in the long tail of high alsS expression.
Figure 3—figure supplement 1
Filmstrip kymographs from mother-machine experiments using conditioned media at OD600 0.8 and sucC reporter strain.
https://doi.org/10.7554/eLife.33099.012
Figure 4 with 3 supplements
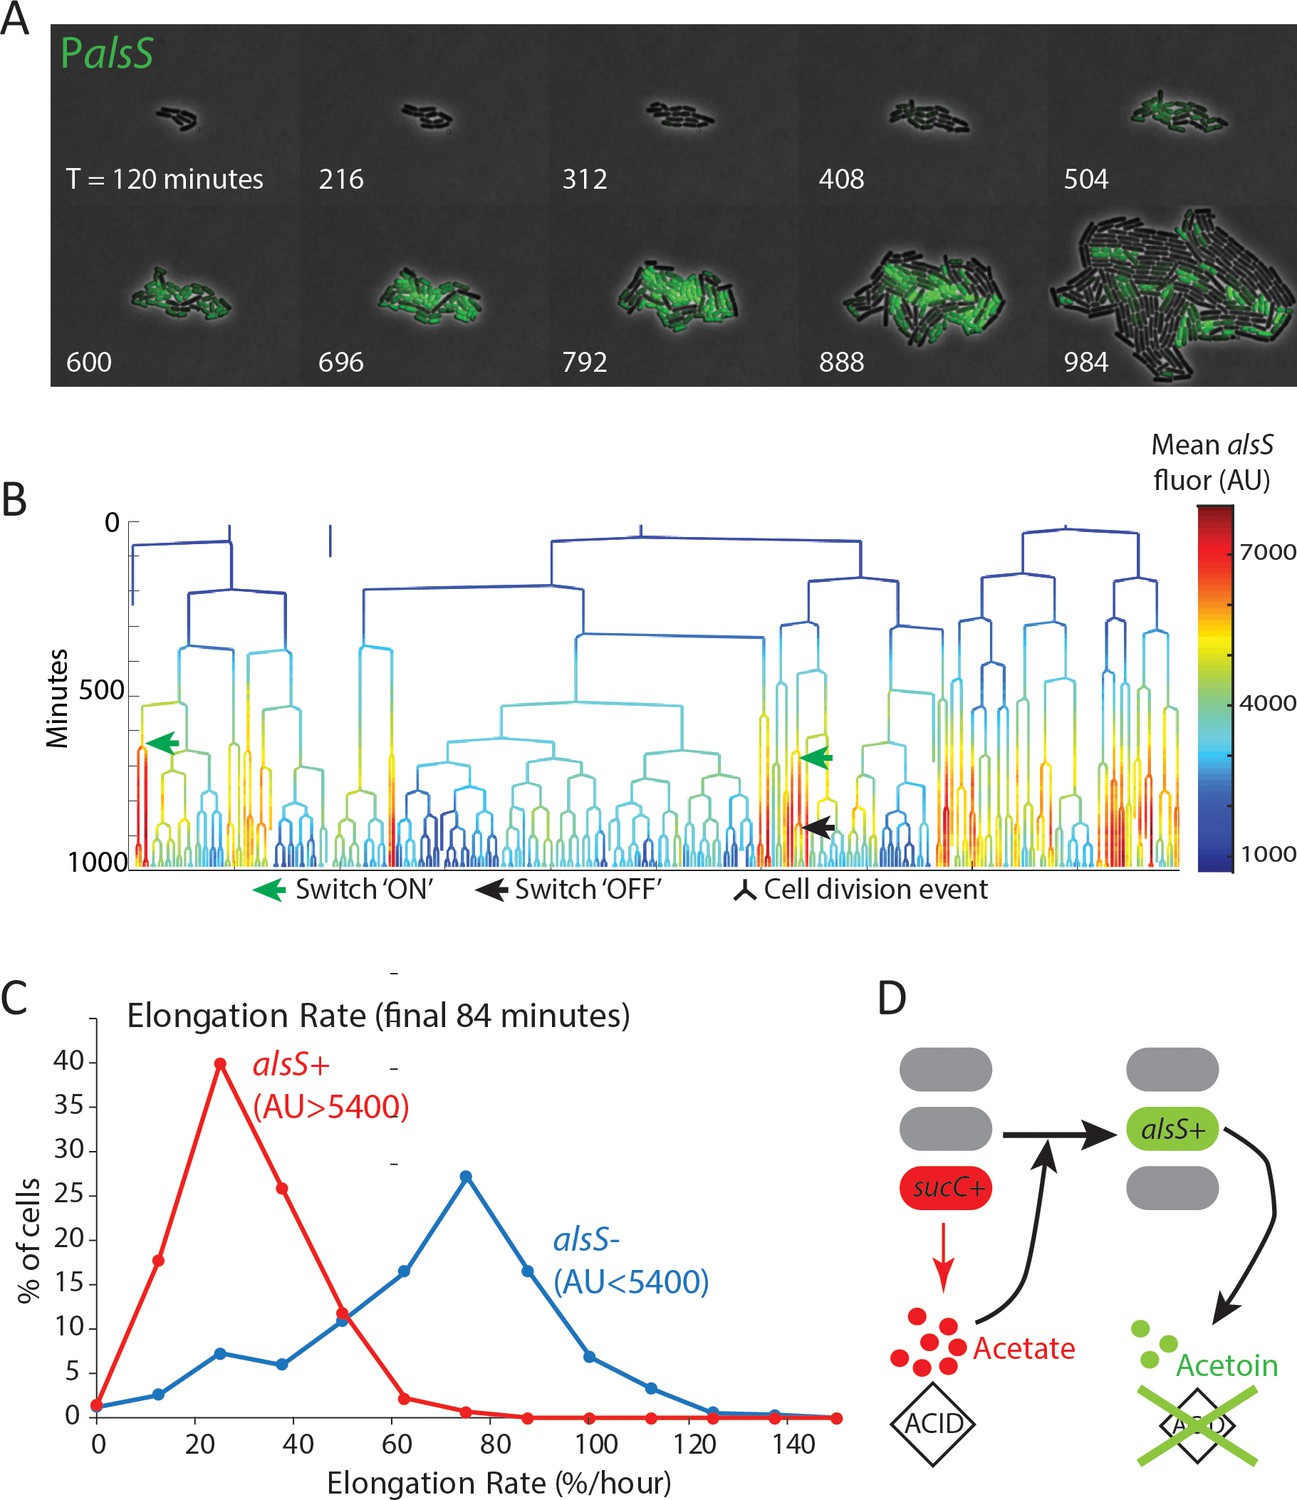
alsS +cells have slower division and elongation rate than alsS- cells.
(A) A filmstrip of a representative timelapse experiment. Cells were grown on agarose pads containing acetate at a level that mimics mid-exponential phase. Additional filmstrips are added in supplementary movies (B) AlsS+ cells divide more slowly. A genealogy tree depicts cell division events in the experiment shown in panel A. alsS levels are color coded by the heatmap on the right. Cells switch in and out of high alsS expression levels. Cells expressing high alsS levels (red and orange) divide more slowly than cells with low alsS levels (blue). Similar genealogy trees are provided for three separate experiments in Figure 4—figure supplement 1. (C) AlsS- cells in the end of the experiment have faster elongation rates. Cells in the last 7 frames of the experiment which had arbitrary fluorescence levels greater than 5400 were designated alsS+ and those expressing less were designated alsS-. The elongation rate of each group of cells was determined and plotted as a histogram. alsS- cells (blue line) had a median elongation rate of 65.2 %/hr while alsS+ cells (red line) had a median elongation rate of 19.96 %/hr. Similar analysis was performed for three separate experiments. (D) Summary sucC and alsS interactions (schematic): In early growth stages a subset of cells become sucC+. These cells secrete acetate, which accumulates to toxic levels. High acetate levels in turn activate some cells in the population to preferentially express metabolic genes for the production of acetoin, a non-toxic pH-neutral metabolite. Finally, acetoin replaces acetate in the media.
Figure 4—figure supplement 1
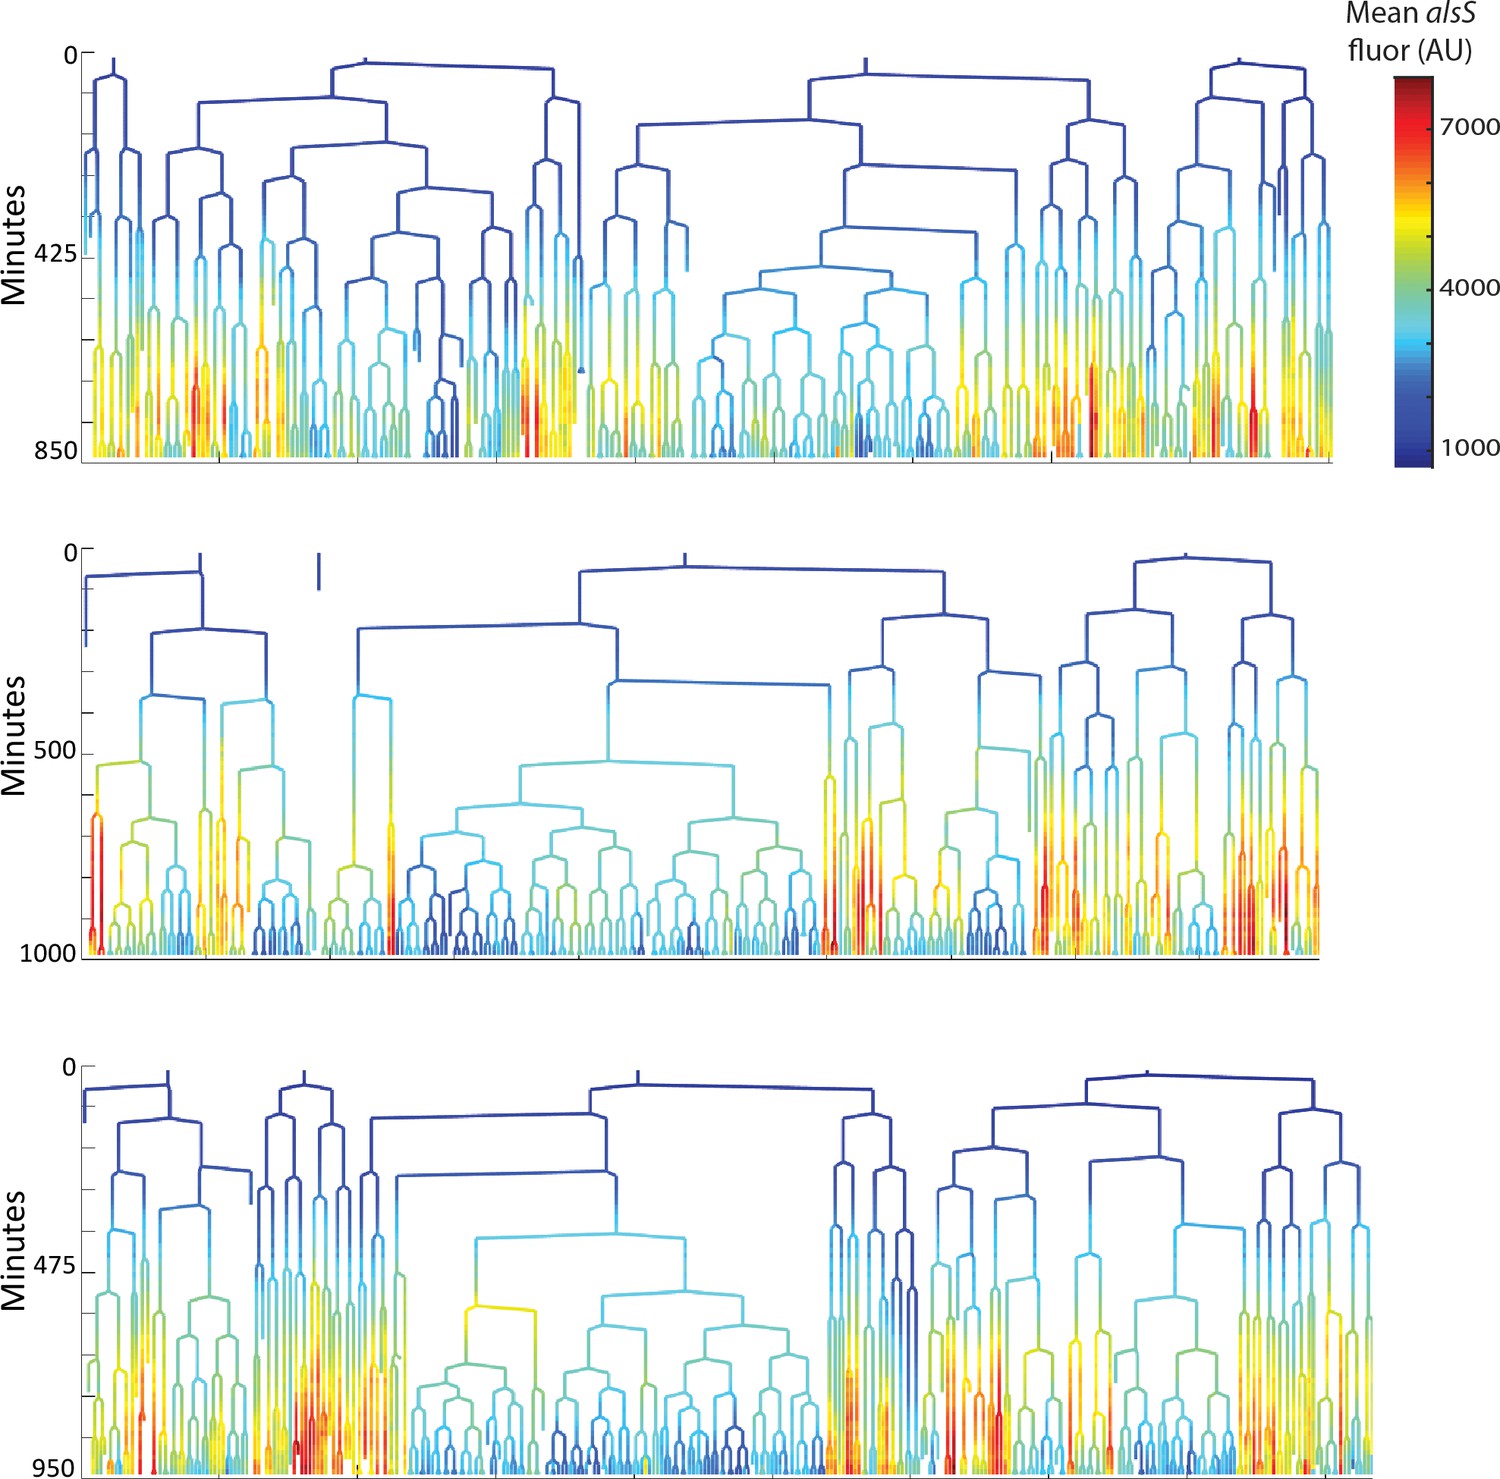
Cells expressing high levels of alsS divide more slowly than cells expressing lower levels.
The genealogy plots from three replicate pad experiments are provided. The movies from each movie are included as supplementary pad movies. Time in the movie is indicated on the tree ordinate (Y axis). The level of alsS is indicated by the provided heatmap.
Figure 4—figure supplement 2
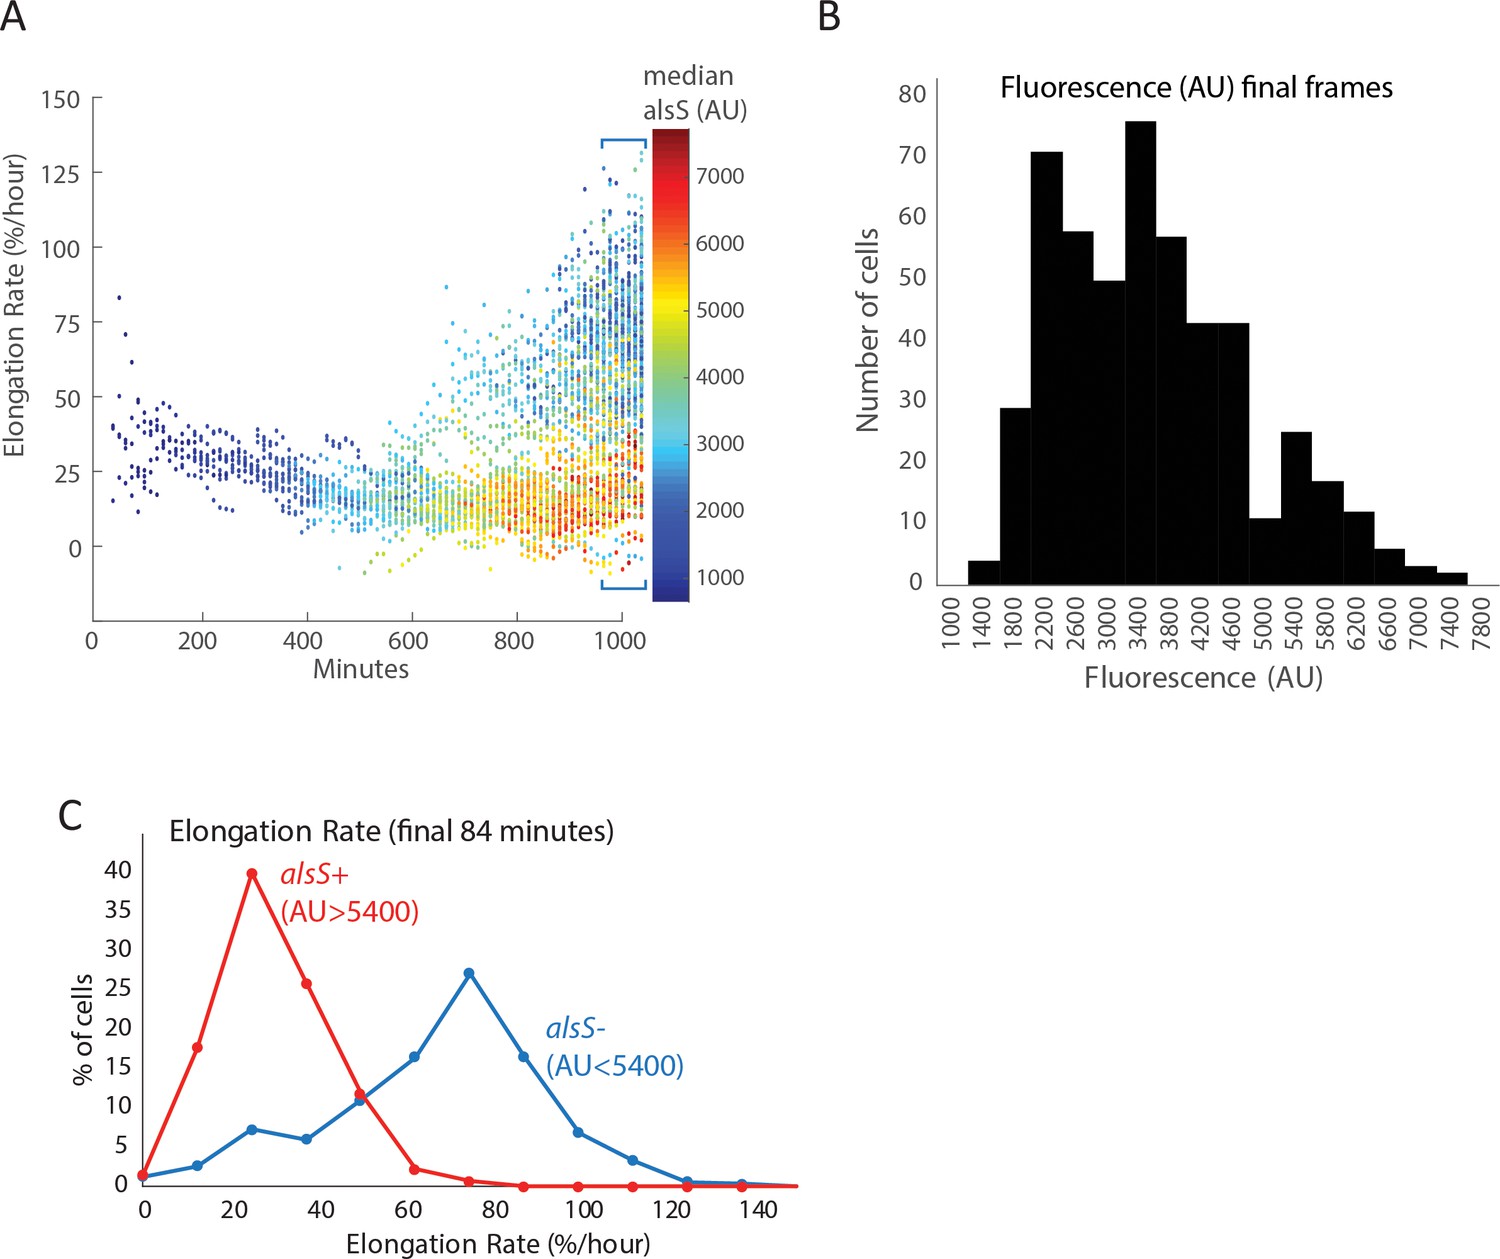
Cells expressing high levels of alsS elongate more slowly than cells expressing lower levels in the end of the pad culture experiment.
(A) The elongation rate of each cell throughout the entire length of the experiment is provided in the ordinate (Y axis) for all different times in the movie. The level of alsS promoter reporter fluorescence is indicated in the provided heatmap. Early in the movie all cells have low PalsS expression levels and slow elongation rate. Near the end of the movie cells expressing high levels of alsS (yellow, orange, and red dots) appear, having a slow elongation rate. Additionally, a population of low expressing cells (blue) with a faster elongation rate also appear near the end of the experiment. (B) The level of alsS in the final few frames is bimodal. Cells from the final frames were binned according to the level of alsS fluorescence. A low expressing population (AU <5400) and a high expressing population (AU >5400) are present. (C) The elongation rate in the final frames is higher for cells expressing low levels of alsS. Cells were designated high and low expressing based on the parameters in panel (B). Cells from each group (alsS high and alsS low) were binned based on elongation rates and bins were displayed as a histogram. The distribution of growth rates from cells expressing high alsS levels (red line) is left shifted (lower elongation values) compared to that of cells expressing high alsS levels (blue line).
Figure 4—figure supplement 3
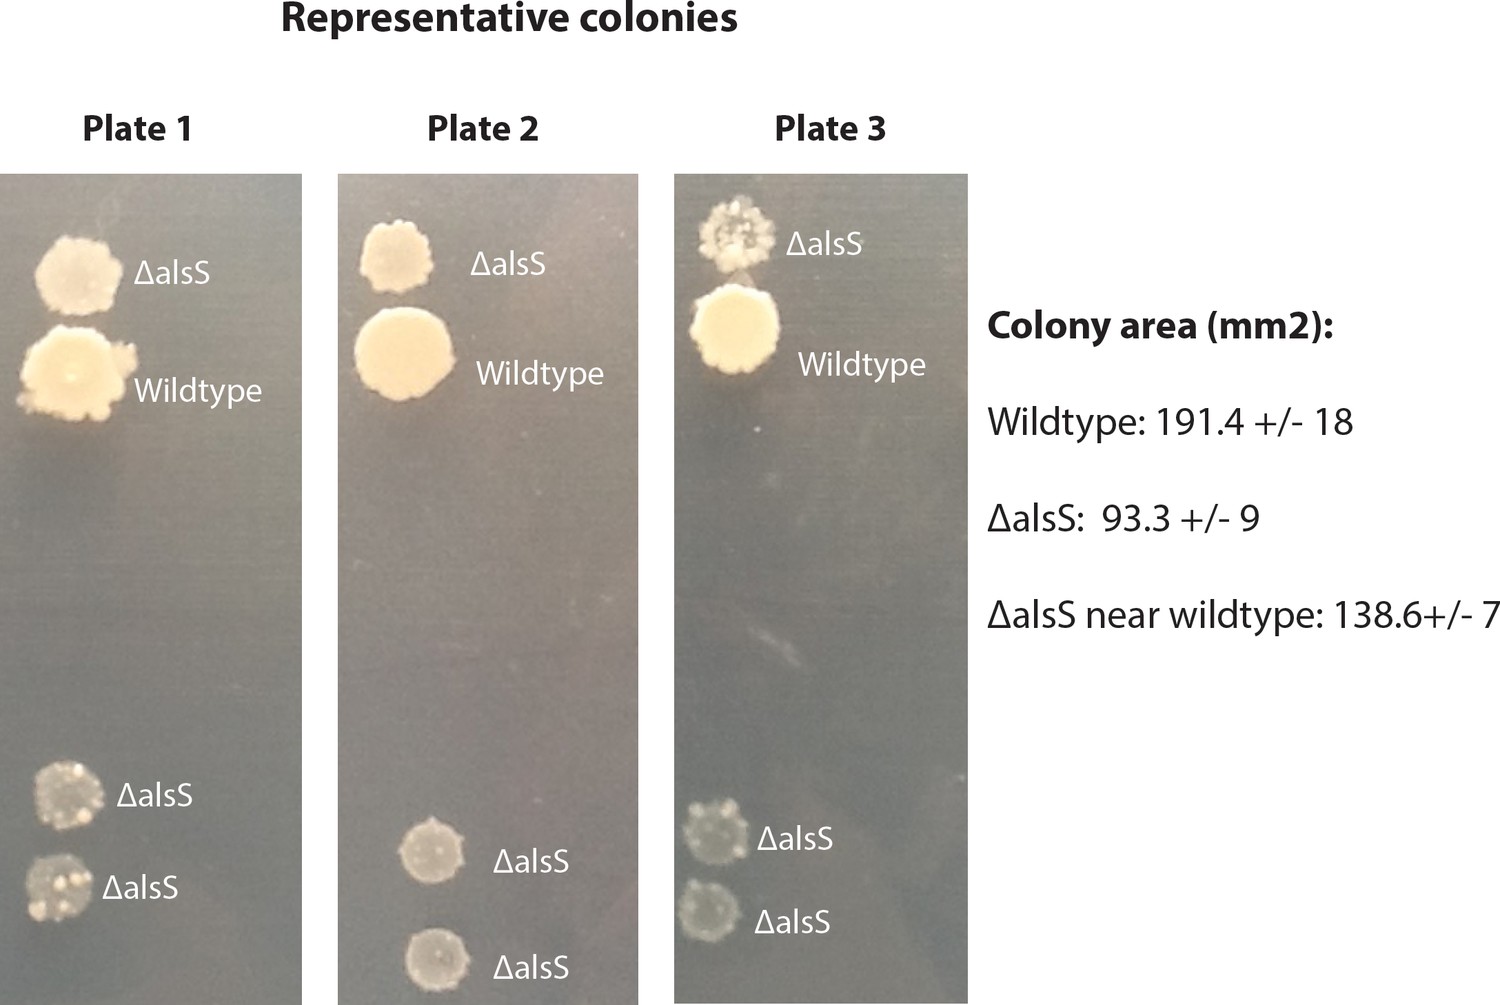
Cells able to express alsS enhance the growth of neighboring cells unable to express alsS by improving the extracellular growth environment.
Colonies started with equal cell numbers of a B. subtilis alsS deletion strain (ΔalsS) or wildtype strain were plated either next to themselves or next to each other. Wildtype colonies grew larger than ΔalsS colonies. Colonies of ΔalsS that were cultured next to (not physically touching) wildtype strain grew larger than ΔalsS colonies that were plated a distance away from the wildtype strain. The figure shows representative colonies from three separate petri dishes. Each dish had four self-self and four wildtype-ΔalsS sets of colonies. This result demonstrates that the wildtype strain enhances the growth of the deletion strain by altering the extracellular growth environment.
Videos
Video 1
A representative microscopy time-lapse video of sucC fluorescent reporter expression experiment demonstrates that a subset of cells switches sucC expression on and off.
Bright green cells, expressing high levels of sucC (sucC+) have a slower growth and division rate, but can still divide.
Video 2
A representative microscopy time-lapse video of alsS fluorescent reporter expression experimentdemonstrates that individual cells switch alsS expression on and off.
Bright green cells, expressing high levels of alsS (alsS+) are able to divide.
Video 3
One representative agarose-pad microcolony microscopy experiment of alsS fluorescent reporter demonstrates that individual cells switch alsS expression on and off.
Bright green cells, expressing high levels of alsS (alsS+) divide and elongate more slowly, but are able to divide.
Video 4
A second representative agarose-pad microcolony microscopy experiment of alsS fluorescent reporter demonstrates that individual cells switch alsS expression on and off.
Bright green cells, expressing high levels of alsS (alsS+) divide and elongate more slowly, but are able to divide.
Video 5
A third representative agarose-pad microcolony microscopy experiment of alsS fluorescent reporter demonstrates that individual cells switch alsS expression on and off.
Bright green cells, expressing high levels of alsS (alsS+) divide and elongate more slowly, but are able to divide.
Additional files
-
Supplementary file 1
A table listing the strains used in this work.
- https://doi.org/10.7554/eLife.33099.022
-
Supplementary file 2
Genes significantly differentially regulated in cells sorted by PalsS:YFP fluorescence.
Genes that are significantly differentially regulated in the sorting and RNAseq experiments are sorted based on P-values. Genes in green text have P-values of 5.0 e-5 or smaller
- https://doi.org/10.7554/eLife.33099.023
-
Supplementary file 3
Genes that were not significantly regulated in cells sorted by PalsS:YFP fluorescence.
- https://doi.org/10.7554/eLife.33099.024
-
Transparent reporting form
- https://doi.org/10.7554/eLife.33099.025
Download links
A two-part list of links to download the article, or parts of the article, in various formats.
Downloads (link to download the article as PDF)
Open citations (links to open the citations from this article in various online reference manager services)
Cite this article (links to download the citations from this article in formats compatible with various reference manager tools)
Metabolic interactions between dynamic bacterial subpopulations
eLife 7:e33099.
https://doi.org/10.7554/eLife.33099


