The major β-catenin/E-cadherin junctional binding site is a primary molecular mechano-transductor of differentiation in vivo
- PSL University, France
Figures
Figure 1 with 3 supplements
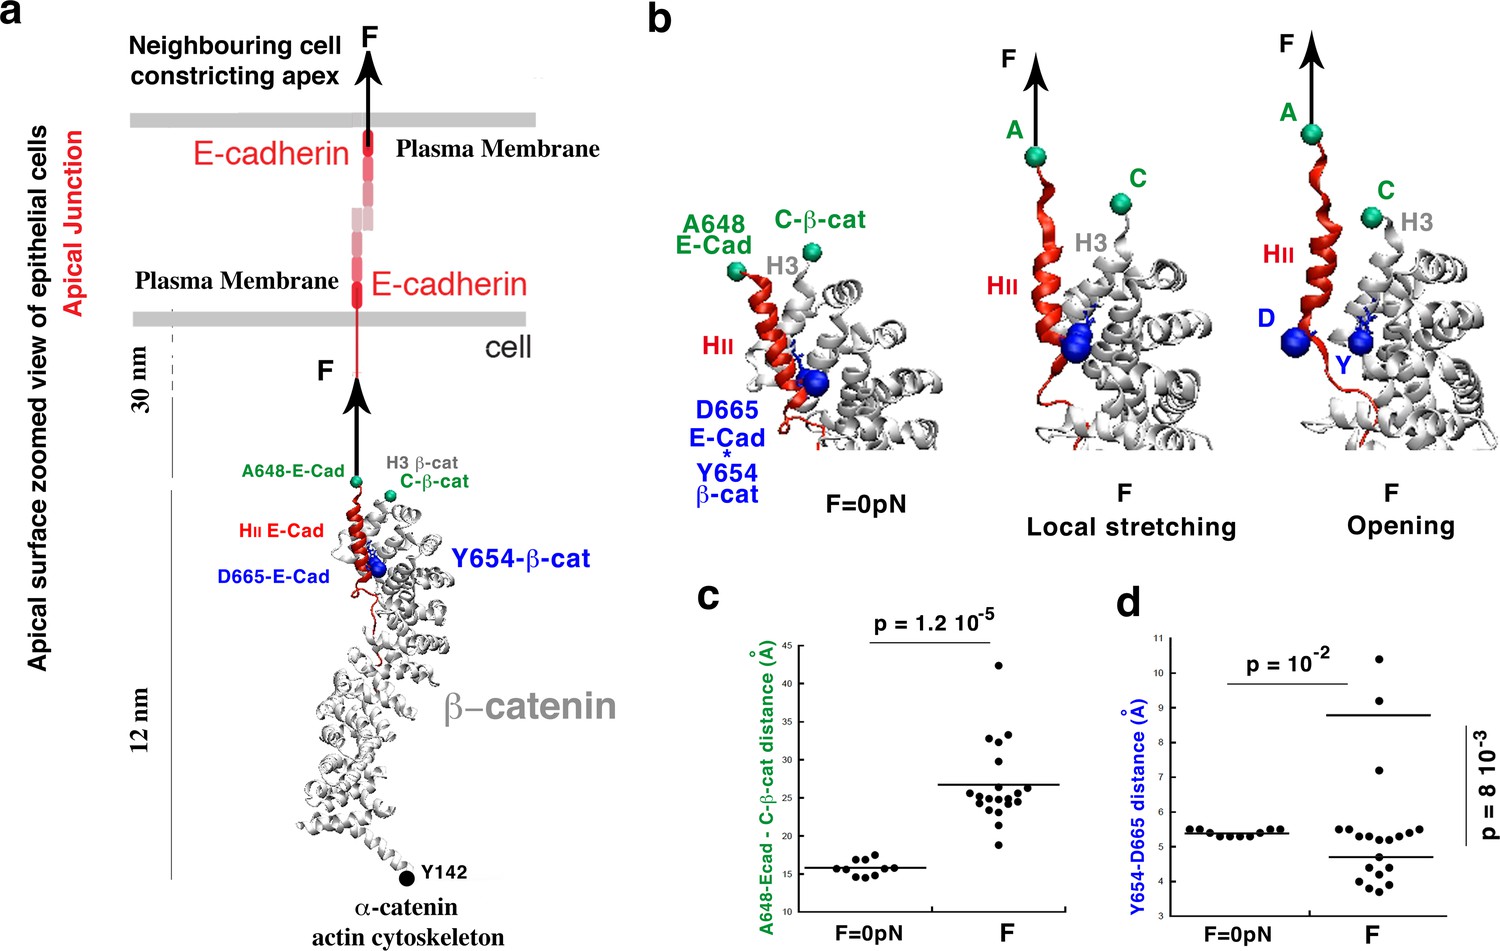
Molecular dynamics simulations of the β-cat/E-cad complex under mechanical strain.
(a) Stretching of the apical junctional β-cat/E-cad complex in response to an external force applied from the outside of the cell by constricting apexes of neighbouring cells. (b) Zoom on the local stretching between HII-E-cad and H3−β-cat helices, linked by the Y654-β-cat-D665-E-cad interacting site, leading to its opening. (c) Quantification of the HII-E-cad-HII-E-cad local stretching mean distance between A648-E-cad and C-β-cat under a force F equivalent to 6 pN strain compared to control. (d) Quantification of the mean distance between Y654-β-cat and D665-E-cad (distance between the OH of the Y654 phenol and the carbon of COO- of the D665 aspartate). Controls (F = 0 pN): N = 10. Strained: N = 20. Statistical test: Mann-Whitney.
-
Figure 1—source data 1
Y654-ß-cat-D665-E-cad interacting site distances under local H3-ß-cat-HII-E-cad stretching due to the global stretching of the ß-cat-E-cad complex, molecular dynamics simulation.
- https://doi.org/10.7554/eLife.33381.006
Figure 1—figure supplement 1
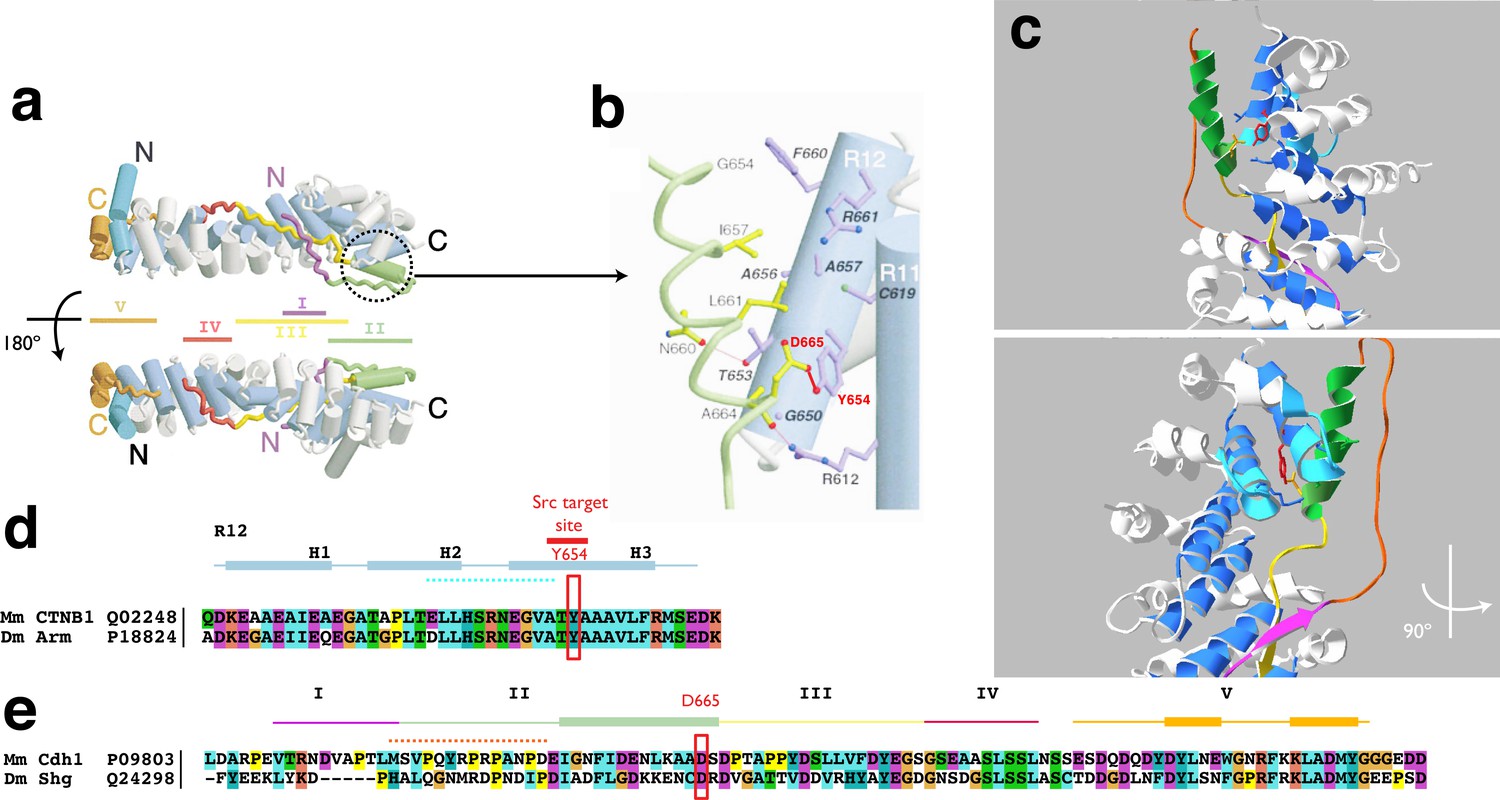
Molecular basis of FRET/FLIM design.
(a) Overall structure of the mouse E-cad cytoplasmic tail in complex with mouse ß-cat as a ribbon diagram. Cylinders represent α-helices and the arm repeat region of ß-cat is shown in grey (H1, H2 and intervening loops) and blue (H3). The regions of E-cad are shown in magenta (I), green (II), yellow (III), red (IV), and brown (V). The N- and C- terminus of each protein is marked. Structure based on reference (Huber and Weis, 2001). (b) ß-cat in complex with Region II of E-cad showing the interaction of ß-cat Y654 with E-cad D665, in mice. Arm repeats in ß-cat are marked with R. Residues of ß-cat are labelled in bold italics, and residues of E-cad in plain text. Oxygen, nitrogen, and sulphur are shown in red, blue and green spheres, respectively. Individual side chains of ß-cat are shown in purple (H3) or grey (others). Only those residues are shown that form direct contacts between the two proteins. E-cad is shown with yellow bonds while hydrogen bonds and salt bridges are shown as thin pink lines. (c) Model of the Drosophila ß-cat protein (Armadillo) shown as a white ribbon diagram (Model structure was build using the SwissModel program) in complex with the c-terminal part of DE-cad. The Drosophila Armadillo Y667 residue that corresponds to the mouse Y654 residue is shown in red. The Armadillo loops between alpha-helices H2 and H3 of Arm repeat 12 and between alpha-helices H2 and H3 of Arm repeat 11 are coloured in light blue. DE-cad is shown in the different colours corresponding to its different interaction regions (here only region I, II and III). The sequence of region II used as immunogen is coloured in bright orange.. The lower panel is the same view but turned by 900. (d) Sequence alignment of the 12th Arm repeat of the ß-cat protein of different model species is shown with the Src phosphorylation site of a specific Tyrosine is boxed in red. (e) Sequence alignment of the cytoplasmic tail of E-cad of Mus musculus (Mm), and Drosophila melanogaster (Dm) with corresponding UniProt identifiers are given. Colours encode chemical properties of amino acids, following ClustalX 2.1 conventions. The lines on top indicate the different regions of interaction with ß-cat (shown in c) with the boxes indication alpha-helices. The interaction site with the key residue D665 for the interaction with tyrosine Y654 in the ß-cat protein is indicated (red box).
Figure 1—figure supplement 2

Y654-ß-cat-D665-E-cad interacting site distances under local H3-ß-cat-HII-E-cad stretching due to the global stretching of the ß-cat-E-cad complex.
(a) Global stretching of the β-cat/E-cad complex in response to an external force applied to the A648-Ecad site of the HII-E-cad (leading to an extension corresponding to a force F equivalent to 6 pN), compared to the F = 0 pN control. (b) End to end A648-E-cad-Y142- ß-cat distance, (c) A648-E-cad - ß-cat-C-terminus and d) Y654-ß-cat-D665-E-cad distances, in response to the application of the F = 150 pN force in 30ns (equivalent to a F = 6 pN experimental force at 12.5 ns, see text) force (N = 20) on the A648-E-cad site of the ß-cat/E cad complex, compared to F = 0 pN control (N = 10).
Figure 1—figure supplement 3
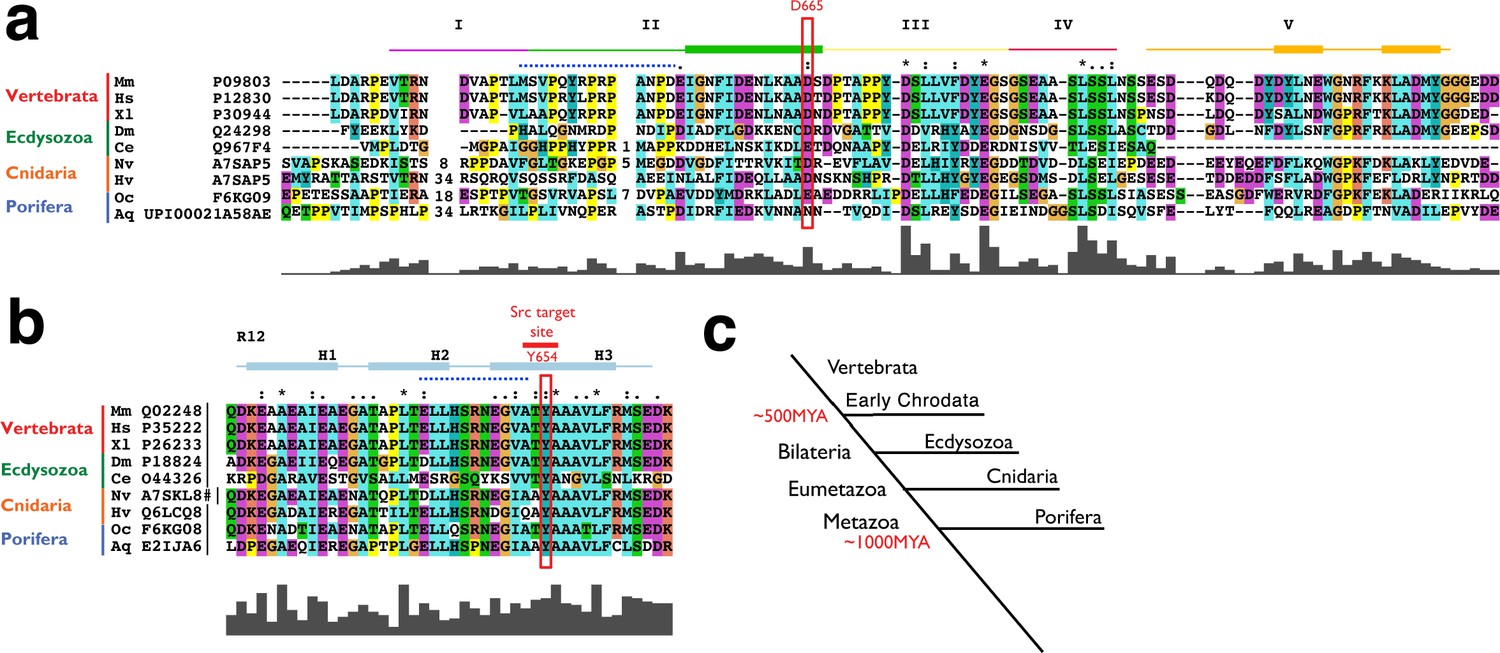
Conservation of both the Y654-β-cat and D665-E-cad sites across metazoans.
(a) Sequence alignment of the cytoplasmic tail of E-cad of different model species. The lines on top indicate the five different regions of interaction with ß-cat (shown in B) with the boxes indication α-helices. The key residues of the Y654-β-cat-D665-E-cad interacting site are boxed in red. Colours reflect chemical properties of amino acids, following ClustalX 2.1 conventions. Asterix, colons and periods indicate single, fully conserved residues or groups of residues with strongly or weakly similar properties, respectively. Gray bars denote the ClustalX conservation scores for each column of amino acids, ranging between 100 (fully conserved) to 0 (not at all conserved). Protein sequences and corresponding UniProt identifiers are given for Mus musculus (Mm), Homo sapiens (Hs), Xenopus laevis (Xl), Branchiostoma oridae (Bf), Drosophila melanogaster (Dm), Cernohapditis elegans (Ce), Nematostella vectensis (Nv), Hydra vulgaris (Hv), Oscarella carmela (Os), Amphimedon queesnlandica (Aq) are shown. (b) Sequence alignment of the 12th Arm repeat of the ß-cat protein of different model species is shown with the Src phosphorylation site of a specific Tyrosine is boxed in orange. Colours, symbols and bars as in (a), # denotes self-annotation of the ß-cat protein (combining the sequences XP_001647517.1 and XP_001647518.1). (c) Schematic Phylogenetic tree indicating the phylogenic relationship of the metazoans used for sequence comparison.
Figure 2 with 2 supplements
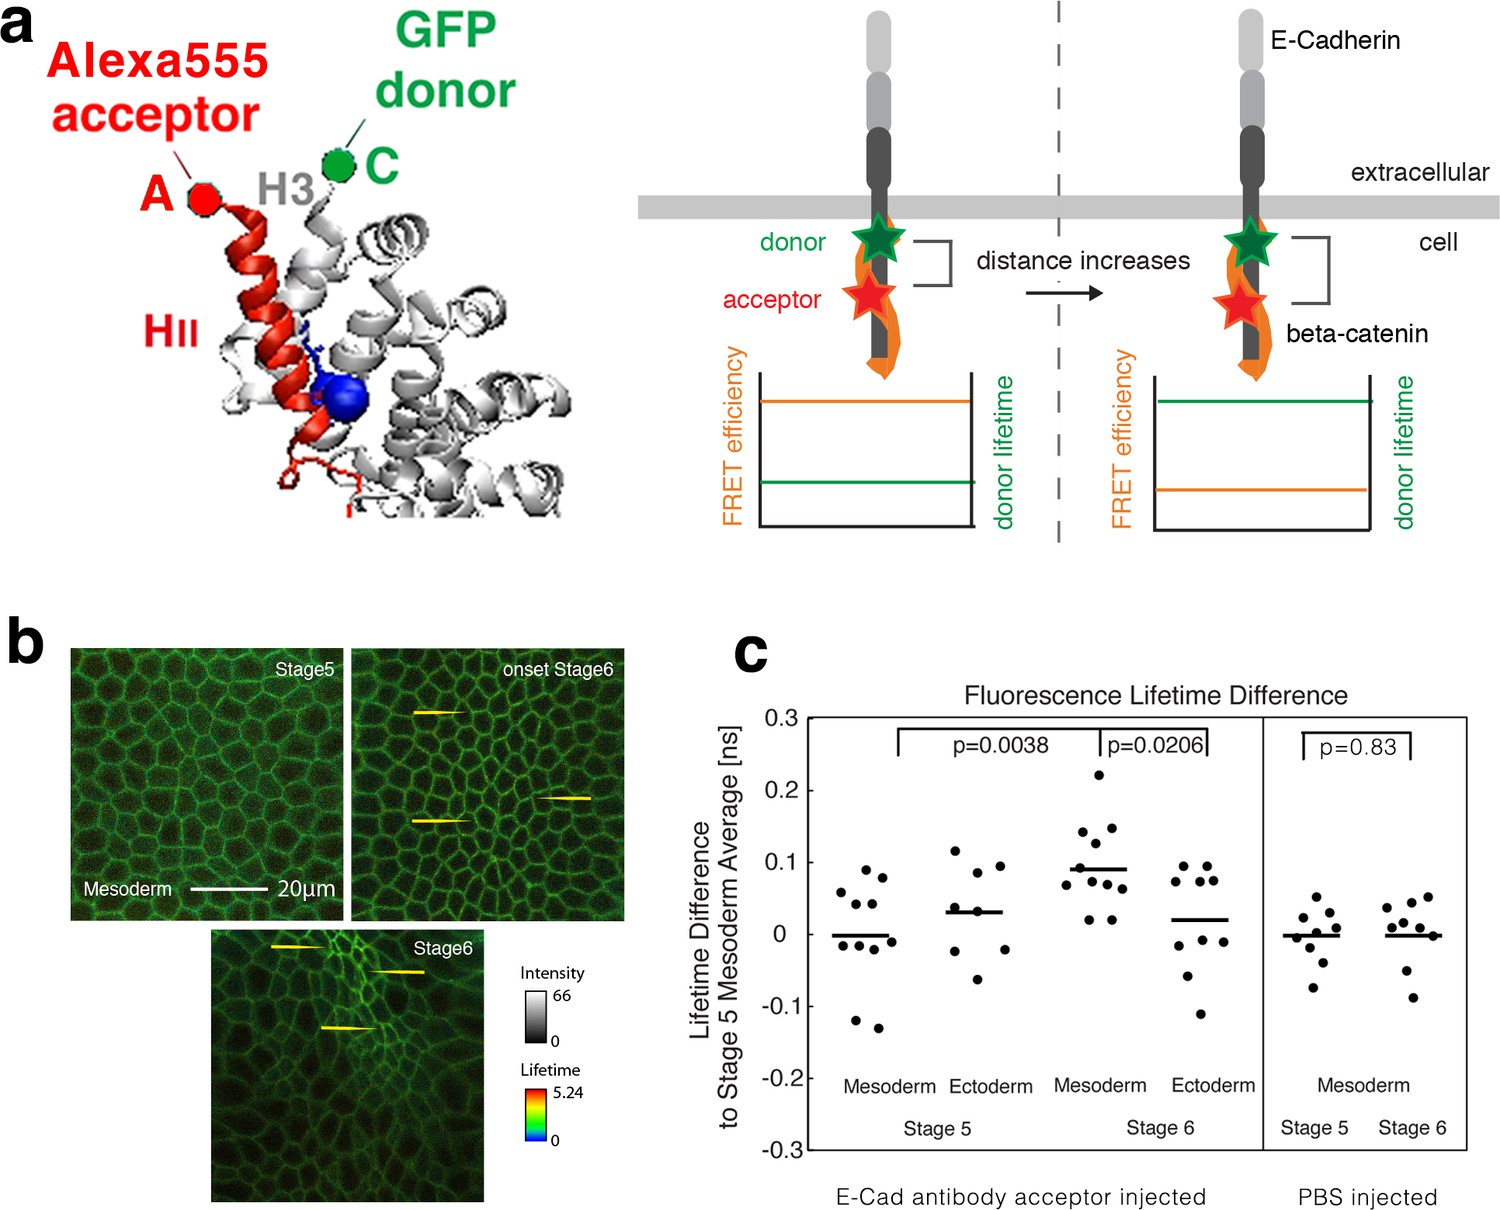
Fluorescence lifetime measurements of the β-cat-C-terminus-GFP donor in the presence of the Alexa555 antibody against E-cad linear region II as acceptor mesoderm invagination.
(a) Illustration of FRET experiments performed at two different stages of development when the strain in the tissue builds up. Embryos expressing β-cat-GFP (donor) are injected with anti-E-cad antibodies directly labelled with Alexa555 (acceptor) for FRET experiments. FRET experiments are performed by analysing the lifetime of the donor. Images showing the lifetime of GFP donor: the FRET efficiency will decrease when the two sites that are attached to the fluorophore, become more separated by increased strain in the molecule. Structure based on reference (Huber and Weis, 2001). (b) Invaginating embryo showing the invaginated furrow at stage 6 with a longer junctional lifetime compared to the surrounding ectodermal tissue and to stage 5 mesoderm cells (examples shown with yellow arrows). (c) Left- Quantification of the lifetime difference at different stages and different tissues. ANOVA test p value: p=0.0156. T-test p-values are of p=0.021 for mesoderm (N = 11) versus ectoderm (N = 10) at stage 6 and 0.004 for mesoderm at stage 6 versus stage 5 (N = 11). No significant change was observed in the ectoderm at stage 6 (N = 10) compared to stage 5 (N = 8) (p=0.74), and between the mesoderm and the ectoderm at stage 5 (p=0.33). In some embryos, the ectoderm could not be imaged properly. Right- Differences of lifetime of β-cat-GFP expressing Drosophila embryos injected with PBS without antibody in the mesoderm at stage 5 (N = 9) and stage 6 (N = 9) respectively (p=0.83). As expected, PBS injection without the antibody acceptor lead to a lifetime of 2.600 ± 0.039 ns, higher compared to 2.473 ± 0.074 ns with the antibody at stage 5 (see Figure 2c-source data2, p=0.00016). Statistical tests are t-student.
-
Figure 2—source data 1
Fluorescence lifetime measurements of the β-cat-C-terminus-GFP donor in the presence of the E-cad linear region II Alexa555 acceptor during mesoderm invagination.
- https://doi.org/10.7554/eLife.33381.012
-
Figure 2—source data 2
FLIM signal of the β-cat-GFP donor in the absence of acceptor during mesoderm invagination.
- https://doi.org/10.7554/eLife.33381.013
Figure 2—figure supplement 1
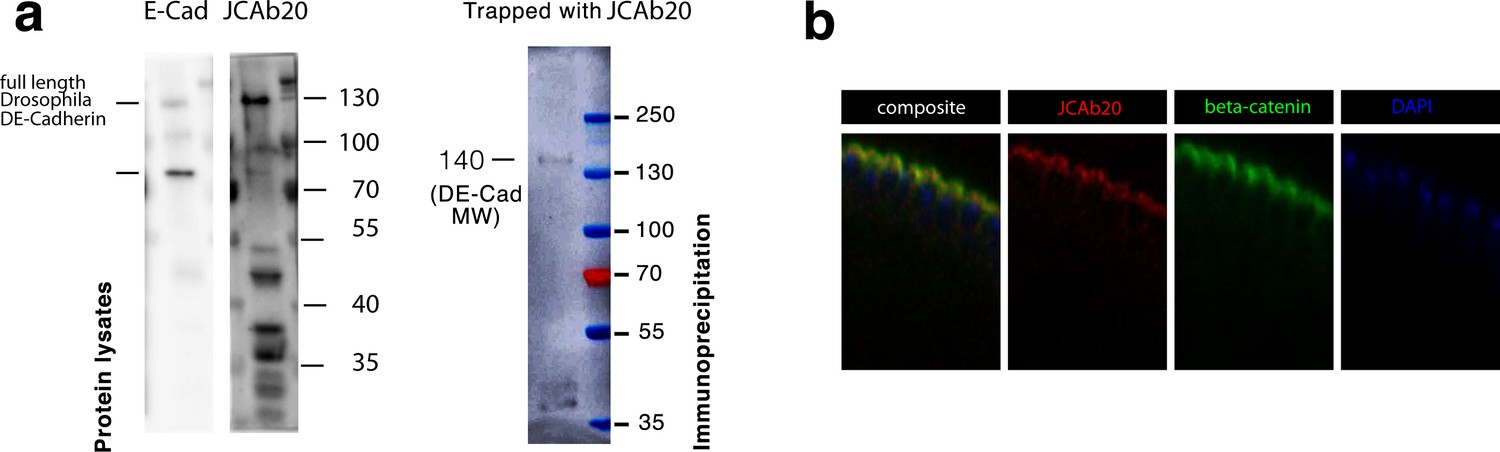
Specific labeling of junctional E-cad with JCAb20.
(a) Left: Western blots showing whole embryo protein extracts (denatured conditions) detected with either DE-cad antibody (first lane) or our new JCAb20 against the region in E-cad binding to β-cat at the Y654-β-cat/D665-E-cad site. Right: Immunoprecipitation by using the JCAb20 antibody as a trap, and the DE-cad antibody for revelation. The band is at the 140 kDA weight of the mature DE-cad protein. Other bands around 40 kDA are presumably immunoglobulins. Colored bands are pre-stained markers. (b) Immunostainings of methanol fixed embryo mesoderm epithelia at stage 5. Note that the epitope detected by the antibody JCAb20 co-localises with β-cat. See Table 1 for the list of hits resulting from a standard protein-protein BLAST search against the Drosophila proteome (taxid: 7227) for the immunogen peptide sequence used to generate the JCAb20 antibody.
Figure 2—figure supplement 2
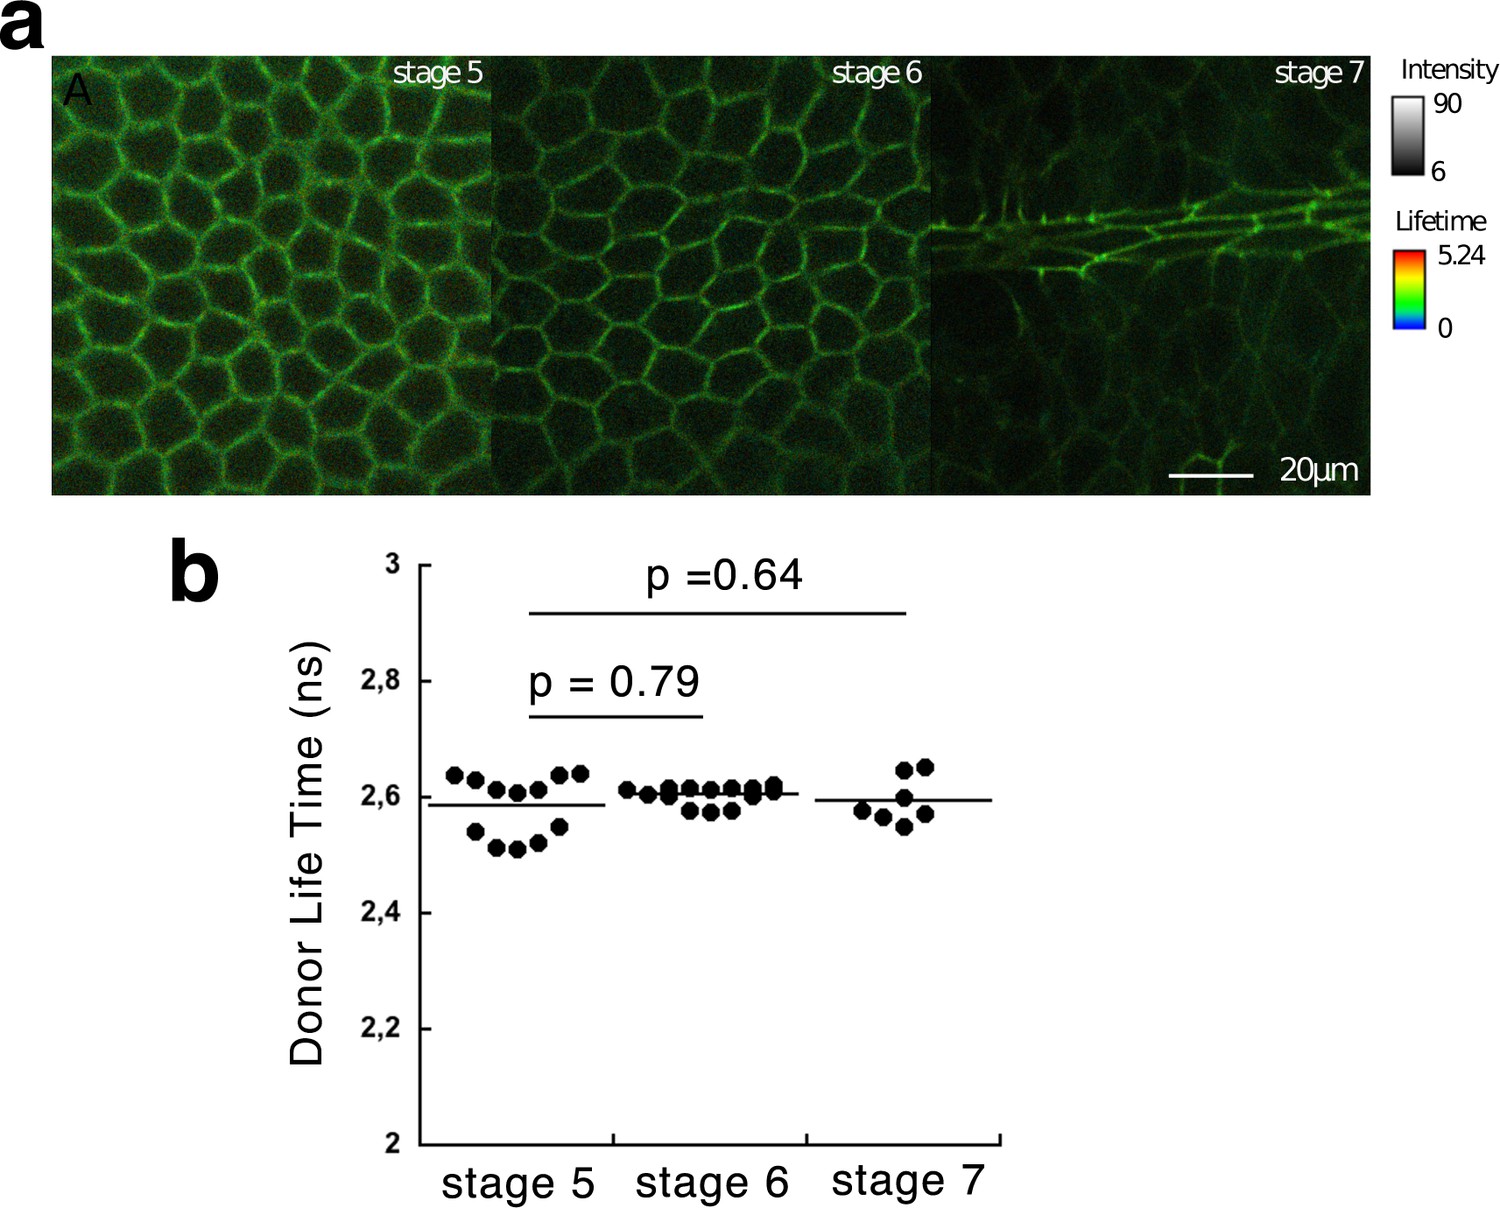
FLIM signal of the β-cat-GFP donor in the absence of acceptor during mesoderm invagination.
(a) Lifetime images of β-cat-GFP expressing Drosophila embryos at stages indicated. (b) Average donor lifetime of β-cat-GFP expressing Drosophila embryos. Mean values and standard deviation are shown. p-values are 0.79 (stage 5 and 6), 0.64 (stage 5 and 7) (Mann-Whitney test) N = 12 (stage 5), N = 14 (stage 6) and N = 7 (stage 7).
Figure 3
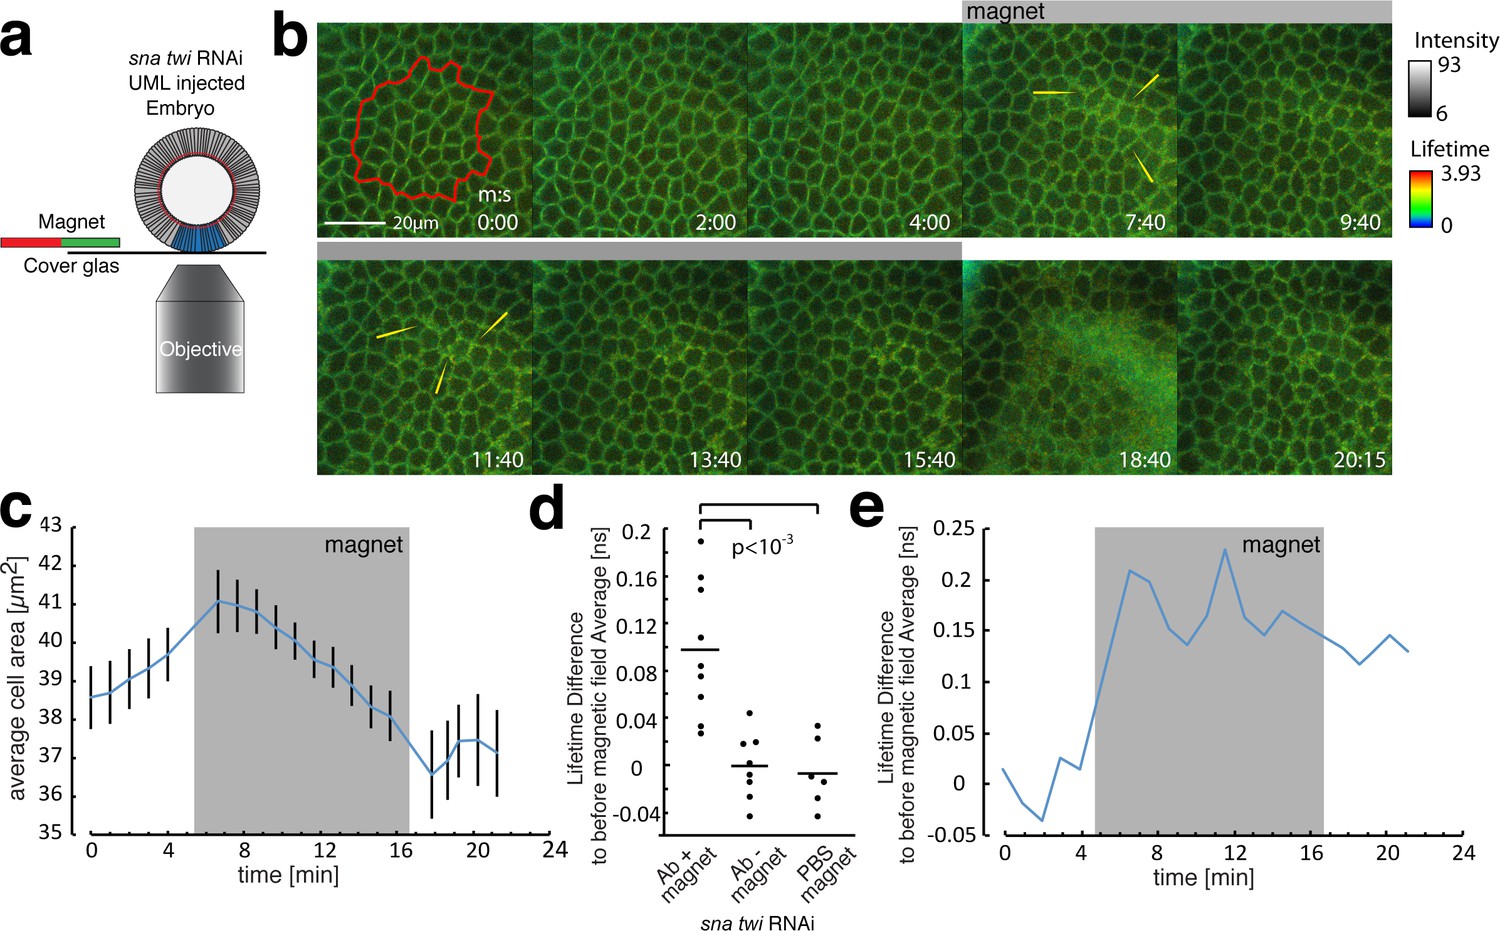
FLIM measurements in the mesoderm in response to magnetically induced cell apex constriction mimicking the onset of mesoderm invagination.
(a) Illustration of the magnetic stimulation setup. The blue region corresponds to the mesoderm, in which UMLs where injected. (b) Time series of a magnetic stimulation experiment with β-cat-GFP expressing flies injected with siRNA for snail and twist as well as UMLs and Alexa555 labelled antibody against E-cad. The grey bar indicates when magnetic force was applied. Yellow arrows indicate examples of lifetime increase in the junctions. Times are indicated in min/s. (c) Quantification of the cell apex area for the experiment shown in b. Note that the area is decreasing in the sna twi RNAi background when the magnetic field is applied. (d) Lifetime difference of stage 6 to the average lifetime before magnetic field application of stage 5, of N = 9 experiments with magnet applied and N = 8 without magnet applied as well as N = 6 experiments with PBS instead of antibody injected and magnet applied. Whereas the experiments without magnetic field applied, or PBS instead of antibody injected, show no difference, the one with antibody and magnetic field applied show a significant increase of the lifetime, p value = 0.00061 (t-students test). The absence of increase of the lifetime difference within sna twi RNAi non-invaginating conditions without magnet between stage 5 and stage 6 is characterized by the p-value p=0.0003 compared to the increase between stage 5 and 6 in the invaginating WT of Figure 2c-left, and of p=0.75 compared to the lifetime difference in the invaginating WT injected with PBS of Figure 2c-right (t-students test). (e) Lifetime difference to the average lifetime before the magnetic field was applied for the experiment shown in. Grey box indicates when the magnetic field was applied.
-
Figure 3—source data 1
FLIM measurements in the mesoderm in response to magnetically induced cell apex constriction mimicking the onset of mesoderm invagination.
- https://doi.org/10.7554/eLife.33381.016
Figure 4
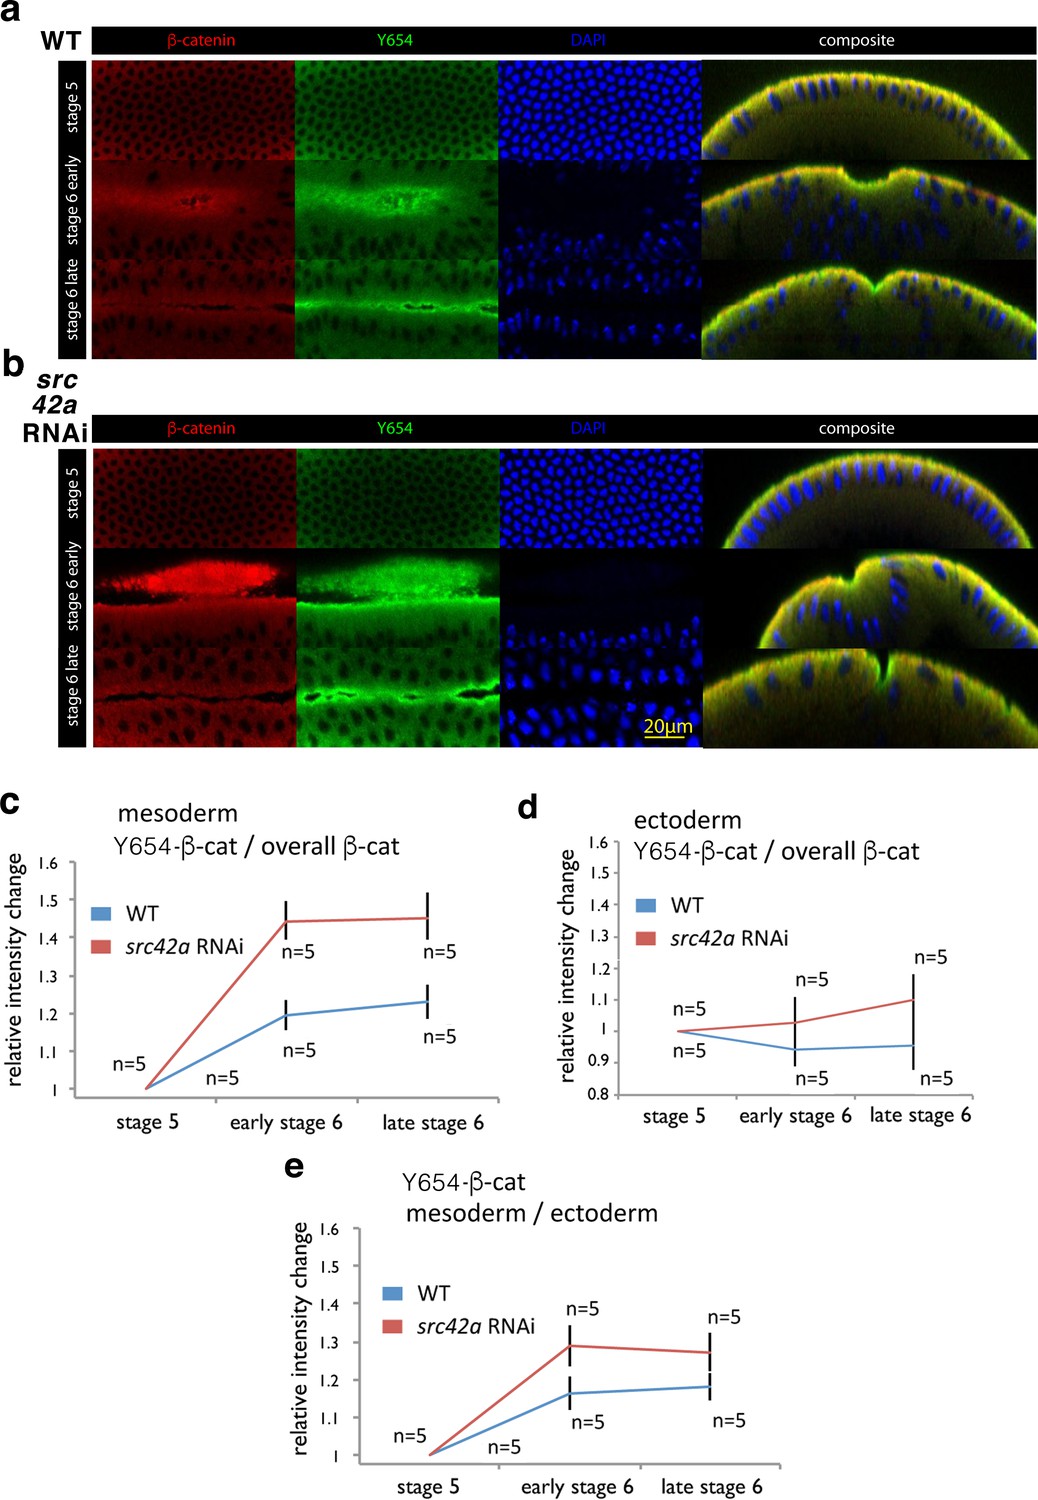
Increase of accessibility of Y654-β-cat in the mesoderm during invagination.
(a, b) Fluorescent labelling of wild type (WT) (a) and src42A RNAi (b) embryos at three different stages for β-cat in red, the not phosphorylated tyrosine Y654 of β-cat in green and nuclei in blue (DAPI). Composite are cross-cuts of the 3D reconstructed images of the latter three colour images of the embryo. (c) Relative intensity change of antibody fluorescent signal against the non-phosphorylated non-phosphorylated Y654-β-cat site of Src42A phosphorylation in the mesoderm junctions, normalized to the junctional total β-cat signal, in wild type (WT) and src42A RNAi (Src42A knock down) background condition. Values are relative to stage 5. N = 5 in the WT, and N = 5 in the src42A RNAi. Mean and SEM are shown, t-test p=value 0.00181 and 0.00021 at early stage 6, 0.000508 and 0.00330 at late stage 6 for WT and src42A RNAi, respectively. WT compared to src42A RNAi early stage 6 p=0.00355, late stage 6 p=0.00879, difference between the two curves p=0.0003. (d) Relative intensity change of antibody fluorescent signal against the non-phosphorylated Y654-β-cat site of Src42A phosphorylation in the ectoderm junctions, normalized to the junctional total β-cat signal, in wild type (WT) and src42A RNAi (Src42A knock down) background condition. Values are relative to stage 5. N = 5 in the WT, and N = 5 in the src42A RNAi. Mean and SEM are shown, t-test p=value of 0.439 and 0.738 at early stage 6, of 0.578 and 0.347 at late stage 6 for WT and src42A RNAi, respectively. WT compared to src42A RNAi early stage 6 p=0.247, late stage 6 p=0.162, difference between the two curves p=0.169. (e) Relative intensity change of the non-phosphorylated Y654-β-cat site of the mesoderm signal to the non-phosphorylated Y654-β-cat ectoderm signal within the same embryos. Mean and SEM are shown, t-test p=value 0.0103 and 0.000278 at early stage 6, 0.0125 and 0.00256 at late stage six for WT and src42A RNAi, respectively. WT compared to src42A RNAi early stage 6 p=0.049, late stage 6 p=0.063, difference between the two curves p=0.021.
-
Figure 4—source data 1
Increase of accessibility of Y654-β-cat in the mesoderm during invagination.
- https://doi.org/10.7554/eLife.33381.018
Figure 5 with 1 supplement
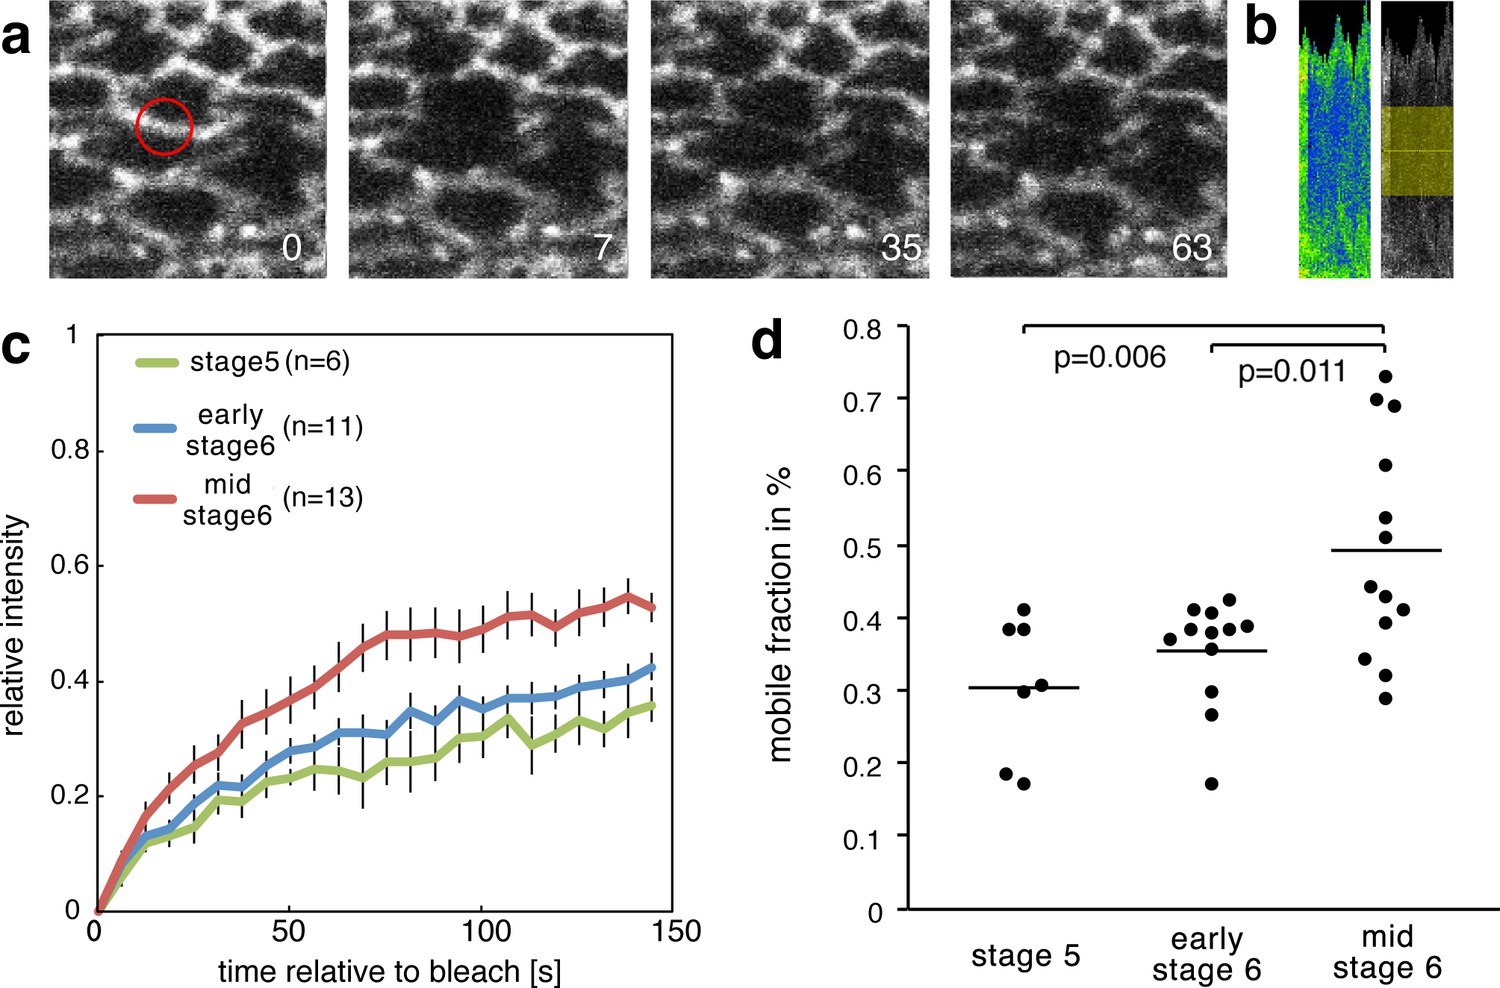
Increase of the mobile fraction of β-cat-GFP in the mesoderm during invagination.
(a) Image sequence of mesodermal cells expressing β-cat -GFP during a FRAP experiment. The red circle shows the region of photobleaching. Time in seconds is given relative to bleaching. (b) Corresponding kymograph of d in rainbow LUT and black and white with indicated ROI for value calculation. (c) Relative intensity after photobleaching of β-cat-GFP in the mesoderm at three different stages during early Drosophila embryonic development, just before and during invagination. Time in seconds is given relative to bleaching. (d) Mobile fraction in %. Mann-Whitney test p-values are p=0.011 and p=0.006 for early stage 6 (N = 12) and mid stage 6 (N = 13) compared to stage 5 (N = 7).
-
Figure 5—source data 1
Increase of the mobile fraction of β-cat-GFP in the mesoderm during invagination.
- https://doi.org/10.7554/eLife.33381.021
Figure 5—figure supplement 1
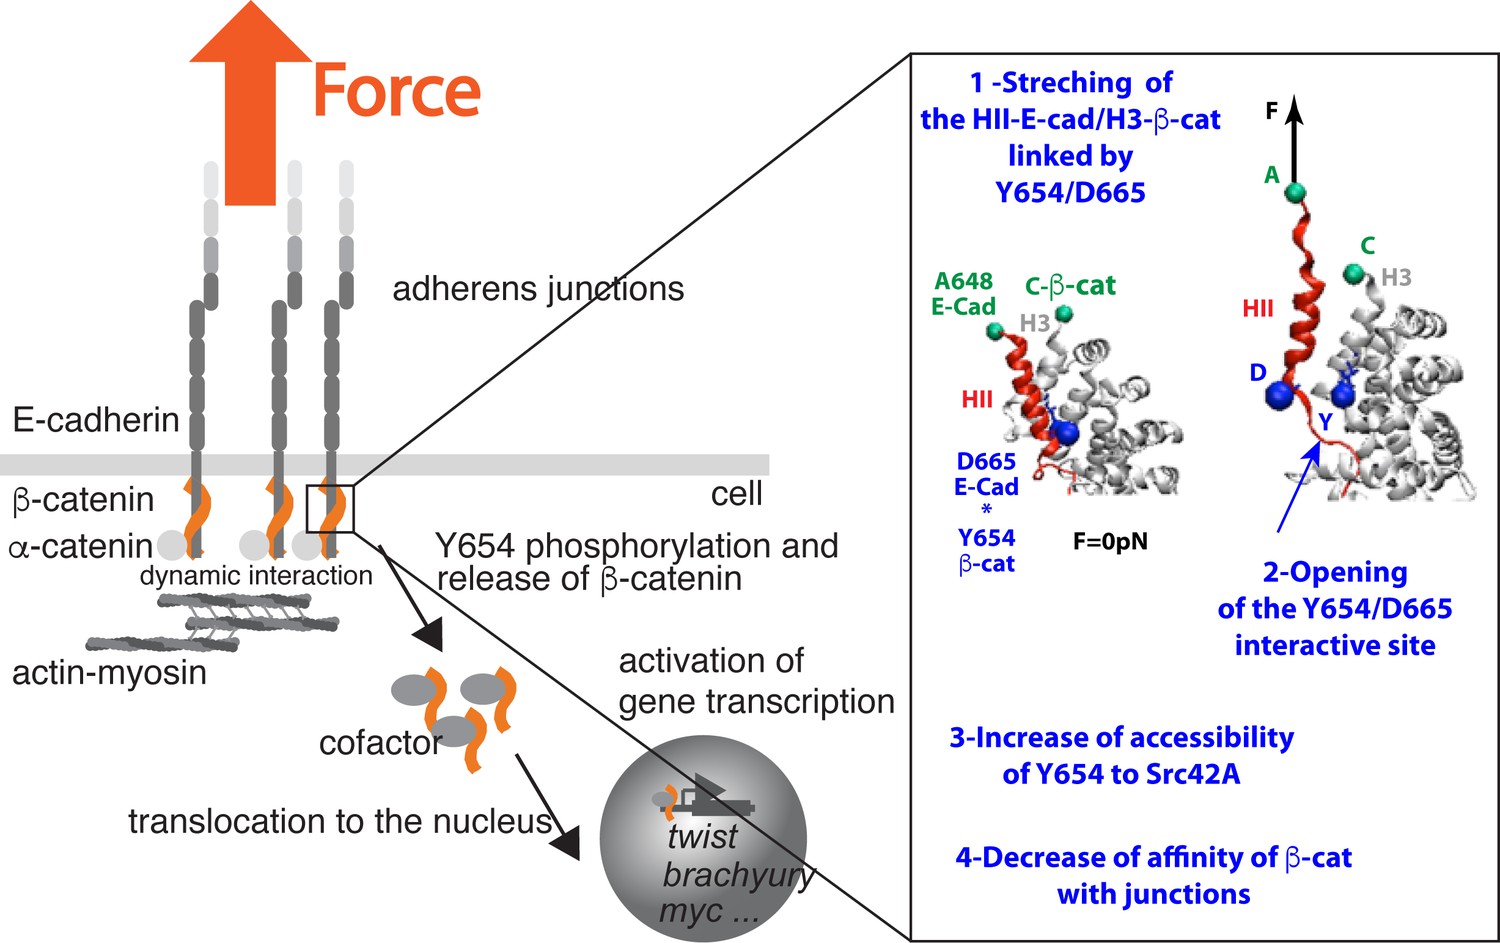
Synthetic view of the findings (box) integrated in the current knowledge.
https://doi.org/10.7554/eLife.33381.020Videos
Video 1
Example of one MD simulation of the β-cat/E-cad complex with no external force applied (30 ns).
Video 2
Example of one MD simulation of the β-cat/E-cad complex with a force equivalent to an actual 6 pN external strain applied at the A648 site of the E-cad in the direction of the plasma membrane in 30 ns.
Tables
Table 1
List of hits resulting from a standard protein-protein BLAST search against the Drosophila proteome (taxid: 7227) for the immunogen peptide sequence used to generate the JCAb20 antibody.
https://doi.org/10.7554/eLife.33381.014| Description | Max score | Total score | Query cover | E value | Ident | Accession |
|---|---|---|---|---|---|---|
| DE-cadherin [Drosophila melanogaster] | 53.2 | 66.6 | 93% | 1.00E-11 | 100% | BAA05942.1 |
| Shotgun [Drosophila melanogaster] | 53.2 | 66.6 | 93% | 1.00E-11 | 100% | NP_476722.1 |
| GM13889p [Drosophila melanogaster] | 24.8 | 24.8 | 56% | 0.13 | 50% | AAM50217.1 |
| GH21511p [Drosophila melanogaster] | 24.8 | 24.8 | 56% | 0.14 | 67% | AAK92991.1 |
| Eukaryotic translation initiation factor 3 p66 subunit [Drosophila melanogaster] | 24.8 | 24.8 | 56% | 0.14 | 50% | AAF37264.1 |
| Eukaryotic initiation factor 3 p66 subunit [Drosophila melanogaster] | 24.8 | 24.8 | 56% | 0.14 | 50% | NP_524463.2 |
| Extended synaptotagmin-like protein 2 ortholog, isoform A [Drosophila melanogaster] | 24.8 | 42.4 | 62% | 0.14 | 67% | NP_733010.1 |
| Extended synaptotagmin-like protein 2 ortholog, isoform D [Drosophila melanogaster] | 24.8 | 42.4 | 62% | 0.14 | 67% | NP_001262921.1 |
| Extended synaptotagmin-like protein 2 ortholog, isoform B [Drosophila melanogaster] | 24.8 | 42.4 | 62% | 0.14 | 67% | NP_733011.2 |
| RE26910p [Drosophila melanogaster] | 24.8 | 42.4 | 62% | 0.14 | 67% | ABY21755.1 |
| Extended synaptotagmin-like protein 2 ortholog, isoform C [Drosophila melanogaster] | 24.8 | 42.4 | 62% | 0.14 | 67% | NP_001247287.1 |
| Uncharacterized protein Dmel_CG11920 [Drosophila melanogaster] | 23.5 | 23.5 | 62% | 0.38 | 70% | NP_651335.2 |
| GM02712p [Drosophila melanogaster] | 23.5 | 23.5 | 62% | 0.38 | 70% | AAL28396.1 |
| Mind bomb 2, isoform A [Drosophila melanogaster] | 23.5 | 36.9 | 93% | 0.39 | 70% | NP_609933.1 |
| Scribbled [Drosophila melanogaster] | 23.5 | 23.5 | 37% | 0.39 | 100% | AAO32791.1 |
| Vartul-2 protein [Drosophila melanogaster] | 23.5 | 40.3 | 37% | 0.39 | 100% | CAB71137.1 |
| Scribbled, isoform C [Drosophila melanogaster] | 23.5 | 40.3 | 37% | 0.39 | 100% | NP_733156.1 |
| Scribbled, isoform I [Drosophila melanogaster] | 23.5 | 40.3 | 37% | 0.39 | 100% | NP_001014669.1 |
| Scribbled, isoform P [Drosophila melanogaster] | 23.5 | 40.3 | 37% | 0.39 | 100% | NP_733155.2 |
| Scribble [Drosophila melanogaster] | 23.5 | 54.5 | 75% | 0.39 | 100% | AAF26357.2 |
| Scribbled, isoform A [Drosophila melanogaster] | 23.5 | 40.3 | 37% | 0.39 | 100% | NP_733154.1 |
| RE02389p [Drosophila melanogaster] | 23.5 | 40.3 | 37% | 0.39 | 100% | AAT94469.1 |
| Vartul-1 protein [Drosophila melanogaster] | 23.5 | 40.3 | 37% | 0.39 | 100% | CAB70601.1 |
| Scribbled, isoform U [Drosophila melanogaster] | 23.5 | 40.3 | 37% | 0.39 | 100% | NP_001262989.1 |
| Scribbled [Drosophila melanogaster] | 23.5 | 40.3 | 37% | 0.39 | 100% | AAO32792.1 |
| Scribbled, isoform D [Drosophila melanogaster] | 23.5 | 40.3 | 37% | 0.39 | 100% | NP_524754.2 |
| Scribbled, isoform H [Drosophila melanogaster] | 23.5 | 40.3 | 37% | 0.39 | 100% | NP_001014670.2 |
| Scribbled, isoform R [Drosophila melanogaster] | 23.5 | 40.3 | 37% | 0.39 | 100% | NP_001247322.1 |
| Scribbled, isoform K [Drosophila melanogaster] | 23.5 | 40.3 | 37% | 0.39 | 100% | NP_001247318.1 |
| Scribbled, isoform J [Drosophila melanogaster] | 23.5 | 40.3 | 37% | 0.39 | 100% | NP_001163745.1 |
| Scribbled, isoform T [Drosophila melanogaster] | 23.5 | 40.3 | 37% | 0.39 | 100% | NP_001262988.1 |
| Scribbled, isoform M [Drosophila melanogaster] | 23.5 | 40.3 | 37% | 0.39 | 100% | NP_001163747.1 |
| Scribbled, isoform O [Drosophila melanogaster] | 23.5 | 40.3 | 37% | 0.39 | 100% | NP_001247320.1 |
| Scribbled, isoform N [Drosophila melanogaster] | 23.5 | 40.3 | 37% | 0.39 | 100% | NP_001247319.1 |
| Scribbled, isoform Q [Drosophila melanogaster] | 23.5 | 40.3 | 37% | 0.39 | 100% | NP_001247321.1 |
| Scribbled, isoform L [Drosophila melanogaster] | 23.5 | 40.3 | 37% | 0.39 | 100% | NP_001163746.1 |
| TPA: HDC02662 [Drosophila melanogaster] | 23.1 | 23.1 | 56% | 0.54 | 62% | DAA03664.1 |
| Uncharacterized protein Dmel_CG10103, isoform D [Drosophila melanogaster] | 23.1 | 35.6 | 43% | 0.55 | 86% | NP_001261485.1 |
| Uncharacterized protein Dmel_CG10103, isoform E [Drosophila melanogaster] | 23.1 | 35.6 | 43% | 0.55 | 86% | NP_001261486.1 |
| Uncharacterized protein Dmel_CG10103, isoform C [Drosophila melanogaster] | 23.1 | 35.6 | 43% | 0.55 | 86% | NP_001261484.1 |
| Uncharacterized protein Dmel_CG10103, isoform B [Drosophila melanogaster] | 23.1 | 35.6 | 43% | 0.55 | 86% | NP_001261483.1 |
| Uncharacterized protein Dmel_CG10103, isoform A [Drosophila melanogaster] | 23.1 | 35.6 | 43% | 0.55 | 86% | NP_648058.1 |
| Uncharacterized protein Dmel_CG11883, isoform B [Drosophila melanogaster] | 22.7 | 40.7 | 43% | 0.78 | 86% | NP_610598.1 |
| Uncharacterized protein Dmel_CG11883, isoform A [Drosophila melanogaster] | 22.7 | 40.7 | 43% | 0.78 | 86% | NP_724960.1 |
| Uncharacterized protein Dmel_CG11883, isoform C [Drosophila melanogaster] | 22.7 | 40.7 | 43% | 0.78 | 86% | NP_001097260.1 |
| Peptidylprolyl cis-trans isomerase [Drosophila melanogaster] | 22.7 | 22.7 | 50% | 0.78 | 63% | AAN39118.1 |
| Moca-cyp, isoform A [Drosophila melanogaster] | 22.7 | 22.7 | 50% | 0.78 | 63% | NP_733246.1 |
| RE23622p [Drosophila melanogaster] | 22.7 | 22.7 | 50% | 0.78 | 63% | AAN71333.1 |
| GH13610p [Drosophila melanogaster] | 22.7 | 22.7 | 68% | 0.78 | 64% | ACV31093.1 |
| GH14650p [Drosophila melanogaster] | 22.7 | 22.7 | 68% | 0.78 | 64% | AAK92914.1 |
| SP2523 [Drosophila melanogaster] | 22.7 | 22.7 | 68% | 0.78 | 64% | AAF63503.1 |
| Ankyrin 2, isoform L [Drosophila melanogaster] | 22.7 | 22.7 | 68% | 0.78 | 64% | NP_729285.3 |
| Ankyrin 2, isoform F [Drosophila melanogaster] | 22.7 | 22.7 | 68% | 0.78 | 64% | NP_001097535.1 |
| Ankyrin 2, isoform J [Drosophila melanogaster] | 22.7 | 38.2 | 93% | 0.78 | 64% | NP_001097538.1 |
| Ankyrin 2, isoform T [Drosophila melanogaster] | 22.7 | 22.7 | 68% | 0.78 | 64% | NP_001189068.1 |
| Ankyrin 2, isoform P [Drosophila melanogaster] | 22.7 | 22.7 | 68% | 0.78 | 64% | NP_001189069.1 |
| Ankyrin 2, isoform Z [Drosophila melanogaster] | 22.7 | 22.7 | 68% | 0.78 | 64% | NP_001286971.1 |
| Ankyrin 2, isoform K [Drosophila melanogaster] | 22.7 | 22.7 | 68% | 0.78 | 64% | NP_001097539.1 |
| Ankyrin 2, isoform S [Drosophila melanogaster] | 22.7 | 38.2 | 93% | 0.78 | 64% | NP_001189064.1 |
| Ankyrin 2, isoform Q [Drosophila melanogaster] | 22.7 | 38.2 | 93% | 0.78 | 64% | NP_001189067.1 |
| Ankyrin 2, isoform V [Drosophila melanogaster] | 22.7 | 22.7 | 68% | 0.78 | 64% | NP_001261535.1 |
| Ankyrin 2, isoform R [Drosophila melanogaster] | 22.7 | 38.2 | 93% | 0.78 | 64% | NP_001189065.1 |
| Ankyrin 2, isoform U [Drosophila melanogaster] | 22.7 | 52.4 | 93% | 0.78 | 64% | NP_001189070.1 |
| Mei-P26 [Drosophila melanogaster] | 22.3 | 22.3 | 43% | 1.1 | 71% | AGL81505.1 |
| Mei-P26 [Drosophila melanogaster] | 22.3 | 22.3 | 43% | 1.1 | 71% | AGL81497.1 |
| Mei-P26 [Drosophila melanogaster] | 22.3 | 22.3 | 43% | 1.1 | 71% | AGL81501.1 |
| Mei-P26 [Drosophila melanogaster] | 22.3 | 22.3 | 43% | 1.1 | 71% | AGL81499.1 |
| Mei-P26 [Drosophila melanogaster] | 22.3 | 22.3 | 43% | 1.1 | 71% | AGL81498.1 |
| HL03718p [Drosophila melanogaster] | 22.3 | 22.3 | 37% | 1.1 | 100% | AAR82799.1 |
| BcDNA.GH10646 [Drosophila melanogaster] | 22.3 | 22.3 | 43% | 1.1 | 71% | AAD38636.1 |
| Meiotic P26, isoform A [Drosophila melanogaster] | 22.3 | 22.3 | 43% | 1.1 | 71% | NP_652022.1 |
| Pangolin, isoform J [Drosophila melanogaster] | 22.3 | 35.6 | 37% | 1.1 | 100% | NP_726528.2 |
| Meiotic P26, isoform C [Drosophila melanogaster] | 22.3 | 22.3 | 43% | 1.1 | 71% | NP_001259377.1 |
| LD23595p [Drosophila melanogaster] | 21.8 | 35.2 | 75% | 1.6 | 86% | AAM52675.1 |
| Updo [Drosophila melanogaster] | 21.8 | 21.8 | 62% | 1.6 | 50% | NP_610501.1 |
| SD19419p [Drosophila melanogaster] | 21.8 | 21.8 | 62% | 1.6 | 50% | AAM51098.1 |
| Uncharacterized protein Dmel_CG12093 [Drosophila melanogaster] | 21.8 | 35.2 | 75% | 1.6 | 86% | NP_647747.1 |
| CG3803 [Drosophila melanogaster] | 21.8 | 21.8 | 75% | 1.6 | 40% | NP_611855.1 |
| CG9837, isoform D [Drosophila melanogaster] | 21.4 | 21.4 | 43% | 2.2 | 71% | NP_001163557.2 |
| CG9837, isoform E [Drosophila melanogaster] | 21.4 | 38.6 | 56% | 2.2 | 71% | NP_649838.5 |
| Missing oocyte [Drosophila melanogaster] | 21.4 | 33.9 | 68% | 2.2 | 100% | NP_608656.1 |
| Uncharacterized protein Dmel_CG17258, isoform C [Drosophila melanogaster] | 21.4 | 21.4 | 62% | 2.2 | 58% | NP_001259980.1 |
| Uncharacterized protein Dmel_CG17258, isoform D [Drosophila melanogaster] | 21.4 | 21.4 | 62% | 2.2 | 58% | NP_001259981.1 |
| AT19777p [Drosophila melanogaster] | 21.4 | 21.4 | 62% | 2.2 | 58% | ABB36463.1 |
| Uncharacterized protein Dmel_CG17258, isoform B [Drosophila melanogaster] | 21.4 | 21.4 | 62% | 2.2 | 58% | NP_608742.2 |
| DUNC79 [Drosophila melanogaster] | 21.4 | 63.2 | 93% | 2.2 | 75% | ABI95804.1 |
| Unc79, isoform B [Drosophila melanogaster] | 21.4 | 63.2 | 93% | 2.2 | 75% | NP_001163652.1 |
| Unc79, isoform F [Drosophila melanogaster] | 21.4 | 63.2 | 93% | 2.2 | 75% | NP_001287404.1 |
| Unc79, isoform E [Drosophila melanogaster] | 21.4 | 63.2 | 93% | 2.2 | 75% | NP_001287403.1 |
| Unc79, isoform C [Drosophila melanogaster] | 21.4 | 63.2 | 93% | 2.2 | 75% | NP_650795.2 |
| CG9034, isoform A [Drosophila melanogaster] | 21 | 21 | 37% | 3 | 83% | NP_652538.1 |
| Uncharacterized protein Dmel_CG33796 [Drosophila melanogaster] | 21 | 21 | 43% | 3.1 | 71% | NP_001027128.1 |
| Nubbin [Drosophila melanogaster] | 21 | 39 | 68% | 3.1 | 64% | ABD33837.1 |
| IP05211p [Drosophila melanogaster] | 21 | 21 | 56% | 3.1 | 67% | ABC86455.1 |
| Uncharacterized protein Dmel_CG32373, isoform A [Drosophila melanogaster] | 21 | 21 | 37% | 3.1 | 83% | NP_729293.1 |
| RT09995p [Drosophila melanogaster] | 21 | 21 | 56% | 3.1 | 67% | ADN05223.1 |
| Glycogen binding subunit 76A, isoform A [Drosophila melanogaster] | 21 | 21 | 50% | 3.1 | 75% | NP_649104.1 |
| Veloren, isoform B [Drosophila melanogaster] | 21 | 21 | 68% | 3.1 | 55% | NP_788470.1 |
| Nubbin, isoform B [Drosophila melanogaster] | 21 | 39 | 68% | 3.1 | 64% | NP_001097153.1 |
| Shal interactor of Di-Leucine motif [Drosophila melanogaster] | 21 | 21 | 37% | 3.1 | 83% | NP_650431.1 |
Key resources table
| Reagent type (species) or resource | Designation | Source or reference | Identifiers | Additional information |
|---|---|---|---|---|
| Antibody | Anti-Y654-b-cat | Sigma-Aldrich | RRID:AB_10623284 | |
| Antibody | Anti-Arm | DSHB | RRID:AB_528089 | |
| Antibody | JCAb20 | abcam antibody service | against H- CALQGNMRDPNDIPDI - NH2 (16AA) corresponding to AA 1143–1158 of the DE-cad | |
| Antibody | Anti-DE-cad DCAD2 | DSHB | RRID:AB_528120 | |
| Strain, strain background (Drosohila melanogaster) | Arm-GFP | Bloomington Drosophila Stock Center | RRID:BDSC_8556 | |
| Strain, strain background (Drosohila melanogaster) | mata4-GALVP16/V37 tubulin | Bloomington Drosophila Stock Center | RRID:BDSC_7063 | |
| Strain, strain background (Drosohila melanogaster) | Oregon-R | Bloomington Drosophila Stock Center | RRID:BDSC_5 | |
| Strain, strain background (Drosohila melanogaster) | src42A RNAi | NIG Stock Centre | 7873 R-2 | The NIG Stock Centre is not yet in the RRID system |
| Strain, strain background (Drosohila melanogaster) | UAS-src42A-RNAi (II) | VDRC Stock Centre | RRID:FlyBase_FBst0452809; 17643 | |
| Sequence-based reagent | sna-siRNAs | Produced by Eurogentec | Sequences given in methods | |
| Sequence-based reagent | twi-siRNAs | Produced by Eurogentec | Sequences given in methods | |
| Software, algorithm | FLIMfit 4.12.1 | Imperial College London | ||
| Software, algorithm | SymphoTime | Leica/Picoquant system | ||
| Software, algorithm | Packing Analyzer | Benoit Aigouy | doi:10.1016/j.cell.2010.07.042 (2010) | |
| Commercial assay or kit | Alexa Fluor 555 Antibody Labeling Kit | Molecular probes lifetechnologies | Cat. No. A20187 | |
| Commercial assay or kit | Antibody concentration kit | abcam | Cat. No.102778 | |
| Chemical compound, drug | Ultra-magnetic liposomes (UML) | doi:10.1021/la3024716 (2012). |
Additional files
-
Source code 1
‘pvalue Fisher t-test curves comparison’.
Entering the values in the ‘experiment.xls’ file (‘1’ is time 1 and ‘2’ is time 2 of the experimental curve, C is control and P is perturbed conditions), saving it and putting it in the same file than the script, opening the script under Rstudio on MacOS10, selecting the program from line 1 to line 83, running it, selecting the test ‘t’ line 85, running it, leads to the p-value.
- https://doi.org/10.7554/eLife.33381.022
-
Transparent reporting form
- https://doi.org/10.7554/eLife.33381.023
Download links
A two-part list of links to download the article, or parts of the article, in various formats.
Downloads (link to download the article as PDF)
Open citations (links to open the citations from this article in various online reference manager services)
Cite this article (links to download the citations from this article in formats compatible with various reference manager tools)
The major β-catenin/E-cadherin junctional binding site is a primary molecular mechano-transductor of differentiation in vivo
eLife 7:e33381.
https://doi.org/10.7554/eLife.33381


