Role of the visual experience-dependent nascent proteome in neuronal plasticity
- The Scripps Research Institute, United States
- Hangzhou Normal University, China
Figures
Figure 1

Quantitative MS/MS analysis of newly synthesized proteins in vivo identifies visual experience-induced dynamics in the nascent proteome.
(A) Protocol to prepare AHA-labeled samples from animals with or without visual experience (VE) for quantitative proteomic analysis. The midbrain ventricle was injected with AHA before exposure to a moving bar stimulus for 0.5 hr followed by 4 hr in ambient light. Control animals were exposed to ambient light for 5 hr. We dissected midbrains from 1200 to 1500 stage 47/48 tadpoles for each experimental group, yielding about 15 mg protein, in two independent experiments. Newly synthesized proteins (NSPs) from midbrains were tagged with biotin using click chemistry and processed for direct detection of biotin tags (DiDBiT). Samples from control and VE-treated animals were combined after dimethyl labeling for multidimensional protein identification technology (MudPIT) analysis. We identified 83 candidate plasticity proteins (CPPs) in the VE-dependent nascent proteome. (B–D) Pie charts of the protein classes in the global brain proteome (B), nascent proteome (C), and VE-dependent nascent proteome (D). Proteins were annotated using PANTHER protein classes.
Figure 2 with 1 supplement
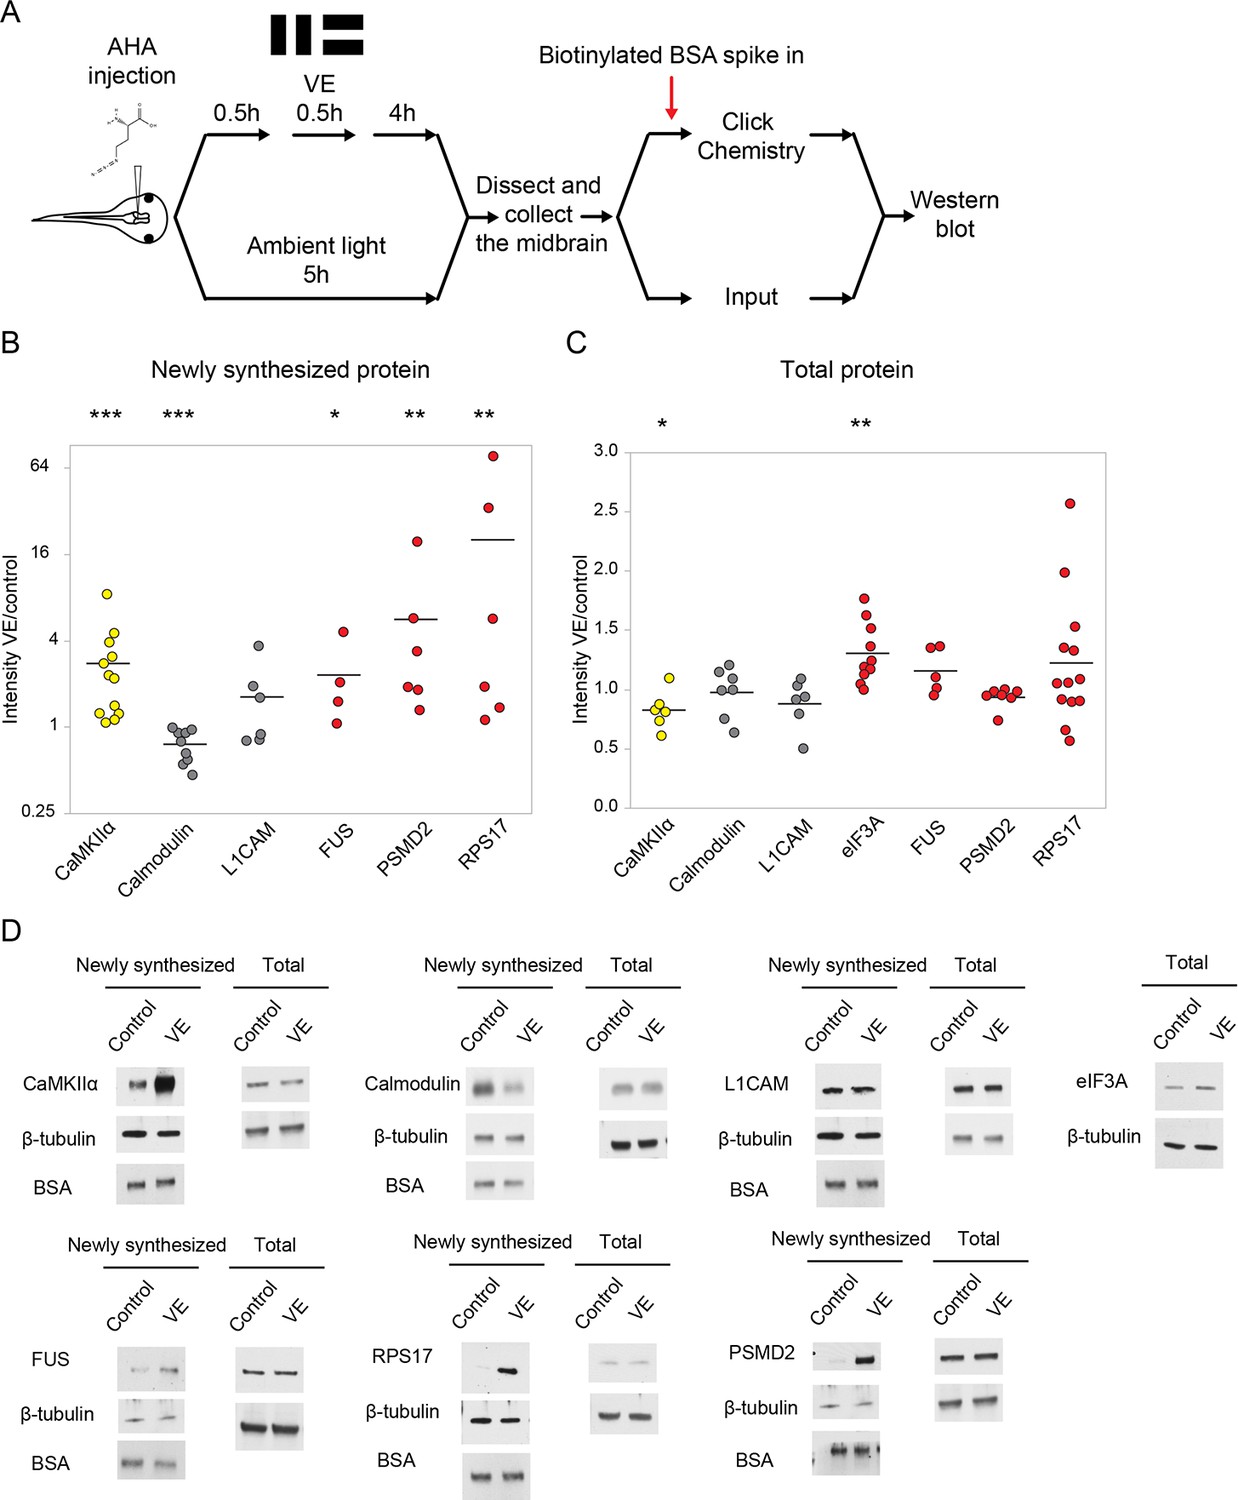
Validation of visual experience-dependent changes in CPP synthesis.
(A) Protocol to prepare AHA-labeled samples. Tissue was processed to tag AHA-labeled proteins from VE-treated and control samples with biotin using click chemistry followed by western blot analysis. (B, C) Scatter plots of western blot data of newly synthesized (B) or total (C) CPPs and non-CPPs. Data are presented as ratios of intensities for paired VE and control samples. αCaMKII (yellow) is a positive control. WBs of CPPs (red) corroborated the proteomic results. For non-CPPs (gray), L1CAM NSPs increased and decreased in western blot and proteomic data, while calmodulin NSPs consistently decreased in western blot data, but increased and decreased in proteomic data (Supplementary file 2). (D) Representative images of western blots of newly synthesized or total CPPs and non-CPPs. The Y axis of B is plotted in a log scale and the Y axis of C is plotted in a linear scale. *p<0.05, **p<0.01, ***p<0.001, two-tailed Student’s t test (C) or Mann-Whitney test (B) was used to compare between paired samples from control and VE treatments. n ≥ 4 independent experiments for each CPP. The black bars represent the mean.
-
Figure 2—source data 1
Values of the scatter plots of western blot data presented in Figure 2B–C.
- https://doi.org/10.7554/eLife.33420.006
Figure 2—figure supplement 1
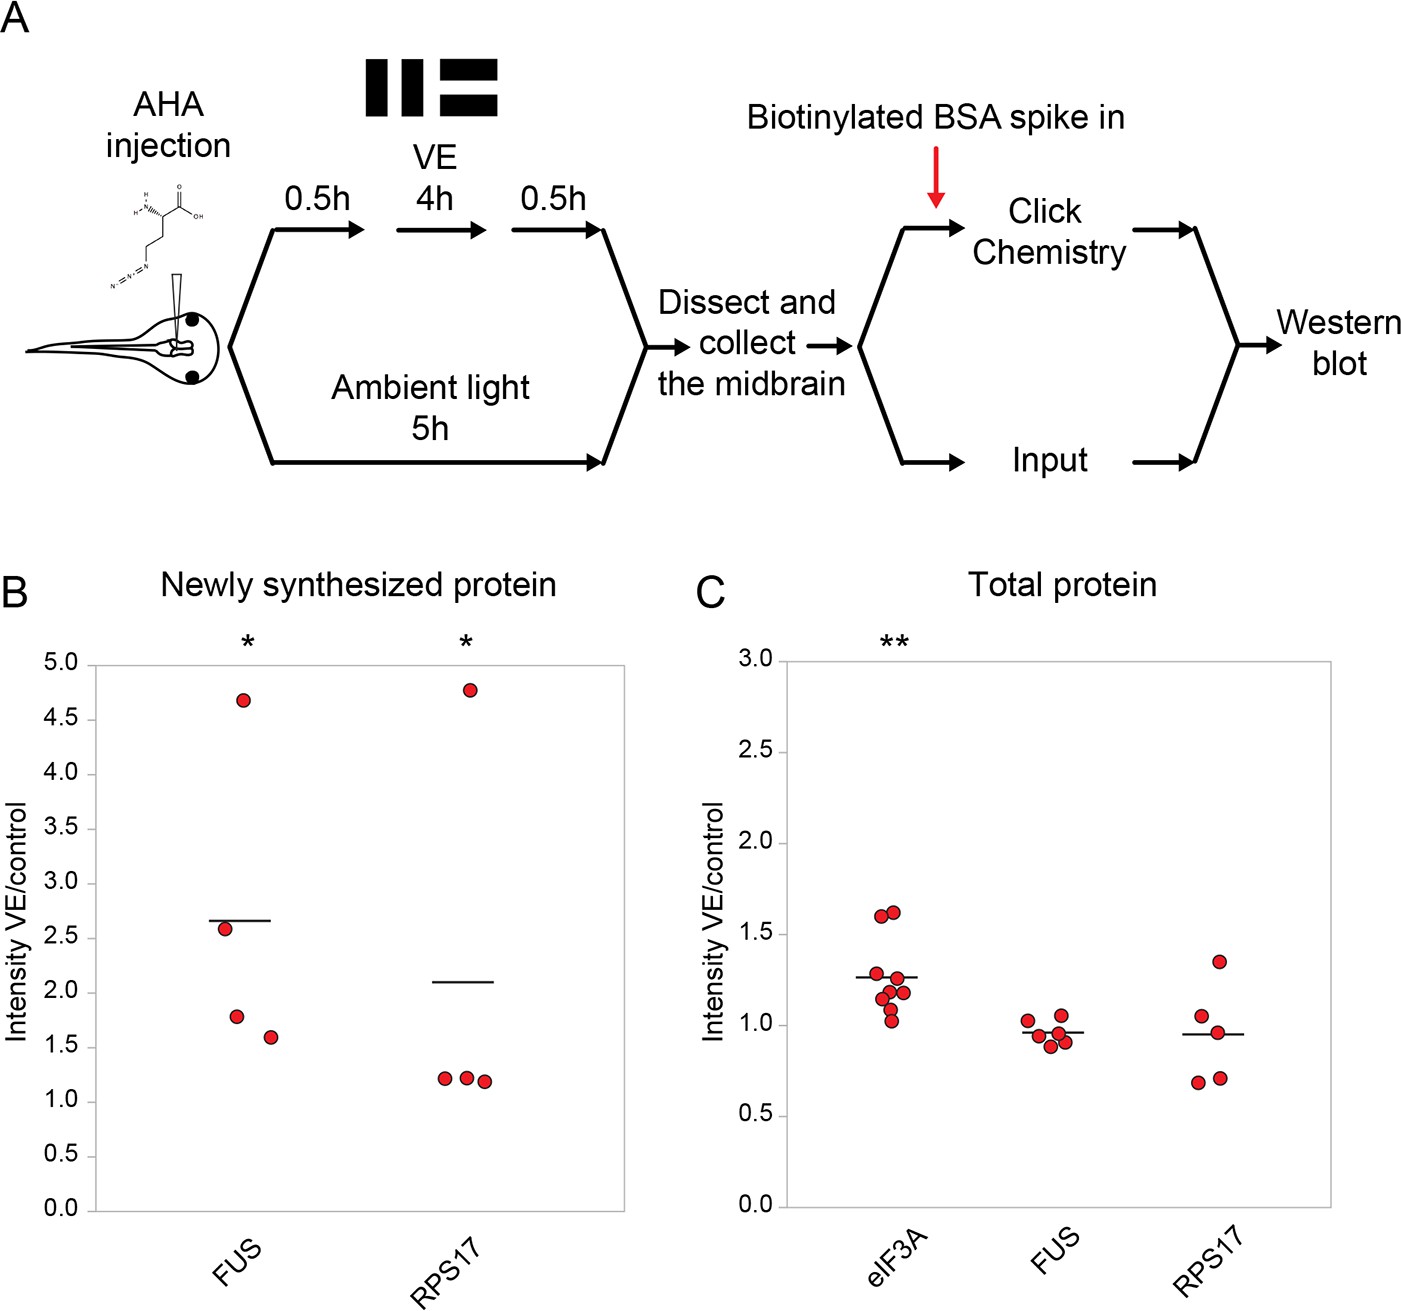
Validation of changes in synthesis of eIF3A, FUS, and RPS17 in response to 4 hr of visual experience.
(A) Protocol to prepare AHA-labeled samples for western blot. (B, C) Scatter plots of western blot data of newly synthesized (B) or total (C) CPPs. Data are normalized intensity ratios of VE samples compared to the paired controls. The intensities of individual bands for total proteins were normalized to β-tubulin, while the intensities of bands for NSPs were normalized to biotinylated BSA, which served as an internal standard, and β-tubulin. Western blots of CPPs (red) corroborated the proteomic results. *p<0.05, **p<0.01, two-tailed Student’s t test for comparisons of total proteins and Mann-Whitney test for comparisons of NSPs. n ≥ 4 independent experiments for each CPP. The black bars represent the mean.
-
Figure 2—figure supplement 1—source data 1
Values of the scatter plots of western blot data presented in Figure 2—figure supplement 1B-C.
- https://doi.org/10.7554/eLife.33420.007
Figure 3
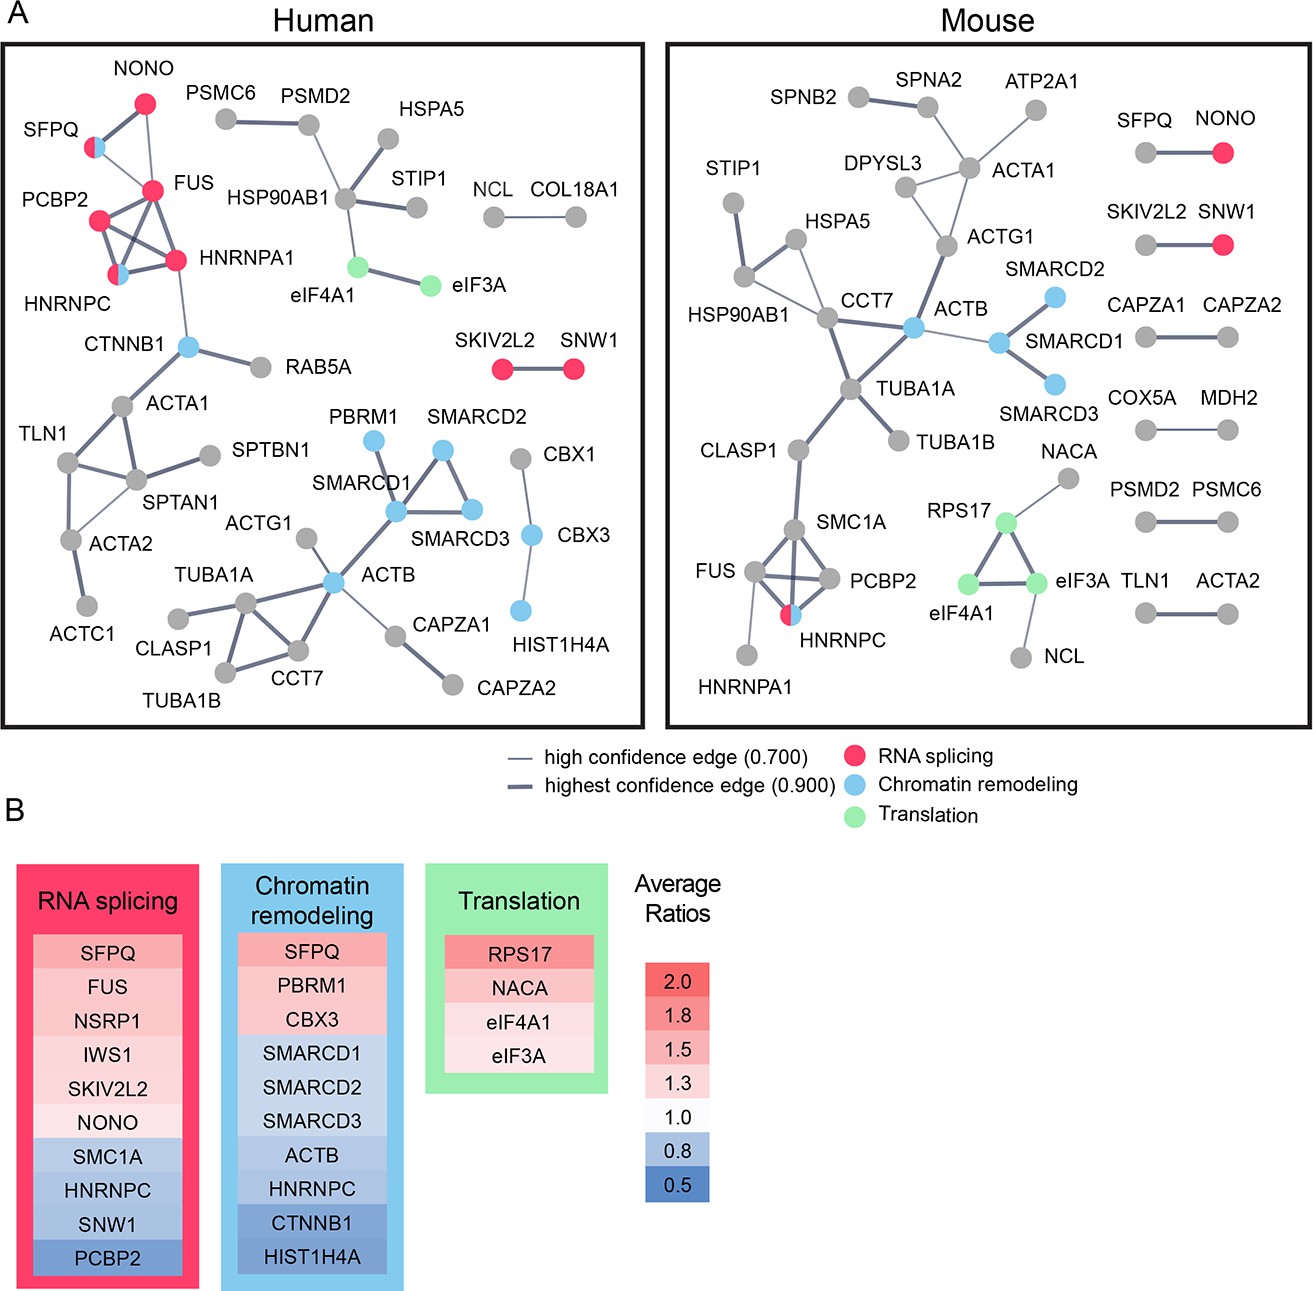
Bioinformatic analysis indicates that candidate plasticity proteins are enriched in processes related to protein translation, RNA splicing and chromatin remodeling.
(A) Functional protein interaction networks of CPPs, shown as dots. Lines connecting CPP nodes represent protein interactions reported in the human (left) or mouse (right) STRING databases, with higher interaction confidence represented by thicker lines. CPPs belonging to the top biological processes in each network are color-coded: RNA splicing (red); chromatin remodeling (blue); and translation (green). (B) Fold changes in synthesis of all CPPs pertaining to RNA splicing, translation and chromatin remodeling, not restricted to those within the networks identified by STRING in (A), are color coded by average fold increase or decrease compared to control from 0.5 (blue) to 2.0 (red), indicated at the right. See also Supplementary file 4, which shows that pathways involved in RNA splicing and chromatin remodeling are statistically enriched for CPPs.
-
Figure 3—source data 1
Values of the fold changes in synthesis of all CPPs presented in Figure 3B.
- https://doi.org/10.7554/eLife.33420.009
Figure 4 with 1 supplement
Newly synthesized FUS is required for visual experience-dependent structural plasticity.
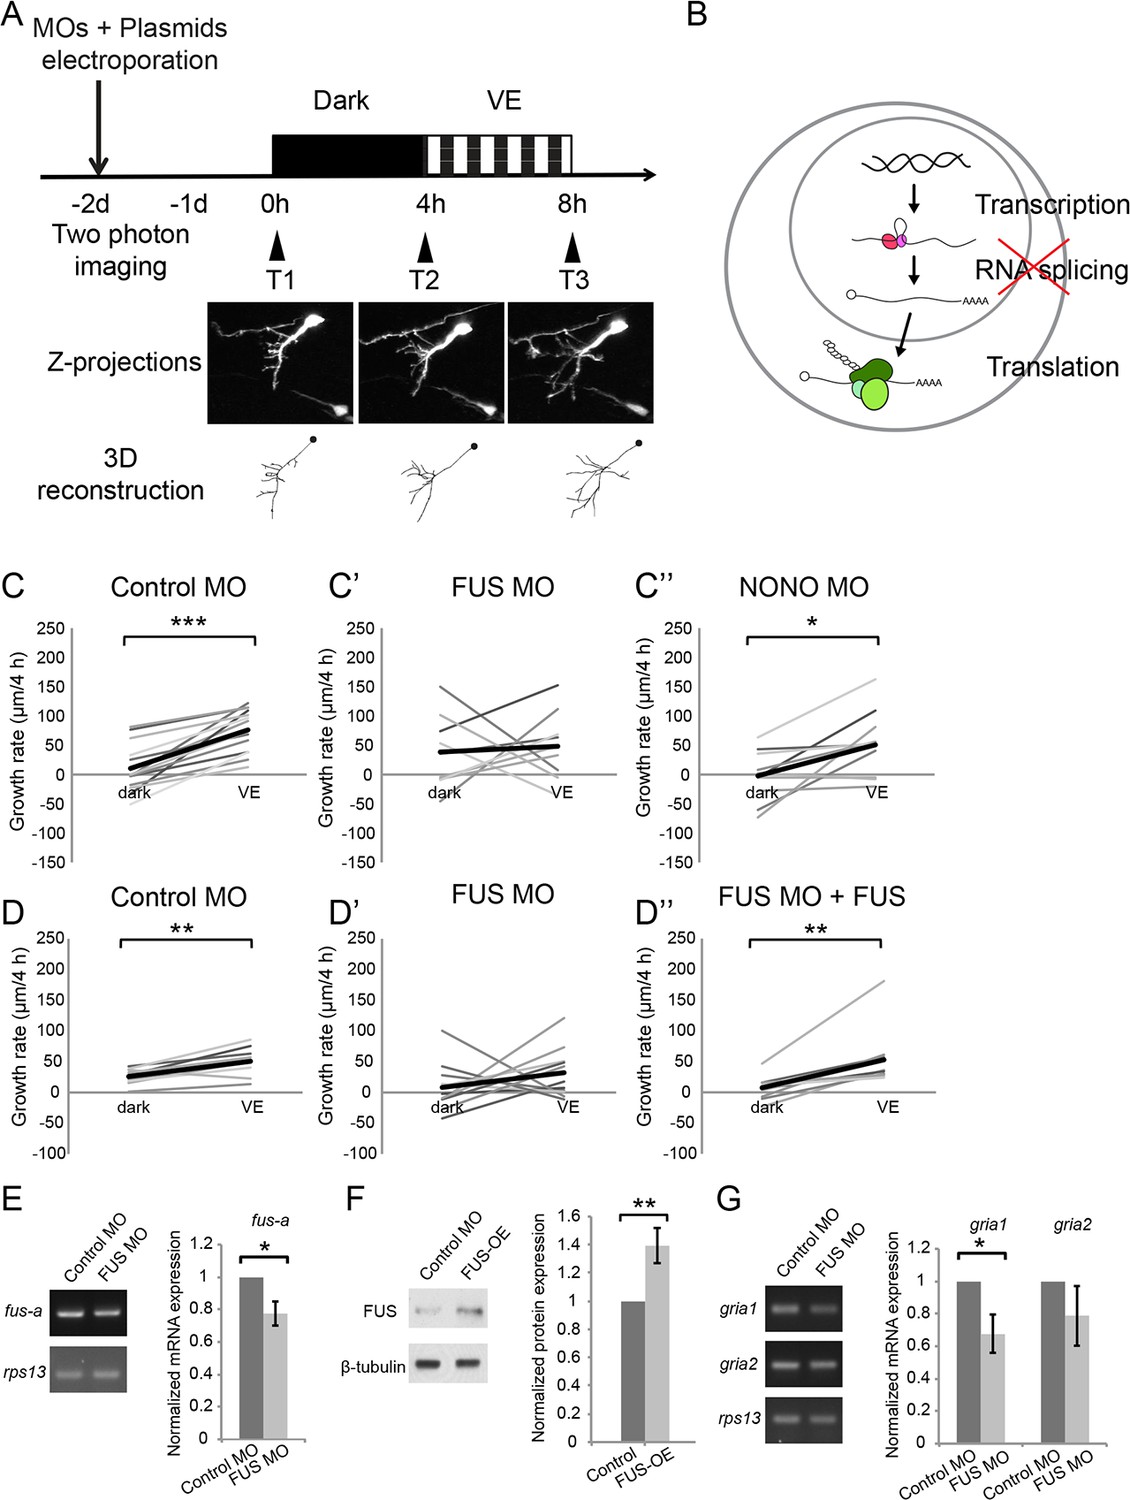
(A) Protocol to test the effect of MO-mediated CPP knockdown on VE-dependent structural plasticity. Tecta were co-electroporated with MOs and GFP-expression plasmid 2 days before imaging. GFP-expressing tectal neurons were imaged in vivo before and after 4 hr in dark followed by 4 hr of VE. Images of a control neuron are shown. Dendritic arbors of individual neurons were reconstructed and total dendritic branch length (TDBL) was compared across imaging time-points. (B) A schematic of different regulatory steps of gene and protein expression, including nuclear transcription, RNA splicing, and cytosolic translation. (C–C’’) Plots of VE-dependent growth rates (changes in TDBL over 4 hr) in dark and VE in tecta electroporated with control MO (C), FUS MO (C’), or NONO MO (C’’). Gray lines connect data points for individual neurons and black lines are average growth rates in dark and VE. Neurons treated with control MO increase growth rate with VE compared to dark. FUS MO blocked the normal increase in growth rate in response to VE. VE-dependent structural plasticity was unaffected by NONO MO. Control MO: n = 14 cells; FUS MO: n = 9 cells; NONO MO: n = 10 cells. (D–D’’) The impaired experience-dependent structural plasticity seen with FUS knockdown (D’) was rescued by expression of exogenous FUS (D’’). Control MO: n = 9 cells; FUS MO: n = 11 cells; FUS MO + FUS: n = 10 cells. (E, F) Validation of FUS knockdown and overexpression (OE). Normalized mRNA or protein expression of fus/FUS in tecta electroporated with FUS MO (E) or FUS expression construct (F), compared to controls. (E) Left: Representative gels of fus-a and control rps13 transcripts from tecta electroporated with control or FUS MO. Right: fus-a expression normalized to rps13 from tecta treated with control or FUS MO. FUS knockdown significantly reduced fus-a (0.78 ± 0.08, p=0.0302), n = 4 independent experiments. (F) Left. Representative blots of FUS and β-tubulin expression from tecta electroporated with control or FUS expression construct. Right: FUS expression normalized to β-tubulin from tecta treated with control or FUS expression constructs. FUS expression construct significantly increased FUS protein. FUS-OE: 1.4 ± 0.13, p=0.0172; n = 5 independent experiments. (G) Left: Representative gels of gria1 and gria2 and control rps13 transcripts from tecta electroporated with control MO or FUS MO. Right: plots of gria1 and gria2 expression normalized to rps13 from tecta treated with control or FUS MO. Fus MO significantly decreased gria1 (0.68 ± 0.12, p=0.0365) but not gria2 (0.79 ± 0.18, p=0.1642); n = 4 independent experiments. *p<0.05, **p<0.01, ***p<0.001, two-tailed paired Student’s t test for comparisons between two matched pairs (C–D) and one-tailed Student’s t test for comparisons of two independent groups (E–G). Error bars represent ±SEM (E–G).
-
Figure 4—source data 1
Values of VE-dependent changes in tectal neuron growth rate over 4 hr in dark and VE presented in Figure 4C–C’’ and Figure 4D–D’’.
Raw values of normalized mRNA expression of fus-a in tecta electroporated with control or FUS MO presented in Figure 4E. Raw values of normalized protein expression of FUS in tecta electroporated with control or FUS expression construct presented in Figure 4F. Raw values of normalized mRNA expression of gria1 and gria2 in tecta electroporated with control or FUS MO presented in Figure 4G.
- https://doi.org/10.7554/eLife.33420.012
Figure 4—figure supplement 1
Newly synthesized FUS is required for visual experience-dependent structural plasticity.
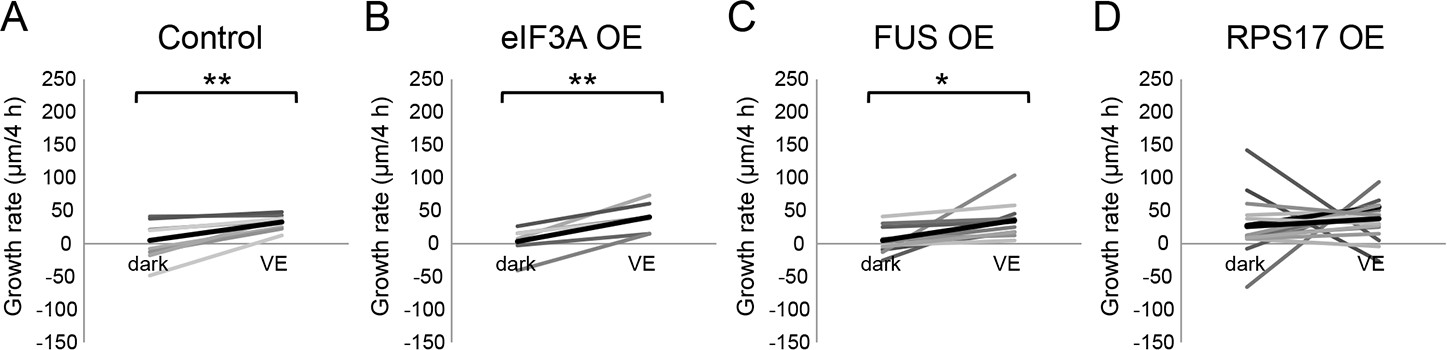
(A–D) To test the effect of overexpression of CPPs on structural plasticity in response to VE, tecta were electroporated with GFP-expression plasmid 2 days before imaging. GFP-expressing tectal neurons were imaged in vivo before and after 4 hr in dark followed by 4 hr of VE. Dendritic arbors of individual neurons were reconstructed in 3D and total dendritic branch length (TDBL) was compared across imaging time-points for individual neurons. (A–D) Plots of VE-dependent changes in tectal neuron growth rate over 4 hr in dark and VE in tecta electroporated with GFP-expression plasmid (A), GFP and eIF3A-expression plasmid (B), GFP and FUS-expression plasmid (C), or GFP and RPS17-expression plasmid (D). Gray lines connect data points for individual neurons and black lines are the average changes in growth rate in dark and VE. Neurons treated with control GFP-expression plasmid increase growth rate with VE compared to dark. Overexpression of RPS17 blocked the VE-dependent increase in dendritic arbor growth. VE-dependent structural plasticity was unaffected by eIF3A or FUS overexpression. Control: n = 8 cells; eIF3A OE: n = 6 cells; FUS OE: n = 11 cells; RPS17 OE: n = 17 cells. *p<0.05, **p<0.01, Two-tailed paired Student’s t test were used to compare between two matched pairs.
-
Figure 4—figure supplement 1—source data 1
Values of the plots of VE-dependent changes in tectal neuron growth rate over 4 hr in dark and VE presented in Figure 4—figure supplement 1A–D.
- https://doi.org/10.7554/eLife.33420.013
Figure 5
Newly synthesized eIF3A and RPS17 are required for visual experience-dependent structural plasticity.
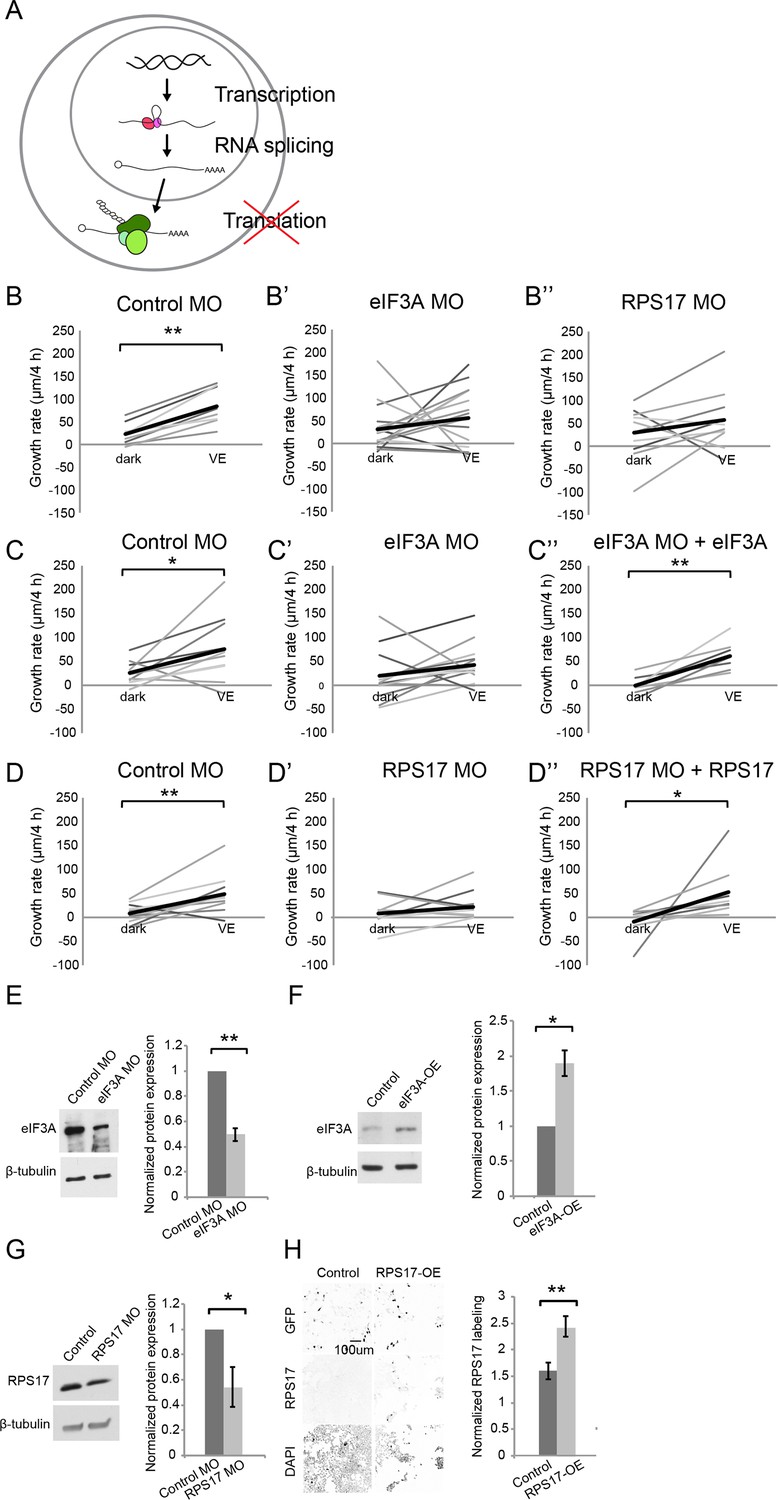
(A) Schematic of different steps of regulation in gene and protein expression. (B–D’’) VE-dependent changes in tectal neuron dendritic arbor growth rate over 4 hr in dark and VE in tecta electroporated with control MO (B, C, D), designated CPP MOs (B’, B’’, C’, D’), or CPP MOs and rescue constructs (C’’, D’’). Gray lines connect data points for individual neurons and black lines are average changes in TDBL in dark and VE. (B–B”) VE-dependent changes in growth rate in tecta treated with control MO (B, eIF3A MO (B’), or RPS17 MO (B’’). Control MO: n = 22 cells; eIF3A MO: n = 17 cells; RPS17 MO: n = 10 cells. Both eIF3A MO and RPS17 MO blocked the VE-dependent increase in dendritic arbor growth rate observed in controls. (C–C’’) Co-expression of eIF3A MO and exogenous eIF3A rescued the deficit in VE-induced structural plasticity seen with eIF3A knockdown. Control MO: n = 10 cells; eIF3A MO: n = 14 cells; eIF3A MO + eIF3A: n = 7 cells. (D–D’’) Co-expression of RPS17 MO and exogenous RPS17 rescued the deficit in VE-induced dendritic structural plasticity seen with RPS17 knockdown. Control MO: n = 9 cells; RPS17 MO: n = 10 cells; RPS17 MO + RPS17: n = 9 cells. (E–H) Validation of eIF3A and RPS17 knockdown and OE. (E, F) Left: representative WB of eIF3A and β-tubulin from tecta electroporated with eIF3A MO (E) or MO-insensitive eIF3A expression construct (F) compared to controls. Right: eIF3A MO significantly decreased synthesis of eIF3A protein (eIF3A MO: 0.5 ± 0.05, p=0.0003; n = 5 independent experiments) and the eIF3A expression construct generated significantly more eIF3A protein (eIF3A-OE: 1.89 ± 0.18, p=0.0198; n = 3 independent experiments). (G) Left: WB of RPS17 and β-tubulin from tecta electroporated with control or RPS17 MO. Right: Normalized RPS17 expression levels in tecta electroporated with control or RPS17 MO. RPS17 MO significantly reduced synthesis of RPS17 protein (RPS17 MO: 0.54 ± 0.16, p=0.0309; n = 4 independent experiments). (H) Left: Images of GFP (top), RPS17 (middle) expression and DAPI (bottom) labeling in HEK cells expressing GFP alone (Control, left) or GFP and RPS17 (right). Right: RPS17 expression in GFP+ ROI, normalized to RPS17 expression in GFP- ROI. The RPS17 expression construct increased RPS17 immunolabeling. Control: 1.6 ± 0.16; RPS17-OE: 2.43 ± 0.19; p=0.0029; n = 7 different fields imaged from two independent experiments for each experimental condition. *p<0.05, **p<0.01, two-tailed paired Student’s t test were used to compare between two matched pairs (B–D) and one-tailed Student’s t test for comparisons of two independent groups (E–H). Error bars represent ±SEM (E–H).
-
Figure 5—source data 1
Values of VE-dependent changes in tectal neuron growth rate over 4 hr in dark and VE presented in Figure 5B–B’’, Figure 5C–C’’, and Figure 5D–D’’.
Raw values of normalized protein expression of eif3A or RPS17 in tecta electroporated with control/eif3A MO, control/eIF3A expression construct, or control/RPS17 MO presented in Figure 5E–G. Raw values of normalized protein expression of RPS17 in HEK cells transfected with control or RPS17 expression construct presented in Figure 5H.
- https://doi.org/10.7554/eLife.33420.015
Figure 6 with 1 supplement
Knockdown of EIF3a, RPS17, and FUS blocks visual experience-dependent structural plasticity.
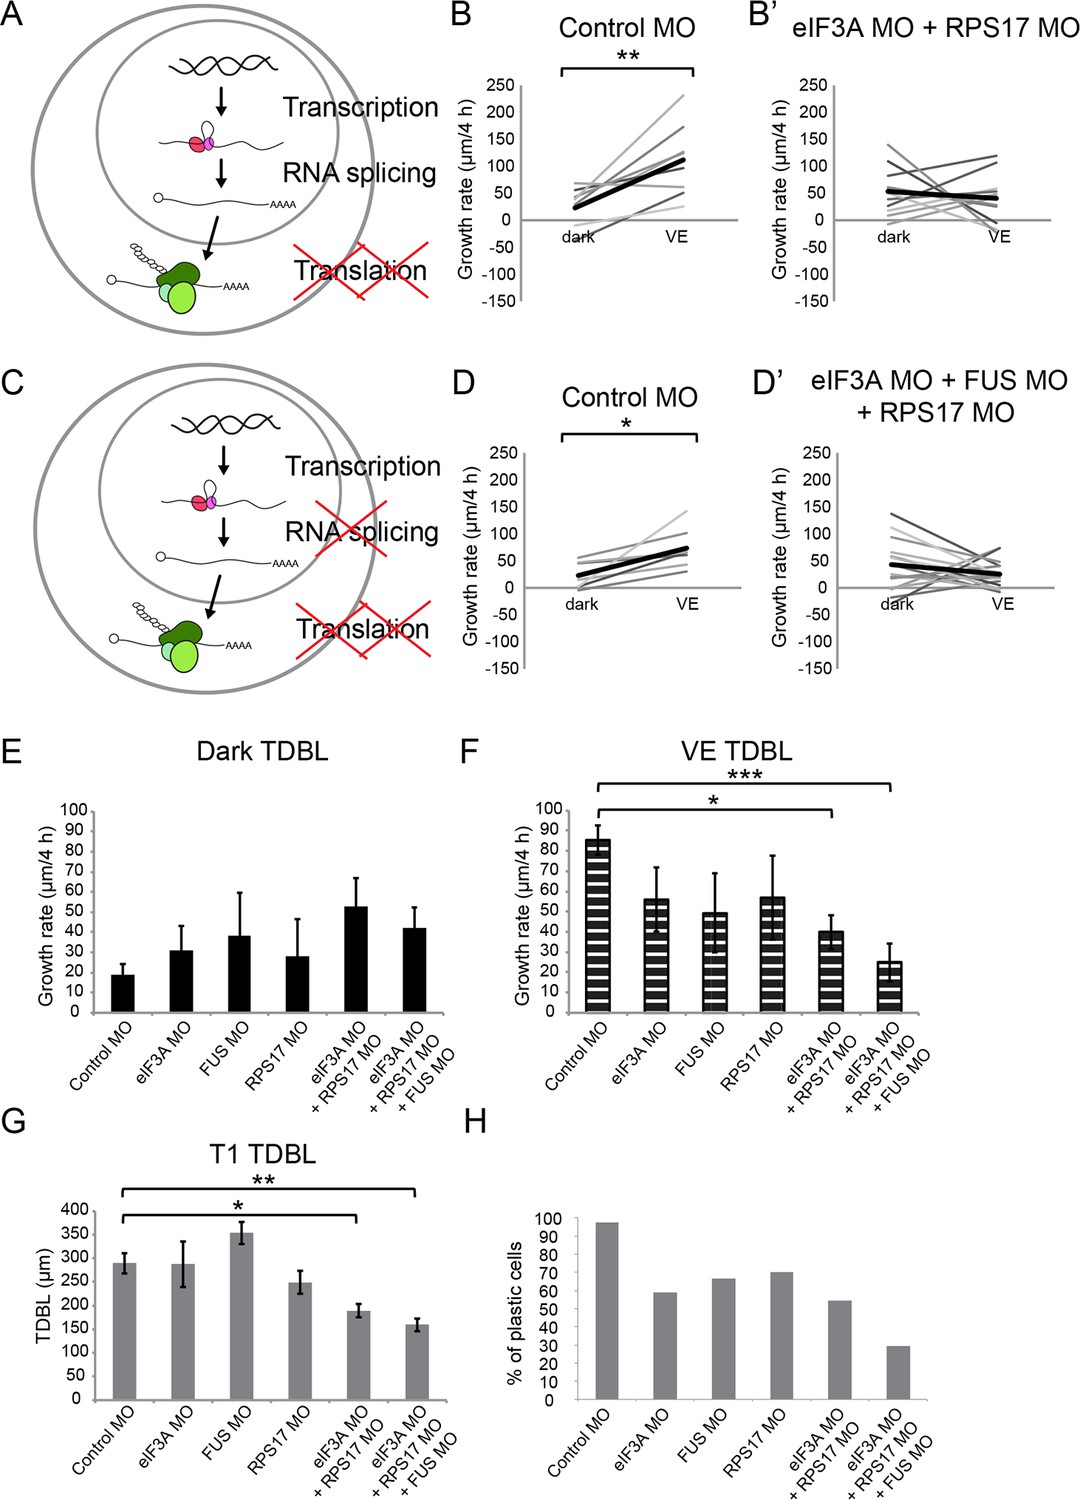
(A, C) Schematics of different steps of regulation in gene and protein expression. We tested the effect of manipulating translation alone (A) or both translation and RNA splicing (C). (B–B’, D–D’) VE-dependent changes in growth rate over 4 hr in dark and VE in tecta treated with control MO (B, D) or designated CPP MO mixtures (B’, D’). Gray lines connect data points for individual neurons and black lines are average changes in growth rate in dark and VE. (B, B’) VE-dependent changes in growth rate in neurons from tecta electroporated with control MO (B) or eIF3A and RPS17 MO (B’). Control MO: n = 9 cells; eIF3A MO + RPS17 MO: n = 11 cells. Knocking down both eIF3A and RPS17 blocked the VE-dependent increase in dendritic arbor growth. (D, D’) VE-dependent changes in growth rate of neurons in tecta electroporated with control MO (D) or a mixture of eIF3A MO, RPS17 MO, and FUS MO (D’). Control MO: n = 7 cells; eIF3A MO + RPS17 MO + FUS MO: n = 17 cells. Combined knockdown of eIF3A, RPS17, and FUS blocked the VE-dependent increase in dendritic arbor growth. (E, F) Dendritic arbor growth rate over 4 hr in dark (E) and VE (F) in tecta electroporated with control MO or designated CPP MOs. Dendritic growth rates in dark (E) are similar to individual MO knockdown but growth rates over 4 hr in VE (F) were significantly decreased in tecta electroporated with eIF3A MO + RPS17 MO or eIF3A MO + RPS17 MO + FUS MO. The variances in growth rates in the dark were not significantly different between groups (O'Brien, Brown-Forsythe, Levene, and Bartlett test). (G) TDBL at T1 reflects developmental dendritic arbor growth. Combined knockdown of eIF3A, RPS17, and FUS or eIF3A and RPS17 significantly reduced TDBL at T1. (E–G) Control MO: n = 38 cells; eIF3A MO: n = 17 cells; FUS MO: n = 9 cells; RPS17 MO: n = 10 cells; eIF3A MO + RPS17 MO: n = 11 cells; eIF3A MO + RPS17 MO + FUS MO: n = 17 cells. (H) Percentage of cells that increased dendritic arbor growth rate in response to VE. Control MO: 97%; eIF3A MO: 59%; FUS MO: 67%; RPS17 MO: 70%; eIF3A MO + RPS17 MO: 55%; eIF3A MO + RPS17 MO + FUS MO: 29%. Triple knockdown of eIF3A, RPS17, and FUS resulted in the lowest percentage of VE-responsive cells. Control morpholino and triple knockdown conditions have significantly different proportions of cells that respond to VE compared to the rest of the groups. *p<0.05, **p<0.01, two-tailed paired Student’s t test were used to compare between two matched pairs (B, D) or Steel-Dwass test with control for nonparametric multiple comparisons (E–G). The Chi-Square test for independence with a Bonferroni correction was used to compare distributions of each group with rest of the groups (H). Error bars represent ±SEM (E–G).
-
Figure 6—source data 1
Values of VE-dependent changes in tectal neuron growth rate over 4 hr in dark and VE presented in Figure 6B–B’ and Figure 6D–D’.
Quantification of growth rate in the dark or VE and TDBL at T1 presented in Figure 6E–G and raw data presented in Figure 6H.
- https://doi.org/10.7554/eLife.33420.018
Figure 6—figure supplement 1
eIF3A and RPS17 regulate protein synthesis in the tadpole tectum.
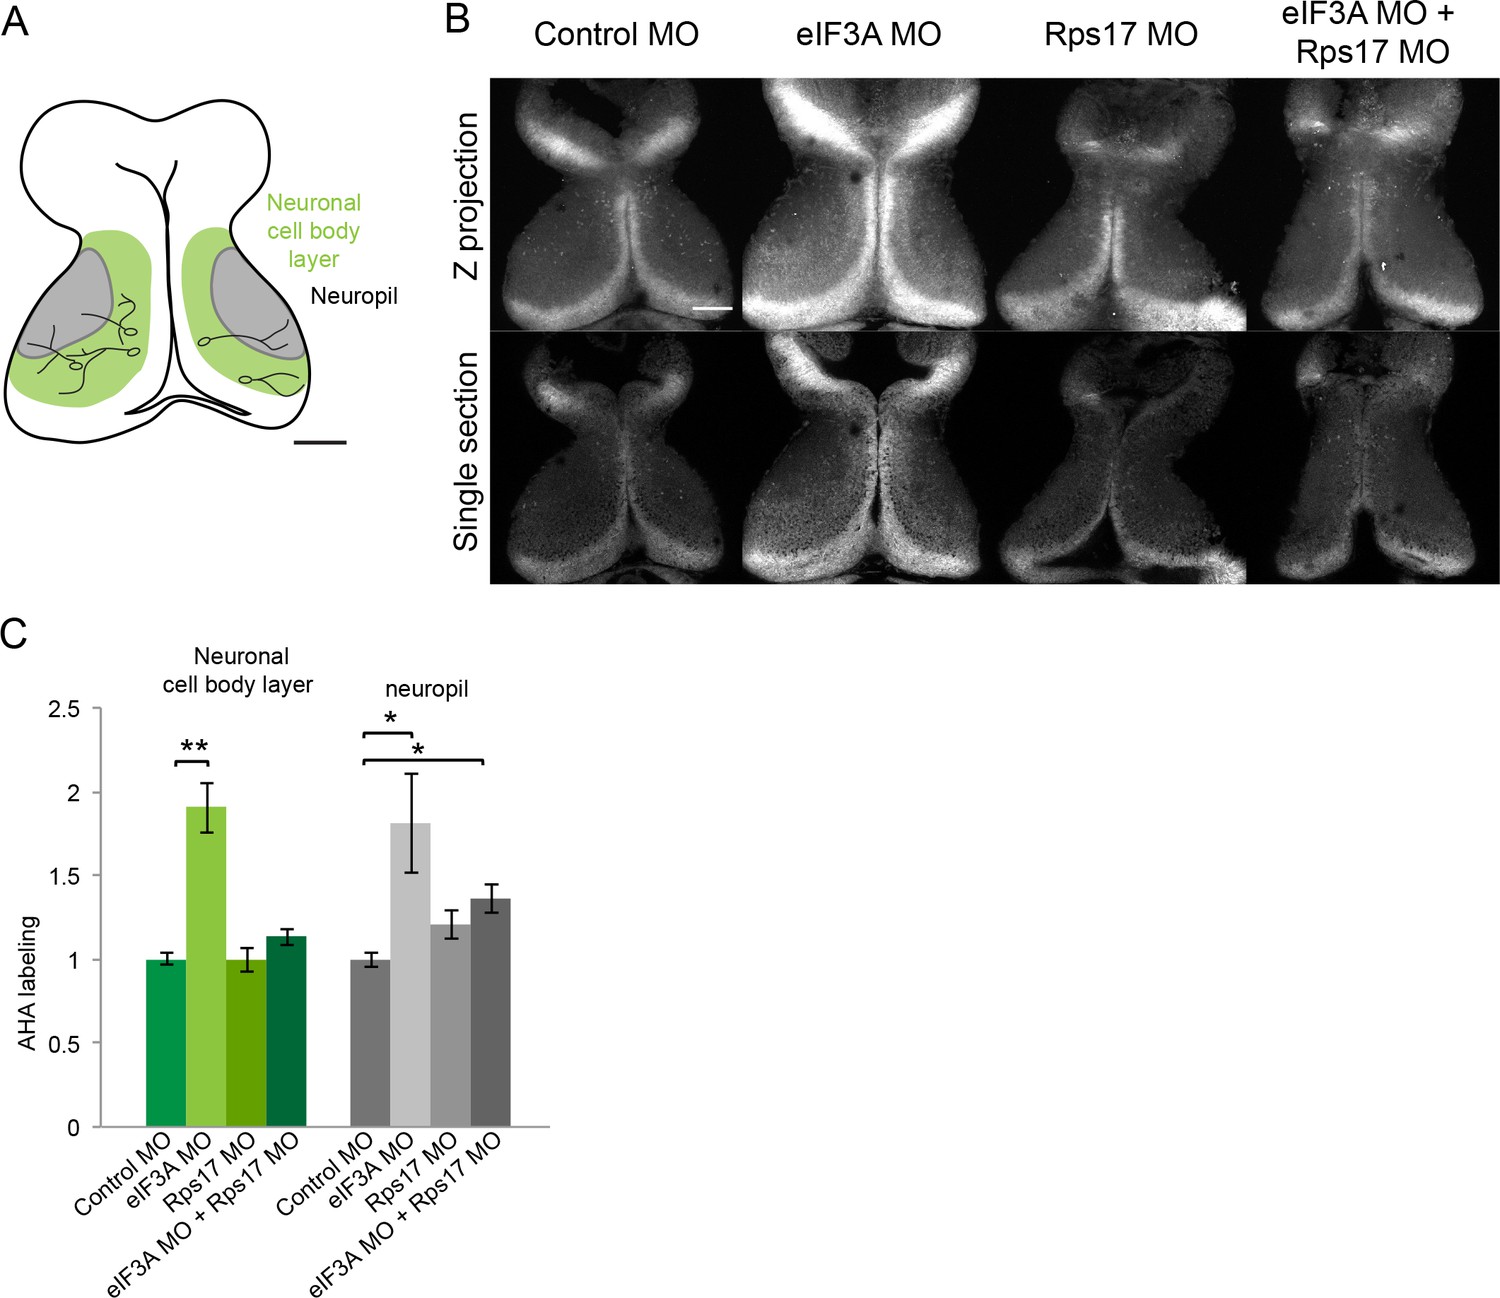
(A) Schematic of tadpole optic tectum showing the location of neuronal cell body layer (green) where tectal neuronal somata (black) extend processes into the neuropil (gray). MOs were electroporated into the tectum, and two day later AHA was injected into the midbrain ventricle. Tadpole brains were dissected 1 hr later and processed for click chemistry, which tags AHA with a fluorophore for visualization of AHA-labeled proteins. (B) Images of fluorescent AHA labeling in z-projections through optic tectum (top) or single confocal optical sections from comparable depths in optic tectum (bottom) from animals electroporated with control MO, eIF3A MO, RPS17 MO, or both eIF3A and RPS17 MO. In vivo AHA labeling detected 1 hr after ventricular AHA injection is increased by knockdown of eIF3A in both the neuronal cell body layer and neuropil. Knockdown both eIF3A and RPS17 only increase AHA labeling in the neuropil. (C) Normalized AHA labeling in the neuronal cell body layer and neuropil in animals treated with control MO, eIF3A MO, RPS17 MO, or both eIF3A and RPS17 MO. Control MO: 1 ± 0.04 in neuronal cell body layer and 1 ± 0.04 in neuropil, n = 14 brains; eIF3A MO: 1.91 ± 0.15 in neuronal cell body layer and 1.81 ± 0.3 in neuropil, n = 7 brains; RPS17 MO: 1 ± 0.07 in neuronal cell body layer and 1.21 ± 0.09 in neuropil, n = 12 brains; eIF3A plus RPS17 MO: 1.13 ± 0.05 in neuronal cell body layer and 1.36 ± 0.09 in neuropil, n = 19 brains. *=p < 0.05, **=p < 0.01, Steel-Dwass test was used for nonparametric multiple comparisons between all pairs. Error bars represent ±SEM. Scale bar = 100 μm.
-
Figure 6—figure supplement 1—source data 1
Raw values of normalized AHA labeling in the neuronal cell body layer and neuropil in animals treated with control MO, eIF3A MO, RPS17 MO, or both eIF3A and RPS17 MO presented in Figure 6—figure supplement 1C.
- https://doi.org/10.7554/eLife.33420.019
Figure 7

Knockdown of eIF3A, RPS17, and FUS blocks visual experience-dependent behavioral plasticity.
(A) Protocol to evaluate the effect of eIF3A, FUS, and RPS17 knockdown on visual avoidance behavior. Tecta were electroporated with control MO or eIF3A MO + RPS17 MO + FUS MO and 2 days later were assayed for baseline visual avoidance behavior at −1 hr, exposed to VE for 4 hr and assayed for visual avoidance behavior 5 hr and 24 hr after the onset of VE. (B) VE-induced behavioral plasticity in control animals was detected at 5 hr and maintained at 24 hr. (C) Triple knockdown blocked behavioral plasticity. AI values were normalized to baseline at −1 hr (B–C). (B–C) CMO: AI = 1 ± 0.07, 1.32 ± 0.09, or 1.48 ± 0.09; n = 21, 27, or 31 animals for tests at −1 hr, 5 hr, or 24 hr; eIF3A MO + RPS17 MO + FUS MO: AI = 1 ± 0.10, 1.19 ± 0.08, or 1.18 ± 0.08; n = 22, 33, or 33 animals for tests at −1 hr, 5 hr, or 24 hr. *=p < 0.05, **=p < 0.01, the Steel-Dwass test was used for nonparametric multiple comparisons with control. Error bars represent ±SEM. (D) Schematic of visual experience-induced dynamics in protein synthesis machinery. By combining BONCAT and DiDBiT, we identified CPPs including master regulators that control gene expression or protein translation, such as eIF3A, FUS, and RPS17, and effector proteins that maintain plasticity in response to VE, such as cytoskeletal proteins. Functional analysis of select CPPs suggests that de novo synthesis of master regulators is required for experience-dependent plasticity. Our data suggest that the experience-dependent changes in the nascent proteome result from a combination of direct changes in synthesis of master regulators and effector proteins, and secondary effects downstream of differential synthesis of master regulators.
-
Figure 7—source data 1
Quantification of normalized AI values data presented in Figure 7B–C.
- https://doi.org/10.7554/eLife.33420.021
Tables
Table 1
Candidate plasticity proteins (CPPs) include FMRP targets and autism spectrum disorder (ASD) genes.
CPPs were compared to FMRP targets identified by CLIP (Darnell et al., 2011) and genes from the Simons Foundation and Autism Research Initiative (SFARI) database (gene.sfari.org) for potential activity-regulated FMRP targets and ASD genes. The final fold changes in AHA labeling is from the average of two independent experiments (Supplementary file 2). The 83 CPPs shown here are AHA-labeled newly synthesized proteins (NSPs) that showed consistent increases or decreases in synthesis in response to visual experience with at least 20% change in one of the experiments.
| Gene names | Human Uniprot ID | Final Fold Change | FMRP targets and ASD genes | Gene names | Human Uniprot ID | Final Fold Change | FMRP targets and ASD genes | ||||
|---|---|---|---|---|---|---|---|---|---|---|---|
| FMRP targets | SFARI database | FMRP targets | SFARI database | ||||||||
| Up in two experiments | capza1 | P52907 | 1.36 | Down in two experiments | cct7 | Q99832 | 0.40 | ||||
| capza2 | P47755 | 1.33 | clasp1 | Q7Z460 | 0.74 | V | |||||
| cbx1 | P83916 | 1.36 | col18a1 | P39060 | 0.71 | ||||||
| cbx3 | Q13185 | 1.36 | ctnnb1 | P35222 | 0.63 | V | V | ||||
| fus | P35637 | 1.36 | papss1 | O43252 | 0.67 | ||||||
| hdlbp | Q00341 | 1.26 | V | psmc6 | P62333 | 0.75 | |||||
| rps17 | P08708 | 1.71 | tln1 | Q9Y490 | 0.71 | ||||||
| tuba1b | P68363 | 1.95 | atp2a2 | P16615 | 0.66 | V | |||||
| lonp1 | P36776 | 1.31 | pmp2 | P02689 | 0.55 | ||||||
| sfpq | P23246 | 1.54 | acta1 | P68133 | 0.73 | ||||||
| ttpal | Q9BTX7 | 1.42 | atp2a1 | O14983 | 0.66 | ||||||
| tuba1a | Q71U36 | 1.95 | kif1a | Q12756 | 0.65 | V | |||||
| Up in one experiment | cox5a | P20674 | 1.30 | Down in one experiment | actb | P60709 | 0.78 | V | |||
| eif3a | Q14152 | 1.16 | aplp2 | Q06481 | 0.74 | ||||||
| krt75 | O95678 | 1.17 | cand1 | Q86VP6 | 0.83 | V | |||||
| metap2 | P50579 | 1.22 | dnm1l | O00429 | 0.78 | V | |||||
| naca | Q13765 | 1.38 | hist1h4a | P62805 | 0.61 | ||||||
| nono | Q15233 | 1.15 | hnrnpa1 | P09651 | 0.81 | ||||||
| psmd2 | Q13200 | 1.40 | hnrnpc | P07910 | 0.76 | ||||||
| rab5a | P20339 | 1.14 | hsp90ab1 | P08238 | 0.79 | V | |||||
| rab5c | P51148 | 1.14 | hspa5 | P11021 | 0.68 | ||||||
| eif4a1 | P60842 | 1.18 | mdh2 | P40926 | 0.75 | ||||||
| hnrnpab | Q99729 | 1.21 | ncl | P19338 | 0.81 | ||||||
| pbrm1 | Q86U86 | 1.36 | pcbp3 | P57721 | 0.60 | ||||||
| rab5b | P61020 | 1.20 | snw1 | Q13573 | 0.75 | ||||||
| skiv2l2 | P42285 | 1.25 | actg1 | P63261 | 0.79 | ||||||
| ap2a2 | O94973 | 1.15 | V | hn1 | Q9UK76 | 0.82 | |||||
| iws1 | Q96ST2 | 1.25 | kif1b | O60333 | 0.81 | V | |||||
| vim | P08670 | 1.19 | pcbp2 | Q15366 | 0.60 | ||||||
| nsrp1 | Q9H0G5 | 1.36 | smc1a | Q14683 | 0.80 | ||||||
| syp | P08247 | 1.17 | sptan1 | Q13813 | 0.84 | V | |||||
| cxxc4 | Q9H2H0 | 1.47 | stip1 | P31948 | 0.74 | ||||||
| dpysl3 | Q14195 | 1.19 | trim69 | Q86WT6 | 0.71 | ||||||
| fasn | P49327 | 1.23 | V | arnt2 | Q9HBZ2 | 0.78 | V | V | |||
| kiaa1598 | A0MZ66 | 1.16 | cdh11 | P55287 | 0.80 | V | |||||
| Up in one experiment | krt7 | P08729 | 1.17 | Down in one experiment | hk1 | P19367 | 0.80 | V | |||
| lgmn | Q99538 | 1.55 | mcm4 | P33991 | 0.76 | V | |||||
| sptbn1 | Q01082 | 1.18 | V | smarcd2 | Q92925 | 0.84 | |||||
| stmn2 | Q93045 | 0.70 | |||||||||
| acta2 | P62736 | 0.80 | |||||||||
| actc1 | P68032 | 0.80 | |||||||||
| kif1c | O43896 | 0.81 | |||||||||
| kif5c | O60282 | 0.80 | V | V | |||||||
| smarcd1 | Q96GM5 | 0.84 | |||||||||
| smarcd3 | Q6STE5 | 0.84 | |||||||||
Key resources table
| Reagent type | Designation | Source or reference | Identifiers |
|---|---|---|---|
| Antibody | mouse-anti-CaMKIIα antibody | Novus | Cat# NB100-1983, RRID:AB_10001339 |
| Antibody | rabbit-anti-β-tubulin | Santa Cruz Biotechnology | Cat# sc-9104, RRID:AB_2241191 |
| Antibody | mouse-anti-L1CAM | Abcam | Cat# ab24345, RRID:AB_448025 |
| Antibody | rabbit-anti-BSA | Thermo Fisher Scientific | Cat# PA1-29262, RRID:AB_1956427 |
| Antibody | mouse-anti-FUS/TLS | BD Bioscience | Cat# 611385, RRID:AB_398907 |
| Antibody | rabbit-anti-eIF3A | Novus | Cat# NBP1-79628, RRID:AB_11042798 |
| Antibody | mouse-anti-RPS17 | Abnova Corporation | Cat# H00006218-M01, RRID:AB_2285214 |
| Antibody | rabbit-anti-PSMD2 | Cell Signaling Technology | Cat#14141 (This product is discontinued) |
| Antibody | mouse-anti-calmodulin | Millipore | Cat# 05–173, RRID:AB_309644 |
Additional files
-
Supplementary file 1
Table of proteins identified in global brain proteome and nascent proteome.
Related to Figure 1. List of genes identified by searching MS/MS spectra against three different databases, including Uniprot Xenopus laevis database, Xenbase, and PHROG and then converted to human homologs by gene symbol. From two independent experiments, we identified 4833 unmodified proteins in the global brain proteome (sheet 1) and 835 AHA-labeled NSPs in the nascent proteome (sheet 2).
- https://doi.org/10.7554/eLife.33420.022
-
Supplementary file 2
Normalized fold change in AHA labeling searched against three different databases.
Related to Table 1. The normalized fold changes visual experience (VE):control (V/C) in AHA labeling from two independent experiments by searching MS/MS spectra against three different databases were listed. The final fold changes in AHA labeling is from the averaged of two independent experiments are also shown in Table 1. CPPs are shaded in red if they increased in both experiments, in pink if increased in one of the experiments, in green if decreased in both experiments, and in light green if decrease in on of the experiments.
- https://doi.org/10.7554/eLife.33420.023
-
Supplementary file 3
Table of proteins identified in VE-dependent nascent proteome.
Related to Table 1. 83 CPPs are annotated to a variety of cellular compartments, molecular functions, and biological processes by using the PANTHER database.
- https://doi.org/10.7554/eLife.33420.024
-
Supplementary file 4
The enriched GO annotation in biological process of 83 CPPs.
Related to Table 1. We identified the enriched GO annotation using both human and mouse protein interaction databases provided by STRING.
- https://doi.org/10.7554/eLife.33420.025
-
Supplementary file 5
List of the PANTHER protein classes in the global brain proteome, nascent proteome, and VE-dependent nascent proteome.
Related to Figure 1. Proteins were annotated using PANTHER. The breakdown of the ‘others’ category in the pie charts in Figure 1B–D is included.
- https://doi.org/10.7554/eLife.33420.026
-
Supplementary file 6
Summary of synaptic localizations of CPPs.
Related to Table 1. The synaptic localizations of 83 CPPs are derived from SynProt and PreProt databases.
- https://doi.org/10.7554/eLife.33420.027
-
Supplementary file 7
RT-PCR primer oligonucleotides used for this study.
Related to Experimental Procedures. Forward and reverse primer sequences that were used for quantification of gene expression are shown.
- https://doi.org/10.7554/eLife.33420.028
-
Supplementary file 8
Overlap of 5 hr optic tectal nascent proteome with the 24 hr whole brain nascent proteome.
List of 992 proteins from the Shen et al. (2014) study of AHA-labeled NSPs from tadpole brains labeled over a 24 hr period, generated by searching against the Uniprot database. We compared the 5 hr optic tectal nascent proteome (Supplementary file 1), searched against the Uniprot database, with the 24 hr whole brain nascent proteome, and highlighted the overlapping proteins. The dataset for the 24 hr whole brain nascent proteome is available at http://proteomecentral.proteomexchange.org/cgi/GetDataset?ID=PXD008659.
- https://doi.org/10.7554/eLife.33420.029
-
Supplementary file 9
Statistical table.
For each statistical test run in the study, the data structure, type of statistical test, sample size, p-value and power are listed.
- https://doi.org/10.7554/eLife.33420.030
-
Transparent reporting form
- https://doi.org/10.7554/eLife.33420.031
Download links
A two-part list of links to download the article, or parts of the article, in various formats.
Downloads (link to download the article as PDF)
Open citations (links to open the citations from this article in various online reference manager services)
Cite this article (links to download the citations from this article in formats compatible with various reference manager tools)
Role of the visual experience-dependent nascent proteome in neuronal plasticity
eLife 7:e33420.
https://doi.org/10.7554/eLife.33420


