Gene network analysis identifies a central post-transcriptional regulator of cellular stress survival
- University of Chicago, United States
Figures
Figure 1 with 2 supplements
Iterative rank analysis of gene expression data identifies gsrN, a small RNA that confers resistance to hydrogen peroxide.
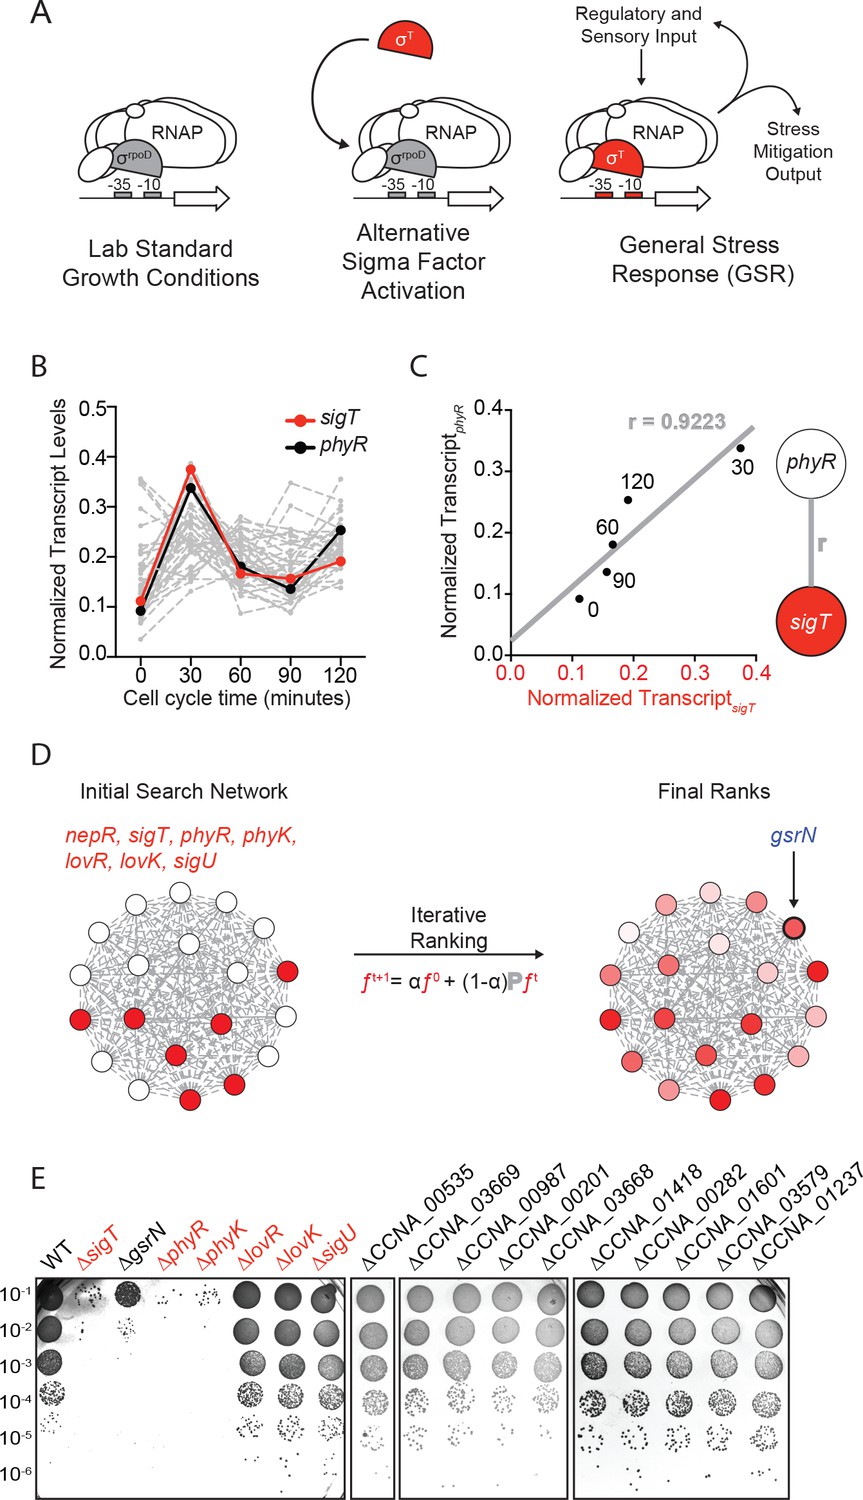
(A) Activation of general stress response (GSR) sigma factor, σT, promotes transcription of genes that mitigate the effects of environmental stress and genes that regulate σT activity. (B) Normalized transcript levels from (Fang et al., 2013) of known GSR regulated genes are plotted as a function of cell cycle time. The core GSR regulators, sigT and phyR, are highlighted in red and black, respectively. Data plotted from Figure 1—source data 1. (C) sigT and phyR transcript levels are correlated as a function of cell cycle progression, Pearson’s correlation coefficient r = 0.92. (D) An initial correlation-weighted network was seeded with experimentally defined GSR regulatory genes (red, value = 1) (left). Final ranks were calculated using the stable solution of the iterative ranking algorithm (right). Red intensity scales with the final rank weights (Figure 1—source data 2). A gene encoding a small RNA, gsrN, was a top hit on the ranked list. (E) Colony forming units (CFU) in dilution series (10−1 to 10−6 dilution factor) of wild-type and mutant Caulobacter strains after 0.2 mM hydrogen peroxide treatment for 1 hr. Red denotes core GSR regulatory genes. Black denotes known σT–regulated genes. GenBank locus ID is indicated for unnamed genes.
-
Figure 1—source data 1
Excel file of gene expression data from (Fang et al.
, 2013) and estimated by Rockhopper (Tjaden, 2015). Each column represents the estimated transcript from total RNA-extractions of Caulobacter crescentus cultures at five time points post-synchronization. These values were used to construct the network.
- https://doi.org/10.7554/eLife.33684.005
-
Figure 1—source data 2
Excel file of the results from the iterative rank algorithm.
Results can be recapitulated using the scripts in https://github.com/mtien/IterativeRank.
- https://doi.org/10.7554/eLife.33684.006
Figure 1—figure supplement 1

Parameter optimization of iterative rank through predicting phyR demonstrates edge-reduction as an important parameter (see Materials and methods - Iterative rank parameter tuning).
(A) Systematic parameter exploration of the alpha value and edge-reduction, where sigT, sigU, phyK, nepR, lovK, and lovR are initialized with weight. Alpha value is plotted on the x-axis while the final rank of phyR on the y-axis. Colors indicate networks where edges less than the indicated value were removed. (B) Distribution of edges per node for networks with no edge-weight cutoff (black) or an edge-weight cutoff of 0.9 (red). Edge reduction of 0.9 dramatically reduces the number of edges per node. (C) The total number of edges in a network is plotted for a range of edge-weight cutoffs. Edge-weight cutoff of 0.9 reduced total edges by 10-fold.
Figure 1—figure supplement 2
gsrN transcription is activated by σT and induced in stationary phase growth.
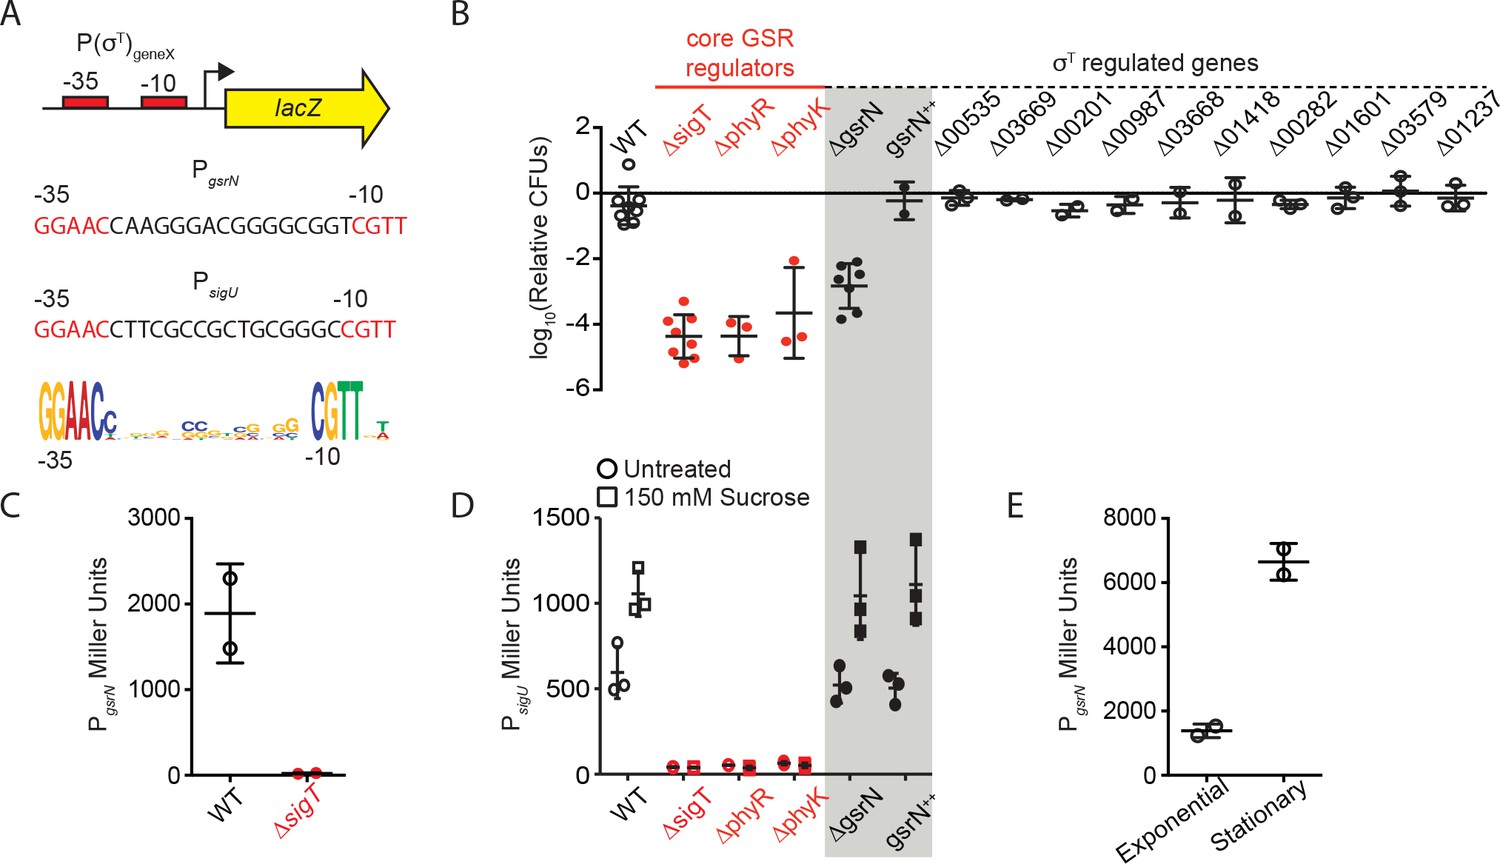
GsrN does not affect transcription from a σT-dependent reporter. (A) Schematic of lacZ transcriptional fusions to the promoters of gsrN and sigU. sigU is a well-characterized reporter of GSR transcription (Foreman et al., 2012). Promoters of both genes contain a consensus σT binding site (nucleotides in red) (Alvarez-Martinez et al., 2007; McGrath et al., 2007; Staroń et al., 2009). σT binding motif (bottom) generated from 21 σT-dependent promoters using WebLogo (Crooks et al., 2004). (B) Quantification of relative hydrogen peroxide survival of strains presented in Figure 1E. CFU of peroxide treated cultures were normalized by the CFU of the paired untreated culture. Genotypes are indicated above each bar. Numbers indicate CCNA locus numbers of deleted genes. gsrN++ is the 4gsrN overexpression strain described in Figure 2A and Figure 2—figure supplement 1A. Bars represent mean ± SD from at least two independent biological replicates (points). (C) β-galactosidase activity from the PgsrNlacZ transcriptional fusion in Caulobacter wild-type and ΔsigT backgrounds measured in Miller Units. Bars represent mean ±SD from two independent cultures. (D) β-galactosidase activity from the PsigUlacZ transcriptional fusion in a sub-set of the genetic backgrounds in (B). GSR transcription was induced by exposure to 150 mM sucrose (final concentration) for three hours before measuring β-galactosidase activity. Exposure time and sucrose concentration were chosen based on past experiments with this reporter (Foreman et al., 2012). Bars represent mean ±SD from three independent cultures. (E) β-galactosidase activity from the PgsrNlacZ transcriptional fusion in exponentially growing (OD660≈ 0.25) and early stationary phase (OD660≈ 0.75) wild-type cells. This result is consistent with cultures grown to a range of early to late stationary phase densities (OD660 ≈ 0.7–1.2; data not show). Bars represent mean ±SD from two independent cultures.
Figure 2 with 1 supplement
GsrN is necessary for hydrogen peroxide stress survival, and expression of GsrN is sufficient to confer peroxide protection in a sigT null background.
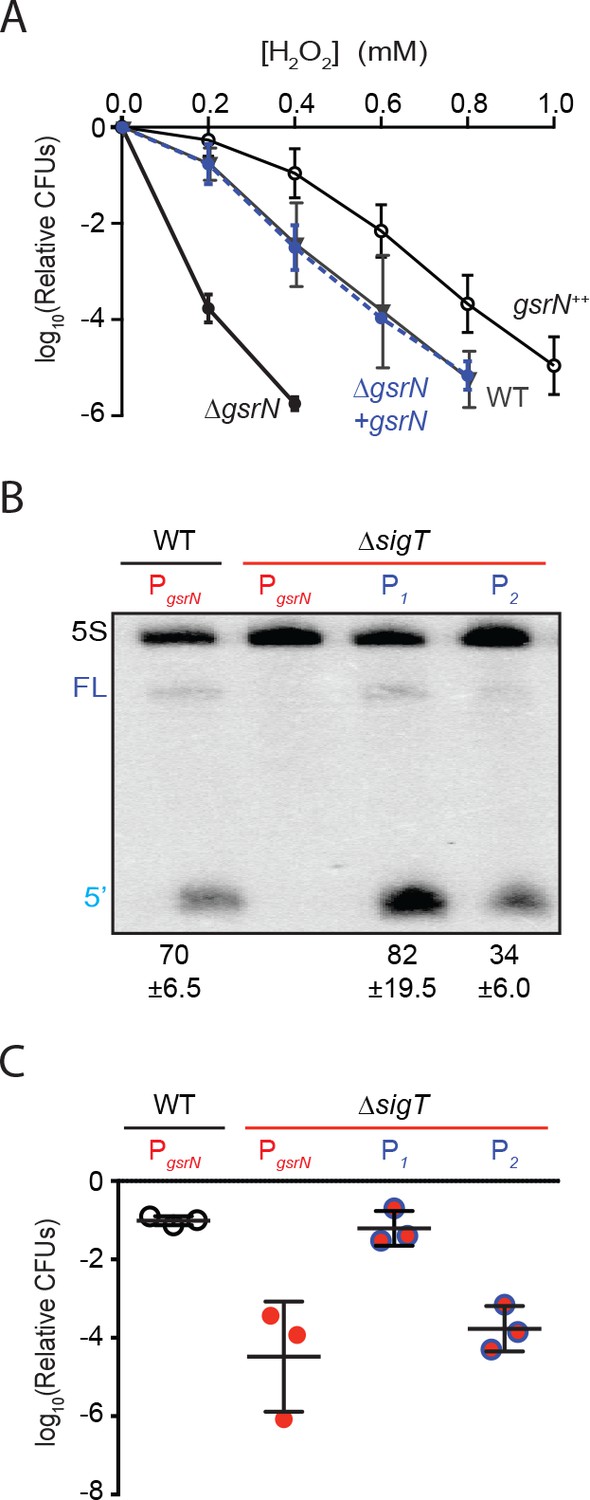
(A) Caulobacter wild type (WT), gsrN deletion (ΔgsrN), complementation (ΔgsrN + gsrN), and gsrN overexpression (gsrN++) strains were subjected to increasing concentrations of hydrogen peroxide for 1 hr and titered on nutrient agar. Complementation and overexpression strains carry plasmids with one or three copies, respectively, of gsrN with its native promoter integrated at the ectopic vanA locus (see Figure 2—figure supplement 1A for details). ΔgsrN and WT strains carried the empty plasmid (pMT552) integrated at the vanA locus. Log10 relative CFU (peroxide treated/untreated) is plotted as a function of peroxide concentration. Mean ±SD, n = 3 independent replicates. (B) Northern blot of total RNA isolated from WT and ΔsigT strains expressing gsrN from its native promoter (PsigT) or from two constitutive σRpoD promoters (P1 or P2); probed with 32P-labeled oligonucleotides specific for GsrN and 5S rRNA as a loading control. Labels on the left refer to 5S rRNA (5S in black), full-length GsrN (FL in dark blue), and the 5’isoform of GsrN. (5’ in cyan) Quantified values are mean ±SD of normalized signal, n = 3 independent replicates. (C) Relative survival of strains in (B) treated with 0.2 mM hydrogen peroxide for 1 hr normalized as in (A). Mean ±SD from three independent experiments (points) is presented as bars.
Figure 2—figure supplement 1
GsrN-dependent cell protection under oxidative stress is dose dependent.
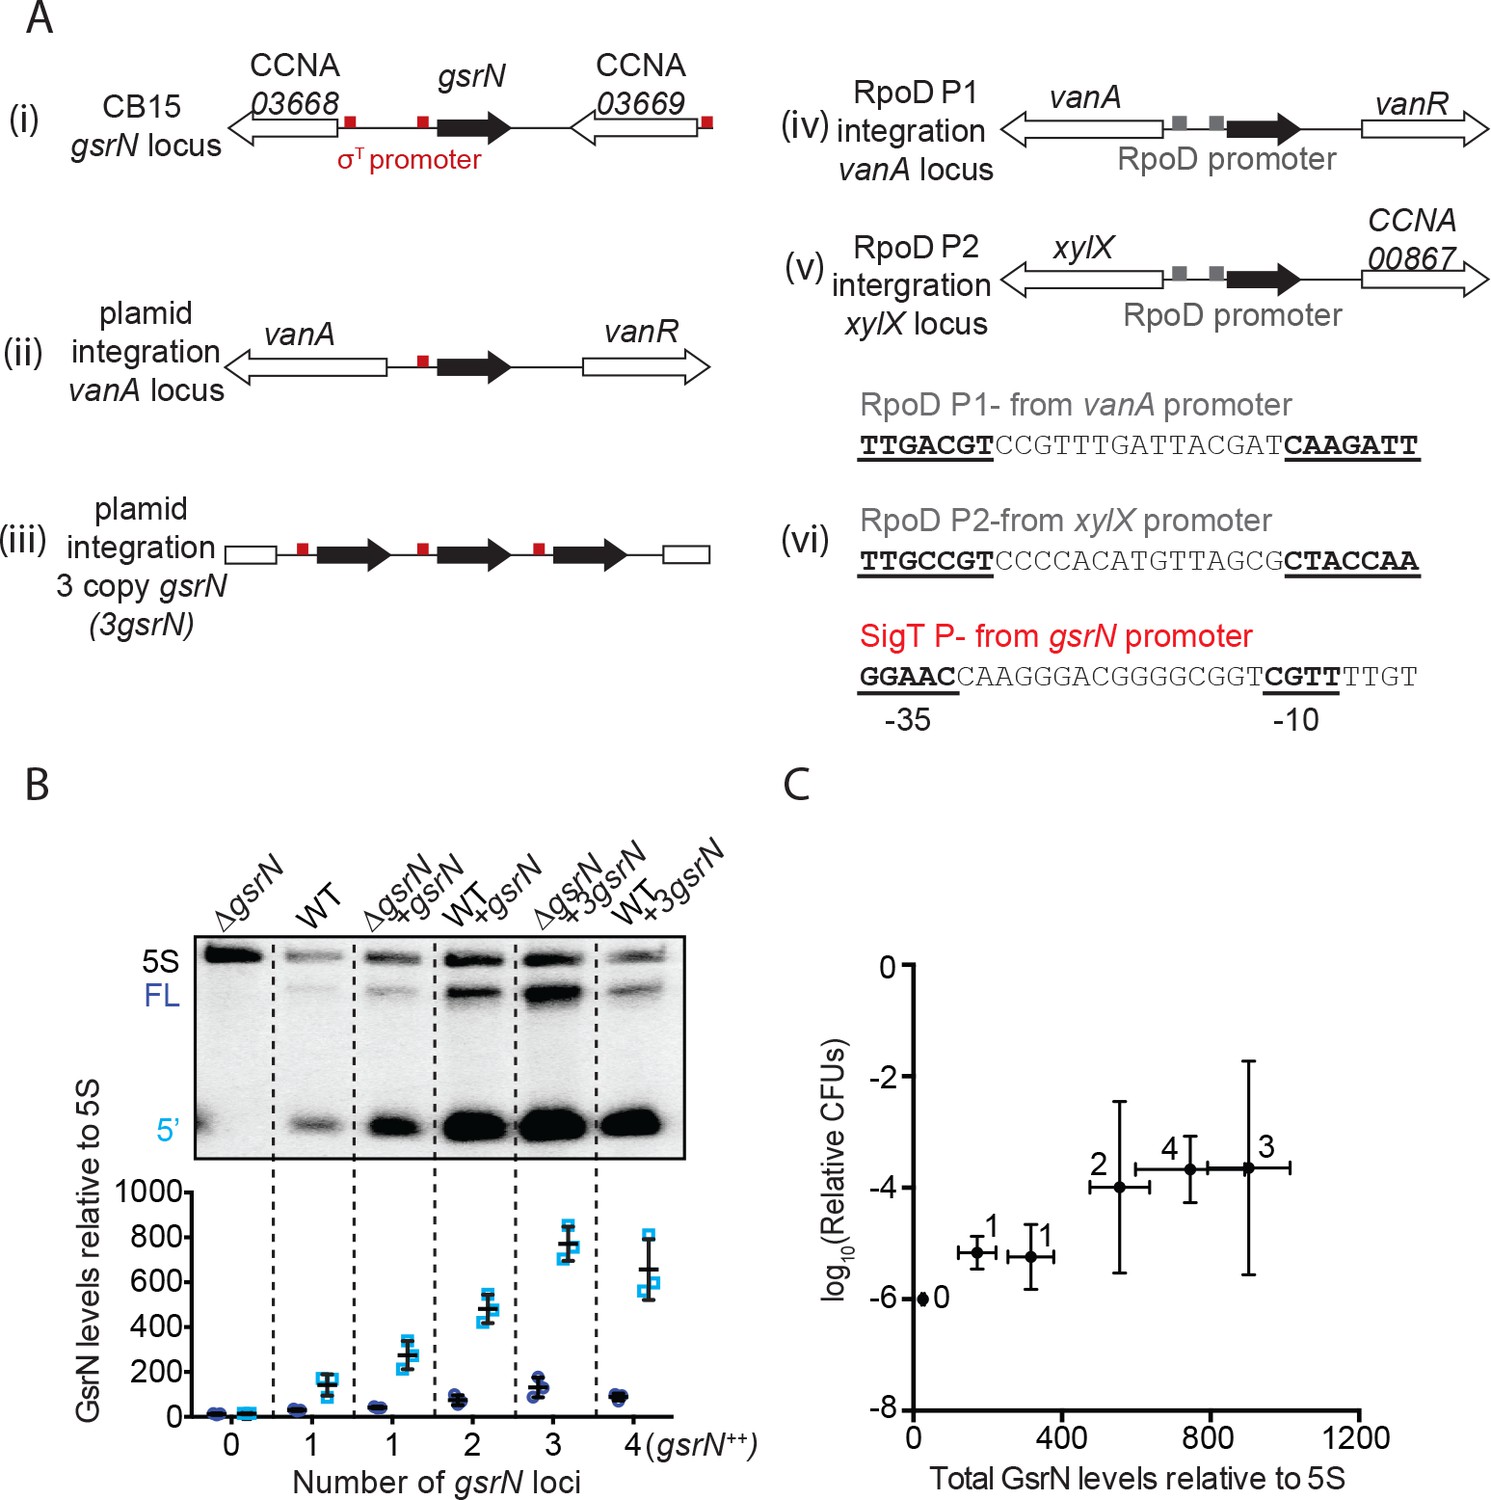
(A) In this study, gsrN was expressed several different ways. (i) At the native locus, the gsrN promoter contains a consensus σT binding site (red box); gsrN is flanked by two genes also with predicted σT promoters. Ectopic complementation and overexpression strains were created using pMT552-derived plasmids containing either (ii) one or (iii) three tandem copies of gsrN that were integrated into the chromosomal vanA locus. We also constructed strains in which gsrN expression was driven from one of two distinct σrpoD-dependent promoters integrated in the chromosome. (iv) The RpoD P1 promoter was taken from the predicted σrpoD binding site directly upstream of the vanA transcriptional start site (Thanbichler et al., 2007) and directly replaced the consensus σT binding site of gsrN; (v) RpoD P2 promoter was taken from the predicted σrpoD binding site upstream of xylX (Meisenzahl et al., 1997) and directly replaced the consensus σT binding site of gsrN. (vii) Sequence of the σrpoD and σT binding sites used to drive expression of gsrN. (B) Northern blots of RNA isolated from strains expressing increasing copies of gsrN probed with oligos complementary to GsrN. 5S rRNA was blotted as a loading control. Cells were harvested in exponential phase. Blots were quantified by densitometry. GsrN signal from the full-length (FL; dark blue) and 5’ isoform (5’; cyan) are normalized to 5S rRNA in each lane and multiplied by 100. Bars represent mean ±SD of triplicate extractions, each representing biologically independent samples. (C) Relationship between GsrN levels and peroxide stress survival. Total GsrN levels quantified by Northern blot (B) plotted against relative cell survival after 0.8 mM hydrogen peroxide treatment (CFU determined as outlined in Figure 1—figure supplement 2B). This condition is better suited for revealing protective effects (see Figure 2A). The ΔgsrN strain has zero CFUs after one hour treatment with 0.8 mM hydrogen peroxide, and no detectable GsrN by Northern blots, thus the y-axis point for this strain was plotted at 10−6, the detection limit of our assay.
Figure 3 with 2 supplements
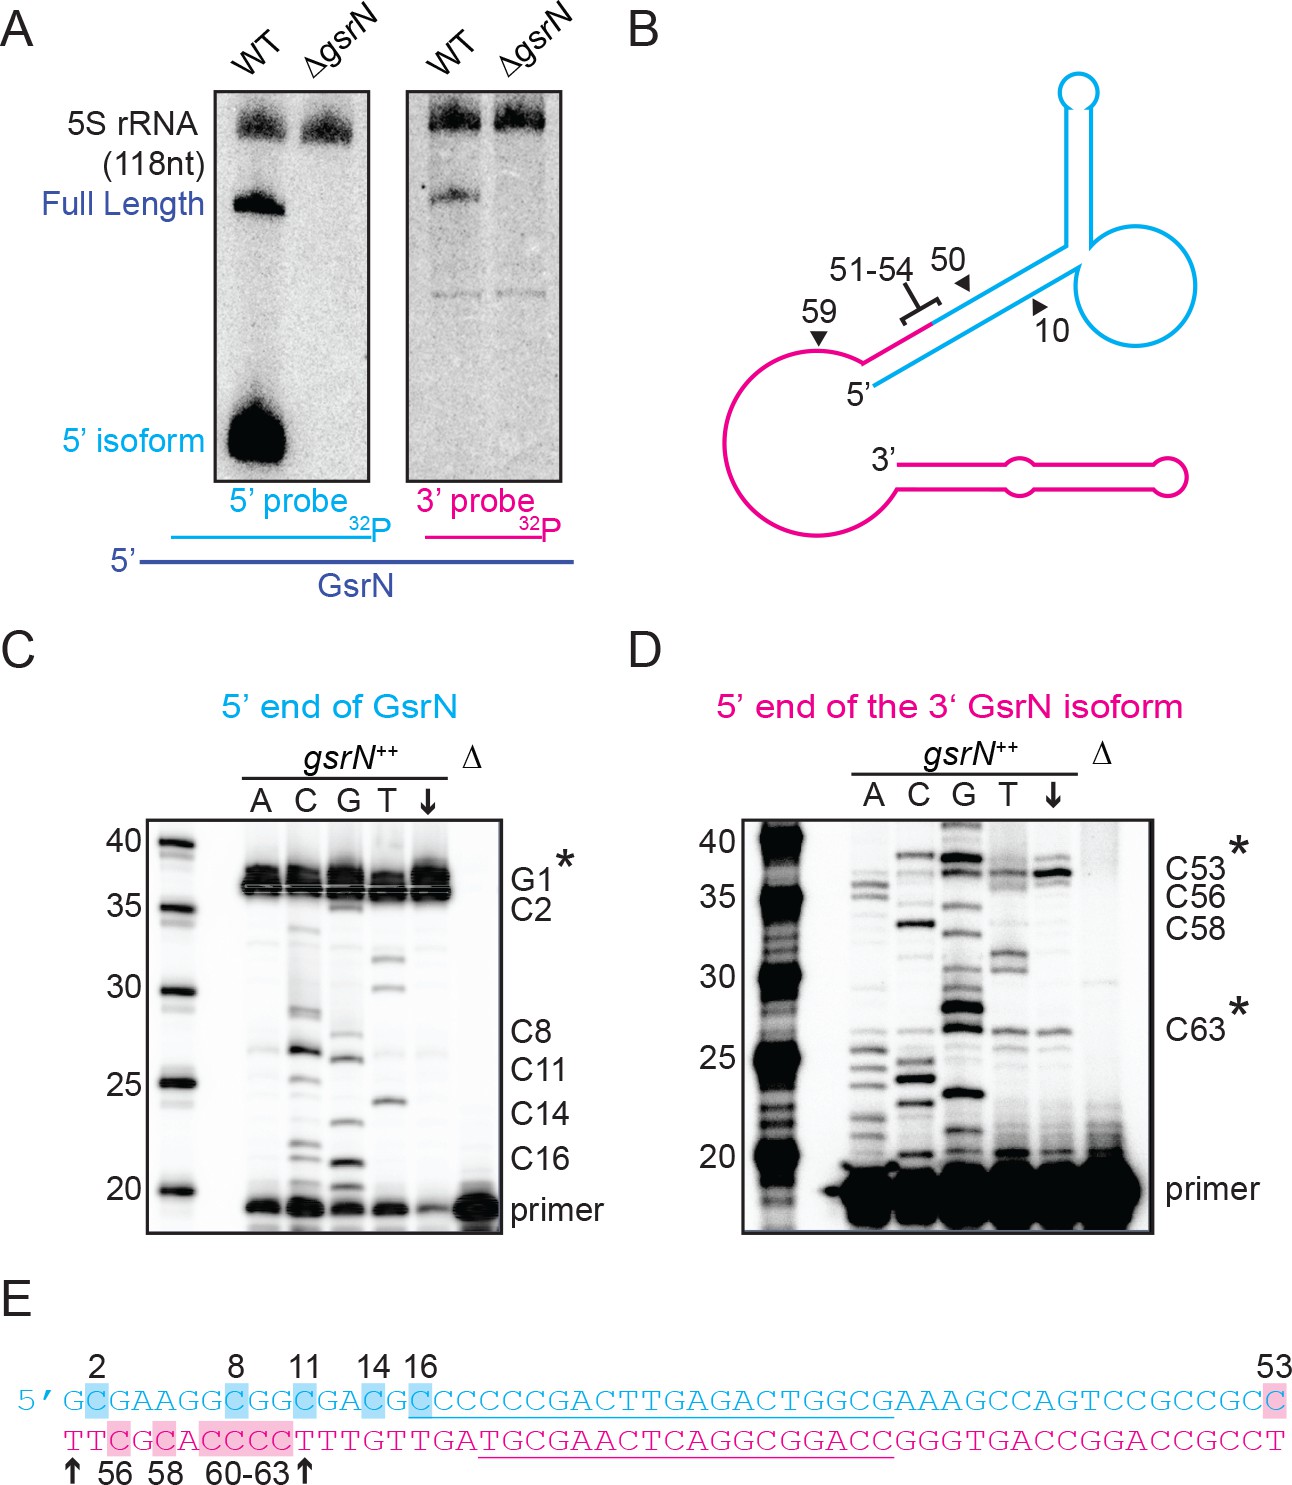
Full-length GsrN is endonucleolytically processed into a stable 5’ isoform.
(A) Northern blots of total RNA from wild-type and ΔgsrN cells hybridized with probes complementary to the 5’end (left) or 3’ end (right) of GsrN, and to 5S rRNA as a loading control. (B) Predicted secondary structure of full-length GsrN using RNA-specific folding parameters (Andronescu et al., 2007). Cyan indicates the 5’ end of GsrN determined by primer extension. Pink represents the 3’ end. Nucleotide positions labeled with arrows provides context for the mutants in Figure 4. (C) Primer extension from total RNA extracted from gsrN++ and ΔgsrN (negative control) cultures (OD660 ≈ 1.0, a condition in which GsrN levels were observed to be the highest). Sequence was generated from a radiolabeled oligo anti-sense to the underlined cyan sequence in (E). Sanger sequencing control lanes A, C, G, and T mark the respective ddNTP added to that reaction to generate nucleotide specific stops. C’ labels on the right of the gel indicate mapped positions from the ‘G’ lane. Arrow indicates lane without ddNTPs. Asterisk indicates positions of 5’ termini. (D) Primer extension from RNA samples as in (C). Sequence was extended from a radiolabeled oligo anti-sense to the underlined pink sequence in (E). (E) GsrN coding sequence. Cyan and pink indicate the predicted 5’ and 3’ isoforms, respectively. Primers binding sites used for primer extension in (C) and (D) are underlined. Highlighted C positions correspond to ddGTP stops in the ‘G’ extensions. Black arrowheads correspond to the termini identified by 5’RACE (Figure 3—figure supplement 1).
Figure 3—figure supplement 1
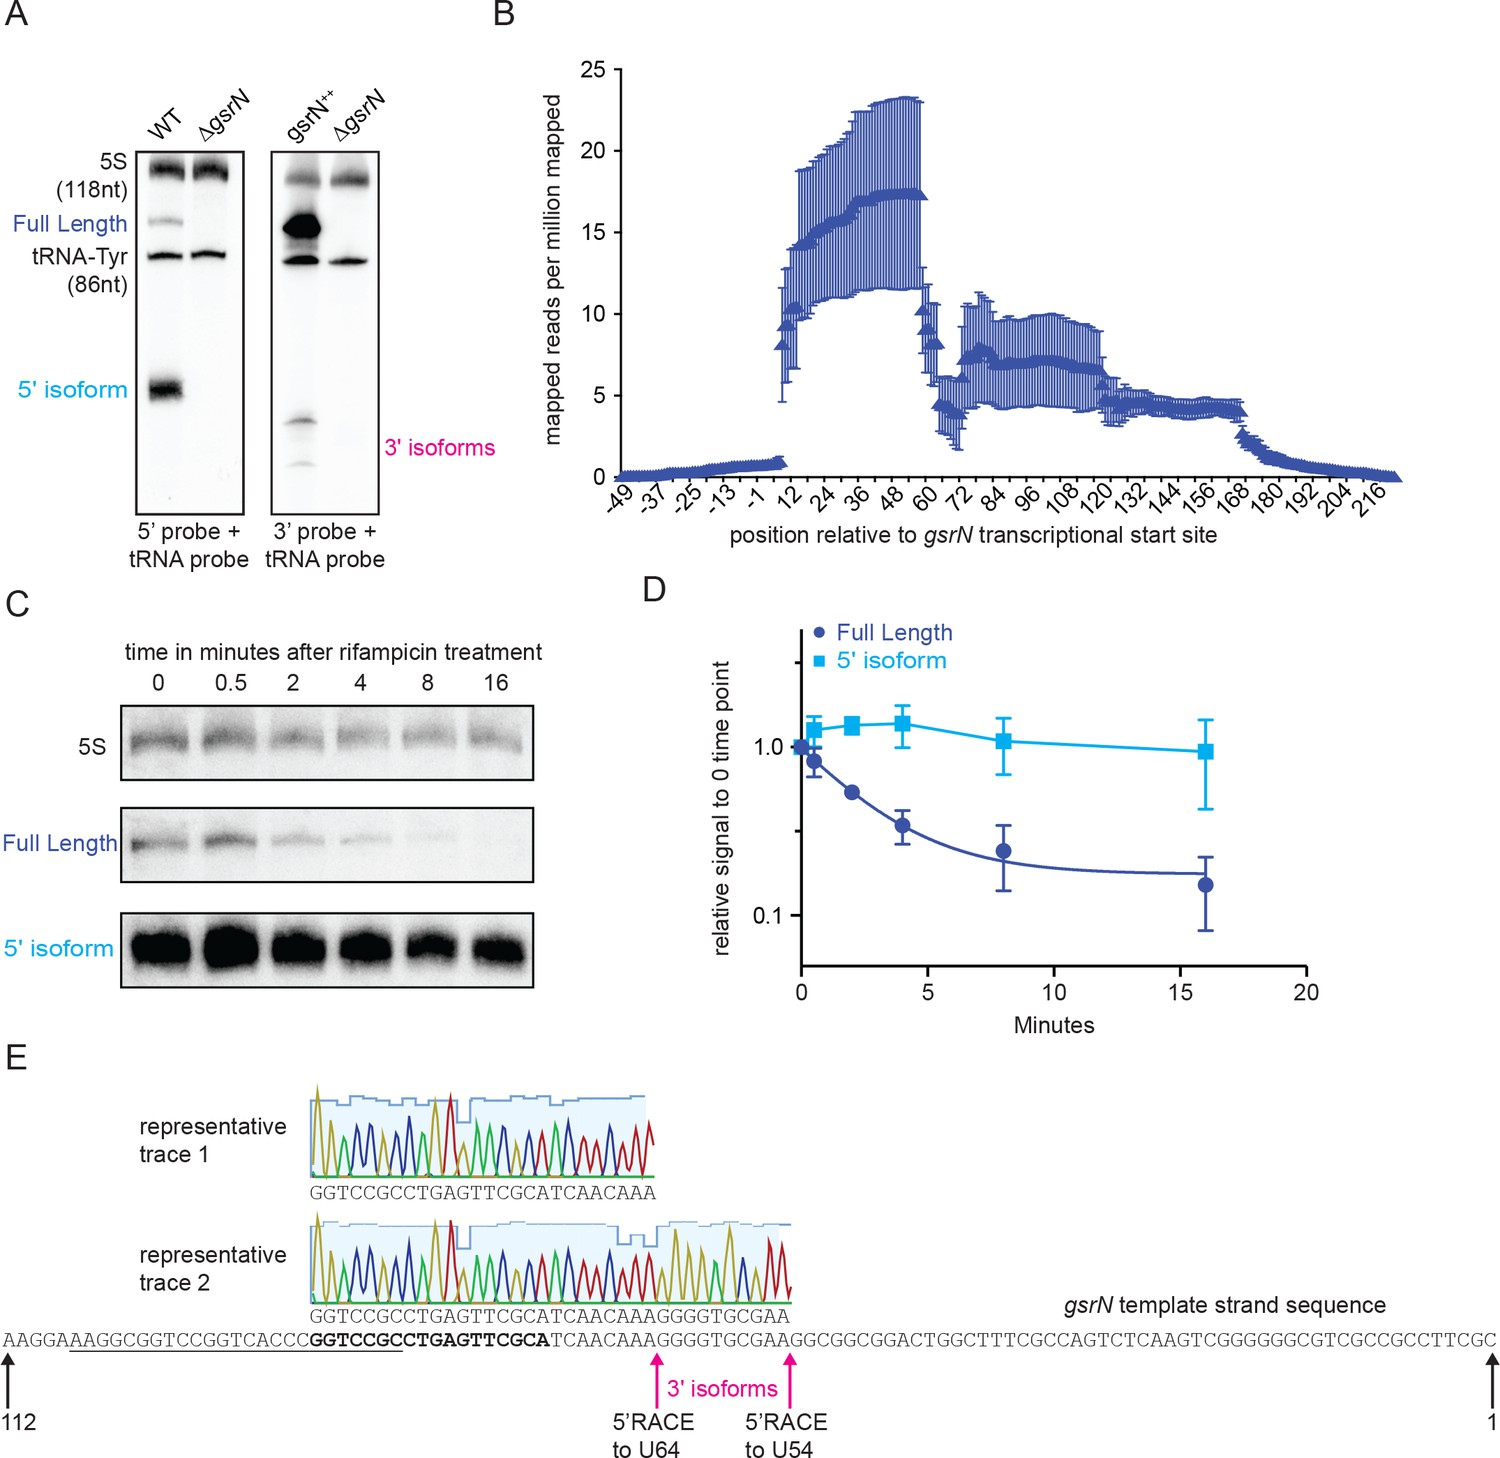
The 5’ isoform of GsrN arises from endonucleolytic processing and is the most abundant form of GsrN.
(A) Northern blots of total RNA from cultures (OD660 ≈ 1.0, a condition in which GsrN levels were observed to be the highest) of wild type, ΔgsrN, and gsrN++. Blots were probed with 32P-labeled oligonucleotides complementary to either the 5’ or 3’ end of GsrN. Probes to 5S rRNA and tRNA-Tyr were used to estimate the size of full-length GsrN and its 5’ and 3’ isoforms. (B) RNA-seq read density from total wild-type RNA mapped to the gsrN locus. Chromosome position (x-axis) is marked in reference to the annotated transcriptional start site (TSS) of gsrN (position 3,830,130 in GenBank accession CP001340). Reads per million reads mapped is plotted as a function of nucleotide position. Mean ±SD from three independent biological replicates samples is plotted (GEO: GSR106168, read files: GSM2830946, GSM2830947, and GSM2830948). (C) Northern blot of total RNA extracted from wild type Caulobacter cells in exponential phase (OD660 ≈ 0.2–0.25) 0 to 16 min after treatment with 10 μg/mL rifampicin (final concentration). Bands for full-length GsrN, 5’ GsrN isoform, and 5S RNA loading control are shown. (D) Quantification of blots from (C) of full-length GsrN and 5’ GsrN isoform normalized to 5S rRNA levels in each lane. Signal at each time point is normalized relative to the zero minute time point. Data represent mean ±SD from three independent biological replicates. (E) Sanger sequencing of cloned 5’RACE (Rapid amplification of cDNA ends) products amplified from total RNA from gsrN++ cultures grown into stationary phase. Chromatographic traces 1 and 2 represent sequences of clones obtained with and without TAP treatment. The gsrN template strand sequence is shown., The underlined sequence denotes the primer used for 1 strand cDNA synthesis and the bold sequence denotes the nested primer used for 2nd strand PCR amplification. The 2nd strand amplification PCR primer was also used for primer extension in Figure 3. Chromatographic traces are colored by nucleotide with the height of the signal proportional to an intensity score (visualized in Geneious 11.0.2 scale set to 40) and the light blue background indicates the quality score. Positions of the gsrN termini are indicated with black arrows. Positions of the pink arrows correspond to the 5’end of the 3’isoforms observed in Figure 3—figure supplement 1A.
Figure 3—figure supplement 2
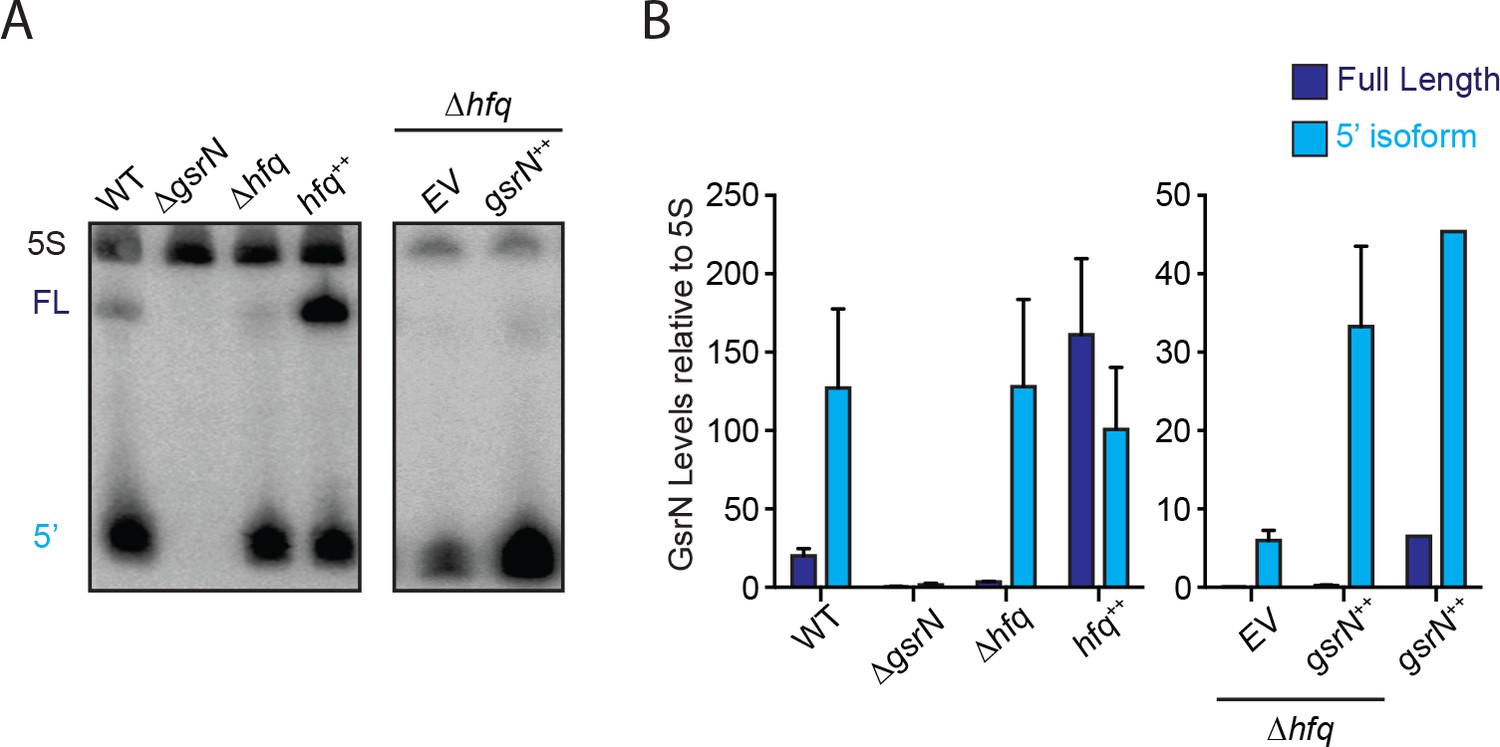
Hfq stabilizes full-length GsrN.
(A) Northern blots of total RNA from wild type, ΔgsrN, Δhfq, hfq++, and Δhfq + gsrN ++ cultures (OD660 ≈ 0.2, since Δhfq and hfq++ have growth defects and cannot be grown to high densities [Irnov et al., 2017]). Blots were probed simultaneously with 32P-labeled oligonucleotides complementary to the 5’ end of GsrN and to 5S rRNA as a loading control. (B) Blots were quantified by densitometry. GsrN signal from the full-length (FL; dark blue) and 5’ isoform (5’; cyan) are normalized to 5S rRNA in each lane and multiplied by 100. Bars represent mean ±SD of triplicate extractions, each representing biologically independent samples.
Figure 4
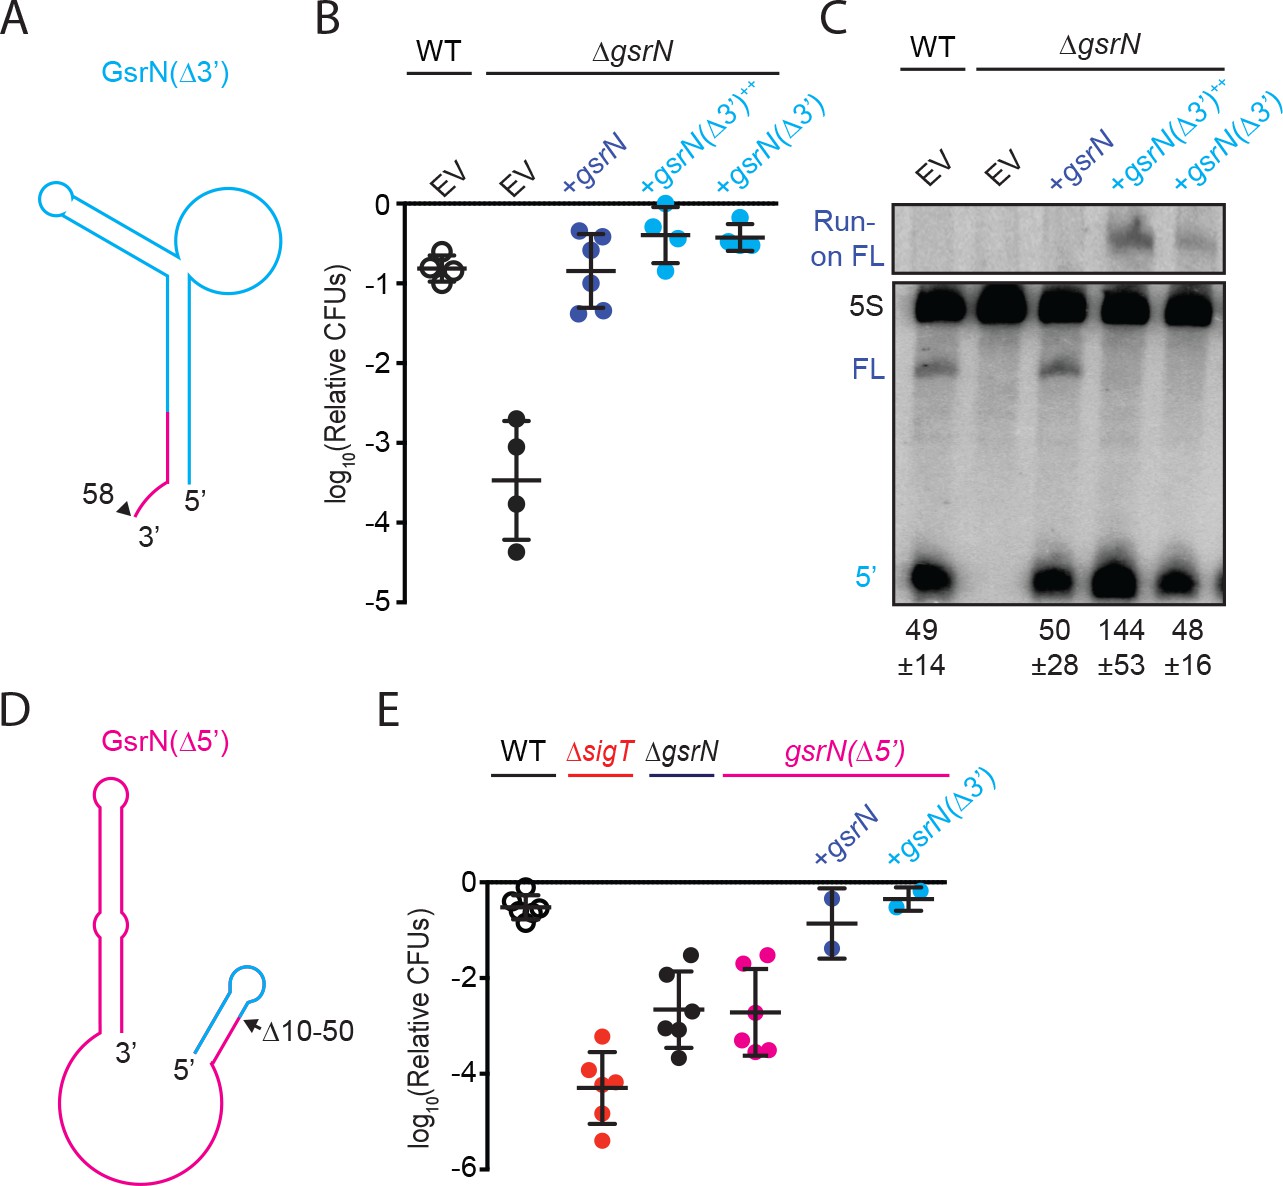
5’ end of GsrN is necessary and sufficient for peroxide survival.
(A) Schematic diagram of GsrN(Δ3’), which lacks nucleotides 59–106, which includes the intrinsic terminator. Nucleotide positions are highlighted in Figure 3B. (B) Relative survival of strains treated with 0.2 mM hydrogen peroxide for 1 hr. WT and ΔgsrN strains carry empty intergrated plasmids (EV) or integrated plasmids harboring full-length gsrN, gsrN(Δ3’), or multiple copies of gsrN(Δ3’) (labeled gsrN(Δ3’)++). Bars represent mean ±SD from four independent experiments (points). (C) Northern blot of total RNA from strains in panel 3B harvested during exponential growth phase. Blots were hybridized with probes complementary to the 5’ end of GsrN and 5S rRNA. Mean ±SD of total GsrN signal from three independent samples. (D) Schematic diagram of GsrN(Δ5’), which lacks nucleotides 10–50, but contains the intrinsic terminator of GsrN (the terminal 3’ hairpin). Nucleotide positions are highlighted in Figure 3B. (E) Relative survival of strains treated with 0.2 mM hydrogen peroxide for 1 hr. Genetic backgrounds are indicated above the line; the GsrN(Δ5’) strain was complemented with either gsrN (dark blue) or GsrN(Δ5’) (cyan). Bars represent mean ±SD from at least two independent experiments (points).
Figure 5 with 1 supplement
GsrN co-purifies with multiple RNAs, including catalase/peroxidase katG mRNA.
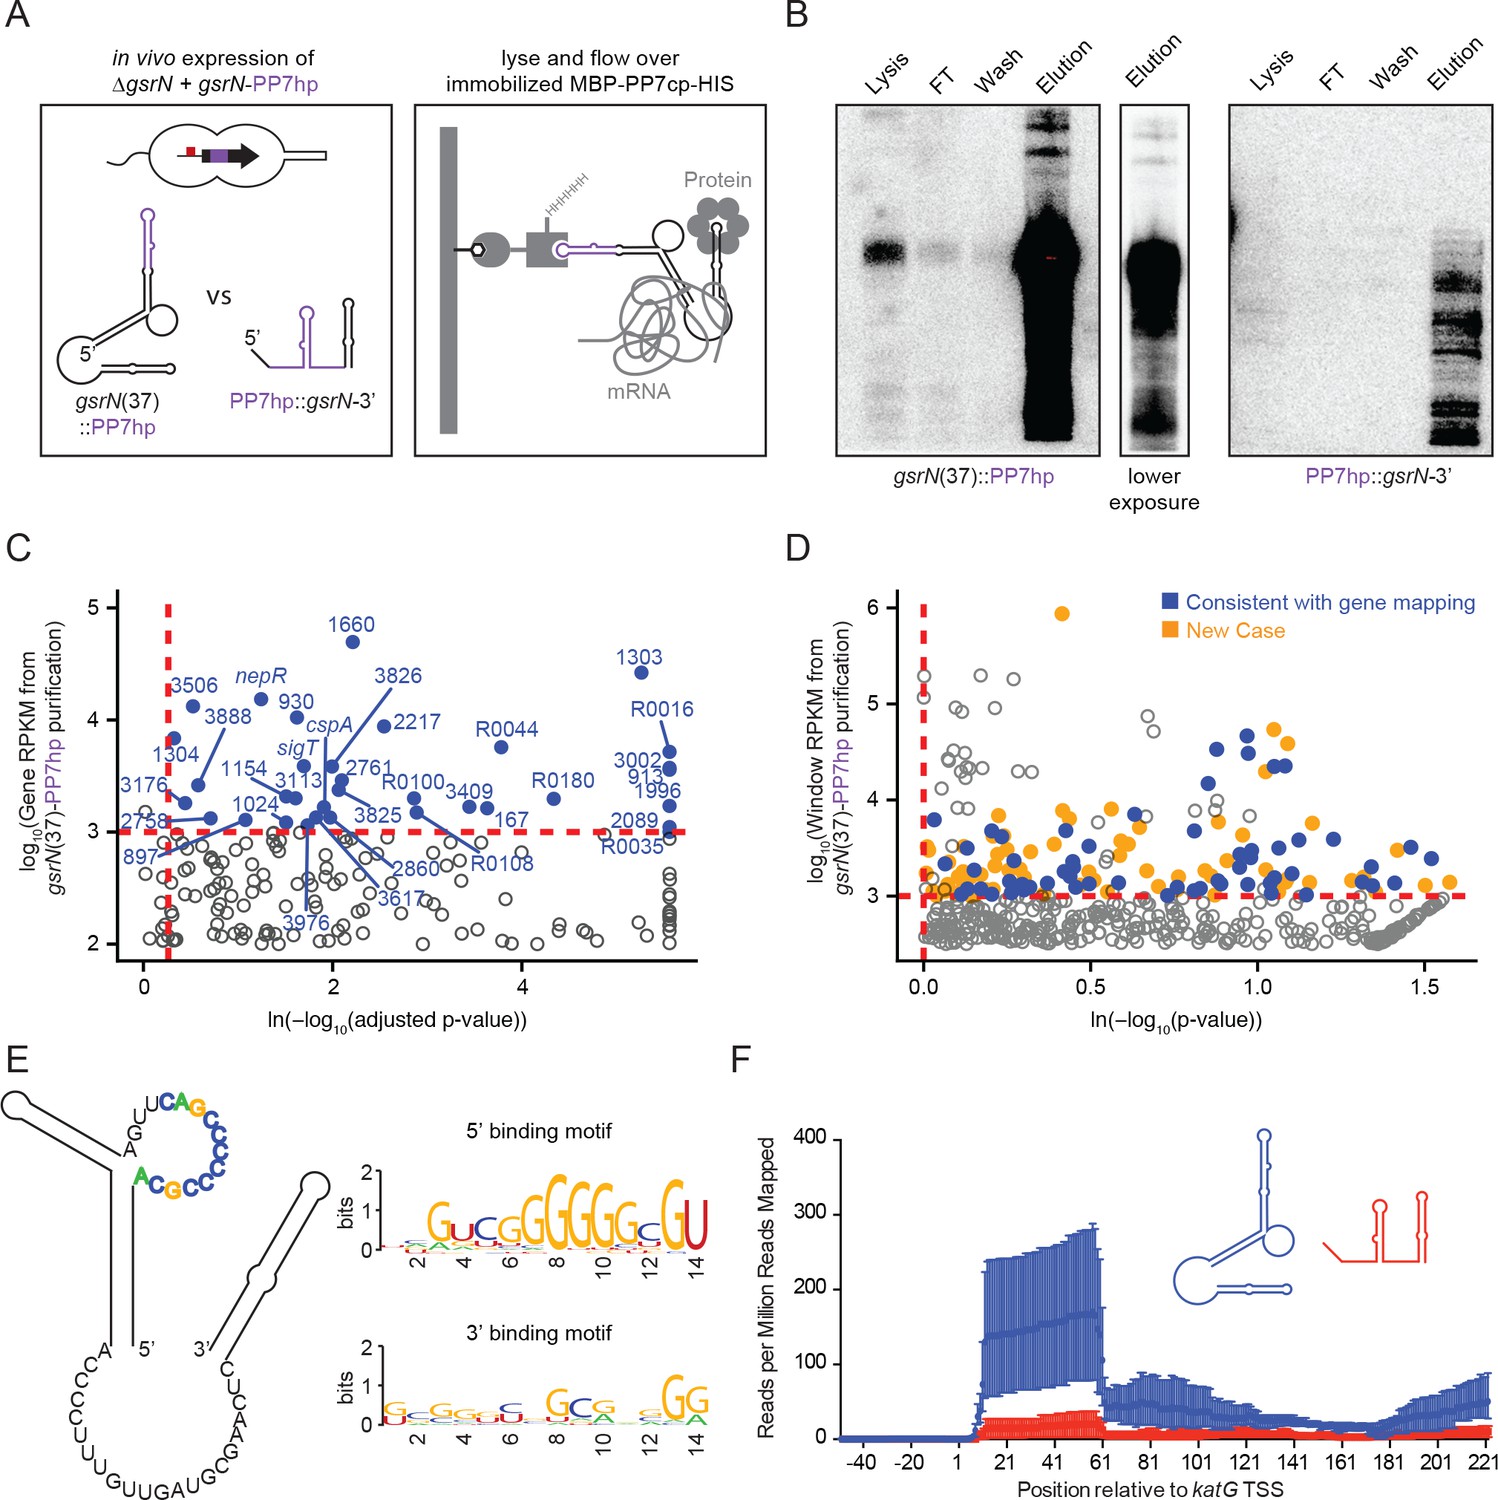
(A) GsrN-target co-purification strategy. GsrN(black)-PP7hp(purple) fusions were expressed in a ΔgsrN background. PP7 RNA hairpin (PP7hp) inserted at nucleotide 37 (gsrN(37)::PP7hp) was used as the bait. PP7hp fused to the 3’ hairpin of gsrN (PP7hp::gsrN-3’)served as a negative control. Stationary phase cultures expressing these constructs were lysed and immediately flowed over an amylose resin column containing immobilized PP7hp binding protein (MBP-PP7cp-His). (B) GsrN-PP7hp purification from strains bearing gsrN(37)::PP7hp (left) and PP7hp::gsrN-3’ (right) was monitored by Northern Blot with probes complementary to 5’ end of GsrN and PP7hp, respectively. Lysate, flow through (FT), buffer wash, and elution fractions are blotted. Approximately 1 µg RNA was loaded per lane, except for buffer wash (insufficient amount of total RNA). (C) Annotation-based analysis of transcripts that co-purify with gsrN(37)::PP7hp (Figure 5—source data 1). Log10 reads per kilobase per million reads (RPKM) is plotted against the ln(-log10(false discovery rate corrected p-value)). Dashed red lines mark the enrichment co-purification thresholds. Genes enriched in the gsrN(37)::PP7hp purification compared to PP7hp::gsrN-3’ are blue; labels correspond to gene names or C. crescentus strain NA1000 CCNA GenBank locus ID. Data represent triplicate purifications of gsrN(37)::PP7hp and duplicate PP7hp::3’GsrN control purifications. Log adjusted p-values of zero are plotted as 10−260. (D) Sliding-window analysis of transcripts that co-purify with gsrN(37)::PP7hp (Figure 5—source data 2). Points represent 25 bp genome windows. RPKM values for each window were estimated by EDGE-pro; p-values were estimated by DESeq. Windows that map to genes identified in (C) are blue. Orange indicates windows with significant and highly abundant differences in mapped reads between gsrN(37)::PP7hp fractions and the PP7hp::gsrN-3’ negative control fractions. Dashed red lines denote cut-off value for windows enriched in the gsrN(37)::PP7hp fractions. Grey points within the dashed red lines are signal that mapped to rRNA. (E) Predicted loops in GsrN accessible for mRNA target base pairing are emphasized in colored texts. A putative mRNA target site complementary to a cytosine-rich tract in the 5’ GsrN loop is represented as a sequence logo. Similar logo was generated for the target site sequences complementary to the 2nd exposed region in the 3’ end of GsrN. Logo was generated from IntaRNA 2.0.2 predicted GsrN-binding sites in transcripts enriched in the gsrN(37)::PP7hp pull-down. 5’ binding motif is present in 32 of the transcripts identified in (C) and (D) and 3’ binding motif is present in 27 of the transcripts identified in (C) and (D). (F) Density of reads mapping to katG that co-purified with gsrN(37)::PP7hp (blue) and PP7hp::gsrN-3’ (red). Read density in each dataset represents read coverage at each nucleotide divided by the number of million reads mapped in that data set. Data represent mean ±SD of three replicate gsrN(37)::PP7hp and two replicate PP7hp::gsrN-3’ purifications.
-
Figure 5—source data 1
Excel file of the output from Rockhopper analysis (Tjaden, 2015) on the RNA-Seq samples from the PP7 affinity purified total RNA samples.
Figure 5C can be created using the python and R scripts in https://github.com/mtien/Sliding_window_analysis.
- https://doi.org/10.7554/eLife.33684.015
-
Figure 5—source data 2
Zipped file contain three files.
These files include the sliding window analysis files generated from mapping the reads from the RNA-Seq experiment of the PP7 affinity purified total RNA samples. Figure 5D can be created using the scripts in https://github.com/mtien/Sliding_window_analysis.
- https://doi.org/10.7554/eLife.33684.016
-
Figure 5—source data 3
FASTA file that contains the windows of enrichment and total gene sequences of genes identified in the PP7 affinity purified total RNA samples.
- https://doi.org/10.7554/eLife.33684.017
Figure 5—figure supplement 1
Identification, purification and biochemical characterization of GsrN-PP7hp chimeras.
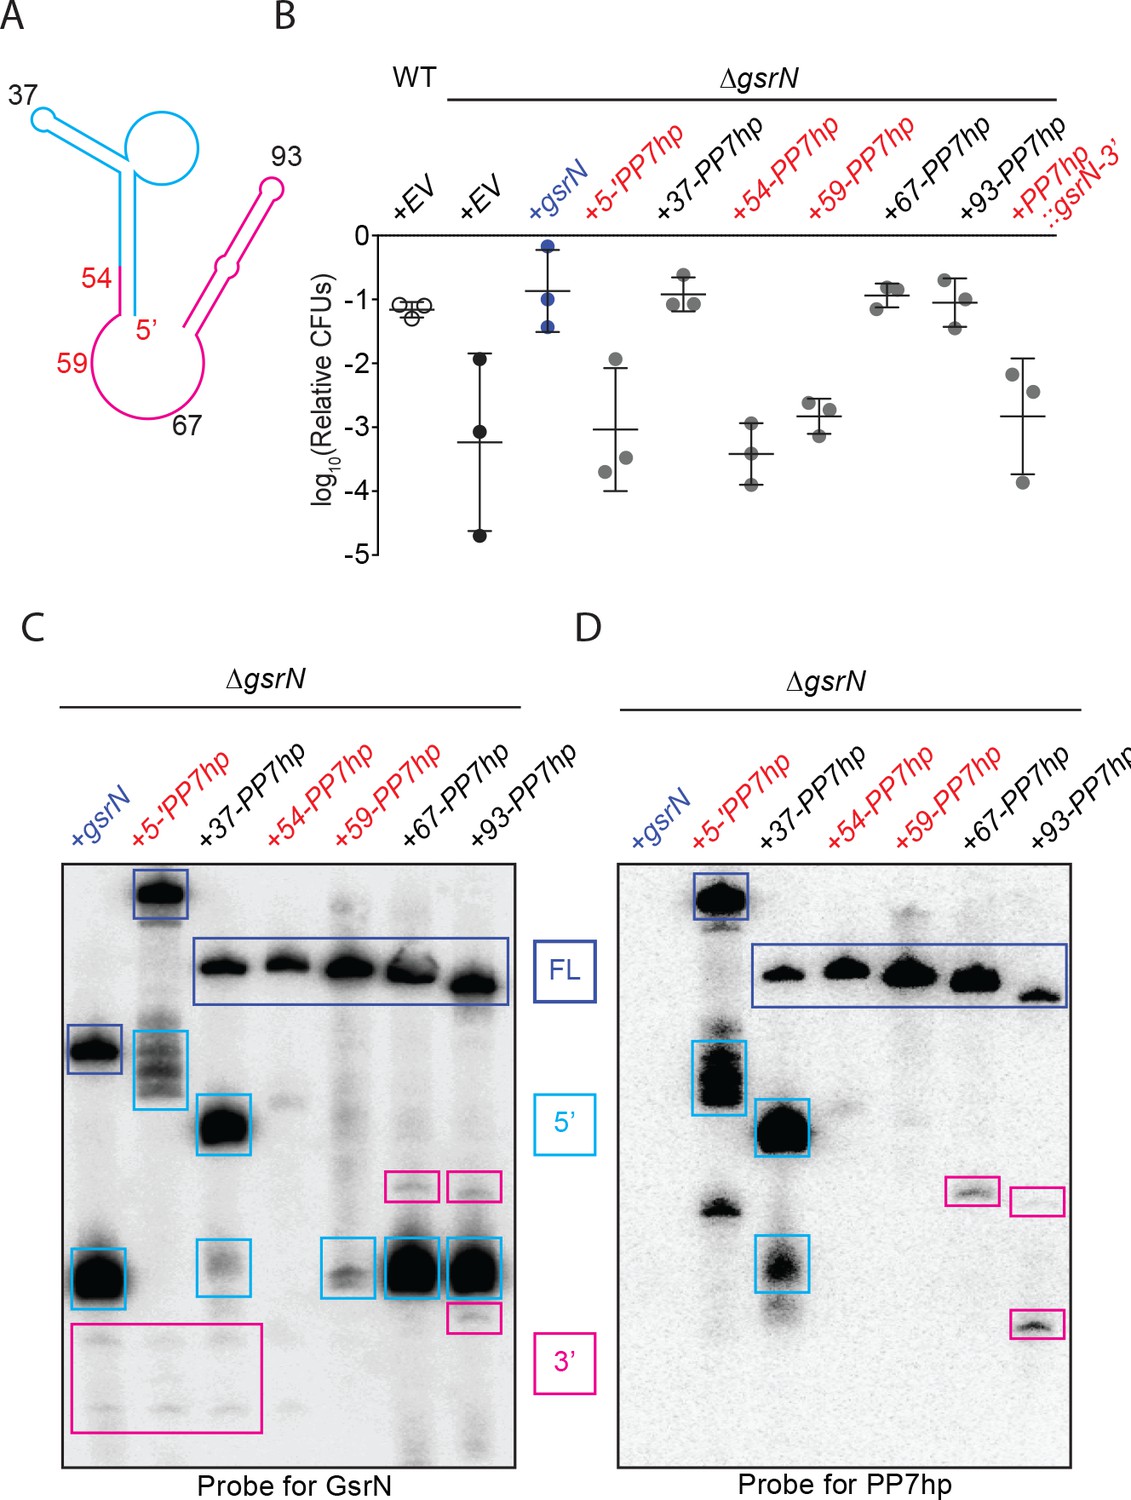
(A) Predicted GsrN secondary structure diagram from mFold (Zuker, 2003). Cyan and pink represent the 5’ and 3’ products, respectively, determined by primer extension and northern blot analyses (Figure 3). Numbered positions along the secondary structure indicate where PP7 RNA hairpin sequences (PP7hp) were inserted into gsrN.. (B) Wild type, ΔgsrN-EV, and ΔgsrN +gsrN-PP7hp strains were subjected to hydrogen peroxide, diluted, and titered as in Figure 1—figure supplement 2B. Empty vector (EV) strains carry the integrating plasmid pMT552. The nucleotide position of each PP7hp insertion in gsrN is marked above each bar. Data represent mean ±SD of three independent trials. (C) Northern blot of total RNA from stationary phase cultures (OD660 ≈ 1.0, a condition in which GsrN levels were observed to be the highest) of ΔgsrN strains carrying gsrN-PP7hp fusions. The blot was probed with oligonucleotides complementary to the 5’ and to the 3’ ends of GsrN. Blot is overexposed to reveal minor products. Dark blue boxes mark full length GsrN, cyan boxes mark 5’ isoforms, and pink boxes mark 3’ isoforms. (D) Northern blot of same samples as in (C) run in parallel and probed with oligonucleotides complementary to the PP7 hairpin sequence.
Figure 6 with 3 supplements

GsrN base pairs with the 5’ leader of katG mRNA and enhances KatG expression.
(A) Predicted interaction between GsrN (blue) and katG mRNA (green), with base-pairing shown in dashed box. Wild-type (WT) and reverse-swapped (RS) mutation combinations of the underlined bases are outlined below. (B) Translation from katG and katG-RS reporters in ΔgsrN strains expressing 3gsrN (WT) or 3gsrN(RS) (RS). Measurements were taken from exponential phase cultures. Bars represent mean ±SD of at least two independent cultures (points). ** p-value<0.01 estimated by Student’s t-test. (C) Relative hydrogen peroxide survival of RS strains. ΔgsrN strains expressing 3gsrN or 3gsrN(RS) and encoding katG or katG(RS) alleles. Bars represent mean ±SD from three independent experiments (points). (D) Northern blot of total RNA from strains in (C) collected in exponential phase hybridized with probes complementary to 5’ end of GsrN and 5S rRNA. Quantification is mean ±SD normalized signal from three independent experiments. **** p-value<0.0001 estimated by Student’s t-test.
Figure 6—figure supplement 1
gsrN does not regulate katG transcription, but does enhance katG-lacZ mRNA translation.
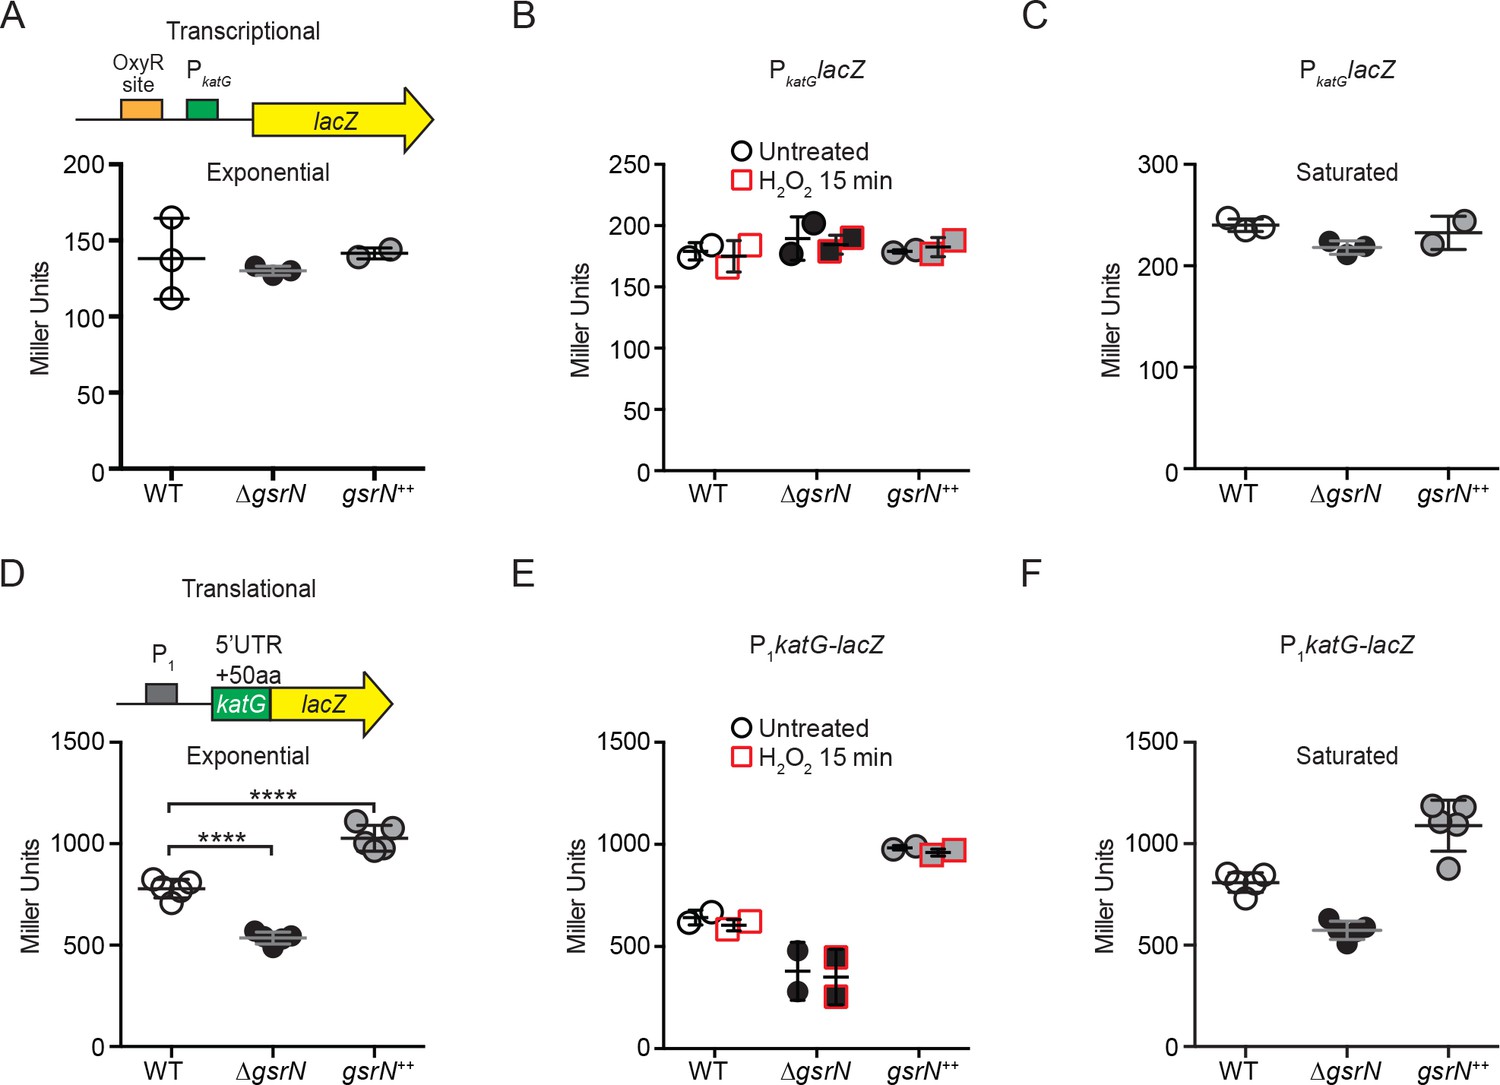
(A) katG transcriptional reporter construct contains the entire intergenic region upstream of katG fused to lacZ in pRKlac290. Transcription from this katG promoter (PkatG) reporter was assayed in wild type, ΔgsrN, and gsrN++ backgrounds during exponential growth (OD660 ≈ 0.2–0.25). Data represent mean ±SD of three independent trials. (B) Activity from the katG transcriptional reporter with and without a 15 min treatment with 0.2 mM hydrogen peroxide. These conditions were chosen to evaluate peroxide effects without ablating the ΔgsrN cultures. Cells were grown as in (A). Data represent mean ±SD of two independent trials. (C) Activity from the katG transcriptional reporter in stationary phase cultures (OD660 ≈ 1.0, a condition in which OxyR activates transcription [Italiani et al., 2011]). Data represent mean ±SD of three independent trials. (D) KatG translational reporter (top) assayed in exponentially growing cells (bottom). Reporter is constitutively expressed from the PrpoD1 promoter. katG leader (1–191 nt) region and the first 50 katG codons are fused in-frame to lacZ. Mean ±SD β-galactosidase activity, measured in Miller Units, presented from five independent trials. (E) Activity from the katG translational reporter was assayed in wild type, ΔgsrN, and gsrN++ with and without a 15 min treatment with 0.2 mM hydrogen peroxide as in (B). Cells were grown as in (A). Data represents mean ±SD from two independent trials. (F) Translation from katG leader fusion reporter was assayed in stationary phase cultures (OD660 ≈ 1.0). Data represents mean ±SD from five independent trials.
Figure 6—figure supplement 2

katG(RS)-lacZ translation is not affected by gsrN.
katG does not affect gsrN transcription. katG is necessary and sufficient for peroxide stress survival. (A) Translational reporter activity from katG and katG(RS) leader fusions. The katG(RS)-lacZ construct is identical to that in (Figure 6—figure supplement 1D–F), except that it contains the reverse swapped target recognition site in the 5’ UTR upstream of katG. The predicted GsrN binding site in the katG leader is shown in green text. The swapped (RS) sites are bold. Activity from katG(RS)-lacZ in wild type, ΔgsrN, and gsrN++ compared to katG-lacZ in ΔgsrN during exponential growth phase. Bars represent mean ±SD from three independent cultures. (B) Activity from the gsrN transcriptional reporter described in Figure 1—figure supplement 2A–B was assayed in ΔkatG and katG-RS backgrounds during exponential growth. Mean ±SD of 3 independent cultures. (C) Wild type, ΔgsrN, gsrN++, ΔgsrN +katG++(PxylkatG), ΔkatG, katG++(PxylkatG), and ΔkatG+gsrN++(4gsrN) strains were subjected to hydrogen peroxide, diluted, and titered as in in Figure 1—figure supplement 2B Bars represent mean ±SD of at least three independent cultures.
Figure 6—figure supplement 3

gsrN levels are determined by the sequence of its target recognition loop and gsrN(RS) allele cannot complement the peroxide susceptibility of ΔgsrN.
(A) Predicted GsrN secondary structure diagram from Figure 3 with a black box is highlighting the nucleotides within the exposed 5’ loop of GsrN. Nucleotide sequences correspond to the bases in the exposed 5’ loop for wild-type and the reverse swapped (RS) allele. The underlined nucleotides emphasize the location of the RS mutations with the RS sequence in bold. (B) Wild type, ΔgsrN, ΔgsrN complementation strains strains were subjected to hydrogen peroxide, diluted, and titered as in Figure 1—figure supplement 2B. Complementation strains include wild-type gsrN and reverse-swapped gsrN(RS) mutants. Strains with three different copy numbers of gsrN(RS) loci were tested. Bars represent mean ±SD of at least two independent cultures (points). (C) Northern blot of RNA extracted from wild type, ΔgsrN, and ΔgsrN complementation strains in (B) during exponential growth phase. Blots were probed with oligonucleotides complementary to the 5’ end of GsrN and to 5S rRNA. Quantified GsrN levels reported were normalized to the 5S rRNA signal in the same lane. Data represent mean ±SD from three independent biological replicates that were loaded, resolved, transferred, and hybridized on the same gel.
Figure 7
GsrN affects KatG and katG mRNA levels in vivo.
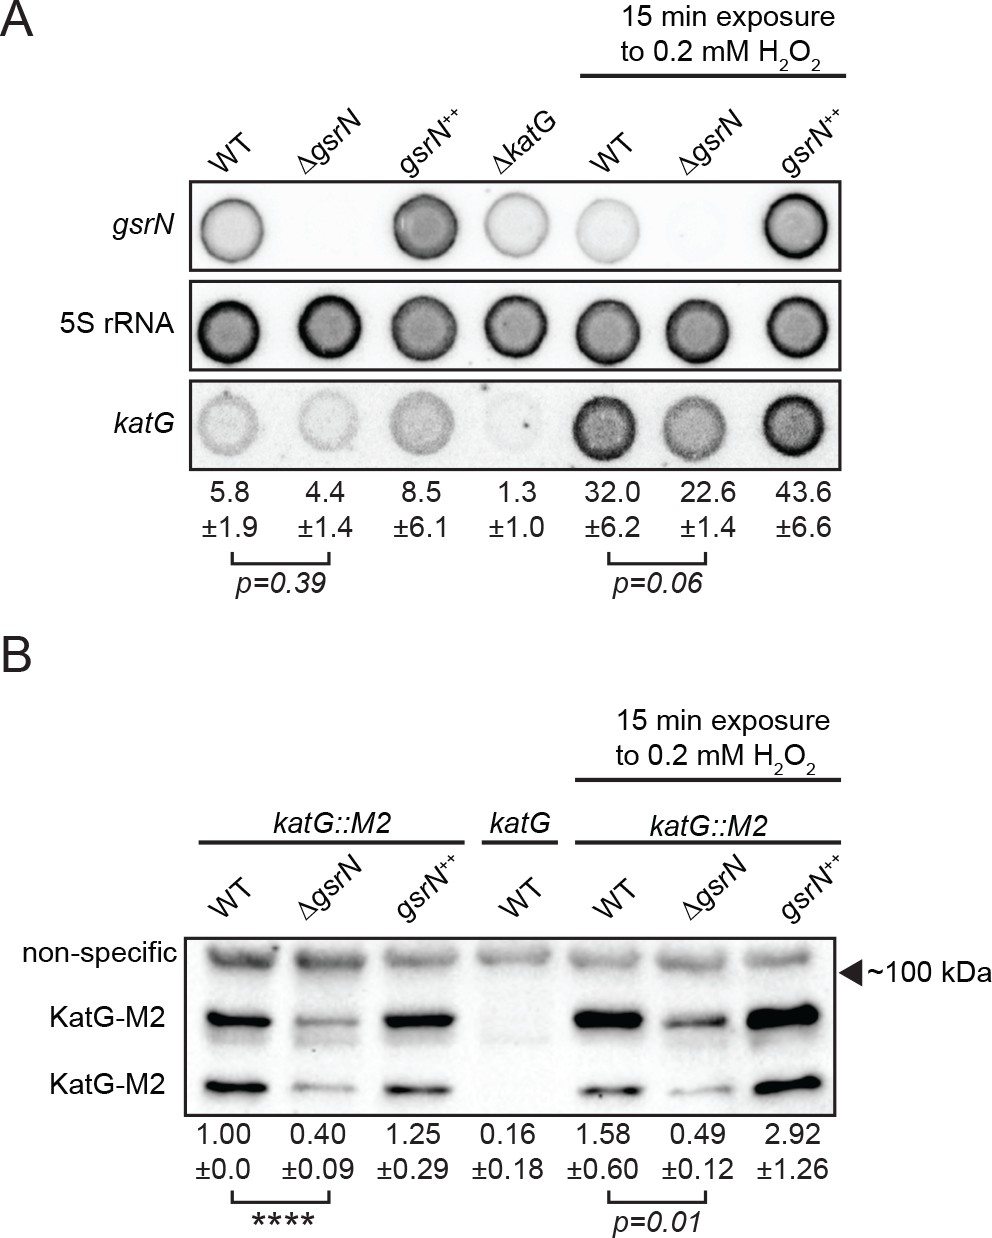
(A) Dot blot of total RNA of gsrN and katG mutants grown to early stationary phase (OD6600.85–0.9; this is the growth phase we used to initiate stress assays). Samples on right were treated with 0.2 mM hydrogen peroxide for 15 min before RNA extraction. These conditions were chosen to evaluate the effects of peroxide without ablating the ∆gsrN cultures. Blots were hybridized with katG mRNA, GsrN or 5S rRNA probes. katG mRNA signal normalized to 5S rRNA signal is quantified (mean ±SD, n = 3, p-value estimated with Student’s t-test). (B) Immunoblot of KatG-M2 fusion in wild type, ΔgsrN, and gsrN++ strains in the presence and absence of peroxide stress probed with α-FLAG antibody. KatG migrates as two bands as previously reported (Italiani et al., 2011). Normalized KatG-M2 signal (mean ±SD, n = 4, ****p<0.0001 Student’s t-test) is presented below each lane. Arrow indicates position of 100 kDa molecular weight marker.
Figure 8 with 2 supplements

GsrN is a global regulator of stress physiology.
(A) Transcriptomic and proteomic analysis of ΔgsrN and gsrN++ strains in early stationary phase (Figure 8—source data 1). Only genes detected in both analyses are plotted. Red indicates transcripts that co-purify with GsrN-PP7hp (Figure 5C,D). (B) katG transcript from ∆gsrN and gsrN++ cells quantified as reads per kilobase per million mapped (RPKM). Data represent mean ±SD of five independent samples. Significance was evaluated with the Wald test. (C) Label free quantification (LFQ) intensities of KatG peptides from ΔgsrN and gsrN++ cells (mean ±SD, n = 3; ****p<0.0001 Student’s t-test). (D) Hyperosmotic stress survival of wild type, ΔgsrN, gsrN++, and ΔkatG cells relative to untreated cells. Stress was a 5 hr treatment with 300 mM sucrose. These conditions were chosen to highlight the dynamic range between ΔgsrN susceptibility and gsrN++ protection. Data represent mean ± SD from two independent experiments (points). (E) Northern blot of total RNA from wild type, ΔgsrN, and gsrN++ cultures with or without 150 mM sucrose stress. Blots were hybridized with GsrN and 5S rRNA probes. Normalized mean ± SD of total GsrN signal from three independent samples is quantified.
-
Figure 8—source data 1
Excel file that contains the log2Fold calculated values from both LC-MS/MS and RNA-Seq analysis of ΔgsrN versus gsrN++.
Values used to calculate the fold changes from LC-MS/MS can be accessed from PRIDE: PXD008128, which contains the MaxQuant (Cox et al., 2014) LFQ protein group estimations under the name ‘MQrun_delta.txt’ and ‘MQrun_plus.txt’ representing the values for ΔgsrN versus gsrN++, respectively. Calculation of averages is outlined in Materials and methods- LC-MS/MS processing of total soluble protein. Averages were then divided and log-transformed. Values used to estimate the fold changes from RNA-Seq were taken from the CLC workbench analysis of the GEO accession number GSE106168 files, see Materials and methods- RNA-seq processing of total RNA.
- https://doi.org/10.7554/eLife.33684.027
-
Figure 8—source data 2
Excel file that contains the compiled information from the CLC workbench analysis.
- https://doi.org/10.7554/eLife.33684.028
-
Figure 8—source data 3
Excel file that contains the multiple t-test analysis outlined in Materials and methods- LC-MS/MS processing of total soluble protein.
- https://doi.org/10.7554/eLife.33684.029
Figure 8—figure supplement 1
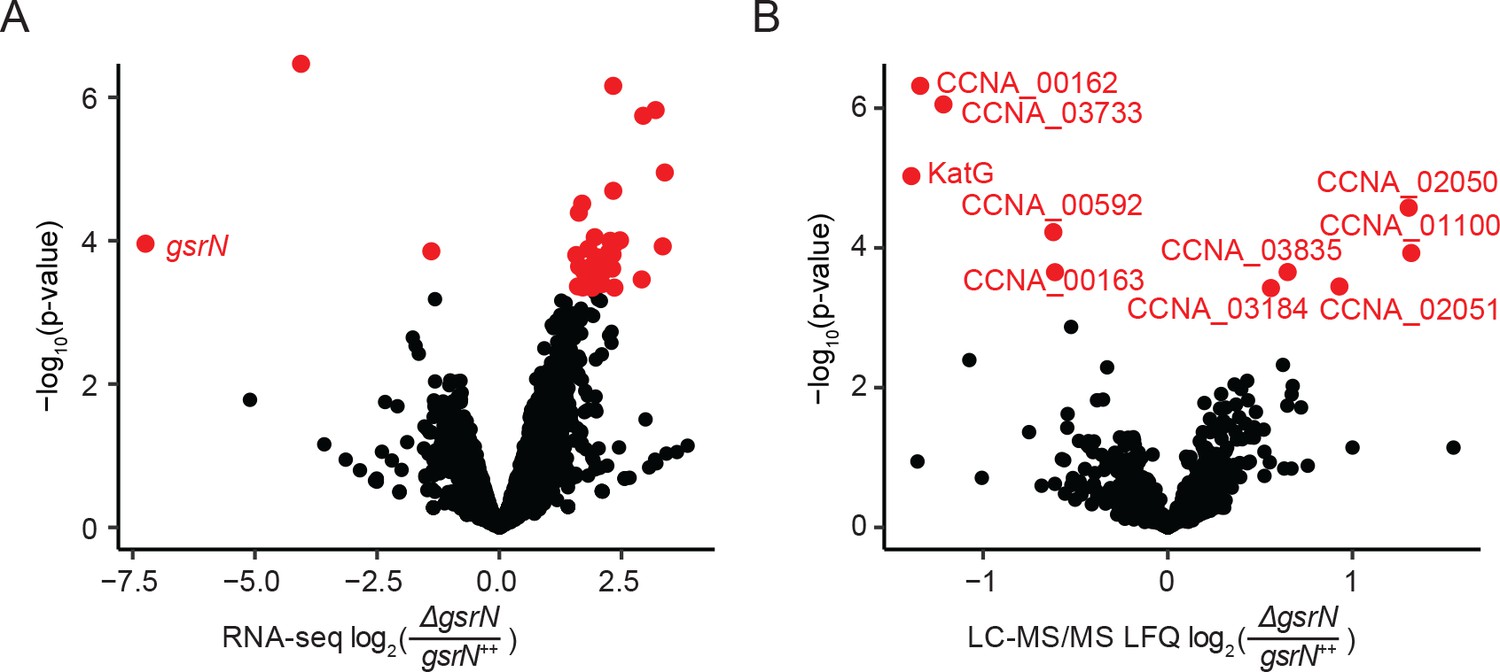
GsrN directly or indirectly affects the expression of multiple genes.
(A) RNA-seq analysis of ΔgsrN and gsrN++ early stationary phase cultures (OD660 ~0.85–0.90, the growth phase we used to initiate stress assays) represented as a volcano plot where expression changes are plotted as a function of p-value (Figure 8—source data 2). Red indicates transcripts with a false discovery rate (FDR) corrected p-value<0.05. Black indicates gene transcripts with a FDR p-value above the cut-off. (B) LC-MS/MS total soluble protein signal from MaxQuant label free quantitation estimates from ΔgsrN and gsrN++ cells grown to early stationary phase (OD660 ~0.85–0.90, the growth phase we used to initiate stress assays) (Figure 8—source data 3). Log-2 transformed fold change in LFQ estimates from MaxQuant (Cox et al., 2014) are plotted as a function of p-values obtained from the multiple t-test analyses using GraphPad Prism version 6.04 for MacOS, GraphPad Software, La Jolla, CA, www.graphpad.com. Red indicates proteins with significant differences (false discovery corrected p-value<0.05). Black represents proteins that do not meet the FDR cut-off.
Figure 8—figure supplement 2
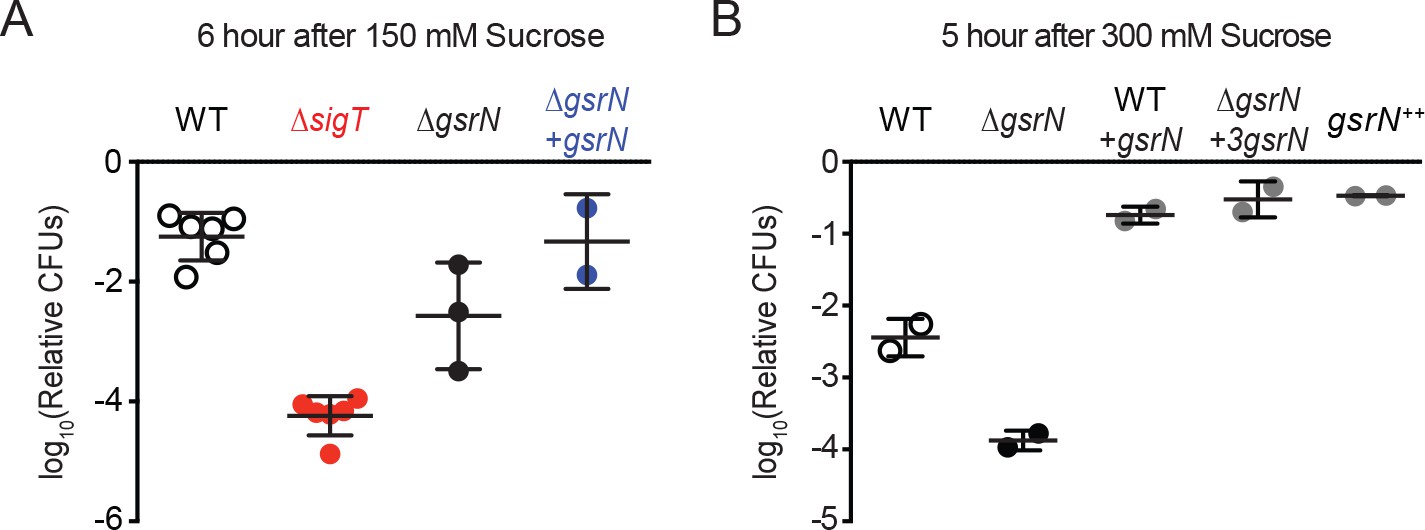
GsrN is required for osmotic stress survival.
(A) Relative CFUs of wild type, ΔsigT, ΔgsrN, and complementation strain (ΔgsrN +gsrN) treated with 150 mM sucrose for 6 hr. These conditions parallel previous osmotic stress studies (Alvarez-Martinez et al., 2007) and are used to characterize stress sensitive genotypes. Data are normalized as in Figure 2A. Data represent mean ±SD from at least two biolgical replicates (points). (B) Relative CFUs of wild type, ΔgsrN, and overexpression strains of gsrN treated with 300 mM sucrose for 5 hr. These conditions are used to characterize stress protective genotypes. Data represent mean ±SD from two independent experiments (points).
Figure 9
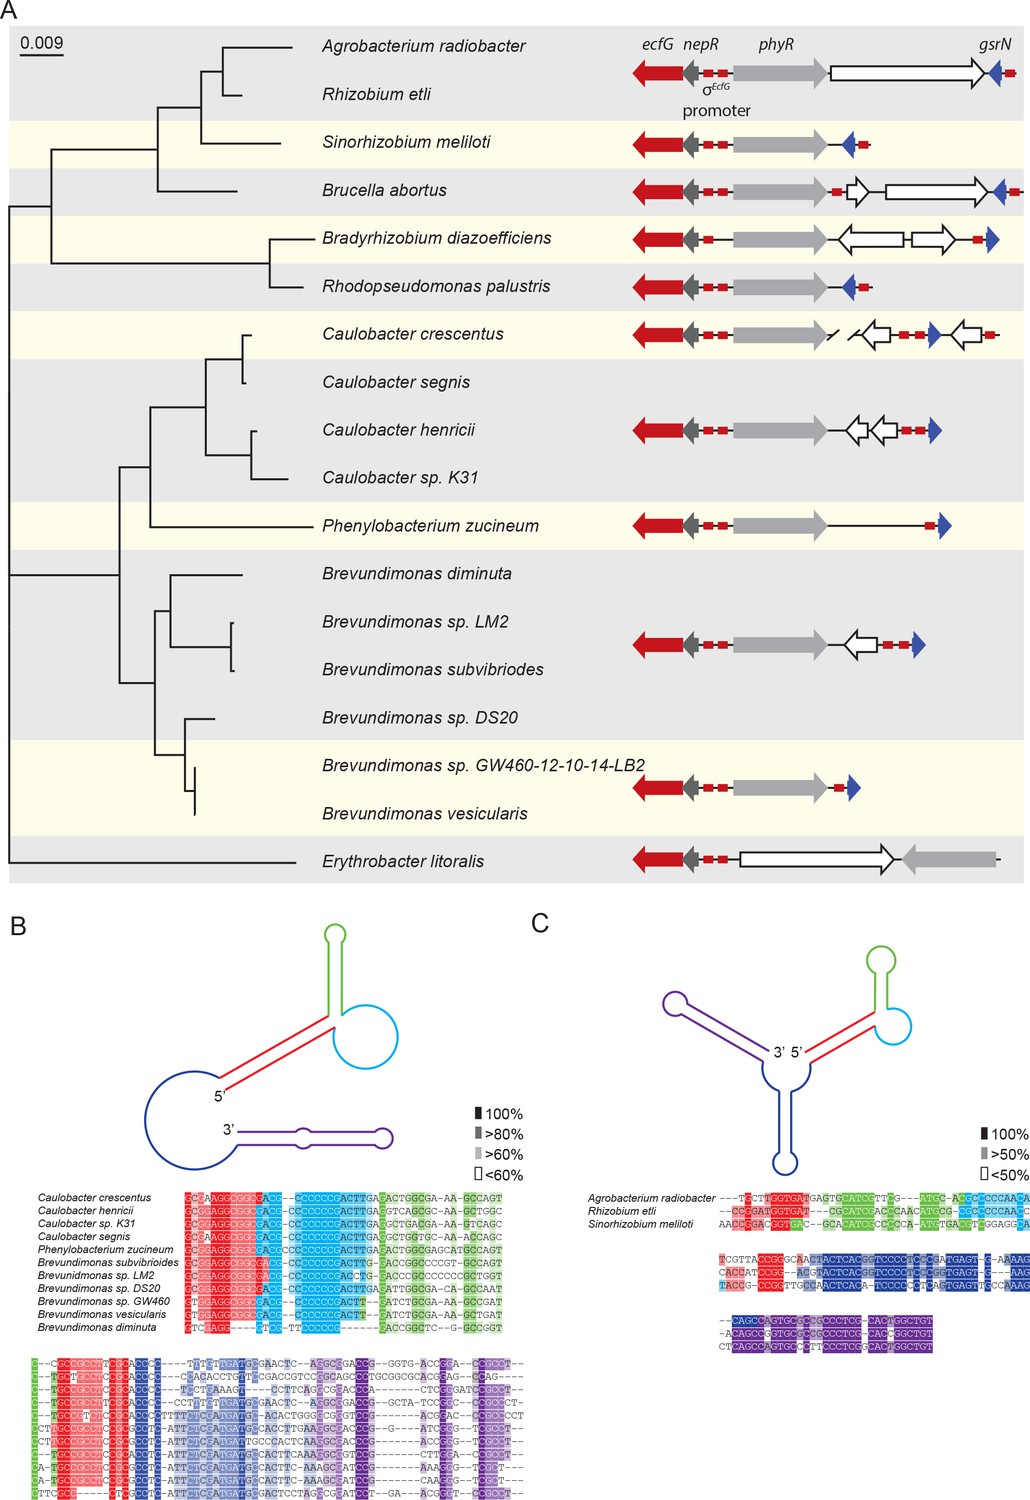
Conserved features of GsrN homologues.
(A) Locus diagrams showing predicted gsrN homologs in several Alphaproteobacteria. Tree was constructed from the 16 s rRNA sequences of each strain where Erythrobacter litoralis (for which there is no apparent gsrN-like gene) was the out-group. Red arrows represent ecfG, dark gray arrows represent nepR, light gray arrows represent phyR, and dark blue arrows represent gsrN (or its putative homologs). Red boxes represent the conserved σecfG-binding site. The prediction of GsrN orthologs in the Caulobacteraceae (Caulobacter, Brevundimonas, and Phenylobacterium) was based on a BLASTn search (Altschul et al., 1990). The prediction of GsrN in Rhizobium etli, Sinorhizobium meliloti, and Brucella abortus was based on evidence of GSR-dependent expression in published transcriptome data, proximity to the GSR locus, and identification of a σecfG-binding site upstream of the gene. The prediction of Agrobacterium radiobacter was based on a BLASTn search of using the predicted GsrN sequence from R. etli as the query (Altschul et al., 1990). The prediction of Rhodopseudomonas palustris and Bradyrhizobium diazoefficiens is solely based on the proximity to the GSR locus and the presence of an upstream σecfG-binding site. (B) Diagram of predicted secondary structure of GsrN in other Caulobacteraceae is colored by secondary structure element. Colors highlighted in the sequence alignment correspond to the predicted secondary structure regions in the cartoon. Density of shading corresponds to conservation at that position. (C) Diagram of predicted secondary structure of predicted GsrN homologs in select Rhizobiaceae where the 5’ portion contains an unpaired 5’ G-rich loop (cyan) flanked by a small hairpin (green) and a stem loop involving the 5’ terminus (red).
Figure 10
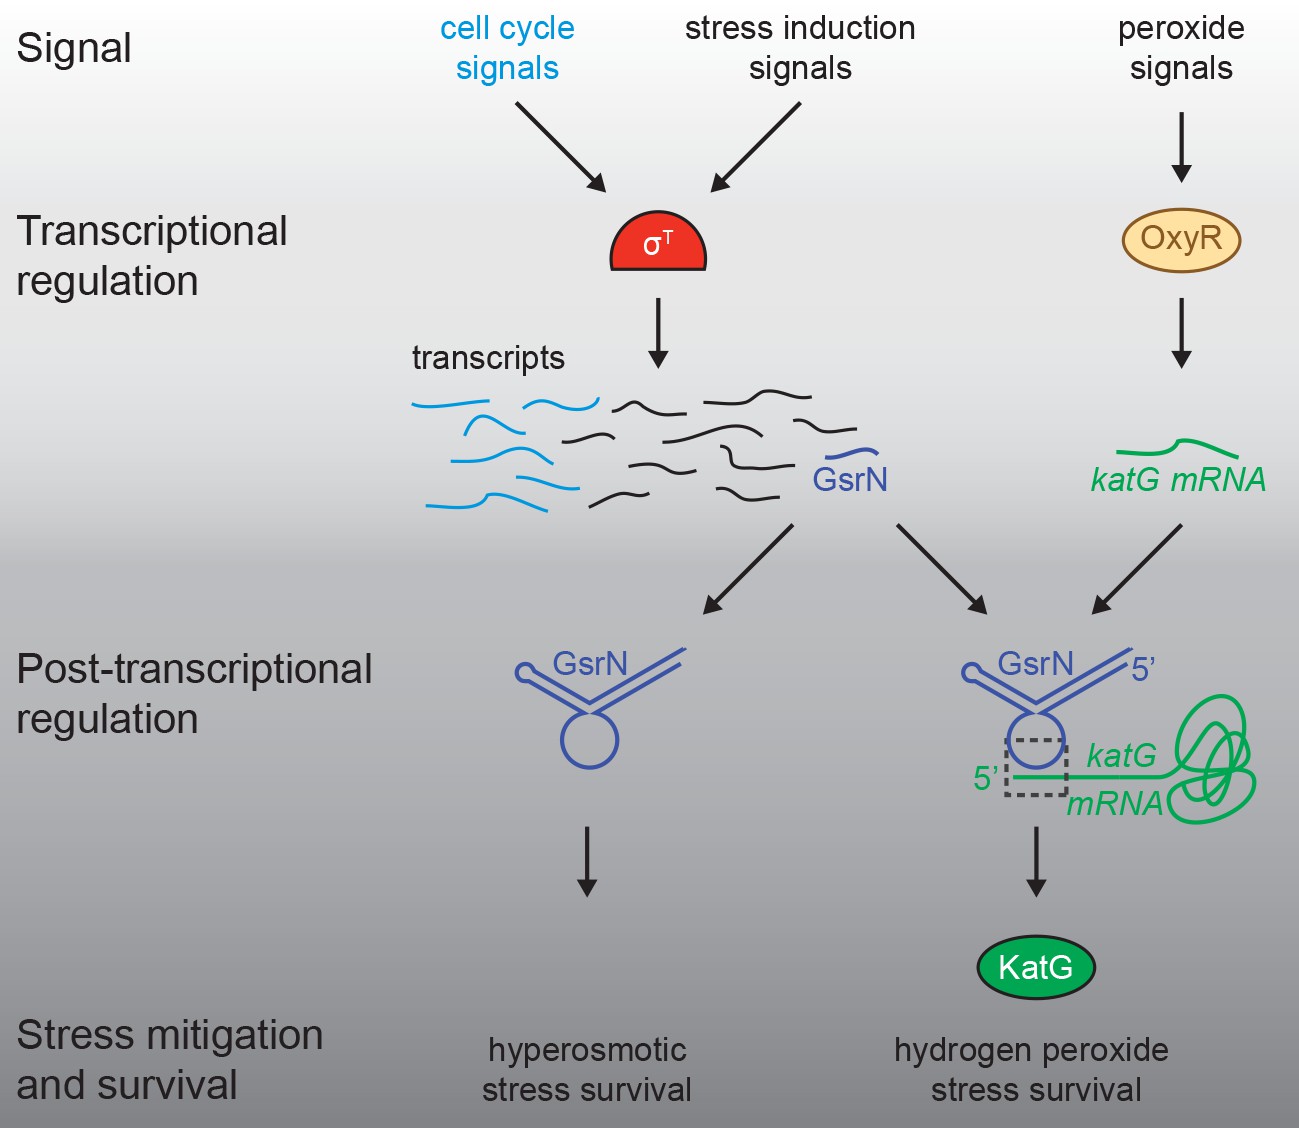
Regulatory architecture of the Caulobacter stress response systems.
Expression of the GSR EcfG-sigma factor, sigT (σT), and select genes in the GSR regulon is regulated as a function cell cycle phase. σT-dependent transcription can be induced by certain signals (e.g. hyperosmotic stress), but is unaffected by hydrogen peroxide. Transcription of the sRNA, GsrN, is activated by σT, and the cell cycle expression profile of gsrN is highly correlated with sigT and its upstream regulators. Transcription of the catalase/peroxidase katG is independent of σT. GsrN dependent activation of KatG protein expression is sufficient to rescue the peroxide survival defect of a ∆sigT null strain. GsrN convenes a post-transcriptional layer of gene regulation that confers resistance to peroxide and hyperosmotic stresses.
Tables
Table 1
RNAs that co-elute with GsrN-PP7hp.
https://doi.org/10.7554/eLife.33684.018| Gene locus ID | Gene name | log2 Fold | Identification method | Region(s) | Description | Interacting nucleotides |
|---|---|---|---|---|---|---|
| CCNA_00167 | - | 4.56, 6.95 | Rockhopper, Sliding window | 179311–180120 (+),179500–179550 (+, I, S) | metallophosphatase family protein | - |
| CCNA_00416 | - | 7.2 | Sliding window | 429625–429725 (-, I, S) | conserved hypothetical membrane protein | GGCGGAGGG |
| CCNA_00587 | - | 4.87 | Sliding window | 616250–616300 (+, I, S) | alpha/beta hydrolase family protein | UCGGCGGGGGGC |
| CCNA_00882 | - | 4.61 | Sliding window | 962875–962925 (-, U, S) | hypothetical protein | UCGGGGGGU |
| CCNA_00894 | - | 4.29 | Sliding window | 974800–974850 (+, I, S) | 1-hydroxy-2-methyl-2-(E)-butenyl 4-diphosphate synthase | UCAAGUCGGGGC |
| CCNA_00897 | - | 3.2 | Rockhopper | 976013–976177 (+) | hypothetical protein | - |
| CCNA_00913 | - | 7.64, 7.80 | Rockhopper, Sliding window | 993033–993209 (-), 993175–993225 (-, I, S) | hypothetical protein | UCAAGUU |
| CCNA_00930 | - | 3.72, 6.98, 3.81 | Rockhopper, Sliding window, Sliding window | 1006253–1006870 (+),1006275–1006425 (+, I, S),1006475–1006650 (+, I, S) | riboflavin synthase alpha chain | CGGGUCGGGGGUG |
| CCNA_01024 | - | 3.32 | Rockhopper | 1111617–1112111 (-) | hypothetical protein | CAGGCGGGGGG |
| CCNA_01058 | - | 5.81 | Sliding window | 1159075–1159125 (-, D, S) | helix-turn-helix transcriptional regulator | CGGGGGGU |
| CCNA_01154 | - | 3.45, 6.81 | Rockhopper, Sliding window | 1257902–1258591 (+), 1257975–1258025 (+, I, S) | conserved hypothetical protein | GGGGGCG |
| CCNA_01303 | - | 5.87, 5.30, 8.22 | Rockhopper, Sliding window, Sliding window | 1430061–1430900 (+),1430550–1430625 (+, I, S),1430650–1430725 (+, I, S) | conserved hypothetical protein | GGGUCGGGGG |
| CCNA_01304 | - | 2.9 | Rockhopper | 1431129–1431329 (+) | hypothetical protein | GGUUCGCGGACG |
| CCNA_01335 | - | 2.99 | Sliding window | 1448600–1448650 (-, I, S) | ABC-type multidrug transport system, ATPase component | UCGCGUCGA |
| CCNA_01344 | - | 4.62 | Sliding window | 1458550–1458725 (+, I, S) | conserved hypothetical protein | GUCGGGGGUG |
| CCNA_01584 | - | 3.14 | Sliding window | 1699675–1699725 (+, I, A) | multimodular transpeptidase-transglycosylase PBP 1A | GGGGGGC |
| CCNA_01660 | - | 4.41, 6.21 | Rockhopper, Sliding window | 1781219–1781911 (-), 1781350–1781575 (-, I, S) | conserved hypothetical protein | GGGGGCG |
| CCNA_01966 | - | 11.3 | Sliding window | 2110225–2110275 (-, I, A) | vitamin B12-dependent ribonucleotide reductase | GGUCGGGG |
| CCNA_01996 | - | 9.15, 8.86 | Rockhopper, Sliding window | 2142908–2143687 (-), 2143625–2143700 (-, I, S) | undecaprenyl pyrophosphate synthetase | CGGGGGGC |
| CCNA_02034 | - | 7.24 | Sliding window | 2178500–2178550 (+, I, S) | luciferase-like monooxygenase | UCGAUGGGGGGCG |
| CCNA_02064 | lpxC | 3.6 | Sliding window | 2215450–2215550 (-, I, S) | UDP-3-O-(3-hydroxymyristoyl) N-acetylglucosamine deacetylase | UCGGGGGCG |
| CCNA_02089 | - | 8.52 | Rockhopper | 2237967–2238341 (-) | hypothetical protein | UCAAGUCGGGG |
| CCNA_02217 | - | 4.02 | Rockhopper | 2364081–2364383 (-) | hypothetical protein | GCGCGACGAAGG |
| CCNA_02286 | - | 3.26 | Sliding window | 2435450–2435500 (-, I, S) | hypothetical protein | UCCGGUCGCCCGG |
| CCNA_02595 | - | 6.85 | Sliding window | 2743525–2743625 (-, U, S) | Zn finger TFIIB-family transcription factor | UCGCAUCGA |
| CCNA_02758 | - | 2.93 | Rockhopper | 2921763–2922152 (+) | hypothetical protein | UCGCGUC |
| CCNA_02761 | - | 3.65 | Rockhopper | 2923673–2923918 (+) | hypothetical protein | CGGAGGGG |
| CCNA_02846 | - | 5.44, 8.60 | Sliding window, Sliding window | 3000100–3000175 (-, I, S),2999225–2999275 (-, I, S) | DegP/HtrA-family serine protease | AAGUCGGGGGGCG |
| CCNA_02860 | - | 3.70, 4.78 | Rockhopper, Sliding window | 3012116–3013060 (-),3012500–3012550 (-, I, S) | DnaJ-class molecular chaperone | CGGCAAG |
| CCNA_02975 | - | 6.34 | Sliding window | 3130300–3130375 (-, I, A) | excinuclease ABC subunit C | GCGGGGG |
| CCNA_02987 | - | 7.26 | Sliding window | 3142700–3142800 (-, I, A) | hypothetical protein | GUCGGGGGGCGUC |
| CCNA_02997 | cspA | 3.61 | Rockhopper | 3152607–3152816 (-) | cold shock protein CspA | - |
| CCNA_03002 | - | 6.03, 4.48 | Rockhopper, Sliding window | 3155705–3156322 (-),3155750–3155800 (-, I, S) | CDP-diacylglycerol--glycerol-3-phosphate 3-phosphatidyltransferase | - |
| CCNA_03105 | - | 9.15 | Sliding window | 3255775–3255850 (-, I, S) | DnaJ domain protein | AAGUCGGGGGGUGU |
| CCNA_03113 | - | 3.50, 5.40 | Rockhopper, Sliding window | 3263780–3264499 (-),3264400–3264450 (-, I, S) | membrane-associated phospholipid phosphatase | UUGUAUCG |
| CCNA_03138 | katG | 3.35 | Sliding window | 3286000–3286050 (+, I, S) | peroxidase/catalase katG | GUCGGGG |
| CCNA_03176 | - | 2.83 | Rockhopper | 3335155–3335445 (-) | nucleotidyltransferase | GAGUUCGCG |
| CCNA_03338 | tolB | 5.27 | Sliding window | 3519425–3519475 (-, I, S) | TolB protein | UCGCGAGGG |
| CCNA_03409 | - | 4.46, 5.44 | Rockhopper, Sliding window | 3576740–3577696 (-),3577550–3577600 (-, I, S) | alpha/beta hydrolase family protein | GGUUUGUGAAGGG |
| CCNA_03506 | - | 3.27, 4.10 | Rockhopper, Sliding window | 3664090–3664677 (+),3664100–3664175 (+, I, S) | putative transcriptional regulator | GUUGGGGGG |
| CCNA_03589 | sigT | 3.58 | Rockhopper | 3743953–3744558 (-) | RNA polymerase EcfG family sigma factor sigT | - |
| CCNA_03590 | nepR | 3.43, 3.50 | Rockhopper, Sliding window | 3744561–3744746 (-), 3744675–3744725 (-, I, S) | anti-sigma factor NepR | GGGGGGCG |
| CCNA_03590,CCNA_03589 | nepR-sigT | 4.42 | Sliding window | 3744500–3744575 (-, O, S) | anti-sigma factor NepR, RNA polymerase EcfG family sigma factor sigT | GAGCGUCAACGA |
| CCNA_03617 | - | 3.5 | Rockhopper | 3772262–3772717 (+) | Copper(I)-binding protein | - |
| CCNA_03618,CCNA_03617 | -,- | 6.99 | Sliding window | 3772700–3772750 (+, O, S) | SCO1/SenC family protein, Copper(I)-binding protein | GUCGGGG |
| CCNA_03681 | - | 5.11 | Sliding window | 3843700–3843750 (-, U, S) | ABC transporter ATP-binding protein | UCAGUUGGGG |
| CCNA_03825 | - | 3.63 | Rockhopper | 3991412–3991774 (-) | hypothetical protein | GGGGGCGU |
| CCNA_03825,CCNA_03826 | -,- | 8.01 | Sliding window | 3991750–3991825 (-, O, S) | hypothetical protein, conserved hypothetical protein | GGGGGCGU |
| CCNA_03826 | - | 3.71 | Rockhopper | 3991771–3992325 (-) | conserved hypothetical protein | - |
| CCNA_03888 | - | 2.99 | Rockhopper | 761965–762324 (+) | conserved hypothetical protein | GCGGUCCGG |
| CCNA_03976 | - | 3.57 | Rockhopper | 2923462–2923683 (+) | hypothetical protein | GAGCGCGUCGGCA |
| CCNA_R0016 | - | 8.53 | Rockhopper | 844332–844401 (+) | small non-coding RNA | UCGGGGG |
| CCNA_R0035 | - | 6.64 | Rockhopper | 1549367–1549443 (+) | tRNA-Pro | AAGGGGU |
| CCNA_R0044 | - | 4.82 | Rockhopper | 2059848–2059942 (-) | complex medium expressed sRNA | - |
| CCNA_R0061 | - | 4.65 | Sliding window | 2800475–2800525 (-, I, S) | RNase P RNA | UAGGUCGGGGC |
| CCNA_R0089 | - | 3.3 | Sliding window | 3874375–3874425 (+, U, S) | tRNA-Ala | UCGGGGGGCG |
| CCNA_R0100 | - | 4.4 | Rockhopper | 165492–165575 (+) | small non-coding RNA | CGGAGGG |
| CCNA_R0108 | - | 4.27 | Rockhopper | 472905–472973 (+) | small non-coding RNA | UCGGGGG |
| CCNA_R0180 | - | 5.14 | Rockhopper | 3266851–3266937 (-) | small non-coding RNA | - |
-
Gene Locus ID: GenBank locus ID
Gene Name: if available log2Fold: calculated fold change of the given region
-
Identification Method: refers to what strategy identified the enriched gene in the PP7hp affinity purification RNA-Seq
Region(s): the region and strand used to calculate the log2Fold metric. Additionally for the sliding window analysis additional information is provided. First letter indicates the relative position of the region indicated to the annotated gene coordinates: I-internal, U-upstream, D-downstream. Second letter indicates the direction in which the reads mapped: S-sense, A-anti-sense.
-
Description: product description of the given gene(s)
Interacting nucleotides: the nucleotides within the proposed chromosomal region(s) that are predicted to interact with GsrN.
Key resources table
| Reagent type | Designation | Source or reference | Identifier |
|---|---|---|---|
| Antibody | Goat anti-Mouse IgG (H + L) Secondary Antibody, HRP | ThermoFisher | 32430 |
| Antibody | DYKDDDDK Tag Monoclonal Antibody (FG4R) | ThermoFisher | MA1-91878-1MG |
| Strain, strain background | See Supplementary file 1 | ||
| Chemical compound, drug | Agar | Lab Scientific | A466 |
| Chemical compound, drug | 30% Hydrogen Peroxide | ThermoFisher | H325-100 |
| Chemical compound, drug | substrate o-nitrophenyl-β-D-galactopyranoside (ONPG) | GoldBio | N-275–100 |
| Chemical compound, drug | acrylamide:bisacrylamide (29:1) | BioRad | 1610156 |
| Chemical compound, drug | Acid-Phenol | Ambion | Am9722 |
| Commercial assay or kit | TRIzol | ThermoFisher | 15596026 |
| Recombinant DNA reagent | T4 Polynucleotide Kinase | New England Biolabs | M0201L |
| Chemical compound, drug | ATP, [γ−32P]- 3000 Ci/mmol 10mCi/ml EasyTide | PerkinElmer | BLU502A500UC |
| Peptide, recombinant protein | SuperScript IV Reverse Transcriptase | ThermoFisher | 18090010 |
| Peptide, recombinant protein | RNase H | New England Biolabs | M0297S |
| peptide, recombinant protein | TURBO DNase | ThermoFisher | AM2238 |
| Recombinant DNA reagent | KOD Hot Start DNA Polymerase | sigmaaldrich | 71086 |
| Commercial assay or kit | Micro Bio-Spin Columns With Bio-Gel P-6 in Tris Buffer | BioRad | 7326221 |
| Commercial assay or kit | Amylose Resin | New England Biolabs | E8021L |
| Commercial assay or kit | RNeasy Mini Kit | Qiagen | 74106 |
| Commercial assay or kit | SuperSignal West Femto Maximum Sensitivity Substrate | ThermoFisher | 34095 |
| Commercial assay or kit | Zero Blunt TOPO PCR Cloning Kit | invitrogen | K2800-20SC |
| Commercial assay or kit | FirstChoice RLM-RACE Kit | ThermoFisher | AM1700 |
| Other | Raw and analyzed RNA-seq data | This paper | GEO: GSE106168 https://www.ncbi.nlm.nih.gov/geo/query/acc.cgi?acc=GSE106168 |
| Other | Raw and analyzed LC-MS/MS data | This paper | PRIDE: PXD008128 |
| Other | Raw and analyzed RNA-seq data for GsrN-PP7hp purification | This paper | GEO: GSE106171 https://www.ncbi.nlm.nih.gov/geo/query/acc.cgi?acc=GSE106171 |
| Other | Raw and analyzed RNA-seq data for Network construction | (Fang et al., 2013) PMC3829707 | GEO: GSE46915 |
| Commercial assay or kit | Zeta-Probe Blotting Membranes | BioRad | 162–0165 |
| Commercial assay or kit | Low Molecular Weight Marker, 10–100 nt | Alfa Aesar | J76410 |
| Commercial assay or kit | Mini-PROTEAN TGX Precast Gel, 4–20% | BioRad | 456–1094 |
| Commercial assay or kit | Precision Plus Protein Kaleidoscope Prestained Protein Standards | BioRad | 1610375 |
| Sequence-based reagent | See Supplementary file 1 | ||
| Sequence-based reagent | See Supplementary file 1 | ||
| Software, algorithm | Bowtie2 | (Langmead and Salzberg, 2012) PMC3322381 | http://bowtie-bio.sourceforge.net/bowtie2/index.shtml |
| Software, algorithm | SAMTools | (Li et al., 2009) PMC2723002 | http://samtools.sourceforge.net/ |
| Software, algorithm | IntaRNA 2.0.2 | (Mann et al., 2017) 10.1093/nar/gkx279 | http://rna.informatik.uni-freiburg.de/IntaRNA/Input.jsp |
| Software, algorithm | Prism v6.04 | GraphPad Software, Inc. | https://www.graphpad.com/scientific-software/prism/ |
| Software, algorithm | WebLogo | (Crooks et al., 2004), PMC419797 | http://weblogo.berkeley.edu/logo.cgi |
| Software, algorithm | Geneious 11.0.2 | (Kearse et al., 2012), PMC3371832 | https://www.geneious.com/ |
| Software, algorithm | R v 3.3.3 | https://www.r-project.org/ | |
| Software, algorithm | Python v2.7 | https://www.python.org/download/releases/2.7/ | |
| Software, algorithm | Rockhopper 2.0 | (Tjaden, 2015), PMC4316799 | https://cs.wellesley.edu/~btjaden/Rockhopper/ |
| Software, algorithm | Edge-pro | (Magoc et al., 2013), PMC3603529 | http://ccb.jhu.edu/software/EDGE-pro/index.shtml |
| Software, algorithm | DESeq | (Anders and Huber, 2010), PMC3218662 | http://bioconductor.org/packages/release/bioc/html/DESeq.html |
| Software, algorithm | CLC Genomics Workbench 10 | (Qiagen) | https://www.qiagenbioinformatics.com/products/clc-genomics-workbench/ |
| Software, algorithm | MaxQuant | (Cox et al., 2014), PMC4159666 | http://www.coxdocs.org/doku.php?id=maxquant:start |
| Software, algorithm | IterativeRank | This paper | https://github.com/mtien/IterativeRank |
| Software, algorithm | Sliding_window_analysis | This paper | https://github.com/mtien/Sliding_window_analysis |
Additional files
-
Supplementary file 1
Strains, plasmids, and primers used in this study.
- https://doi.org/10.7554/eLife.33684.032
-
Transparent reporting form
- https://doi.org/10.7554/eLife.33684.033
Download links
A two-part list of links to download the article, or parts of the article, in various formats.
Downloads (link to download the article as PDF)
Open citations (links to open the citations from this article in various online reference manager services)
Cite this article (links to download the citations from this article in formats compatible with various reference manager tools)
Gene network analysis identifies a central post-transcriptional regulator of cellular stress survival
eLife 7:e33684.
https://doi.org/10.7554/eLife.33684


