PAX3-FOXO1 transgenic zebrafish models identify HES3 as a mediator of rhabdomyosarcoma tumorigenesis
- UT Southwestern Medical Center, United States
- Institut Curie, Paris Sciences et Lettres (PSL) Research University, Inserm U830, Institut Curie, Paris Sciences et Lettres (PSL) Research University, France
- Univ Lyon, Université Claude Bernard Lyon 1, INSERM 1052, CNRS 5286, Centre LéonBérard, France
- INSERM U80, Institute Curie Research Center, France
- Unité de Génétique Somatique, France
Figures
Figure 1 with 2 supplements
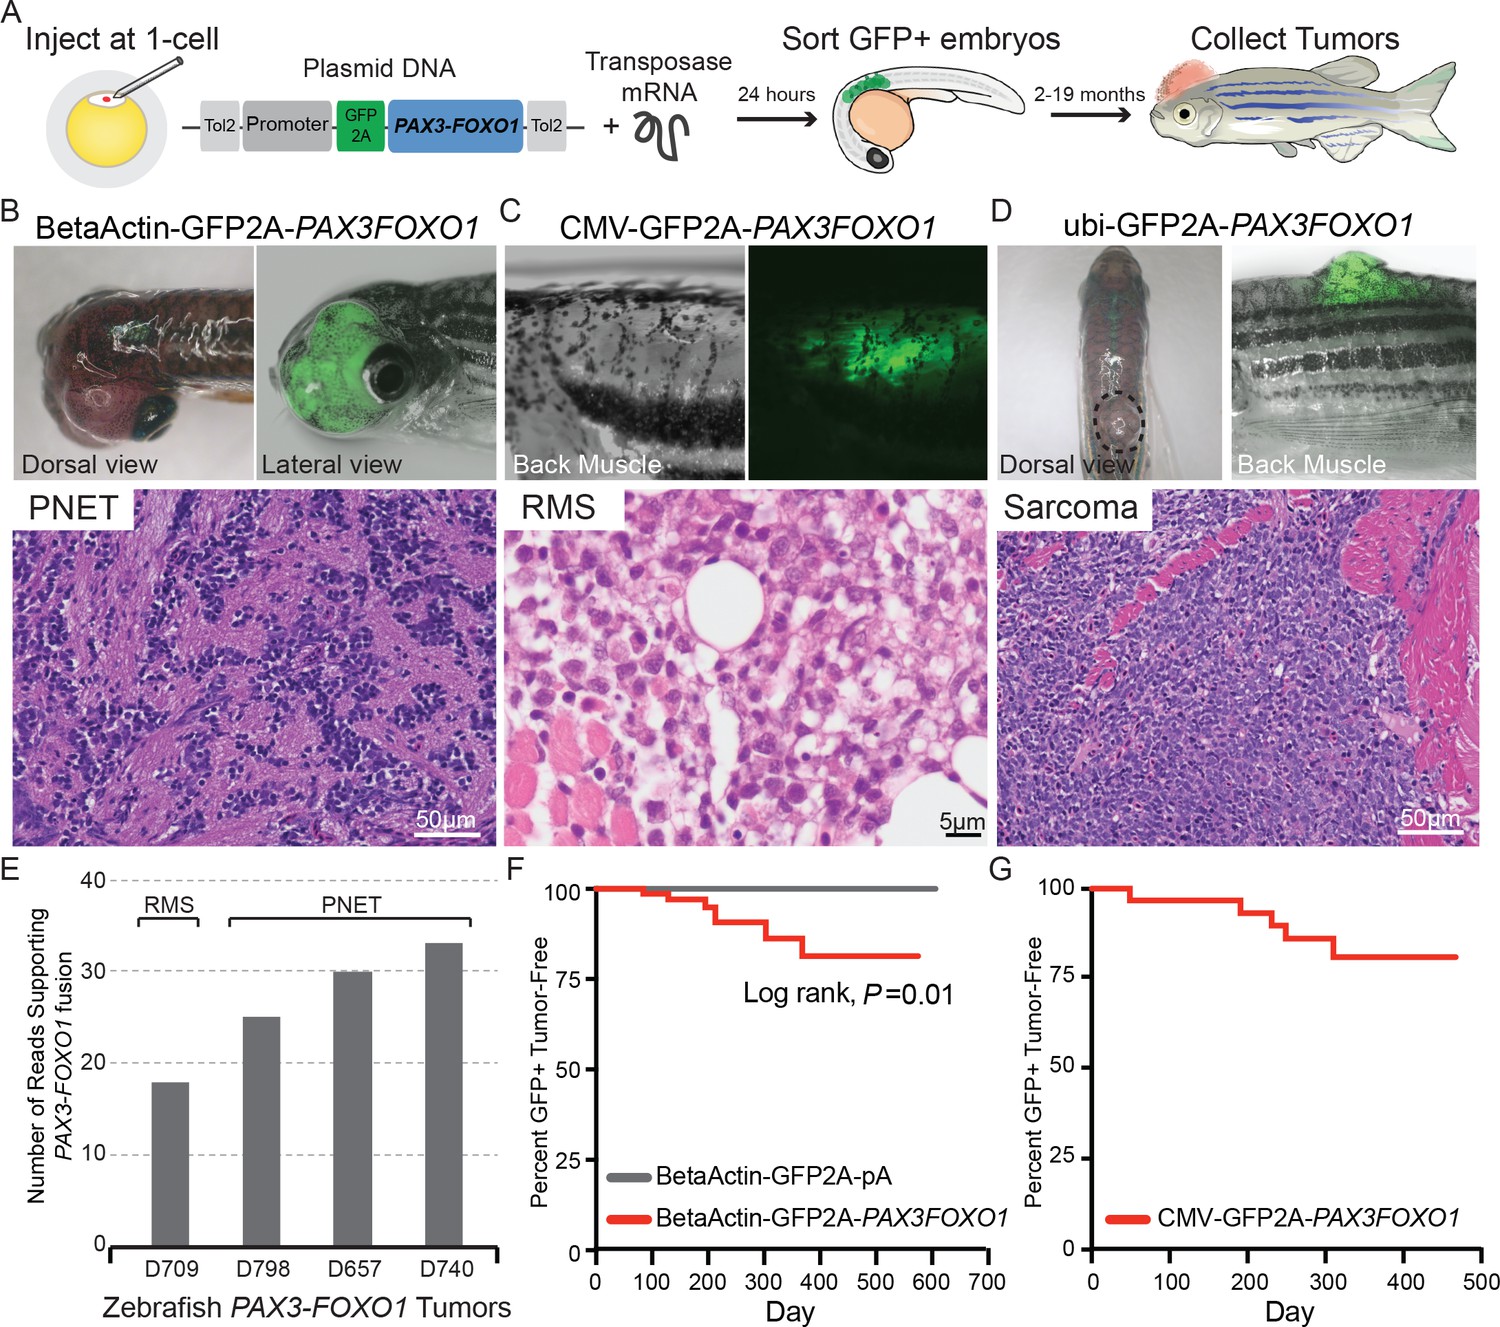
Zebrafish models of human PAX3-FOXO1 tumorigenesis.
(A) Zebrafish were injected at the single-cell stage with mosaic GFP2A-tagged human PAX3-FOXO1 under the control of various promoters. At 24 hr old, embryos were sorted for GFP expression indicating successful injections (typically 99% GFP+) and were allowed to grow and monitored for up to 19 months to develop tumors. (B) Beta-actin-driven PAX3-FOXO1 primarily produced primitive neuroectodermal tumors in a wild-type genetic background. Shown for all tumors are representative examples with the presentation of gross morphology and GFP expression patterns coupled with a hematoxylin and eosin stain. (C) CMV-driven PAX3-FOXO1 produced rhabdomyosarcoma in the tp53M214K/M214K-sensitized genetic background. (D) Ubiquitin-driven PAX3-FOXO1 produced an undifferentiated sarcoma in a wild-type genetic background. (E) RNAseq data from zebrafish PAX3-FOXO1 fluorescent tumors showing the number of reads supporting the presence of the human fusion-oncogene. (F) Tumor incidence of GFP + tumors detected in BetaActin-GFP2A-PAX3FOXO1 (n = 74) injected zebrafish versus BetaActin-GFP (n = 147) injected controls in a wildtype genetic background. (G) Tumor incidence of GFP + tumors detected in CMV-GFP2A-PAX3FOXO1 (n = 31) injected zebrafish in a tp53M214K-sensitizing genetic background.
Figure 1—figure supplement 1
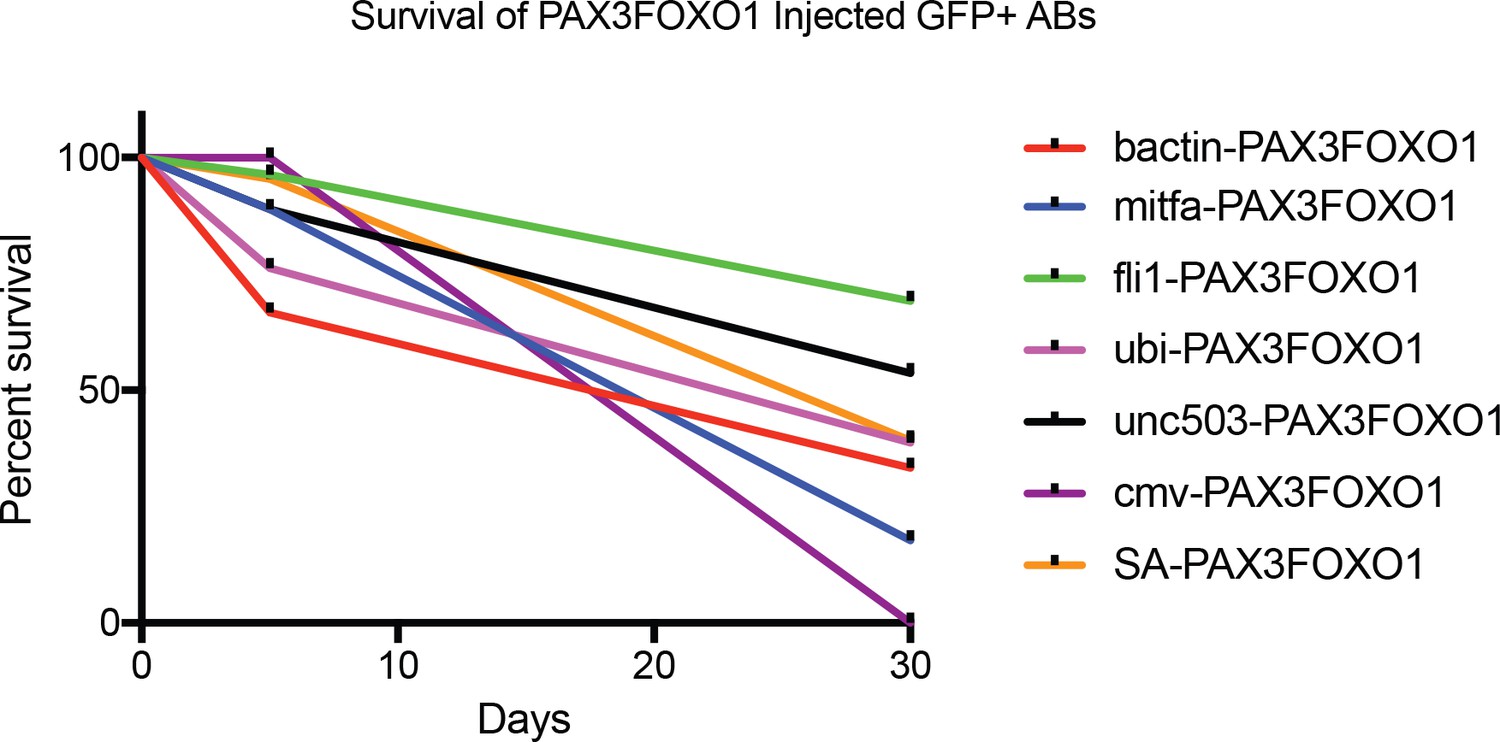
Promoter restricted expression of human PAX3-FOXO1 has different effects on survival in developing zebrafish.
Shown are the survival curves for the following promoters and the total number of zebrafish embryos analyzed for each condition: beta actin (n = 120), mitfa (n = 45), fli1 (n = 81), ubi (n = 160), unc503 (n = 108), cmv (n = 20), SA-splice acceptor (n = 153).
Figure 1—figure supplement 2
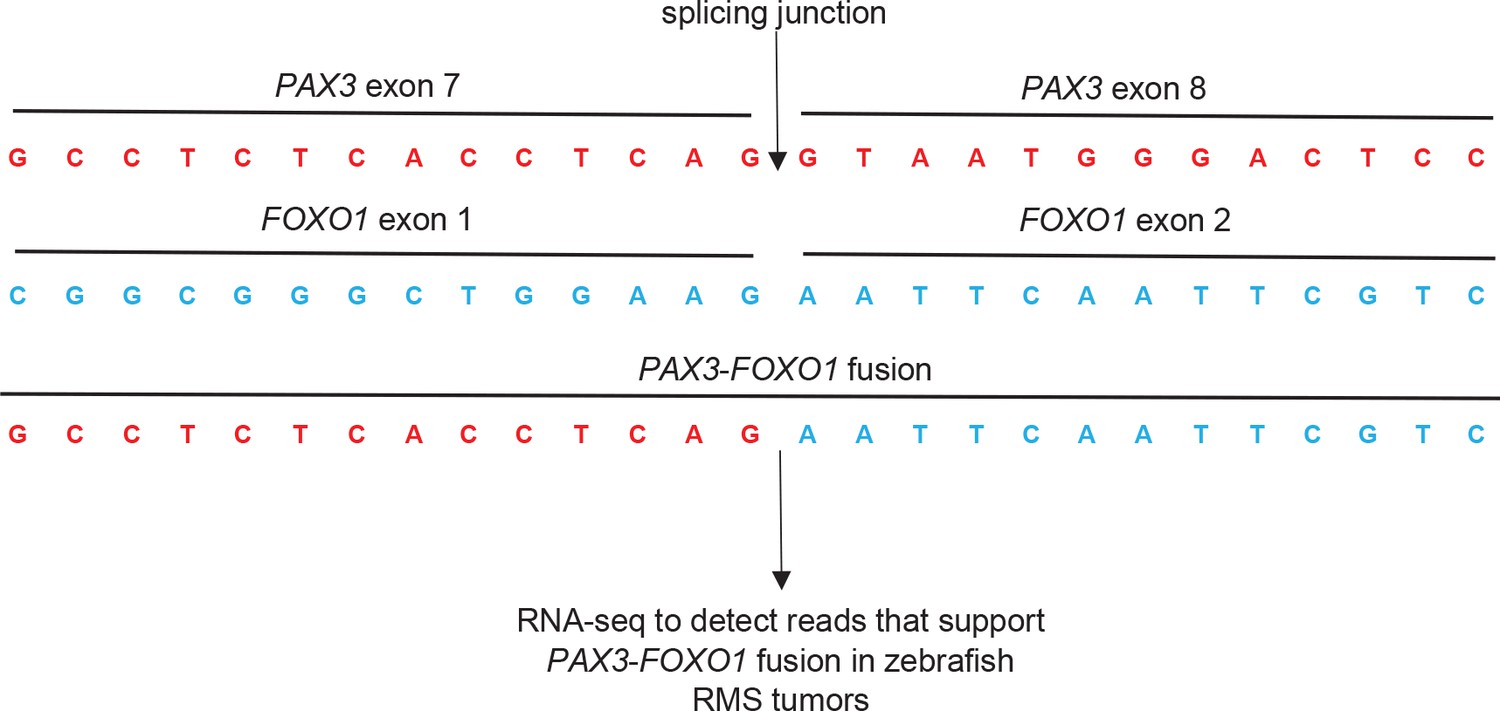
Junctional sequence used to map human PAX3-FOXO1 fusion RNAseq reads from zebrafish tumors.
https://doi.org/10.7554/eLife.33800.005
Figure 2 with 2 supplements

PAX3 and PAX3-FOXO1 have distinct impacts and tolerance during embryonic development and in adult zebrafish.
(A) Strategy for assessing functional differences of beta-actin-driven PAX3 and PAX3-FOXO1 in a vertebrate system. (B) Representative images at 24 hr post-fertilization of Uninjected, mCherry2A-PAX3, and GFP2A-PAX3FOXO1-injected zebrafish. (C) Survival curve of Uninjected, GFP2A or mCherry2A injected controls, mCherry2A-PAX3, and GFP2A-PAX3FOXO1. Error bars represent SE. Log rank test, p<0.0001 for PAX3FOXO1 versus all other conditions. (D) Embryonic phenotypes scored at 3 days post-injection. * indicates p<0.05, for PAX3 vs PAX3FOXO1, Fisher’s exact test. MO- morpholino. DV- Dorso-Ventral. (E) Percentage of GFP + cells from dissociated zebrafish embryos as quantified by fluorescent activated cell sorting (FACS). Error bars represent SD across three independent experiments. * indicates p<0.05, two-tailed Student’s t-test. (F) Adult zebrafish over 3 months of age robustly expressed beta-actin-driven Cherry, GFP, or Cherry2A-PAX3 and developed normally. Zebrafish injected with BetaActin-GFP2A-PAX3FOXO1 displayed developmental defects or developed tumors. Arrow denotes GFP + area. The percentage indicates zebrafish with detectable fluorescence at adulthood. (G) Hematoxylin and eosin staining showed normal histology of BetaActin-PAX3 expressing skeletal muscle (sagittal section) at 299 days of age, and abnormal histology of BetaActin-PAX3FOXO1 epaxial muscle exhibiting dramatic left-right asymmetry (transverse section, asymmetry of left-right epaxial muscle (EM) marked by dotted lines) at 307 days of age. Scale bars, 200 microns. EM- epaxial muscle. (H) Representative images from zebrafish embryos injected with GFP2A-PAX3 and GFP2A-PAX3FOXO1 that are fixed at 24 hr post-injection and then TUNEL performed (rhodamine). Embryos were counter-stained for GFP to indicate transgene expression. (I) Quantification of TUNEL-positive pixels normalized to GFP positive pixels, indicated a higher proportion of PAX3-FOXO1 cells were undergoing apoptosis. Error bars represent SD, n = 6–8 embryos per group, * indicates p<0.05, two-tailed Student’s t-test.
Figure 2—figure supplement 1
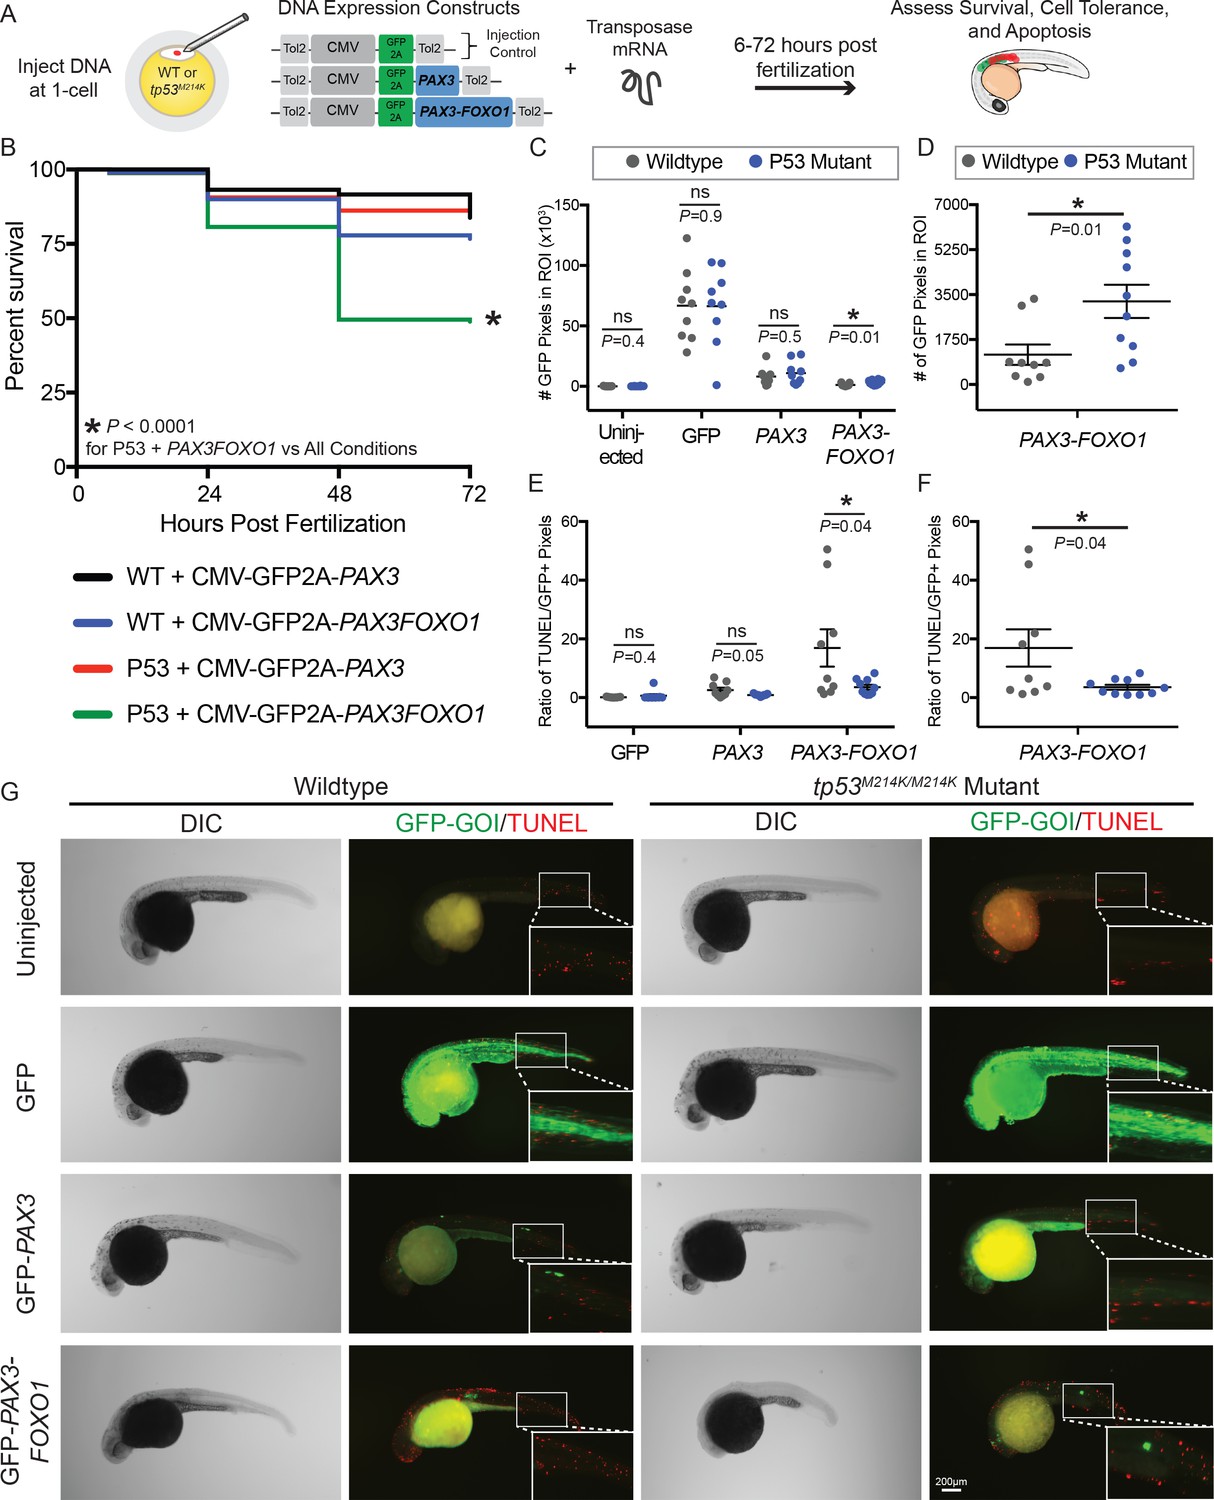
The tp53M214K mutation modifies the CMV-PAX3FOXO1 phenotype in developing zebrafish.
(A) Schematic of the experimental strategy to assess the impact of a tp53 mutation on survival, cell tolerance, and apoptosis of mosaic CMV restricted GFP, GFP-PAX3, or GFP-PAX3FOXO1 developmental expression. (B) Survival of PAX3 injected wildtype (n = 89) or tp53M214K/M214K (n = 146) as compared to PAX3-FOXO1 injected wildtype (n = 199) or tp53M214K/M214K (n = 219) evaluated at 6, 24, 48, and 72 hr post fertilization. All constructs were injected in equimolar amounts relative to 25 ng/µL of CMV-GFP2A-PAX3FOXO1. (C) Quantification of the number of GFP-positive pixels for each embryo imaged at 28 hr post fertilization using the same settings. Each marker represents a single zebrafish embryo, n = 8–10 embryos per group. Black bar is the mean, error bars represent SEM, and * indicates p<0.05, two-tailed Student’s t-test, ns- not significant. ROI- region of interest. (D) Same samples as in C plotted for the PAX3-FOXO1 injection groups only. (E) Quantification of TUNEL-positive pixels normalized to GFP-positive pixels indicated a lower proportion of PAX3-FOXO1 cells are undergoing apoptosis in the context of the tp53M214K/M214K mutation. Black bar is the mean, error bars represent SEM, n = 8–10 embryos per group, * indicates p<0.05, two-tailed Student’s t-test. (F) Same samples as in E plotted for the PAX3-FOXO1 injection groups only. (G) Representative images from wildtype and tp53M214K/M214K uninjected controls, CMV-GFP2A injection controls, CMV-GFP2A-PAX3 and CMV-GFP2A-PAX3FOXO1 injected experimental groups. Embryos were fixed at 28 hr post-injection, TUNEL (rhodamine) performed, and then embryos were counter-stained for GFP to denote transgene expression.
Figure 2—figure supplement 2
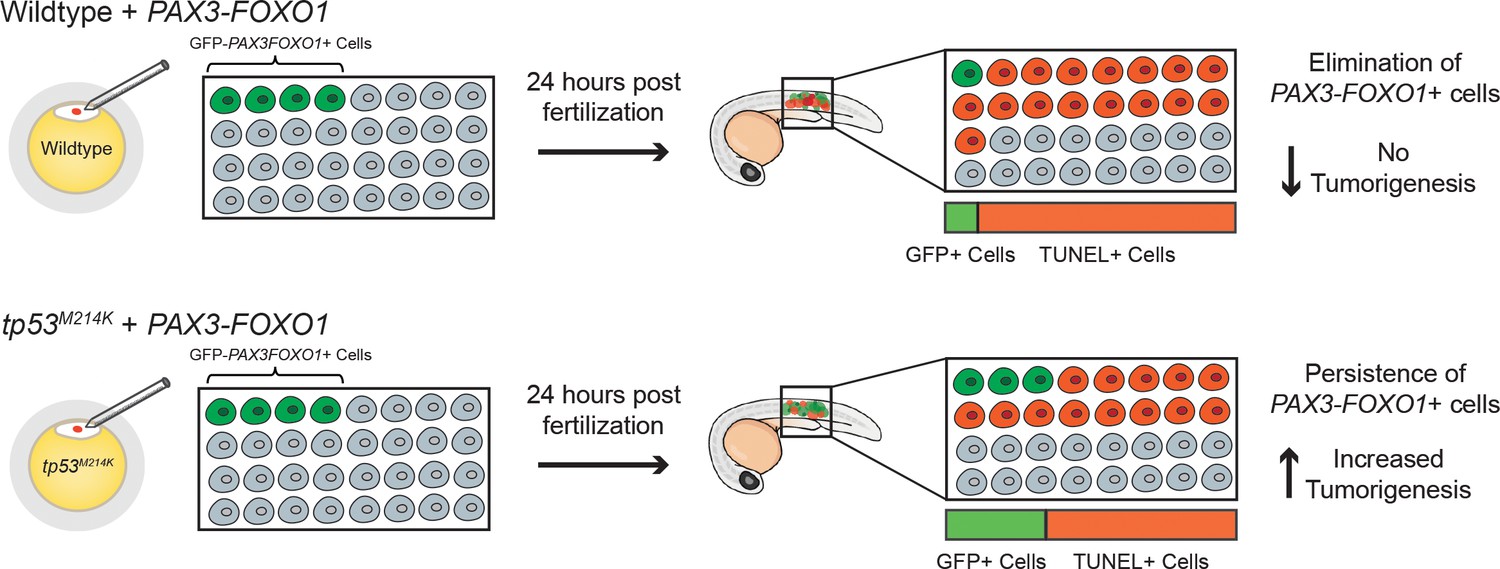
A model for tp53M214K mediation of CMV-PAX3FOXO1 RMS tumorigenesis.
GFP-tagged PAX3-FOXO1 was injected at the same concentration into developing wildtype or tp53M214K homozygous mutant zebrafish. The number of GFP positive and TUNEL-positive cells was assessed at 24 hr post-fertilization with striking differences. In wildtype zebrafish, there is a reduction in the number of GFP-PAX3FOXO1 + cells that is coupled with a significant increase in the number of cells undergoing apoptosis. This embryonic elimination of PAX3-FOXO1 + cells may explain the lack of tumors that develop in CMV-PAX3FOXO1 injected wildtype zebrafish. However, in tp53M214K mutant zebrafish, there is an increase in the number of GFP-PAX3FOXO1 + cells that is coupled with a decrease in the number of cells undergoing apoptosis. This suggests that inhibition of apoptosis via a tp53-dependent mechanism is allowing for the persistence of embryonic PAX3-FOXO1 + cells and ultimately RMS tumorigenesis in this model.
Figure 3
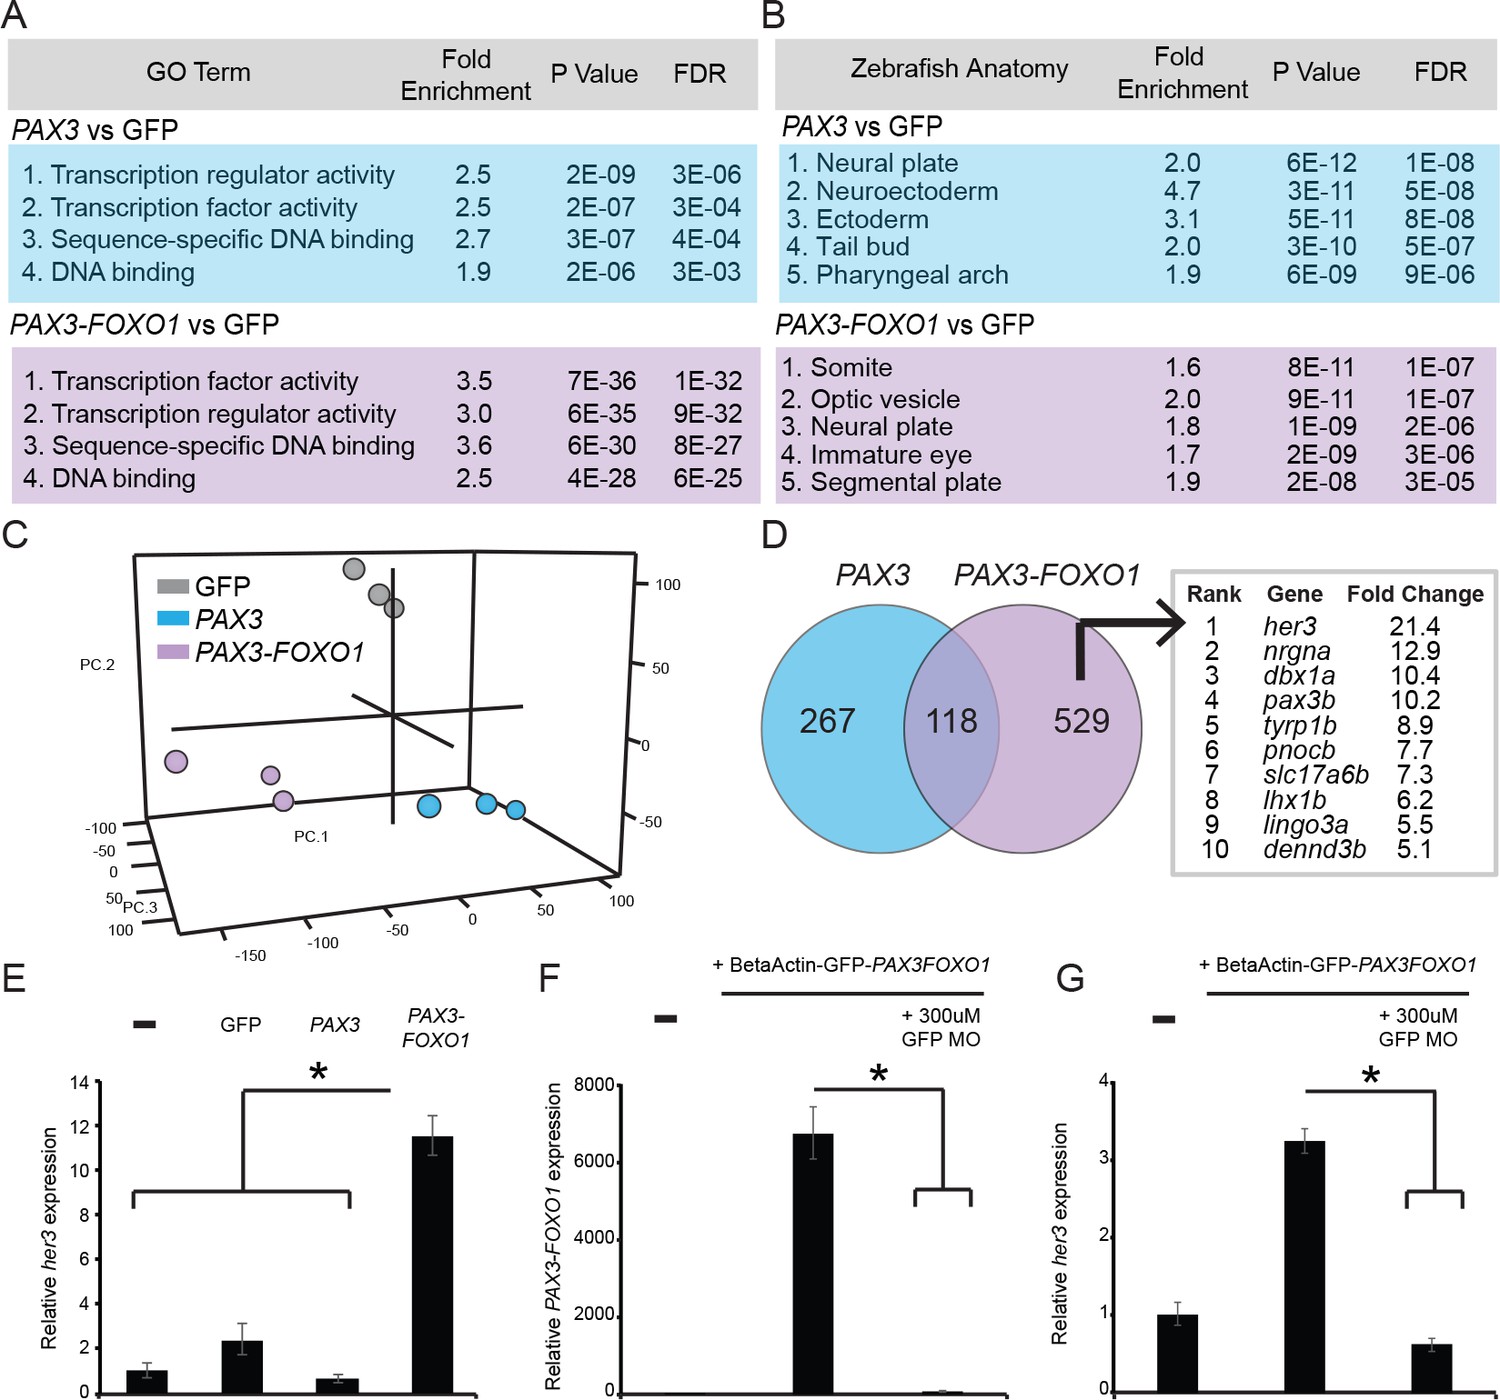
PAX3 and PAX3-FOXO1 induce distinct gene expression signatures during development, identifying a unique PAX3-FOXO1 target, her3.
Microarray analysis identified differentially expressed gene signatures in 24 hr old zebrafish FACS sorted embryonic cells that expressed either GFP2A-PAX3FOXO1 or GFP2A-PAX3. (A) Gene ontology terms associated with PAX3 or PAX3-FOXO1. (B) Embryonic tissues indicative of PAX3 or PAX3-FOXO1 gene sets. (C) 3D principal components analysis (PCA) of GFP injected controls, PAX3, and PAX3-FOXO1. (D) Intersection of up-regulated genes for PAX3 and PAX3-FOXO1 as compared to GFP controls. Uniquely up-regulated PAX3-FOXO1 target genes were included in downstream analysis only if they possessed a human ortholog. Shown are genes rank ordered based on the fold-change of their expression. (E) qRT-PCR of her3 levels from 24-hr-old zebrafish embryos that are either uninjected controls or injected with GFP, PAX3, or PAX3-FOXO1. (F) qRT-PCR for PAX3-FOXO1 mRNA levels from 24-hr-old zebrafish embryos injected with PAX3-FOXO1, or PAX3-FOXO1 in combination with a GFP morpholino (GFP MO) that inhibits transgene expression. (G) Same samples as in F, but qRT-PCR was performed for her3. In E-G the SD is derived from technical triplicates, * indicates p<0.05, two-tailed Student’s t-test.
Figure 4 with 2 supplements
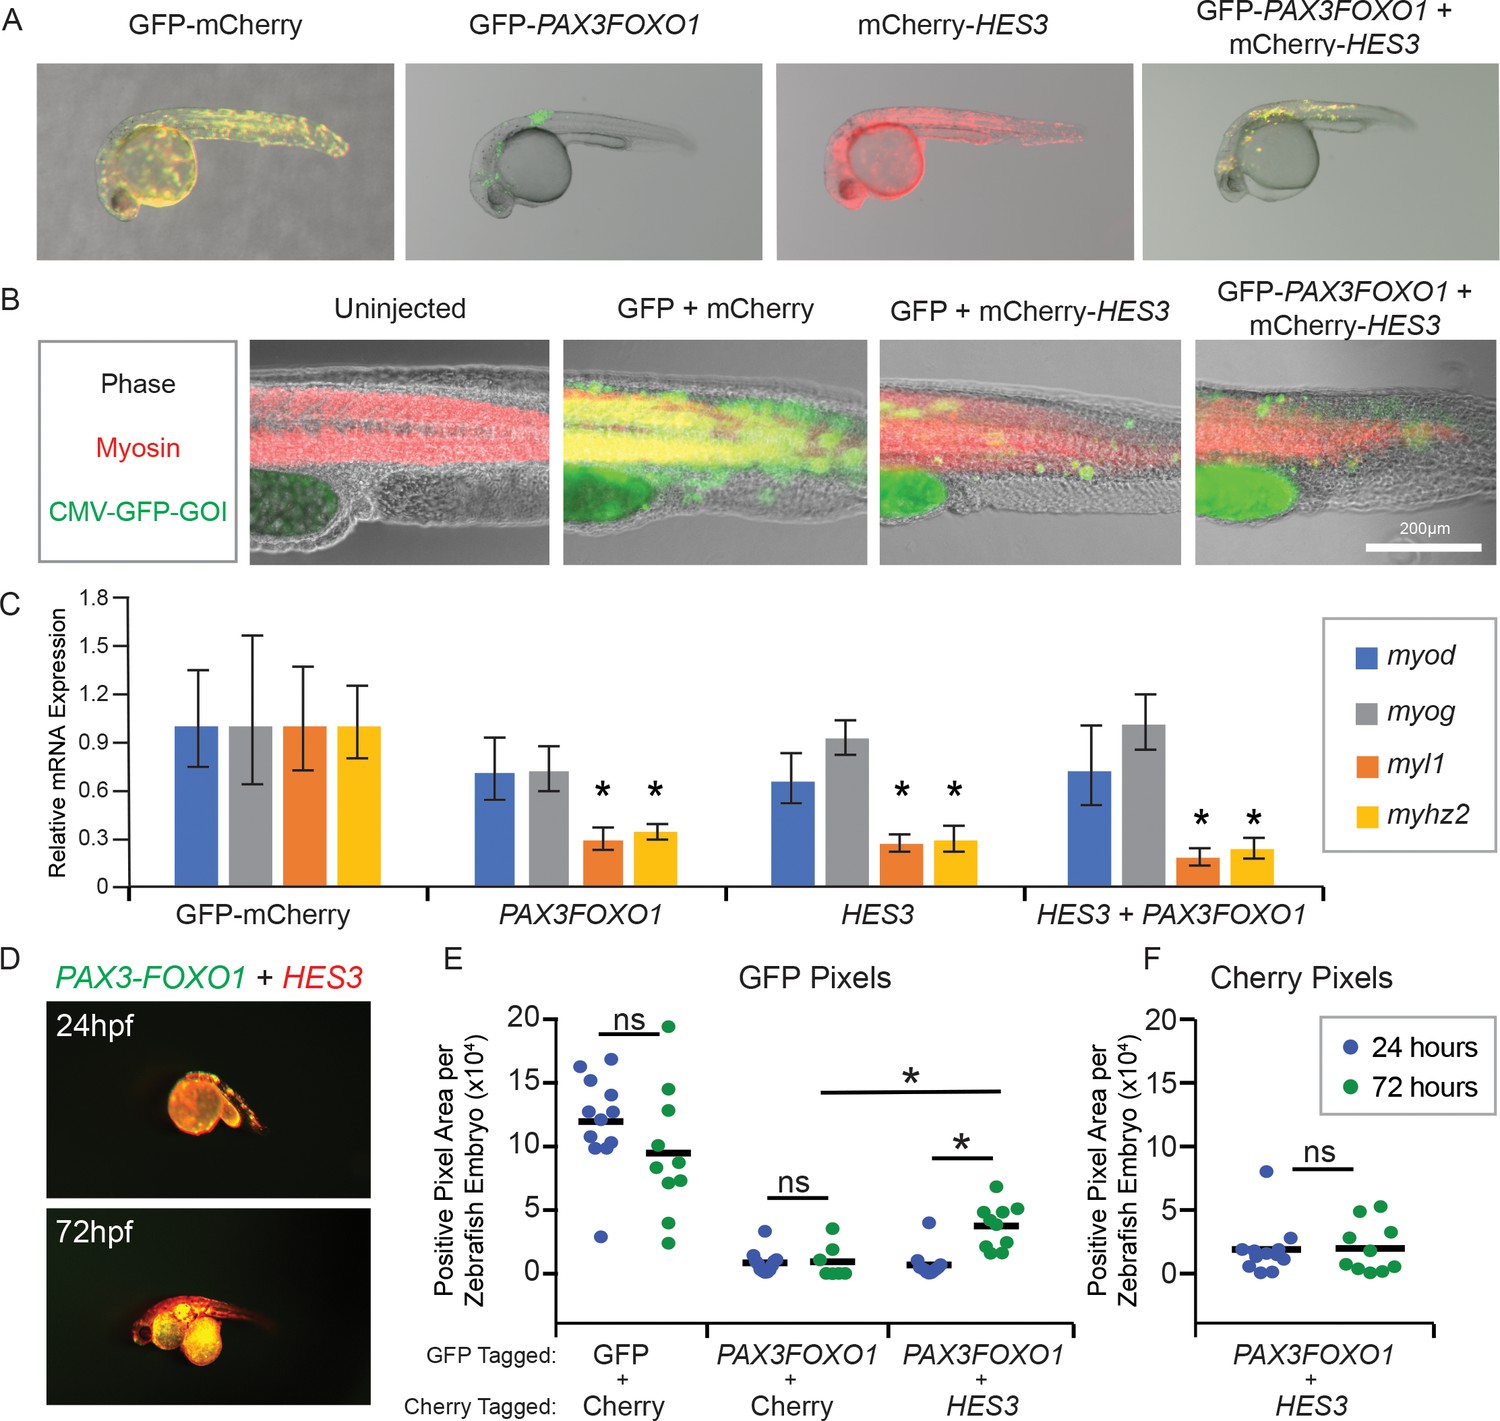
HES3 inhibits myogenic differentiation in developing zebrafish and supports persistence of PAX3-FOXO1-positive cells.
(A) Zebrafish embryos were injected at the single-cell stage with the beta actin promoter driving GFP-Cherry, GFP-PAX3FOXO1, mCherry-HES3, or combined mCherry-HES3 and GFP-PAX3FOXO1. Shown are representative embryos at 24 hr post fertilization with indicated transgene expression. (B) Representative overlays of zebrafish embryo musculature that were fixed at 24 hr and immunofluorescence performed for myosin (red) and injected genes of interest (GOI; green). (C) Pools of n = 5 embryos were harvested at 24 hr and markers of myogenesis assessed by qRT-PCR, including myod, myog, myl1, and myhz2. SD is derived from technical triplicates. * indicates significant differences between treatment group and the GFP-mCherry control at a threshold of p<0.05, two-tailed Student’s t-test. (D) Representative overlay of images from co-injections of mCherry-HES3 and GFP-PAX3FOXO1 from the same embryo at 24 and 72 hr post-fertilization. Images were taken with the same exposure settings and objective. (E) Quantification of the number of positive pixels for each embryo imaged at 24 and 72 hr post-fertilization. GFP-positive pixels are plotted after the same settings are applied for imaging and analysis. Each marker represents a single zebrafish embryo at 24 or 72 hr post fertilization, n = 6–12 embryos per group. Black bar is the mean, and * indicates p<0.05, two-tailed Student’s t-test. ns- not significant. (F) Same analysis as in E but for mCherry positive pixels.
Figure 4—figure supplement 1
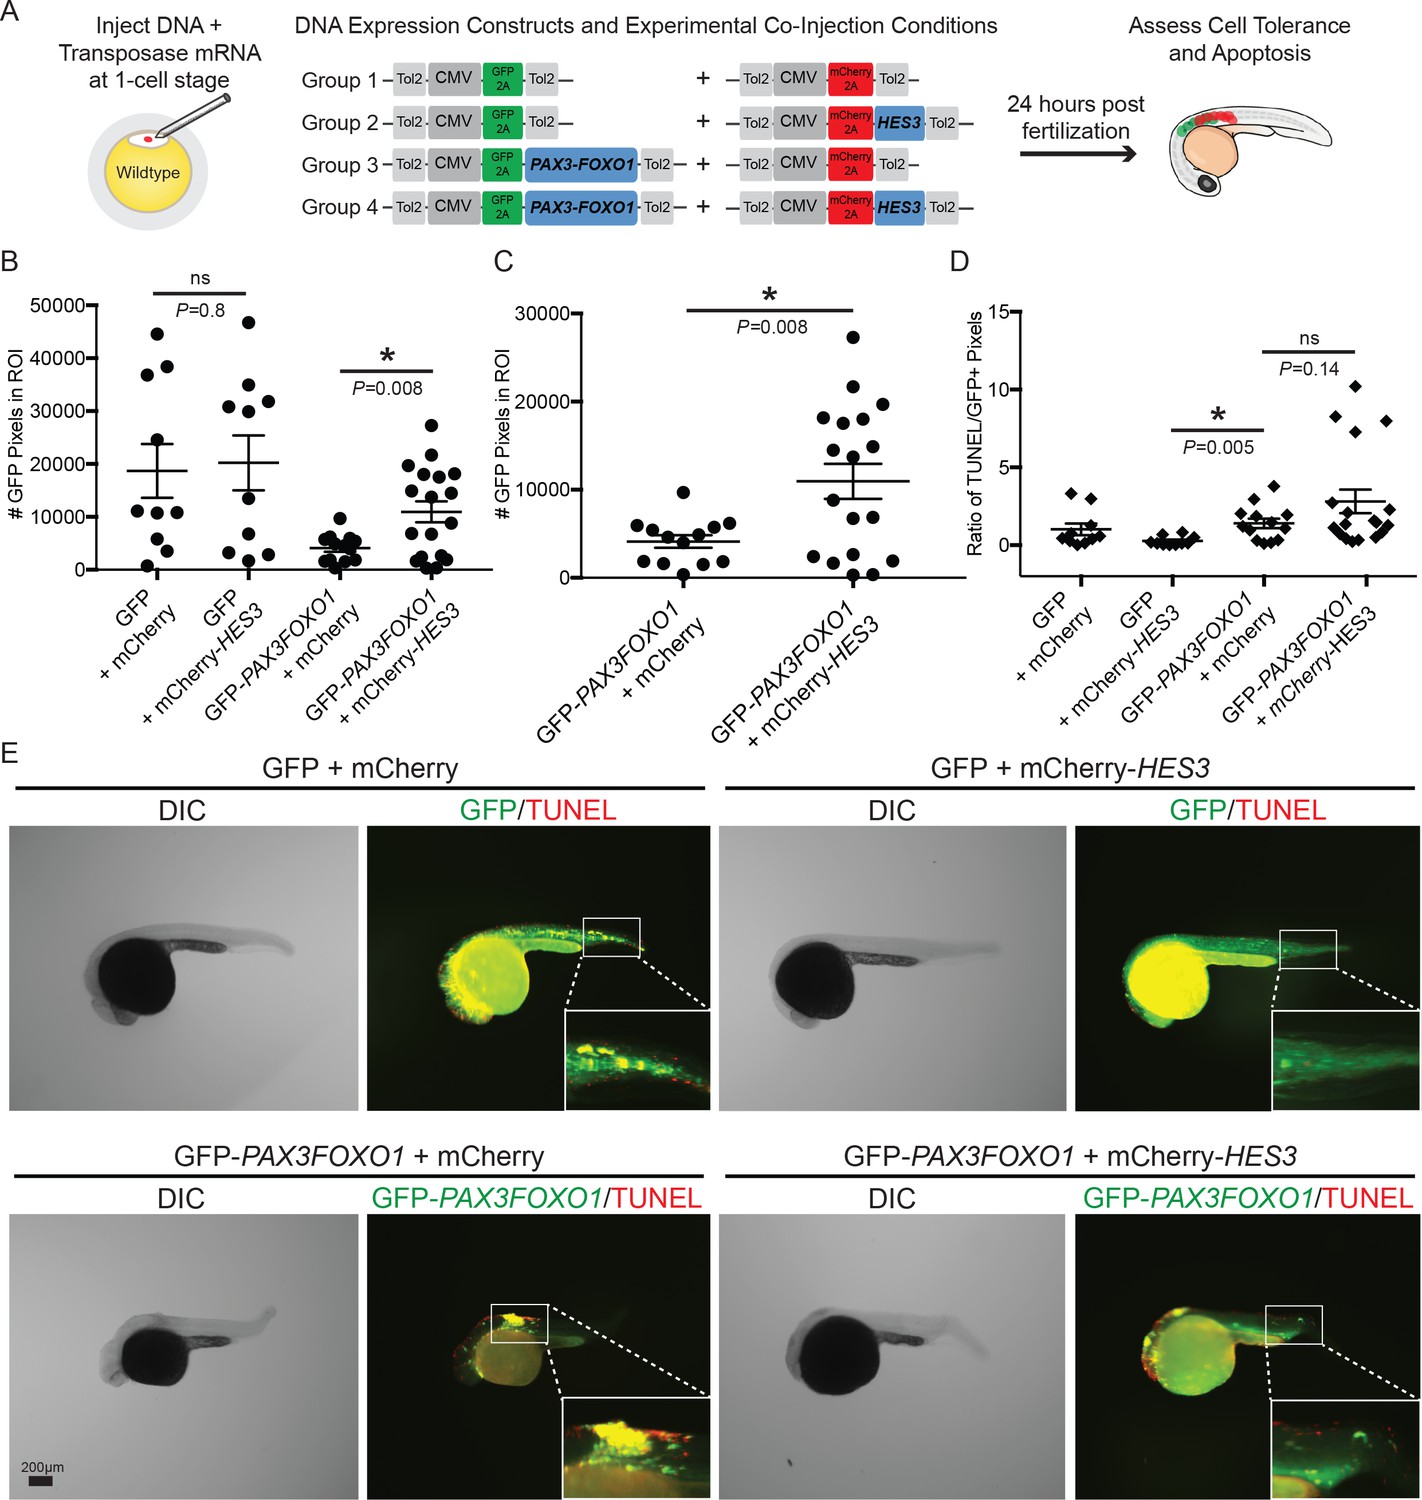
HES3 facilitates cellular tolerance of CMV-PAX3FOXO1 expression in developing zebrafish but does not alleviate the apoptosis phenotype.
(A) Schematic of the strategy to assess the impact of human HES3 expression on PAX3-FOXO1 cell tolerance and apoptosis in wildtype developing zebrafish. The CMV promoter was utilized in a mosaic injection strategy, and the experimental groups included the following combinations of two independent plasmids: (1) GFP + mCherry, (2) GFP + mCherry-HES3, (3) GFP-PAX3FOXO1 + mCherry, and (4) GFP-PAX3FOXO1 + mCherry-HES3. Concentrations of injected plasmids were an equivalent molarity to 25 ng/µL of CMV-GFP2A-PAX3FOXO1 (B) Quantification of the number of GFP positive pixels for each embryo imaged at 24 hr post-fertilization using the same settings. Each marker represents a single zebrafish embryo, n = 10–18 embryos per group. Black bar is the mean, error bars represent SEM, and * indicates p<0.05, two-tailed Student’s t-test, ns- not significant. ROI- region of interest. (C) Same samples as in B plotted for the PAX3-FOXO1 and PAX3-FOXO1 + HES3 injection groups. (D) Quantification of TUNEL-positive pixels normalized to GFP-positive pixels indicates that HES3 is not inhibiting PAX3-FOXO1-induced apoptosis at 24 hr post fertilization. Black bar is the mean, error bars represent SEM, n = 10–18 embryos per group, * indicates p<0.05, two-tailed Student’s t-test. ns- not significant. (E) Representative images from the four injection groups: (1) GFP + mCherry, (2) GFP + mCherry-HES3, (3) GFP-PAX3FOXO1 + mCherry, and 4) GFP-PAX3FOXO1 + mCherry-HES3. Embryos were fixed at 24 hr post-injection, TUNEL (rhodamine) performed, and then embryos were counter-stained for GFP to denote transgene expression.
Figure 4—figure supplement 2
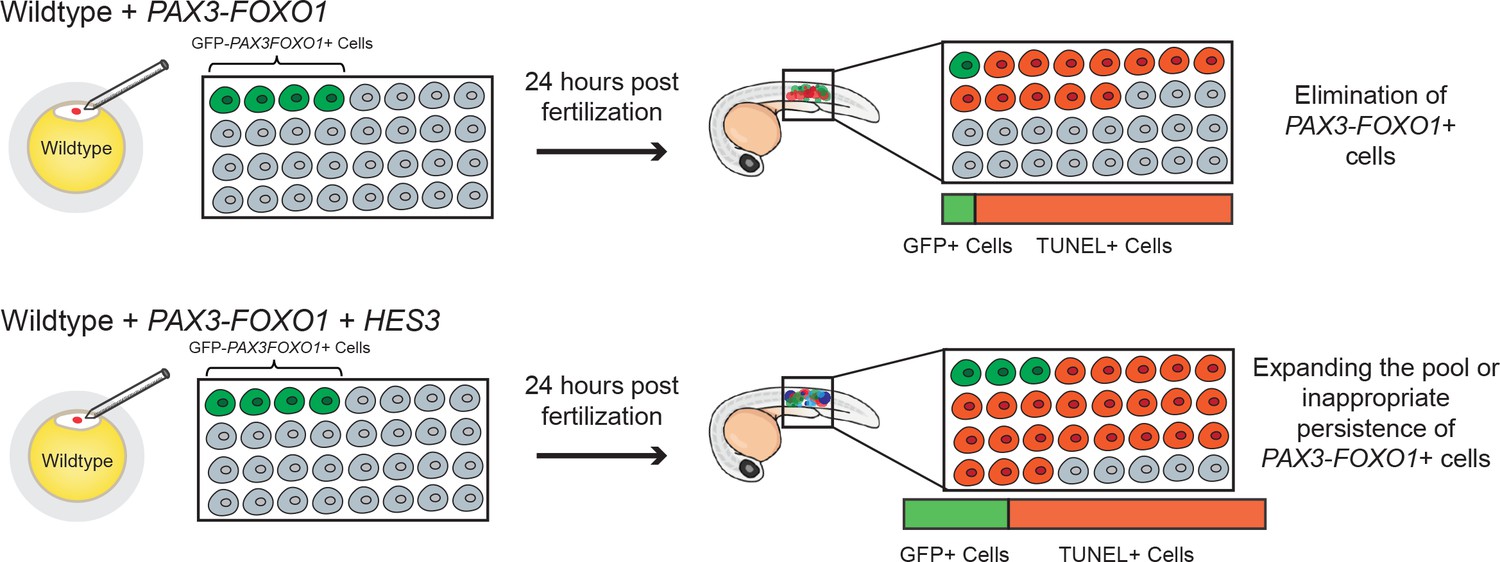
A model for HES3 facilitation of CMV-PAX3FOXO1 embryonic cellular persistence.
GFP-tagged PAX3-FOXO1 or GFP-tagged PAX3-FOXO1 in combination with HES3 were injected in equimolar amounts into developing wild-type zebrafish. The number of GFP-positive and TUNEL-positive cells was assessed at 24 hr post-fertilization. In GFP-PAX3FOXO1 + injected zebrafish there was a reduction in the number of GFP + cells that was coupled with a significant increase in the number of cells undergoing apoptosis. This embryonic elimination of PAX3-FOXO1 + cells may explain the lack of tumors that develop in CMV-PAX3FOXO1 injected wildtype zebrafish. In GFP-tagged PAX3-FOXO1 + HES3 injected zebrafish, there was an increase in the number of GFP-PAX3FOXO1+ cells. This effect is coupled with a trend towards an increase in apoptosis. Potentially, HES3 is expanding the pool of available cells that express PAX3-FOXO1 and thus can undergo transformation. Alternatively, HES3 is allowing for inappropriate persistence of PAX3-FOXO1 + cells.
Figure 5 with 2 supplements
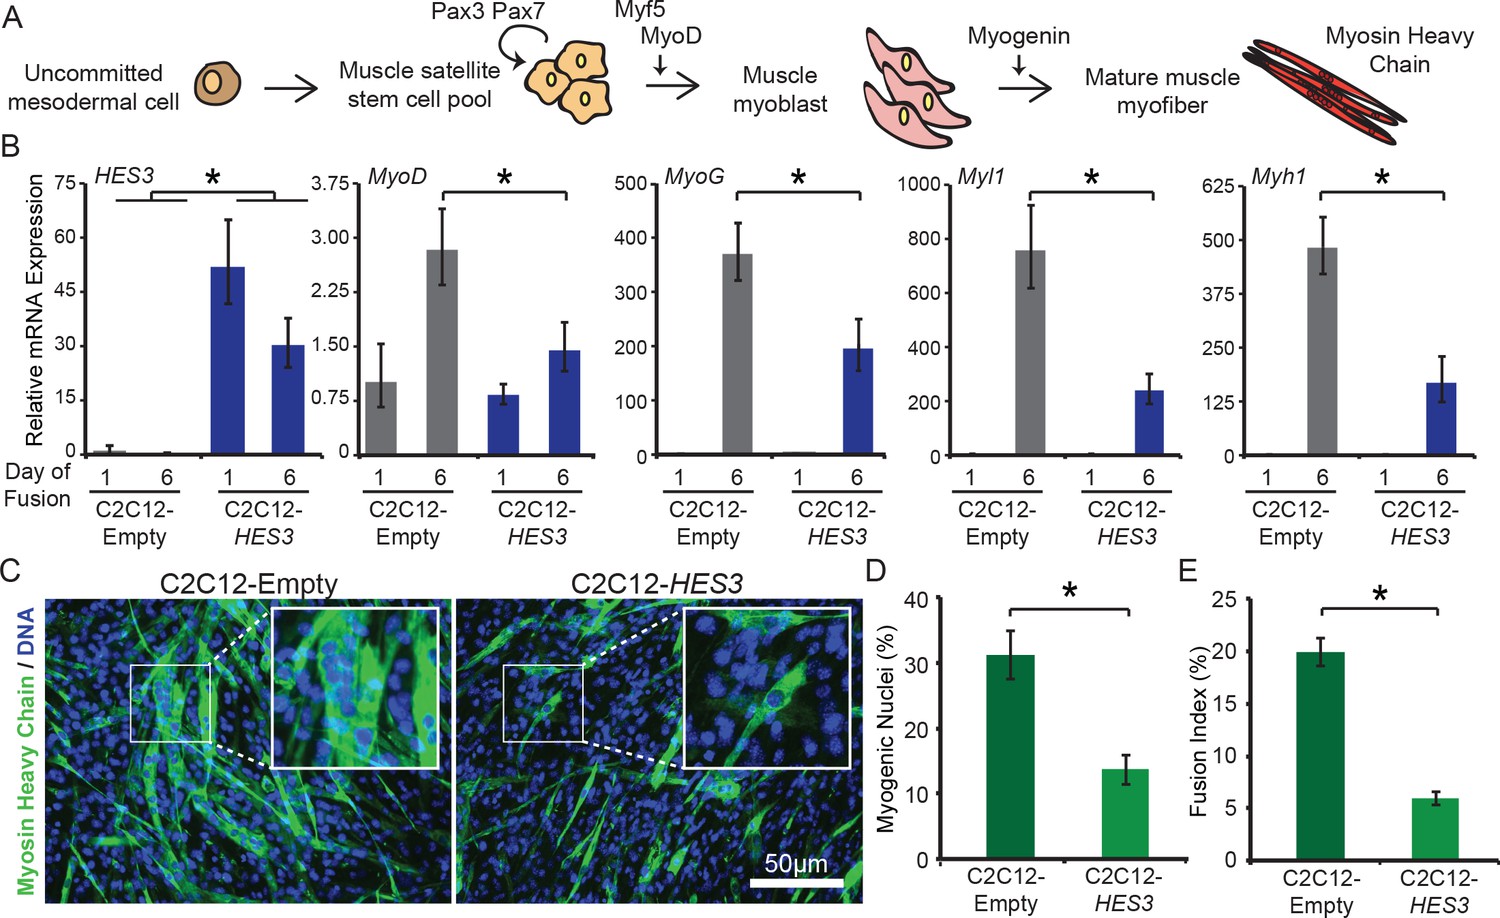
HES3 overexpression inhibits myogenic differentiation of mouse muscle myoblasts.
(A) Schematic of muscle development. Specifically noted are key skeletal muscle transcription factors and proteins assessed in B. Muscle satellite cells that self-renew express Pax3/Pax7. During development, they are activated to further differentiate by expression of MyoD, the master muscle regulator, after which they become myoblasts, an intermediate cell type. Myoblasts proliferate and fuse together to form multi-nucleated and contractile myofibers that express structural proteins, such as myosin heavy chain. (B) C2C12-Empty and C2C12-HES3 overexpressing cells were seeded in growth media and after 24 hr exposed to differentiation media. At this point Day 1 of fusion was collected. Following 5 additional days in fusion media the final timepoint was collected. qRT-PCR was performed for HES3, and the following muscle marker genes: MyoD, MyoG, Myl1, Myh1. SD is derived from technical triplicates. * indicates p<0.05, two-tailed Student’s t-test. (C) C2C12-Empty and C2C12-HES3 cells were differentiated for five days, fixed, and immunofluorescence performed for Myosin Heavy Chain (MyHC) protein. Cells were counterstained with DAPI to detect DNA. Shown are representative images of the fusion capacity for each condition. (D) Quantification of the differentiation capacity of HES3 overexpressing mouse myoblasts. Plotted are the number of myogenic nuclei (# of nuclei within a MyHC + cell divided by the total nuclei) with n = 3 technical replicates per group ± SD. Experiment was repeated with biological replicates. * indicates p<0.05, two-tailed Student’s t-test. (E) Same data as in D represented as the fusion capacity which focuses on multi-nucleation. The fusion capacity was calculated by including nuclei with n > 3 nuclei per MyHC + cell divided by the total number of nuclei. Plotted is the mean of n = 3 technical replicates per group ± SD. Experiment was repeated with biological replicates. * indicates p<0.05, two-tailed Student’s t-test.
Figure 5—figure supplement 1
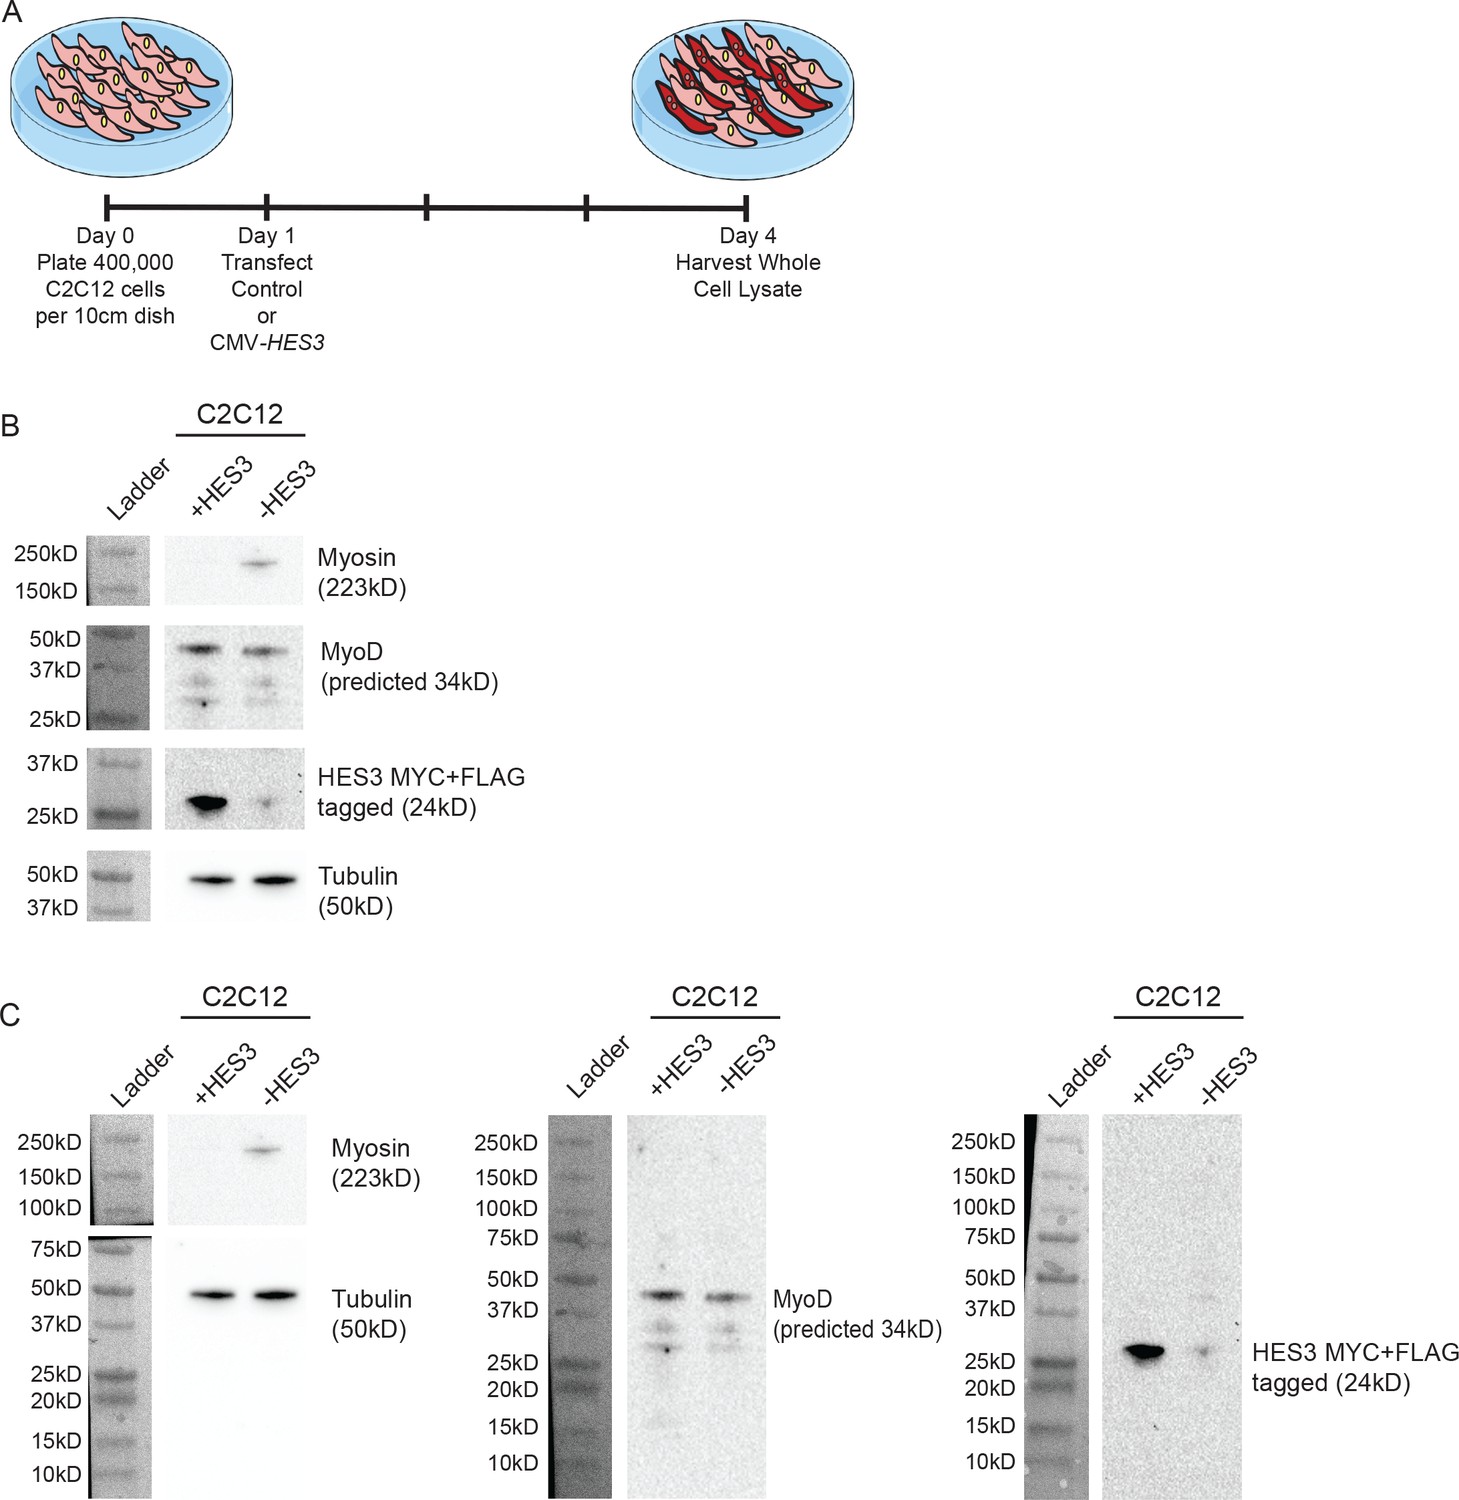
HES3 overexpression inhibits the myogenic differentiation kinetic in mouse muscle myoblasts.
(A) C2C12 cells were transfected with control or CMV-HES3, allowed to become confluent and begin fusion, and then whole cell lysate harvested four days post plating. (B) Western blots to detect Myosin, MyoD, MYC-HES3, and Tubulin protein expression levels. (C) Entire membranes for the cropped images shown in panel B.
Figure 5—figure supplement 2
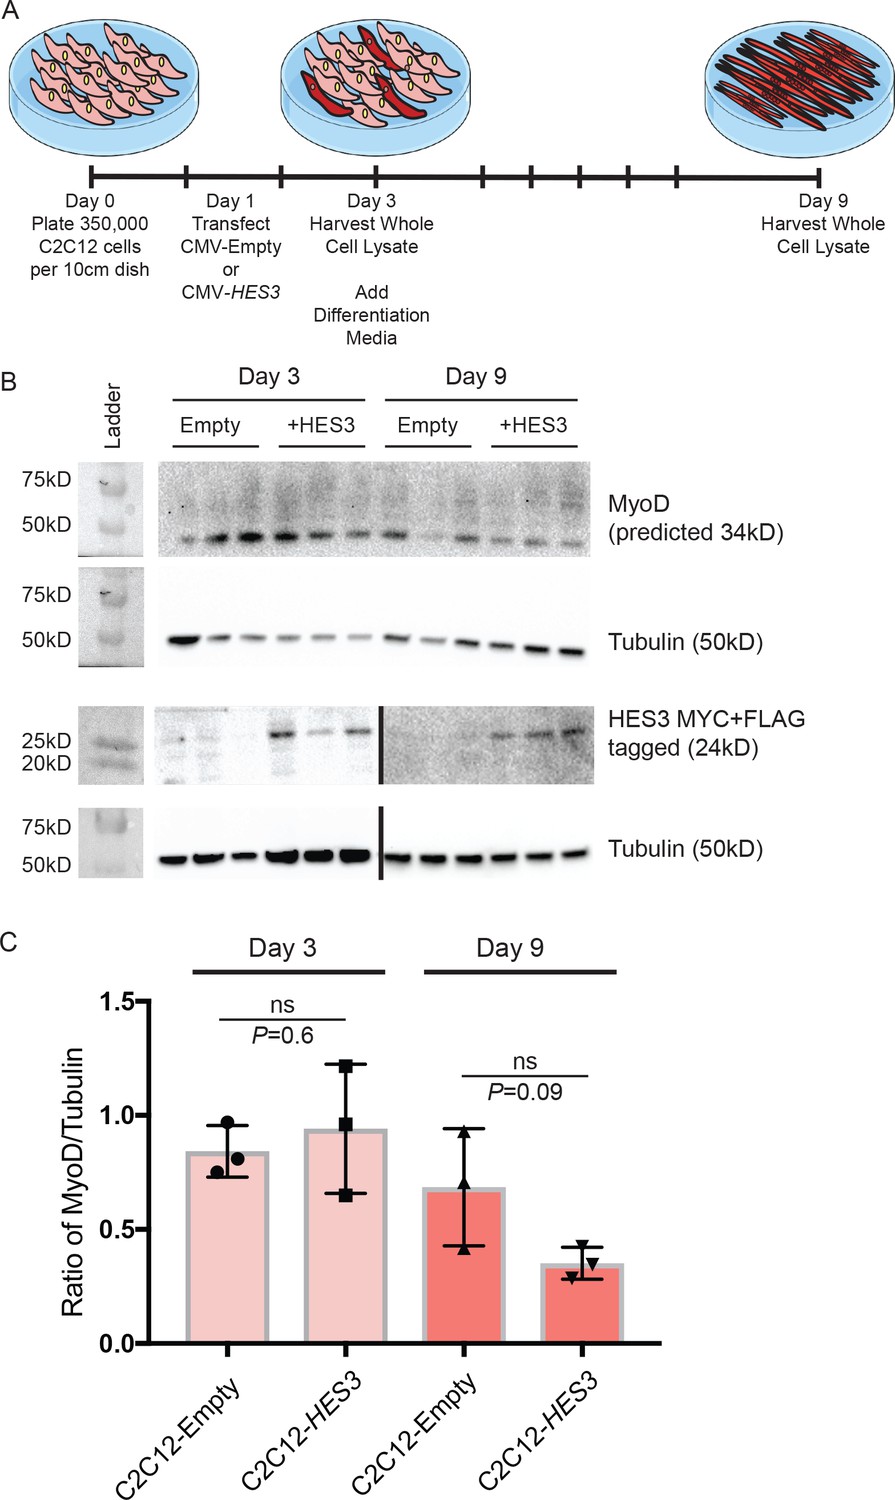
HES3 does not alter MyoD expression during fusion initiation but inhibits MyoD during terminal differentiation.
(A) C2C12 cells were transfected with CMV-Empty or CMV-HES3, allowed to become confluent, and then whole cell lysate harvested 4 days post plating. Remaining C2C12 conditions were changed to differentiation media, fused, and whole cell lysate was harvested at 9 days post plating. (B) The kinetic of MyoD protein expression was evaluated between the beginning and end of myogenic differentiation. Shown are representative Western blots for MyoD, MYC-HES3, and tubulin for three biological replicates from day 3 and day 9 of fusion. HES3 is presented on two independent blots (demarcated by a black line) between days 3 and 9. (C) Quantification of MyoD expression levels by densitometry. MyoD was normalized to the tubulin loading control. Plotted is the ratio of MyoD/Tubulin for each sample with n = 3 biological replicates per group ± SEM. Significance was assessed with a two-tailed Student’s t-test.
Figure 6
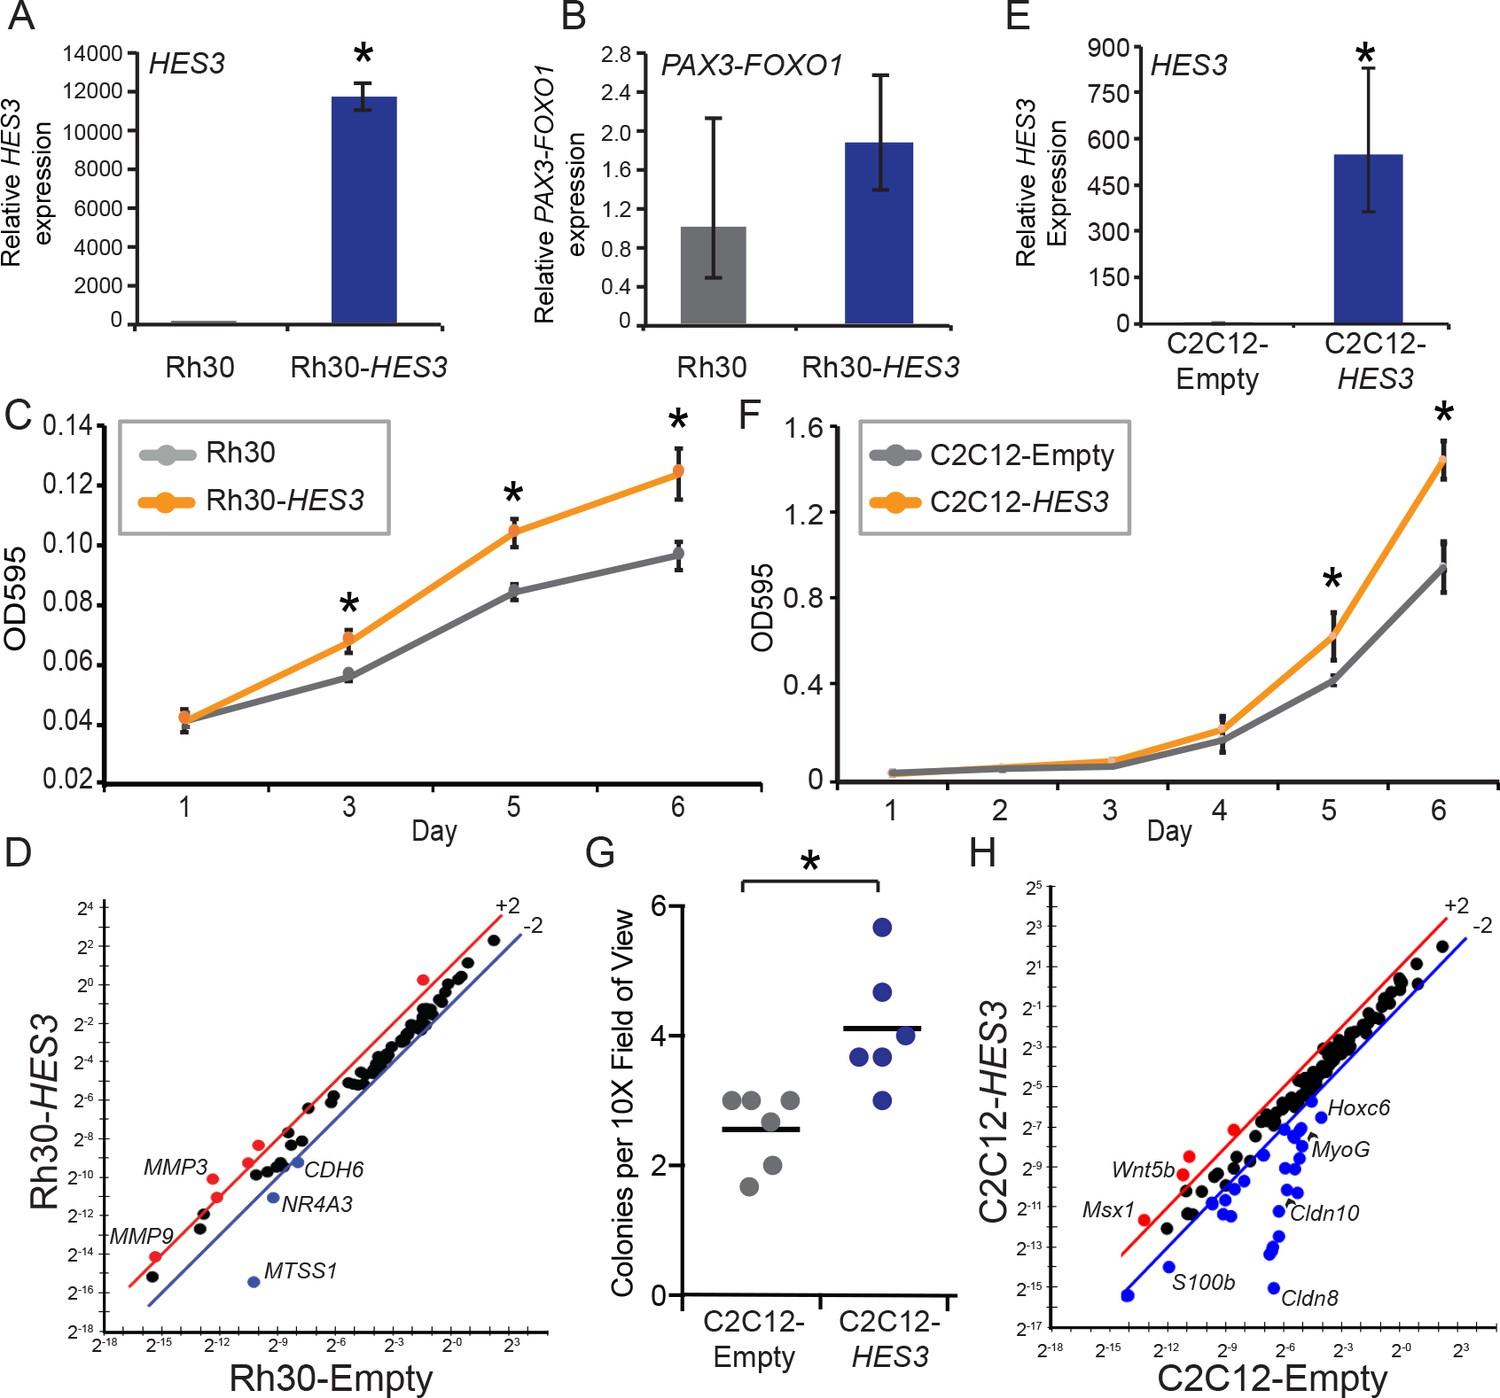
HES3 overexpression promotes pro-tumorigenic features in PAX3-FOXO1 RMS patient cells and mouse myoblasts.
(A) Rh30 cells stably express CMV-HES3 as evaluated by qRT-PCR. SD is derived from technical triplicates. (B) PAX3-FOXO1 levels were assessed by qRT-PCR on the same samples in A. SD is derived from technical triplicates. (C) Cells were seeded at a low density and timepoints taken on Days 1, 3, 5, 6 to assess cellular accumulation. At each timepoint, cells were fixed and stained with crystal violet. Plotted is the absorbance from each timepoint with n = 4 technical replicates ± SE. Each experiment was repeated two times with biological duplicates. (D) qPCR array of metastasis associated genes for Rh30-HES3 versus Rh30-Empty. Red indicates > 2-fold change above the mean, blue indicates > 2-fold change below the mean. (E) C2C12 cells stably expressed CMV-Empty or CMV-HES3, and qRT-PCR confirmed HES3 overexpression. SD is derived from technical triplicates. (F) C2C12 cells were seeded at a low density and timepoints taken on Days 1–6 to assess cellular accumulation. At each timepoint, cells were fixed and stained with crystal violet. Plotted is the absorbance from each timepoint with n = 4 technical replicates ± SD. Each experiment was repeated two times with biological duplicates. (G) Soft-agar colony formation assay was performed over 30 days for C2C12-Empty versus C2C12-HES3. Each data point is the mean of three images per well, across six technical replicates. Black bar indicates the mean. (H) qPCR array of rhabdomyosarcoma associated genes for C2C12-HES3 versus C2C12-Empty. Red indicates > 2-fold change above the mean, blue indicates > 2-fold change below the mean. In all panels * indicates p<0.05, two-tailed Student’s t-test.
Figure 7
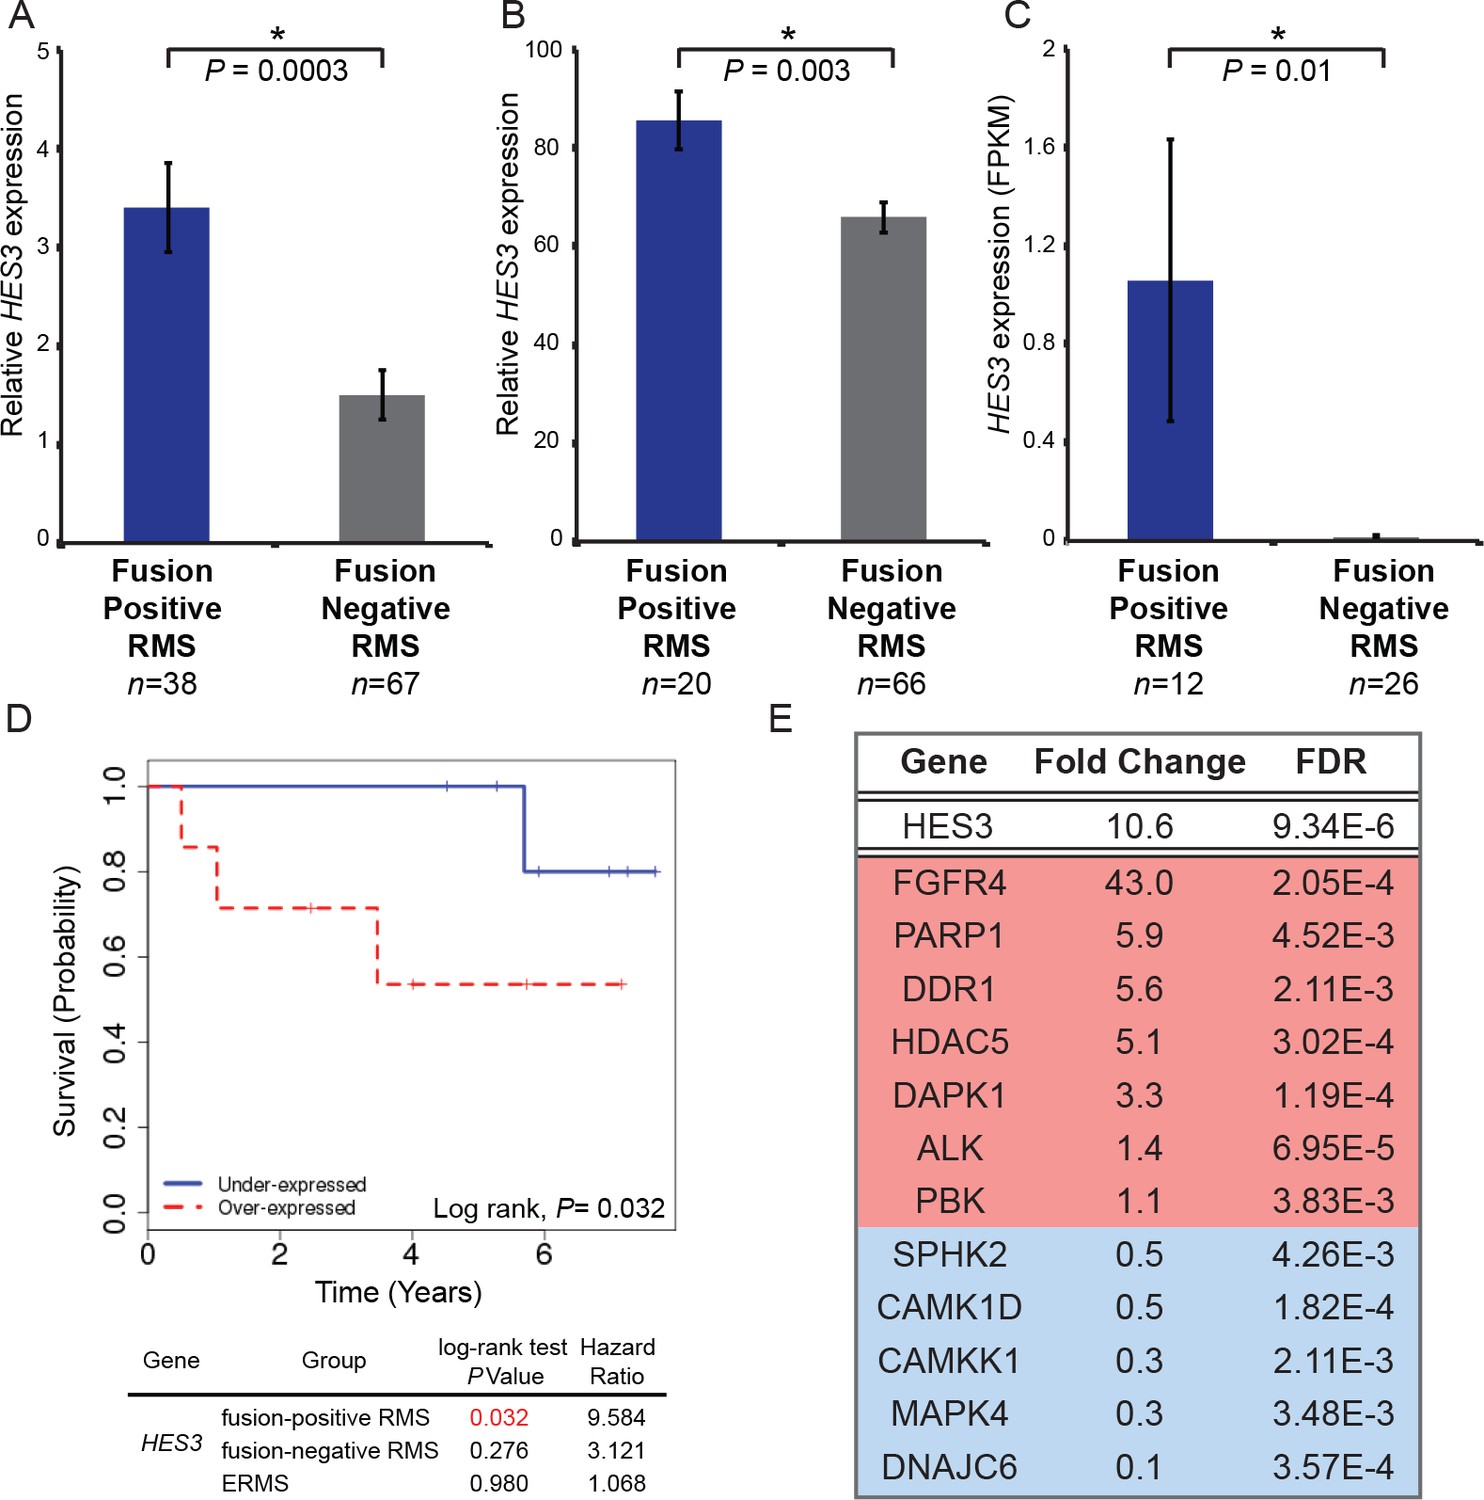
HES3 is overexpressed in fusion-positive RMS patient tumors, predicts reduced overall survival, and identifies potential therapeutic targets.
HES3 expression levels determined in fusion-positive ARMS versus fusion-negative ARMS/ERMS. (A) RNAseq data from Shern et al. (2014) . (B) HuEx data from Triche T, Skapek S; GEO: Accession Number GSE114621. (C) RNAseq data from Chen et al. (2013). p-Values were calculated based on two-tailed Student’s t-test (D) Survival curve of fusion-positive ARMS in the context of HES3 expression status (n = 7 per group). HES3 expression is derived from the HuEx data presented in B. (E) RMS patient tumors from Shern et al. (2014) were stratified based on high (FPKM > 1, n = 25) or low (FPKM < 1, n = 80) HES3 expression and these subsets evaluated for the most differentially expressed genes (FDR < 0.005). Listed are a subset of kinases or other druggable targets that are up-regulated (red) or down-regulated (blue) in the context of HES3 overexpression. Genomic datasets from analysis of human subjects are dbGaP controlled-access data, available to users submitting an approved data access request through the dbGaP Authorized Access System (https://dbgap.ncbi.nlm.nih.gov/aa/wga.cgi?page=login.
Tables
Key resources table
| Reagent type (species) or resource | Designation | Source or reference | Identifiers | Additional information | ||||
|---|---|---|---|---|---|---|---|---|
| Gene (Homo sapiens) | HES3 | NA | NM_001024598 | |||||
| Gene (Homo sapiens) | PAX3-FOXO1 | PMID:8275086; PMID:8221646 | NM_181457; NM_002015.3 | exons 1–7 of NM_181457 fused to exons 2–3 of NM_002015.3 | ||||
| Gene (Mus musculus) | Pax3 | NA | NM_008781 | |||||
| Gene (Danio rerio) | her3 | NA | NM_131080 | |||||
| Strain, strain background (Danio rerio AB) | AB Wildtype | Zebrafish International Resource Center (ZIRC) | ZIRC:ZL1 | https://zebrafish.org/fish/lineAll.php | ||||
| Strain, strain background (Danio rerio AB/TL) | AB\TL Wildtype | NA | Cross of AB and TL | |||||
| Strain, strain background (Danio rerio TL) | TL Wildtype | ZIRC | ZIRC:ZL86 | https://zebrafish.org/fish/lineAll.php | ||||
| Strain, strain background (Danio rerio WIK) | WIK Wildtype | ZIRC | ZIRC:ZL84 | https://zebrafish.org/fish/lineAll.php | ||||
| Strain, strain background (Danio rerio tp53M214K mutant) | tp53M214K mutant | PMID:15630097; available from ZIRC | ZIRC:ZL1057 | https://zebrafish.org/fish/lineAll.php | ||||
| Genetic reagent | Tol2 transposase mRNA | PMID:16959904 | Injected at 50 ng/uL | |||||
| Cell line (Mus musculus) | C2C12 | ATCC | ATCC:CRL-1772 | Maintained in DMEM + 10% FBS+1X Antimycotic-Antibiotic | ||||
| Cell line (Homo sapiens) | Rh30 | ATCC | ATCC:CRL-2061 | Maintained in RPMI-1640 + 10% FBS+1X Antimycotic-Antibiotic | ||||
| Transfected construct (Homo sapiens) | CMV-HES3 (MYC and FLAG tagged) | Origene | Origene:RC224630 | |||||
| Transfected construct (NA) | CMV-Empty | this paper | HES3 excised using EcoR1 and Mlu1 and re-ligated | |||||
| Antibody | MF20 (mouse monoclonal) | Developmental Studies Hybridoma Bank | DSHB:MF20c | 1:40 in cells, 1:100 in zebrafish embryo whole mounts, 1:1000 Western blot | ||||
| Antibody | alpha-Tubulin DM1A (mouse monoclonal) | Cell Signaling | Cell Signaling:3873 | 1:1000 dilution | ||||
| Antibody | MyoD 5.8A (mouse monoclonal) | Thermo | Thermo:MA5-12902 | 1:1000 dilution | ||||
| Antibody | MYC 71D10 (rabbit monoclonal) | Cell Signaling | Cell Signaling:2278 | 1:1000 dilution | ||||
| Antibody | GFP (rabbit polyclonal) | MBL International Corporation | MBL:598 | 1:1000 dilution | ||||
| Antibody | GFP-488 (rabbit polyclonal) | Thermo | Thermo:A-21311 | 1:500 dilution | ||||
| Antibody | Alexa 488 or 594 secondaries | Thermo | 1:500 dilution | |||||
| Antibody | HRP conjugate secondaries | BioRad | 1:20000 dilution | |||||
| Other | DAPI stain (ProLong Gold Antifade mounting media with DAPI) | Thermo | Thermo:P36931 | |||||
| Recombinant DNA reagent | p5E beta actin | PMID:17937395 | ||||||
| Recombinant DNA reagent | p5E cmv | PMID:17937395 | ||||||
| Recombinant DNA reagent | p5E mcs | PMID:17937395 | ||||||
| Recombinant DNA reagent | p5E ubi | PMID:21138979; available from Addgene | Addgene:27320 | |||||
| Recombinant DNA reagent | p5E unc503 | PMID:23444339; available from Addgene | Addgene:64020 | |||||
| Recombinant DNA reagent | p5E fli1a | PMID:17948311; available from Addgene | Addgene:31160 | |||||
| Recombinant DNA reagent | p5E mitfa | James Lister; available from Addgene | Addgene:81234 | |||||
| Recombinant DNA reagent | pmE beta globin splice acceptor | PMID:15239961 | ||||||
| Recombinant DNA reagent | pmE GFP2A | PMID:17941043 | ||||||
| Recombinant DNA reagent | pmE mCherry2A | PMID:17941043 | ||||||
| Recombinant DNA reagent | p3E PAX3-FOXO1 | this paper | attb2r/attb3 sites added with primers in Supplementary file 3 by high-fidelity PCR | |||||
| Recombinant DNA reagent | p3E Pax3 | this paper | attb2r/attb3 sites added with primers in Supplementary file 3 by high-fidelity PCR | |||||
| Recombinant DNA reagent | p3E HES3 | this paper | attb2r/attb3 sites added with primers in Supplementary file 3 by high-fidelity PCR | |||||
| Recombinant DNA reagent | p3E SV40 late poly A | PMID:17937395 | ||||||
| Recombinant DNA reagent | p3E 2A-mCherry | PMID:23462469; available from Addgene | Addgene:26031 | |||||
| Recombinant DNA reagent | pDONRP2R-P3 (3′ donor vector; attP2R-P3 flanking chlor/ccdB cassette) | Invitrogen | Invitrogen:pDONR P2R-P3 | Used to generate p3E's from this paper | ||||
| Recombinant DNA reagent | pDestTol2pA2 destination vector | PMID:17937395 | ||||||
| Recombinant DNA reagent | BetaActin-GFP2A-pA | this paper | Generated by Gateway Cloning | |||||
| Recombinant DNA reagent | BetaActin-mCherry2A-pA | this paper | Generated by Gateway Cloning | |||||
| Recombinant DNA reagent | BetaActin-GFP2A- 2AmCherry | this paper | Generated by Gateway Cloning | |||||
| Recombinant DNA reagent | BetaActin-mCherry2A-Pax3 | this paper | Generated by Gateway Cloning | |||||
| Recombinant DNA reagent | BetaActin-GFP2A-Pax3 | this paper | Generated by Gateway Cloning | |||||
| Recombinant DNA reagent | BetaActin-mCherry2A-HES3 | this paper | Generated by Gateway Cloning | |||||
| Recombinant DNA reagent | BetaActin-GFP2A-PAX3FOXO1 | this paper | Generated by Gateway Cloning | |||||
| Recombinant DNA reagent | CMV-GFP2A-pA | this paper | Generated by Gateway Cloning | |||||
| Recombinant DNA reagent | CMV-mCherry2A-pA | this paper | Generated by Gateway Cloning | |||||
| Recombinant DNA reagent | CMV-GFP2A-Pax3 | this paper | Generated by Gateway Cloning | |||||
| Recombinant DNA reagent | CMV-mCherry2A-HES3 | this paper | Generated by Gateway Cloning | |||||
| Recombinant DNA reagent | CMV-GFP2A-PAX3FOXO1 | this paper | Generated by Gateway Cloning | |||||
| Recombinant DNA reagent | ubi-GFP2A-PAX3FOXO1 | this paper | Generated by Gateway Cloning | |||||
| Recombinant DNA reagent | mitfa-GFP2A-PAX3FOXO1 | this paper | Generated by Gateway Cloning | |||||
| Recombinant DNA reagent | fli1-GFP2A-PAX3FOXO1 | this paper | Generated by Gateway Cloning | |||||
| Recombinant DNA reagent | unc503-GFP2A-PAX3FOXO1 | this paper | Generated by Gateway Cloning | |||||
| Recombinant DNA reagent | SpliceAcceptor- GFP2A-PAX3FOXO1 | this paper | Generated by Gateway Cloning | |||||
| Sequence-based reagent | GFP Morpholino | Gene Tools | Gene Tools: GFP Morpholino | (5' ACAGCTCCTCGCCC TTGCTCACCAT 3') | ||||
| Commercial assay or kit | ApopTag Red In Situ Apoptosis Detection Kit | Millipore | Millipore:S7165 | |||||
| Commercial assay or kit | Affymetrix Zebrafish Gene 1.1 ST Array strip | Affymetrix | Affymetrix:901802 | |||||
| Commercial assay or kit (Mus musculus) | M384 Rhabdomy osarcoma 384 well panel | BioRad | BioRad:M384 Rhabdomyosarcoma | |||||
| Commercial assay or kit (Homo sapiens) | H384 Tumor Metastasis (SAB Target List) 384 well panel | BioRad | BioRad:H384 Tumor Metastasis (SAB Target List) | |||||
| Chemical compound, drug | Geneticin (G418) | Thermo | Thermo:10131027 | Select at 1 mg/mL | ||||
| Software, algorithm | ImageJ | http://imageJ.nih.gov/ij | ||||||
| Software, algorithm | GraphPad Prism 7.0 c | https://www.graphpad.com | ||||||
| Software, algorithm | Rv3.3.1 | https://www.R-project.org | ||||||
Additional files
-
Supplementary file 1
Total number of zebrafish analyzed and resulting tumors for Beta Actin, CMV, and ubiquitin driven PAX3-FOXO1 in wildtype AB or AB/TL strains or tp53M214K/M214K homozygous mutants.
- https://doi.org/10.7554/eLife.33800.018
-
Supplementary file 2
Total number of zebrafish analyzed and the mean age of screening for mitfa, fli1, unc503, and mcs (splice acceptor) driven PAX3-FOXO1.
- https://doi.org/10.7554/eLife.33800.019
-
Supplementary file 3
List of oligonucleotide primer sequences.
- https://doi.org/10.7554/eLife.33800.020
-
Transparent reporting form
- https://doi.org/10.7554/eLife.33800.021
Download links
A two-part list of links to download the article, or parts of the article, in various formats.
Downloads (link to download the article as PDF)
Open citations (links to open the citations from this article in various online reference manager services)
Cite this article (links to download the citations from this article in formats compatible with various reference manager tools)
PAX3-FOXO1 transgenic zebrafish models identify HES3 as a mediator of rhabdomyosarcoma tumorigenesis
eLife 7:e33800.
https://doi.org/10.7554/eLife.33800


