Free-energy simulations reveal molecular mechanism for functional switch of a DNA helicase
- University of Illinois at Urbana-Champaign, United States
- Beckman Institute for Advanced Science and Technology, United States
Figures
Figure 1 with 1 supplement
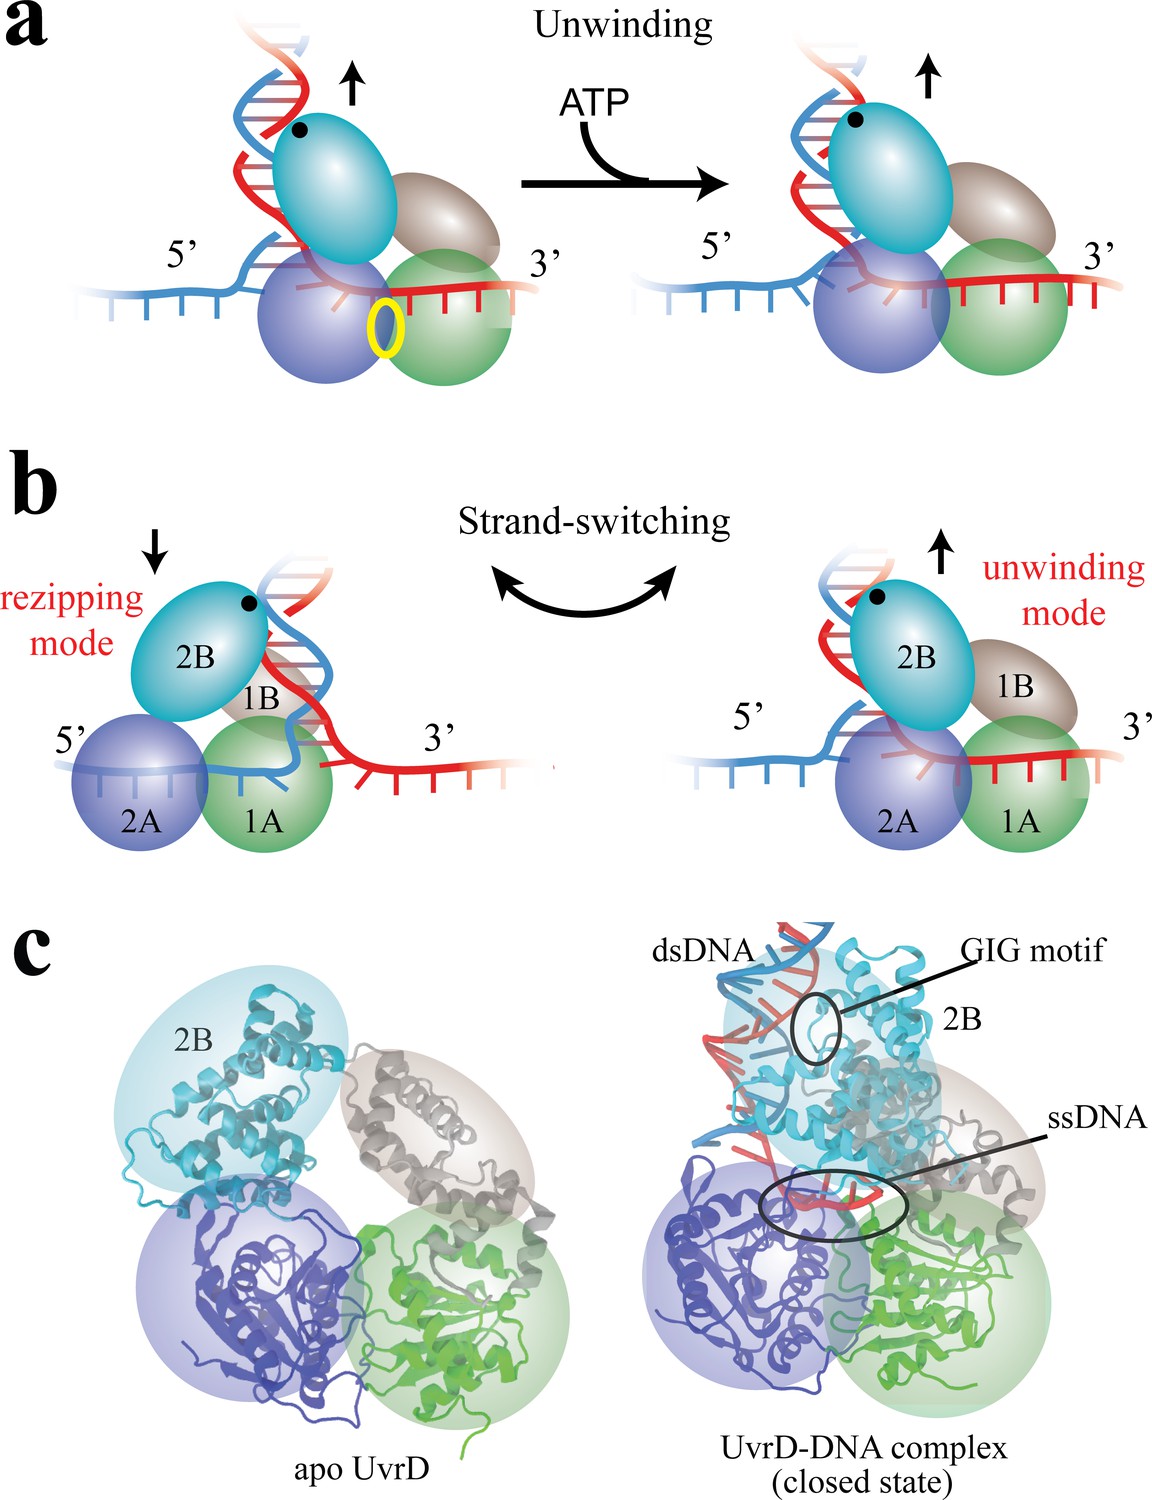
Functional switching of UvrD helicase.
(a) Schematic illustration of unwinding by a DNA helicase (UvrD). The helicase uses chemical energy from ATP (hydrolyzed at the site labeled with a yellow ellipse between two motor domains) to unwind dsDNA. (b) A proposed model of UvrD functional switching at the fork junction. 1A, 2A, 1B and 2B domains are labeled in green, blue, gray and cyan, respectively. The UvrD conformation on the left represents the rezipping state whereas the conformation on the right represents the unwinding state. GIG motif (residues 414 to 422), drawn as a black dot, is important for UvrD interacting with dsDNA. (c) Crystal structures for apo UvrD (3LFU) and UvrD-DNA complex (2IS2, the closed state).
Figure 1—figure supplement 1
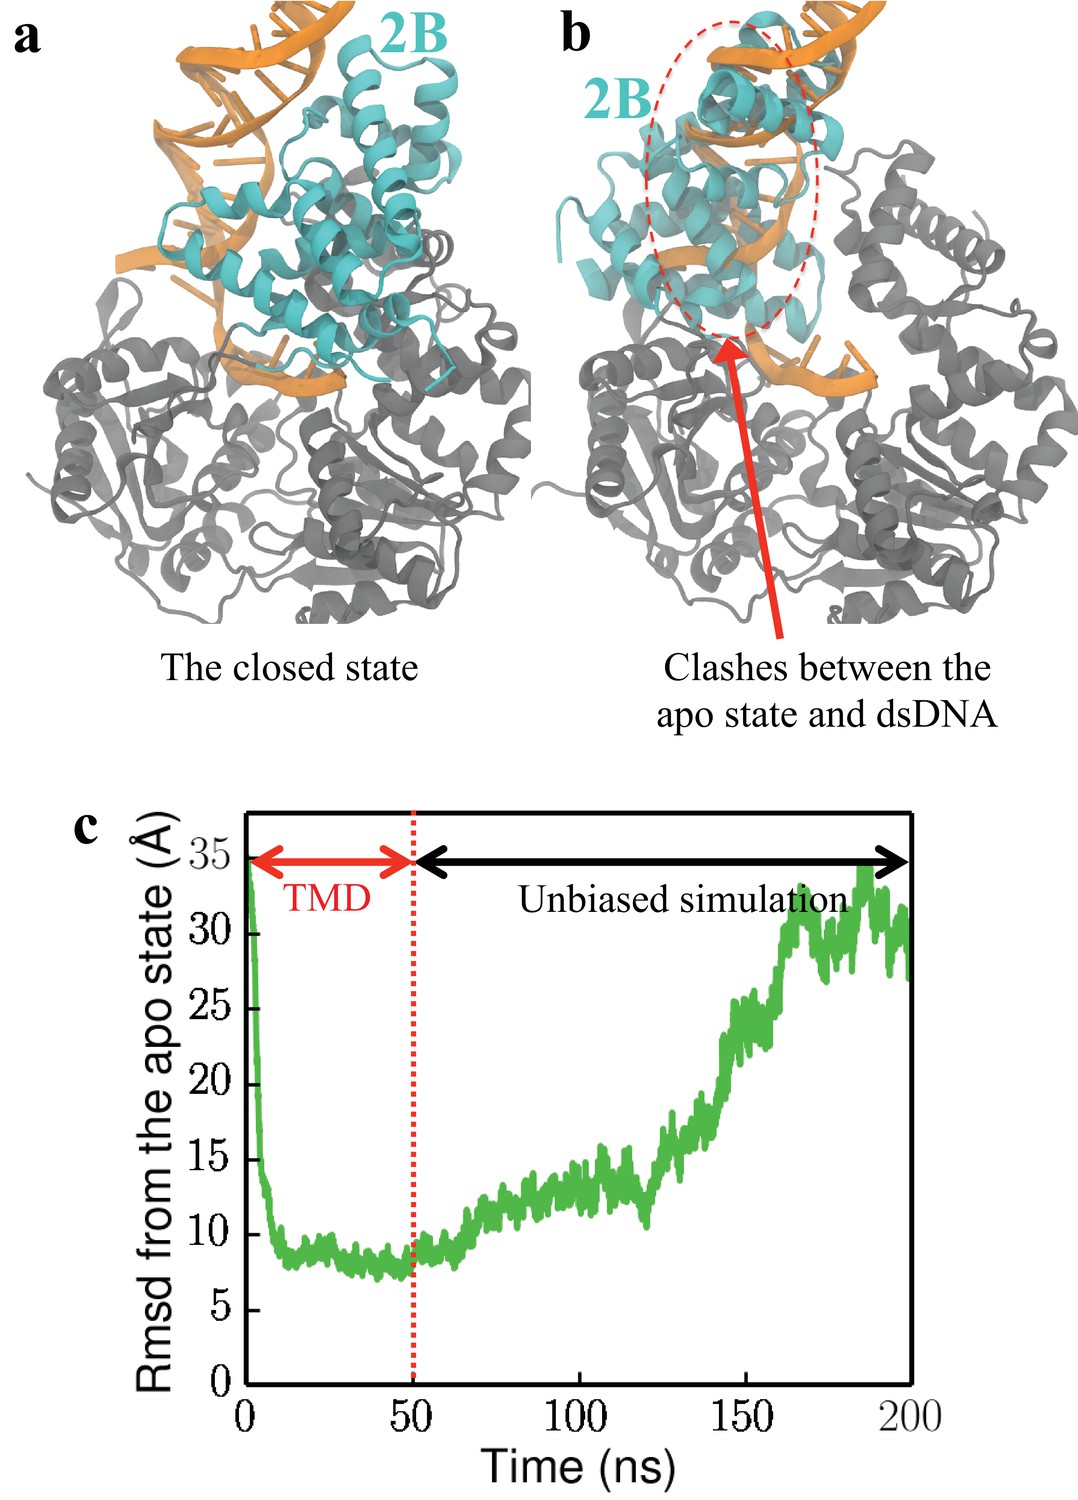
UvrD is found unlikely to adopt the apo conformation when bound to a fork junction.
(a) The closed-state structure of UvrD (2IS2). The 2B domain is shown in cyan, whereas the remaining 1A/2A/1B domains are shown in gray. The fork junction is shown in orange. (b) The apo-state structure (3LFU) is aligned to the closed-state structure. Major clashes are detected between 2B of the apo state and the fork junction. (c) In a forced rotation simulation of the 2B domain at the DNA junction (DNA is free to move), the change of RMSD from the apo state (calculated using C atoms of the 2B domain) is shown. The plot shows a two-stages simulation: starting from RMSD = 35 Å, the first stage is a targeted MD simulation driving UvrD to the apo state from the closed state in 50 ns; the second stage is an unbiased simulation which lasts 150 ns. Eventually UvrD returns to the closed state, indicating that the apo state is very unfavorable.
Figure 2 with 1 supplement

Projection of crystal structures onto the first two PCs from PCA.
The structures were obtained through a pdb survey. The structures in the middle of the panel show three structural clusters of the 2B domain, labeled red (closed cluster), magenta (tilted cluster) and pink (apo cluster), respectively. The remaining three domains (1A/2A/2B), which are labeled in gray, only have very small structural variation among the homologs. PC1 represents a rotation motion of the 2B domain around the z-axis, whereas PC2 represents a tilting motion away from the z-axis (see Figure 2—figure supplement 1b).
Figure 2—figure supplement 1

First 2 PCs contribute most of the motion of the 2B domain in the closed to tilted state transition.
(a) Involvement co-efficiency of the first 10 PCs for the displacement between the closed cluster and the tilted cluster. (b) Directions of motions along the first two PCs shown on the closed state structure.
Figure 3 with 1 supplement
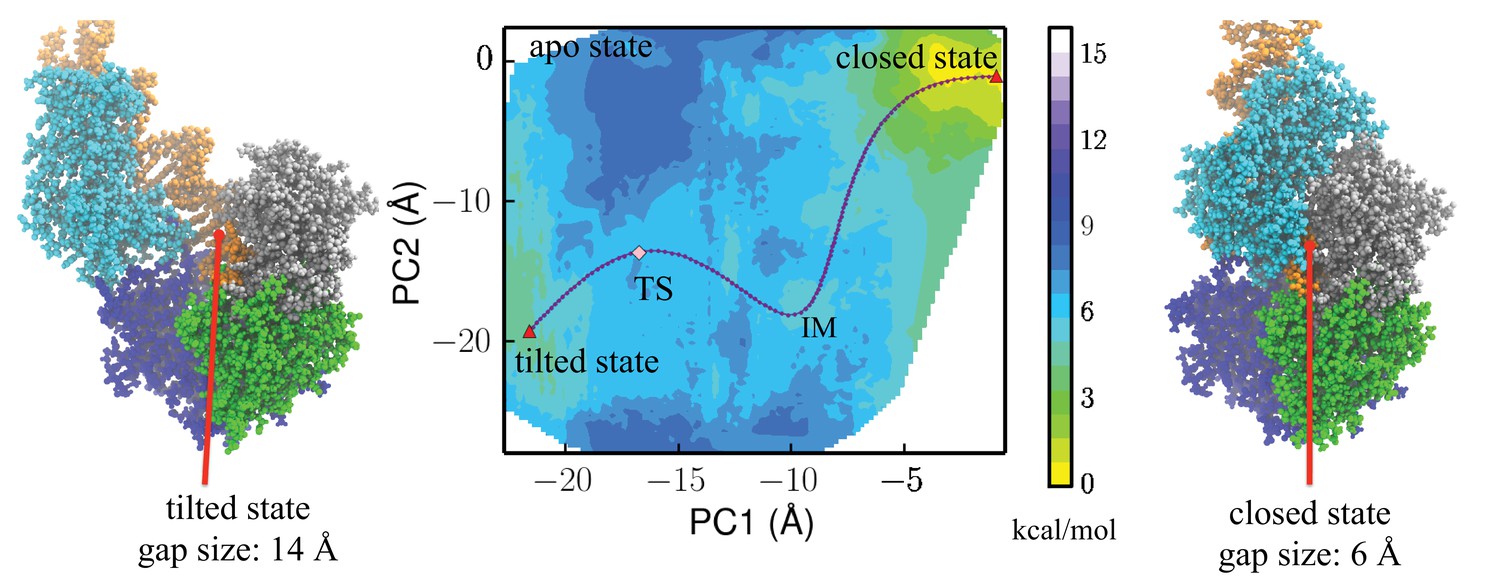
Free-energy profile generated using the projections along the first 2 PCs.
The transition state (TS) and an intermediate state (IM) are located between the closed-to-tilted transition (the predicted tilted state PDB is provided as Supplementary file 1). Right and left panels: snapshots for the closed and tilted states are shown along with the gap size, which is defined by the minimal C distance between 2B and 1B domains.
Figure 3—figure supplement 1
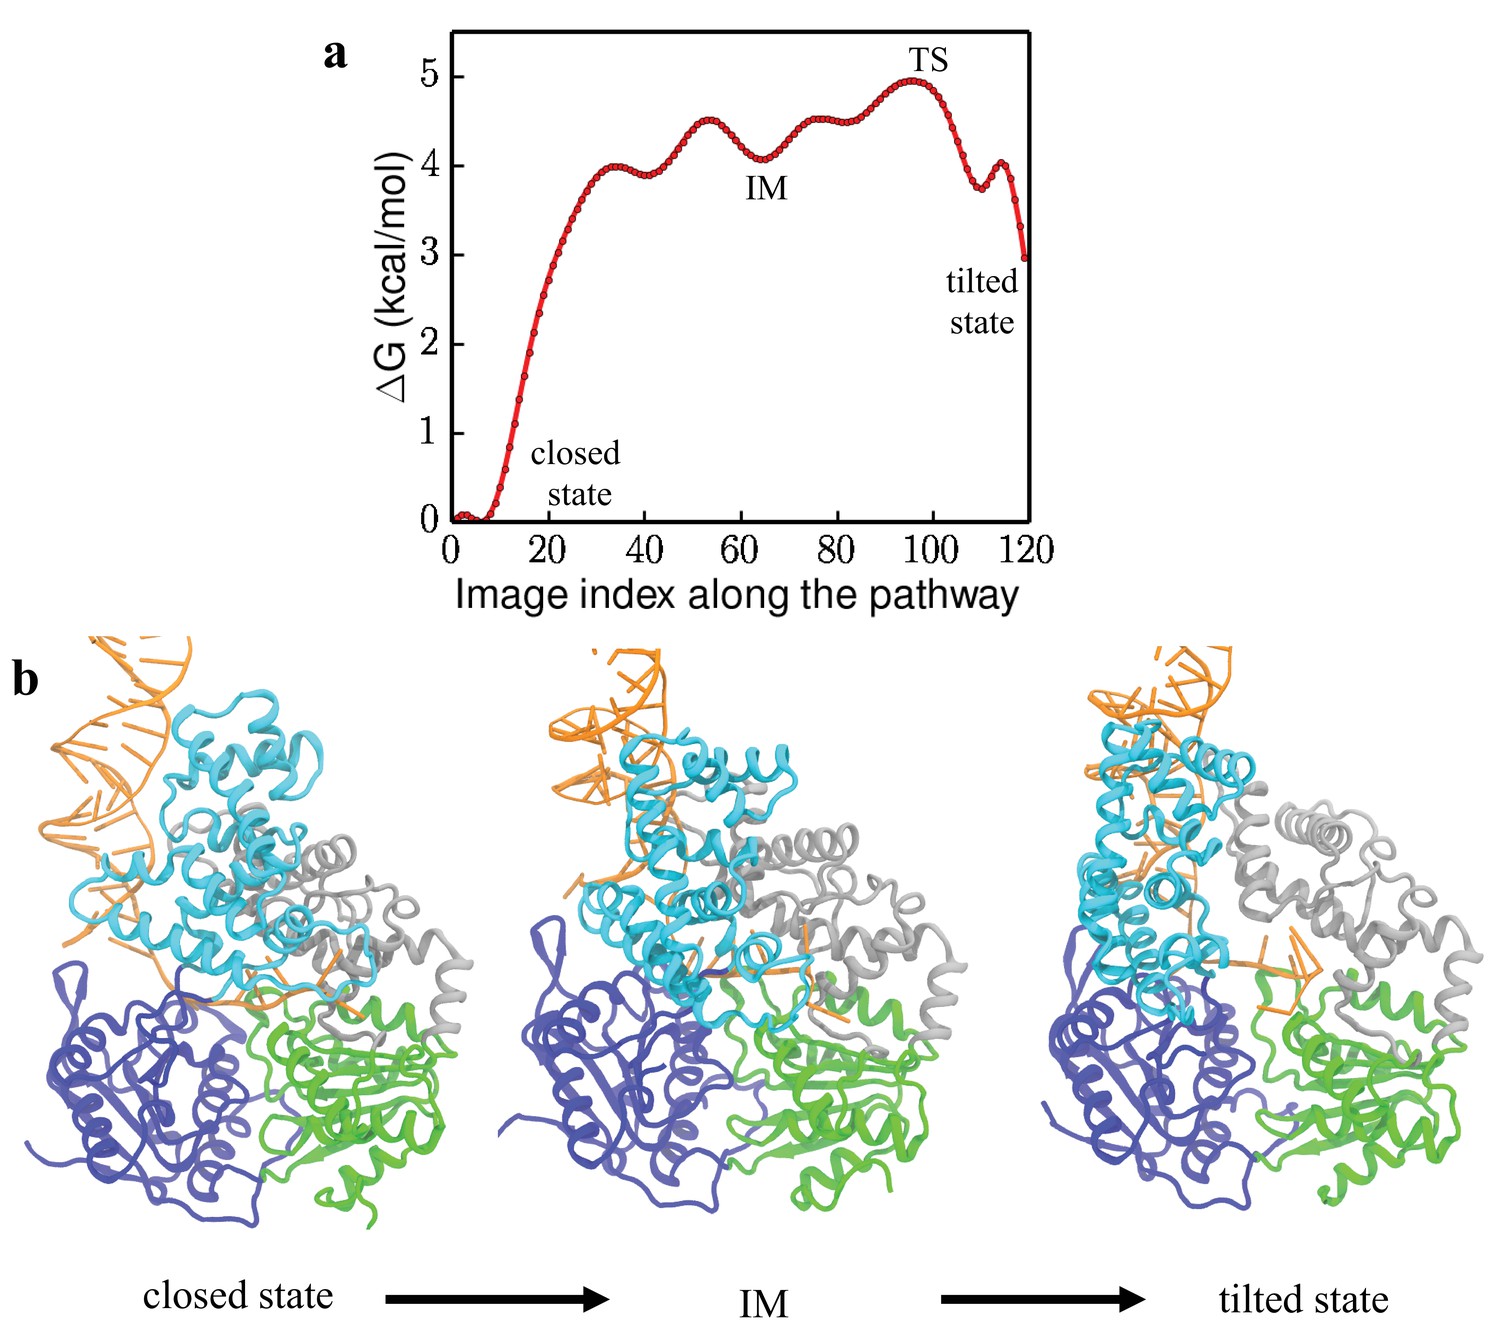
Free-energy profile and key conformations along the transition pathway.
(a) 1D free-energy profile along the lowest free-energy path (LFEP) (Figure 3). The x-axis is the index of the 120 data points (images) along the LFEP. The positions of the transition state TS and the intermediate state IM are labeled in the figure. (b) Conformations of UvrD-DNA complex during the closed to tilted transition.
Figure 4
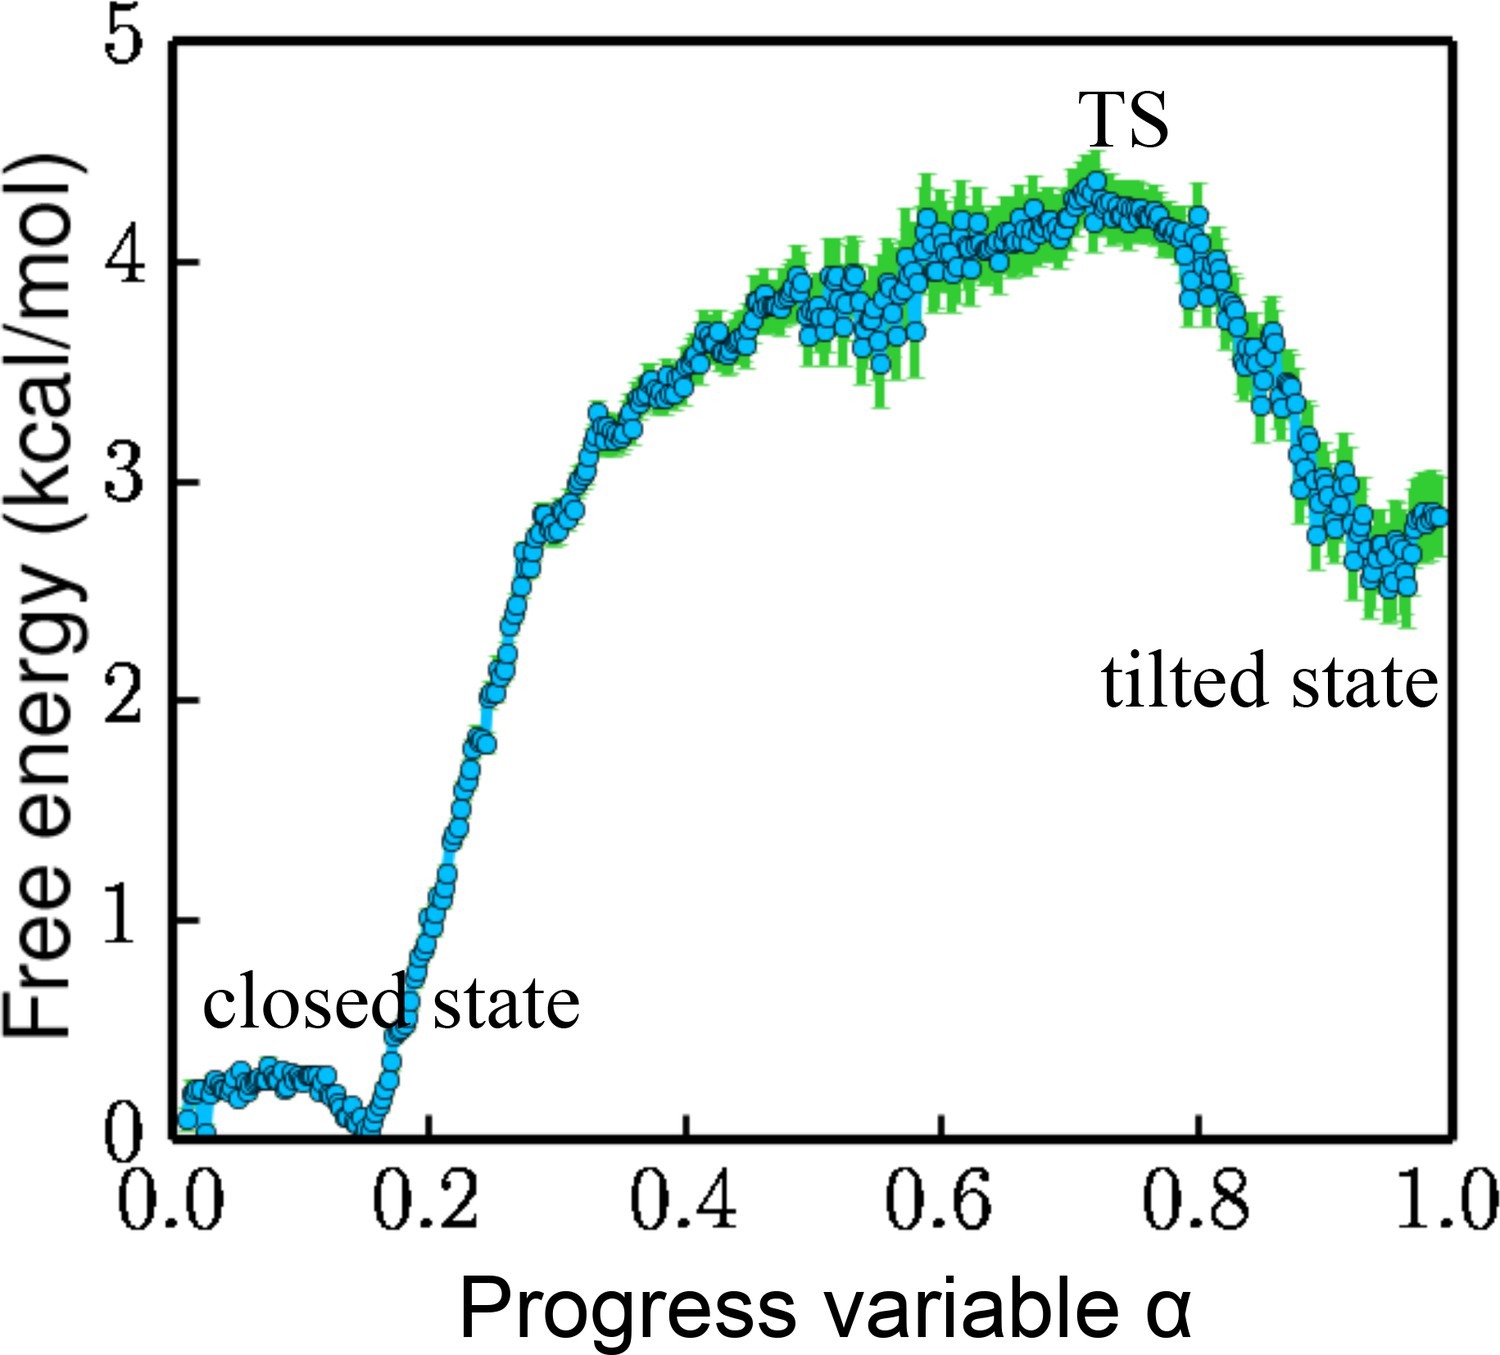
Free energy projected along the progress variable .
The value of α ranges from 0 to 1.0 (the closed state being 0 and the tilted state being 1.0). The standard error is calculated by a bootstrapping error analysis procedure.
Figure 5 with 4 supplements

Comparing experimental FRET efficiency distributions to the distributions obtained from simulations.
(a) Experimental distributions for the unwinding and rezipping states. The dotted lines show the peak positions for the two states. (b) Simulated FRET efficiency distribution for the closed and tilted states.
Figure 5—figure supplement 1
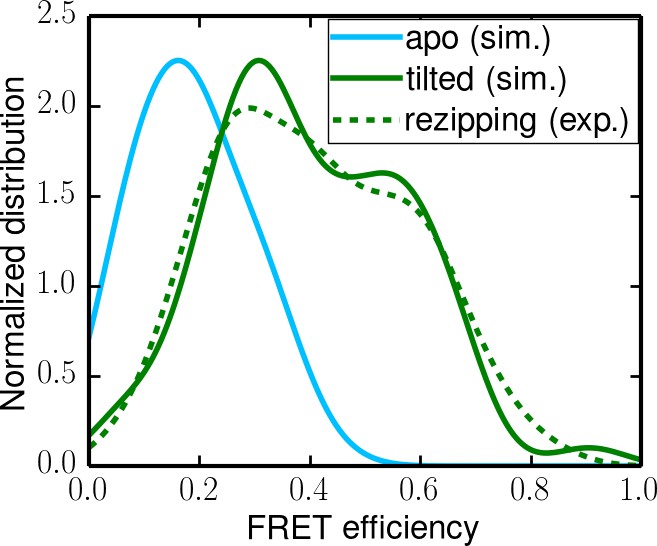
Simulated apo-state FRET distribution (solid cyan curve) and its comparison with the distributions for the rezipping state (dotted green curve, from experiments) and the tilted state (solid green curve, from simulations).
https://doi.org/10.7554/eLife.34186.012
Figure 5—figure supplement 2
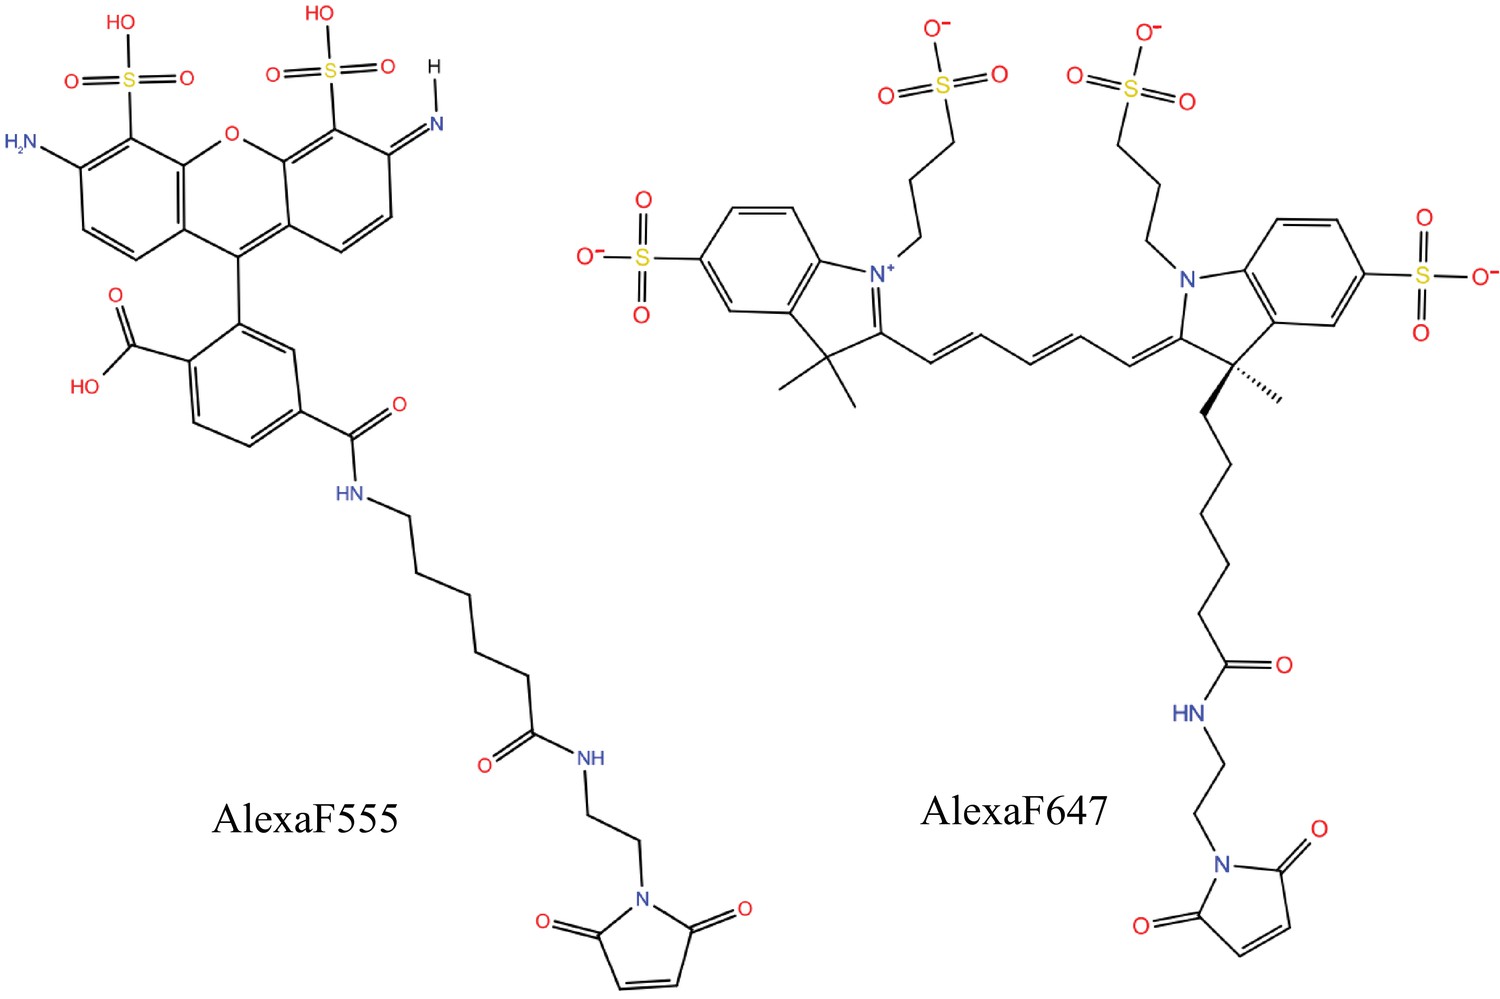
Molecular structures of the dyes (AlexaF555/AlexaF647) used in the simulations.
https://doi.org/10.7554/eLife.34186.013
Figure 5—figure supplement 3
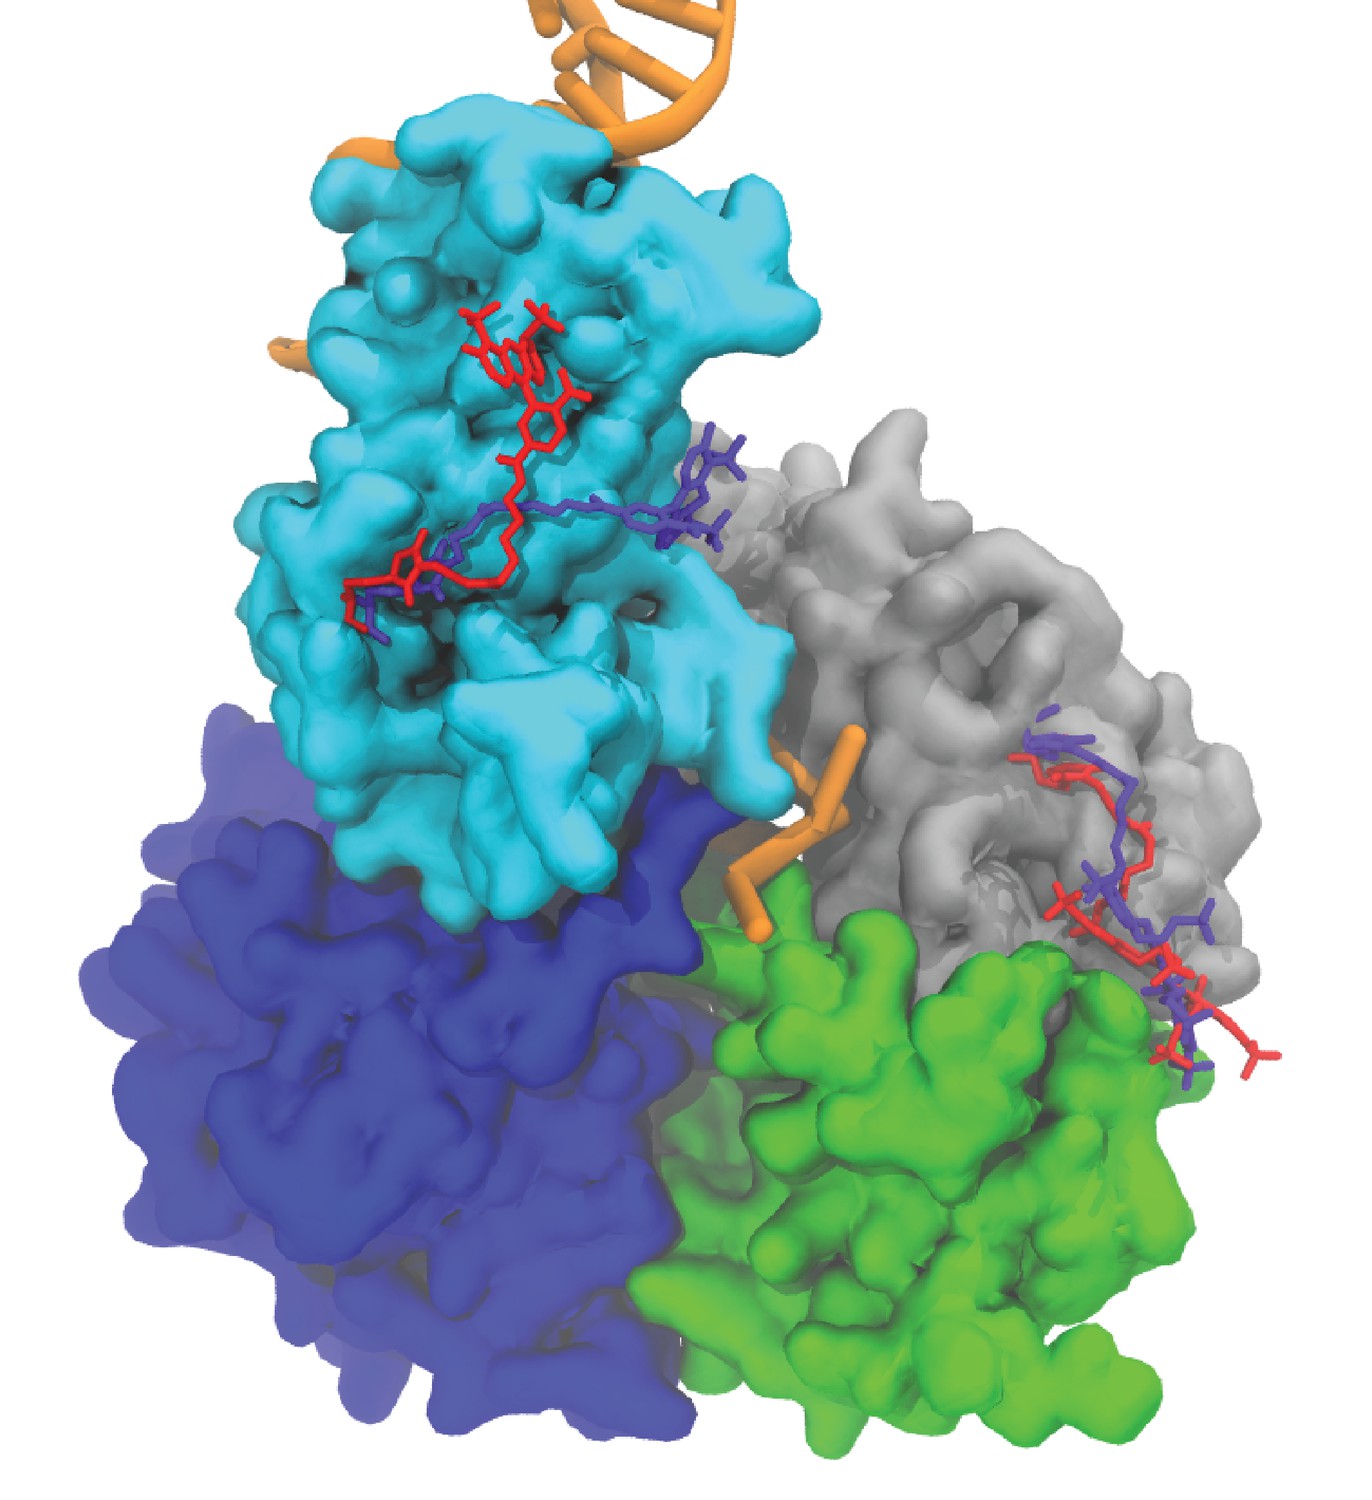
Averaged fluorophore pair conformations in the tilted state at different FRET efficiency values.
The averaged conformation of the pair at 0.3 FRET efficiency is shown in red. The averaged conformation of the pair at 0.6 FRET efficiency is shown in purple.
Figure 5—figure supplement 4
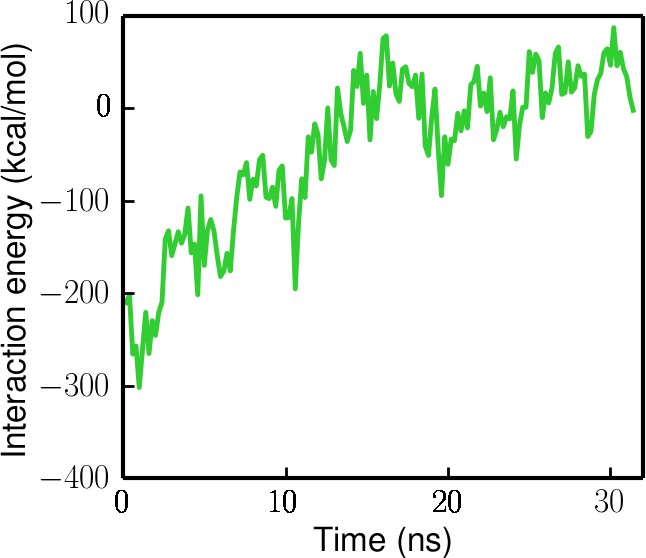
Interaction energy (electrostatic + Van der Waals) between the ssDNA and the ssDNA-binding domains (1A/2A/1B) during the ssDNA disengagement simulation (the protein is restrained in the tilted state).
https://doi.org/10.7554/eLife.34186.015
Figure 6 with 1 supplement

Interaction changes between the GIG motif and dsDNA.
Here, we use the DNA base ID to represent the closest DNA residue in contact with T422 (part of the GIG motif) on strand A (red) or its complementary residue on strand B (blue). T422 engages with the backbone phosphate of residue 18 of strand A in the closed state, whereas it engages with the phosphate of residue 14 of strand B in the tilted state.
Figure 6—figure supplement 1

Evolution of the DNA base ID in contact with the GIG motif during the transition from the closed state to the tilted state (along the lowest free-energy path).
https://doi.org/10.7554/eLife.34186.017
Figure 7
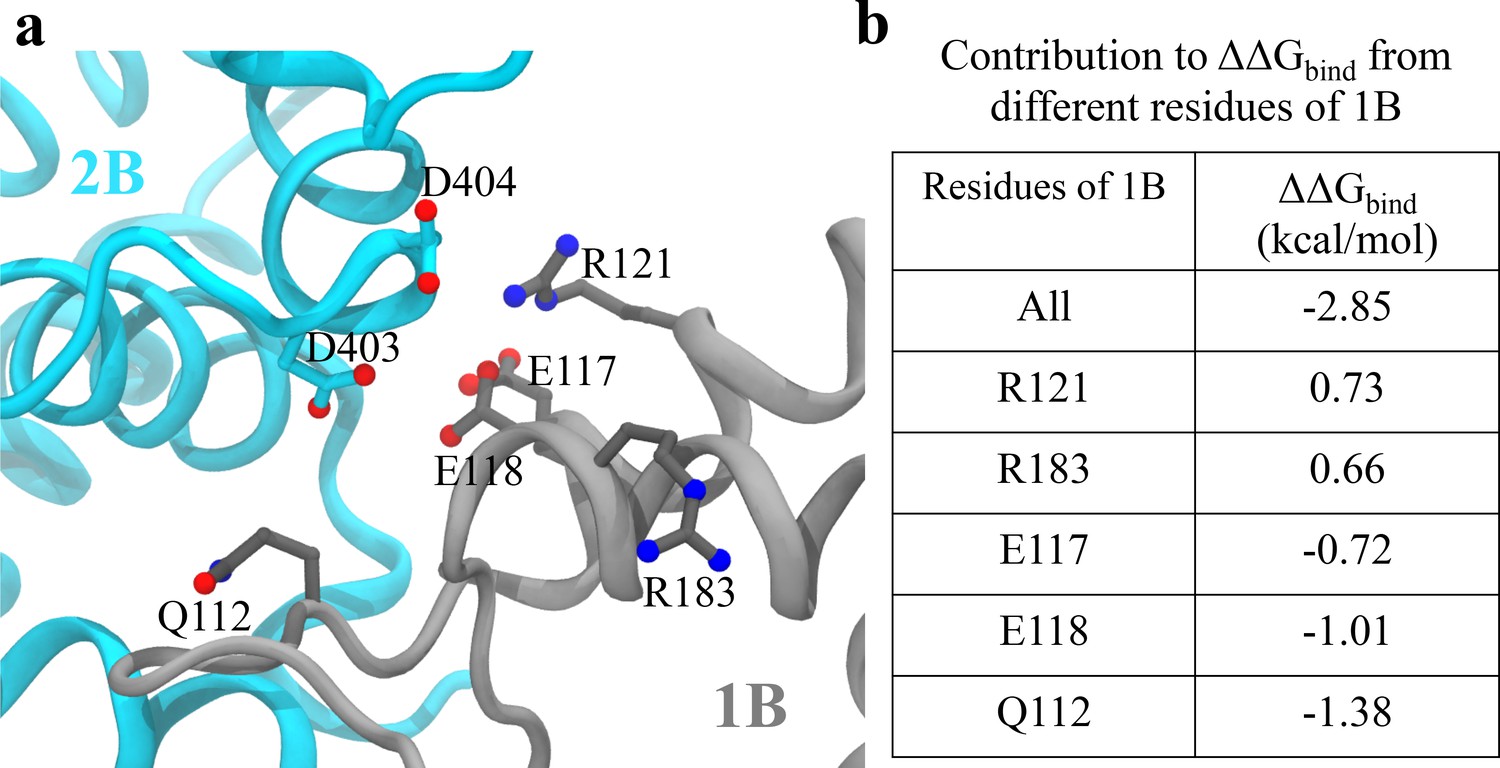
Analysis of key interactions at the 1B-2B interface for the UvrD303 mutant.
(a) The configuration of key residues involved in the interaction between D403/D404 (belonging to 2B) and the 1B domain. 2B is shown in cyan, whereas 1B is shown in gray. (b) A table showing the contribution to from key residues of 1B upon the mutation. Only residues with kcal/mol are shown, where is the residue index. Positive values indicate destabilization effects of the mutation; negative values indicate stabilization effects.
Figure 8 with 3 supplements
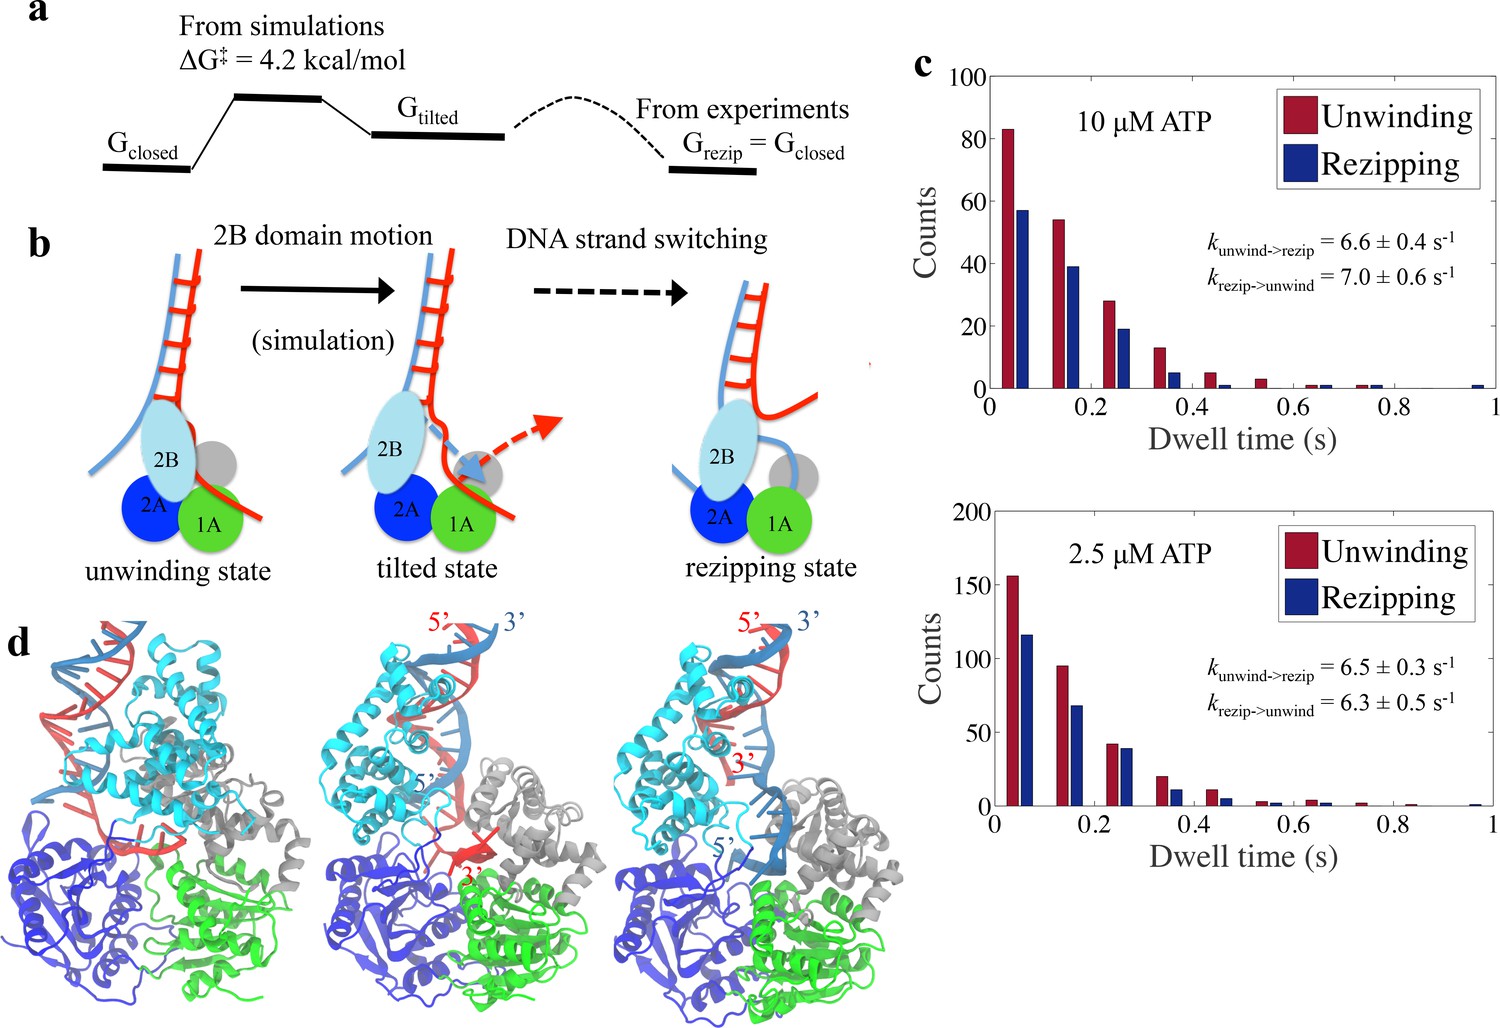
Physical mechanism of UvrD functional switching.
(a) Illustration for the whole free-energy landscape of ssDNA strand switching enabled by UvrD conformational transition. (b) Schematic representation showing the 2-step process of how UvrD switches the ssDNA strand along which the motor domain walks. (c) Dwell time distributions for the unwinding and rezipping states at 10 M and 2.5 M ATP concentration based on the measured traces from optical tweezers (Materials and methods). (d) The structural models for the unwinding, tilted and rezipping states are shown from left to right. The structural model for the rezipping state was obtained from the tilted state after the ssDNA strand switching as illustrated in Methods. Strands A and B of the dsDNA are shown in red and blue, respectively.
Figure 8—figure supplement 1
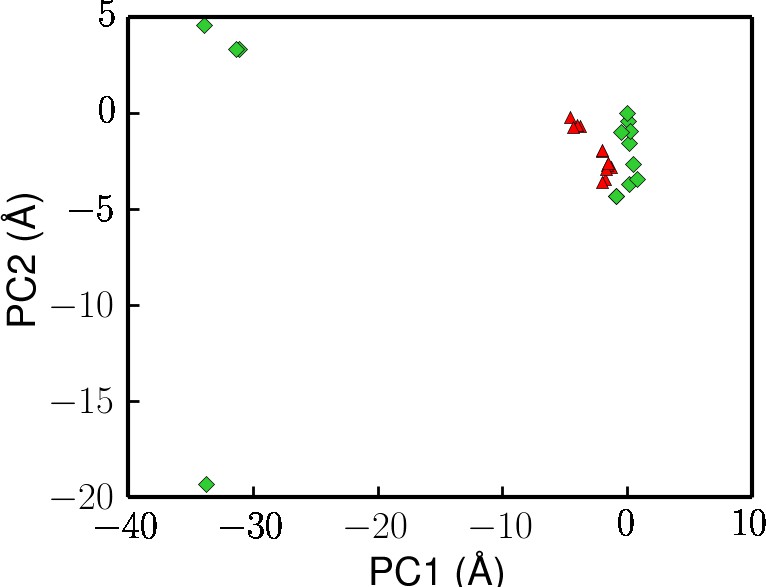
Projection of crystal structures onto the first two principal components from PCA (same data points used in Figure 2).
Here, the UvrD structures with ATP or non-hydrolysable analog molecules bound are colored in red.
Figure 8—figure supplement 2

Rezipping-state RMSD (calculated using the protein non-hydrogen atoms) from the tilted state during the 100 ns equilibration simulation.
https://doi.org/10.7554/eLife.34186.021
Figure 8—figure supplement 3
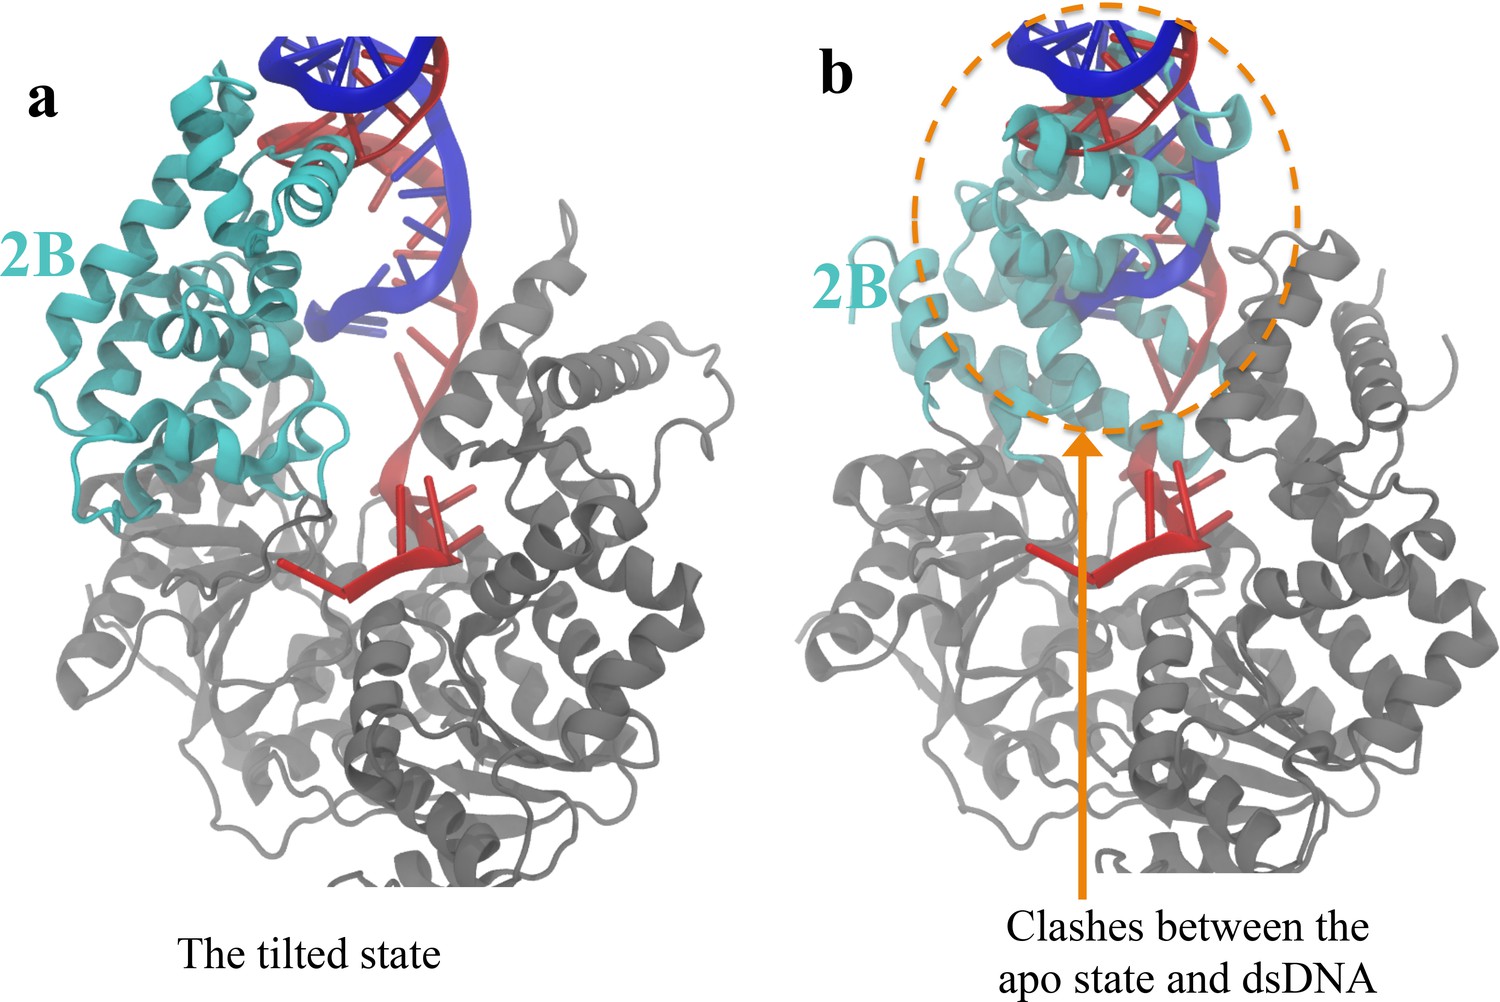
The apo structure is not accessible after the closed-to-tilted transition at the DNA junction.
(A) The tilted conformation obtained from the simulations. The 2B domain is shown in cyan, whereas 1A/2A/1B are shown in gray. Strands A and B of the dsDNA are shown in red and blue, respectively. (B) After aligning the apo structure to the tilted structure, geometric clashes between the apo 2B domain and the dsDNA of the tilted state are detected (shown in orange dotted circle).
Author response image 1
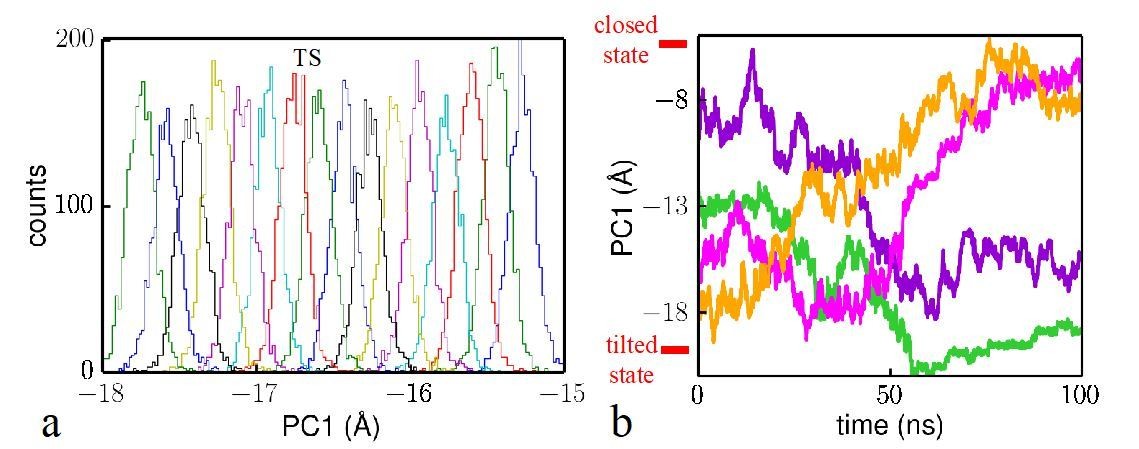
Analysis of the reliability of the Hamiltonian replica exchange simulations.
(a) Histograms for the umbrella windows near the transition state TS. (b) Time evolution of four trajectory samples in the simulations. The closed state and tilted state are labeled at the top and bottom, respectively.
Author response image 2
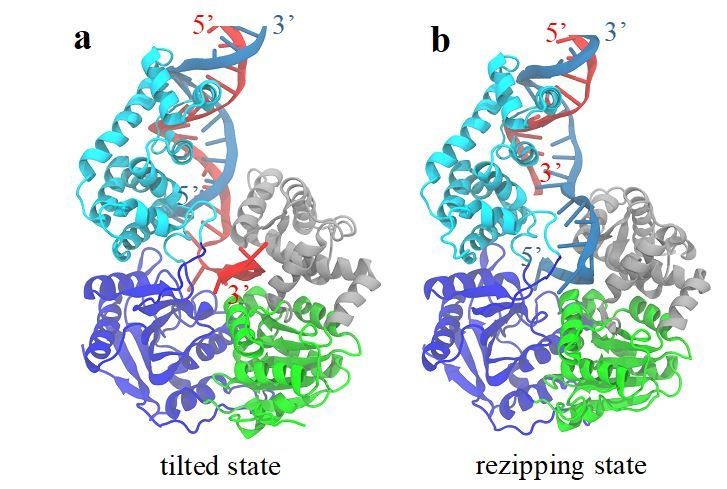
A structural model for the rezipping state.
(a) The structure of the tilted conformation obtained from the free energy simulations. Strands A and B of the dsDNA are shown in red and blue, respectively. (b) A structure model for the rezipping state after the ssDNA switching happens.
Author response image 3

Aligning the apo structure to the new rezipping-state structure.
The orange dotted circles indicate clashes between the apo 2B domain and the dsDNA of the rezipping-state structure.
Videos
Video 1
A movie showing the changes in the molecular structure along the optimal transition path from the closed state to the tilted state.
https://doi.org/10.7554/eLife.34186.008
Video 2
A movie showing how the ssDNA disengages from its binding domains of UvrD in the tilted state.
https://doi.org/10.7554/eLife.34186.010Additional files
-
Supplementary file 1
The PDB file for the predicted tilted-state structure of the UvrD-DNA complex.
- https://doi.org/10.7554/eLife.34186.023
-
Supplementary file 2
CHARMM36 force field parameters for the fluorophore molecules used in the simulations (AlexaFluor555 and AlexaFluor647).
- https://doi.org/10.7554/eLife.34186.024
-
Transparent reporting form
- https://doi.org/10.7554/eLife.34186.025
Download links
A two-part list of links to download the article, or parts of the article, in various formats.
Downloads (link to download the article as PDF)
Open citations (links to open the citations from this article in various online reference manager services)
Cite this article (links to download the citations from this article in formats compatible with various reference manager tools)
Free-energy simulations reveal molecular mechanism for functional switch of a DNA helicase
eLife 7:e34186.
https://doi.org/10.7554/eLife.34186


