Local and global influences on protein turnover in neurons and glia
- Max Planck Institute for Brain Research, Germany
- Goethe University Frankfurt, Germany
- Max Planck Institute of Biophysics, Germany
Figures
Figure 1 with 4 supplements
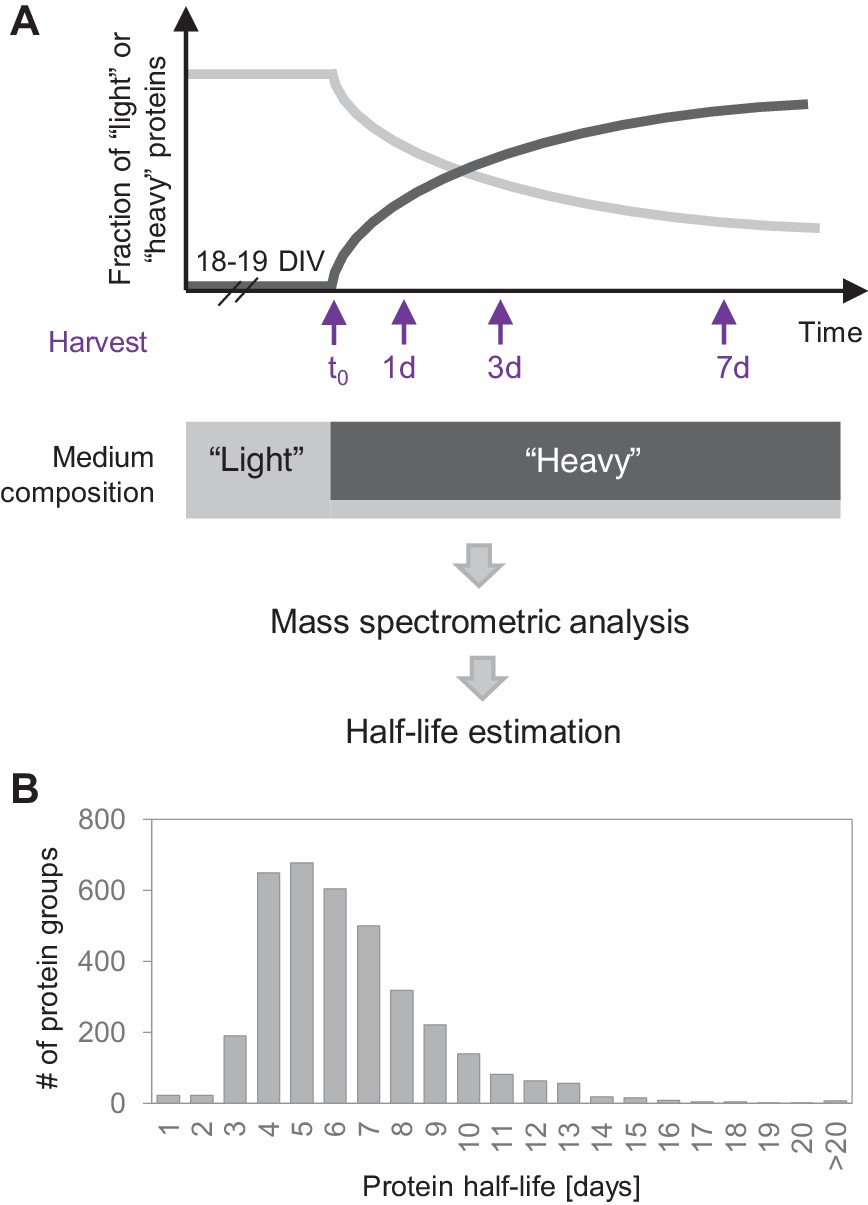
Protein turnover in neurons.
(A) Protein half-lives were determined by a dynamic SILAC approach in combination with MS. Cells were grown for 18–19 days in medium containing natural amino acids (‘light’) and then switched to a medium containing heavy isotopically labelled arginine (R10) and lysine (K8). Upon the medium change, the ‘heavy’ amino acids were incorporated into newly synthesized proteins, whereas the fraction of ‘light’ pre-existing proteins decayed over time. The cells were harvested 1, 3 and 7 days after the medium change as well as just before the medium change (t0) and the fractions of newly synthesized proteins and pre-existing proteins were determined by MS. Protein half-lives were determined based on first order exponential fitting of the fraction of pre-existing proteins over time. (B) Distribution of protein half-lives in primary hippocampal cultures ranged from <1 day to >20 days.
Figure 1—figure supplement 1
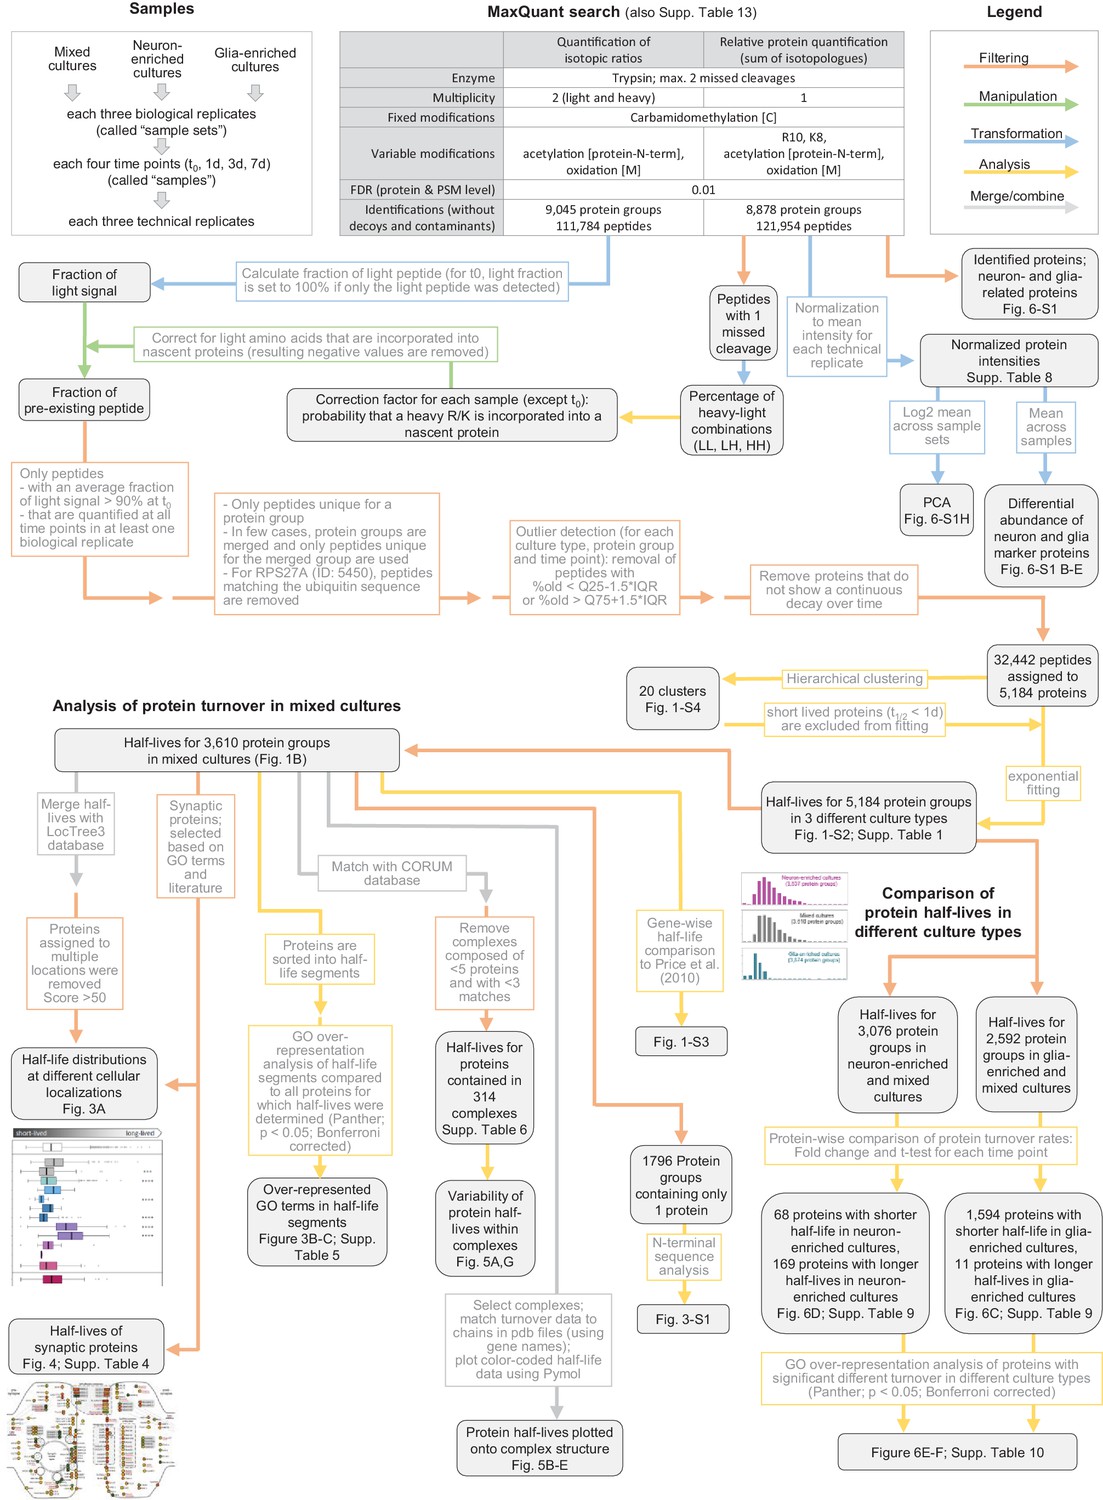
Data processing workflow of dynamic SILAC samples.
Flow chart explaining data processing, filtering and analysis of mass spectrometric data of dynamic SILAC samples.
Figure 1—figure supplement 2
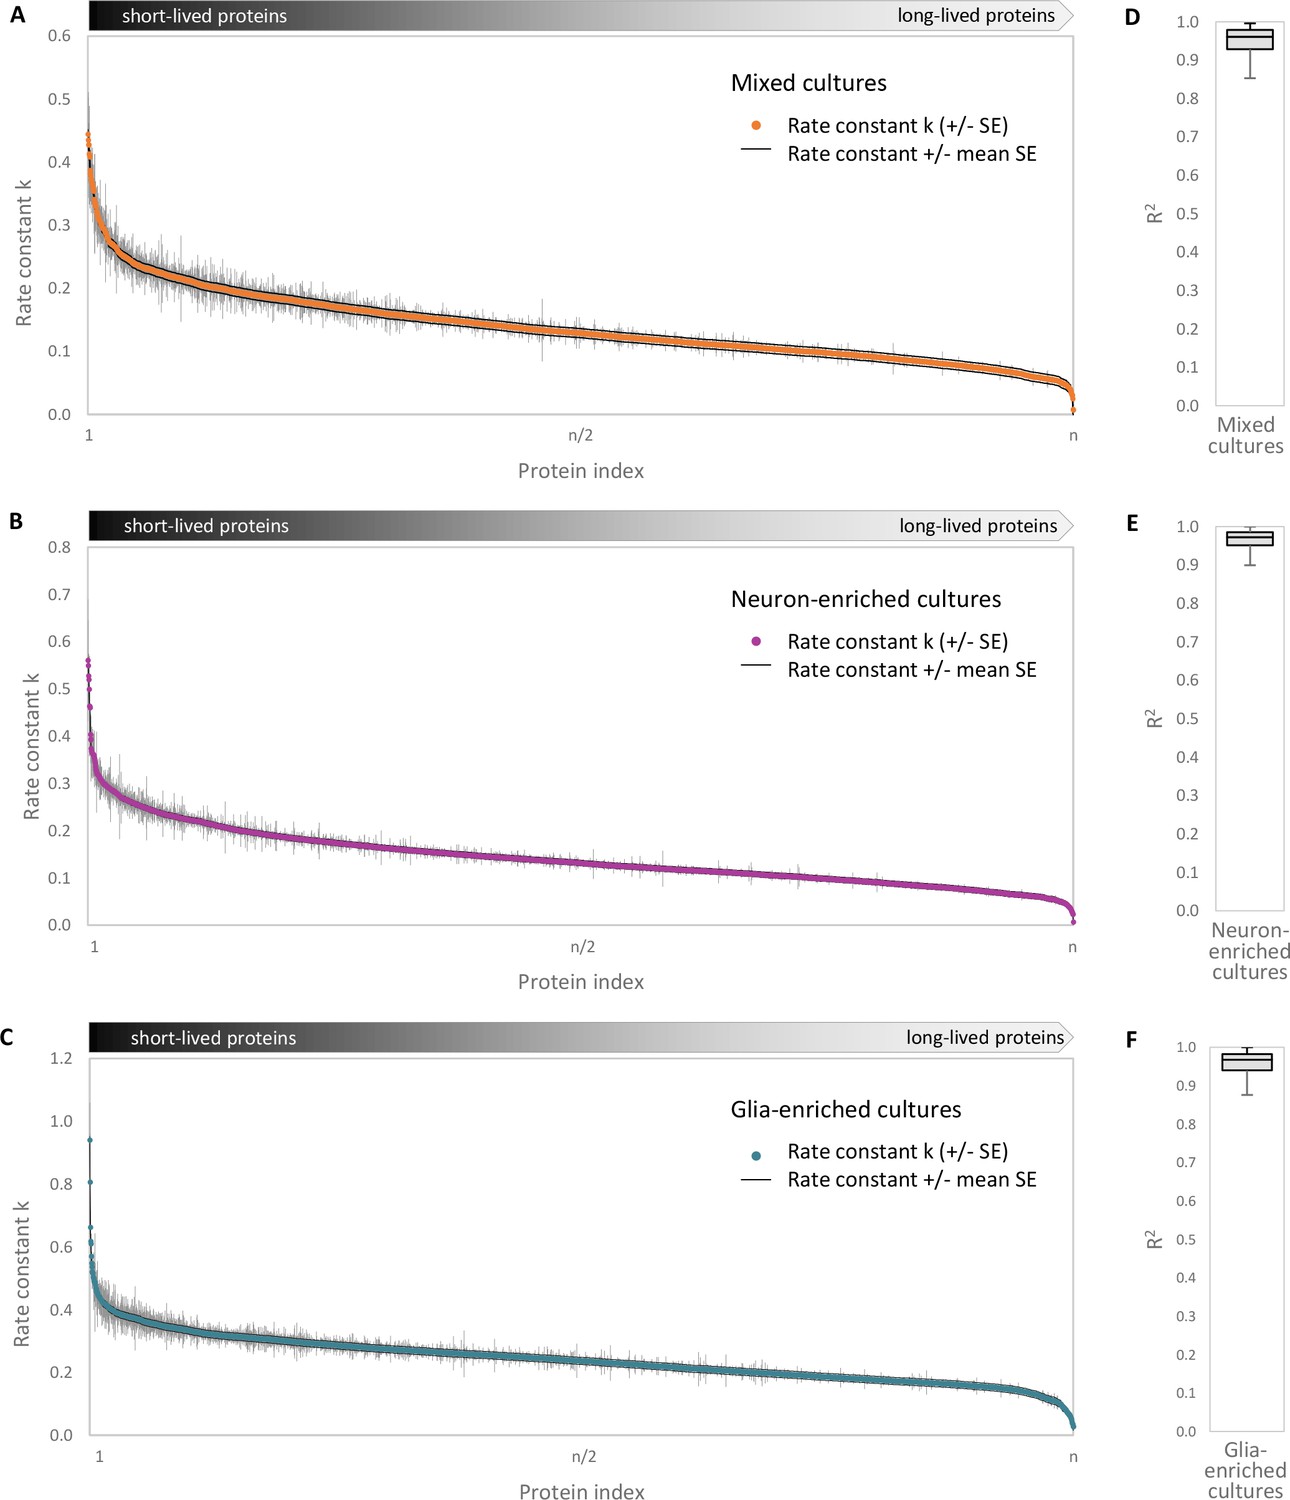
Accuracy of turnover estimation.
Protein half-lives were determined based on a linear fit of the fraction of pre-existing proteins over time. Rate constants k (negative value of the slope of the fit) and the SE (standard error of the slope) are shown for each protein group. (A) Mixed cultures, (B) neuron-enriched cultures and (C) glia-enriched cultures. The mean SE of the slopes for each culture type is shown as a black line. Coefficients of determination (R2) of the linear fits for (D) mixed cultures, (E) neuron-enriched cultures and (F) glia-enriched cultures. The boxes represent the upper quartile (Q3), median and lower quartile (Q1) and the antennas represent the upper limit (maximum) and the lower limit (Q1-1.5*IQR).
Figure 1—figure supplement 3
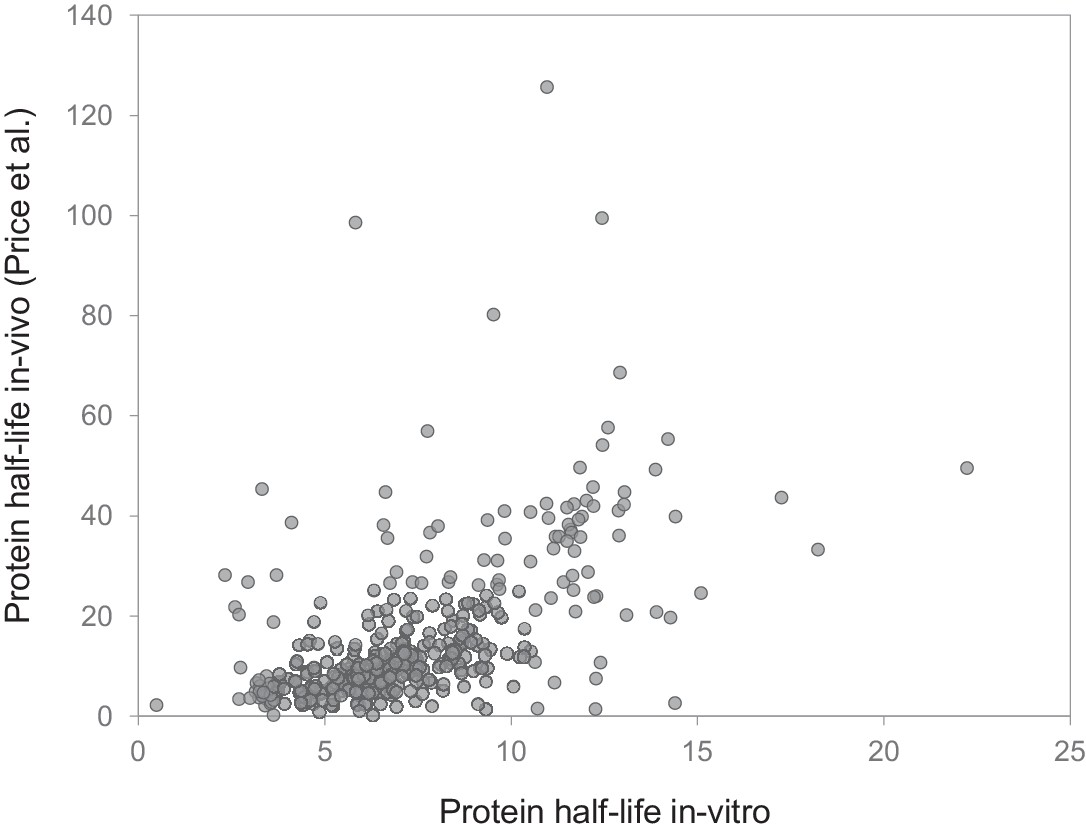
Comparison to in vivo study.
Comparison of protein half-lives determined in our in vitro study (mixed cultures) and half-lives reported in a previous in vivo study in mouse brain. Half-lives for 390 genes (determined in both studies) are significantly correlated (Spearman rank correlation = 0.62; p<0.001).
Figure 1—figure supplement 4
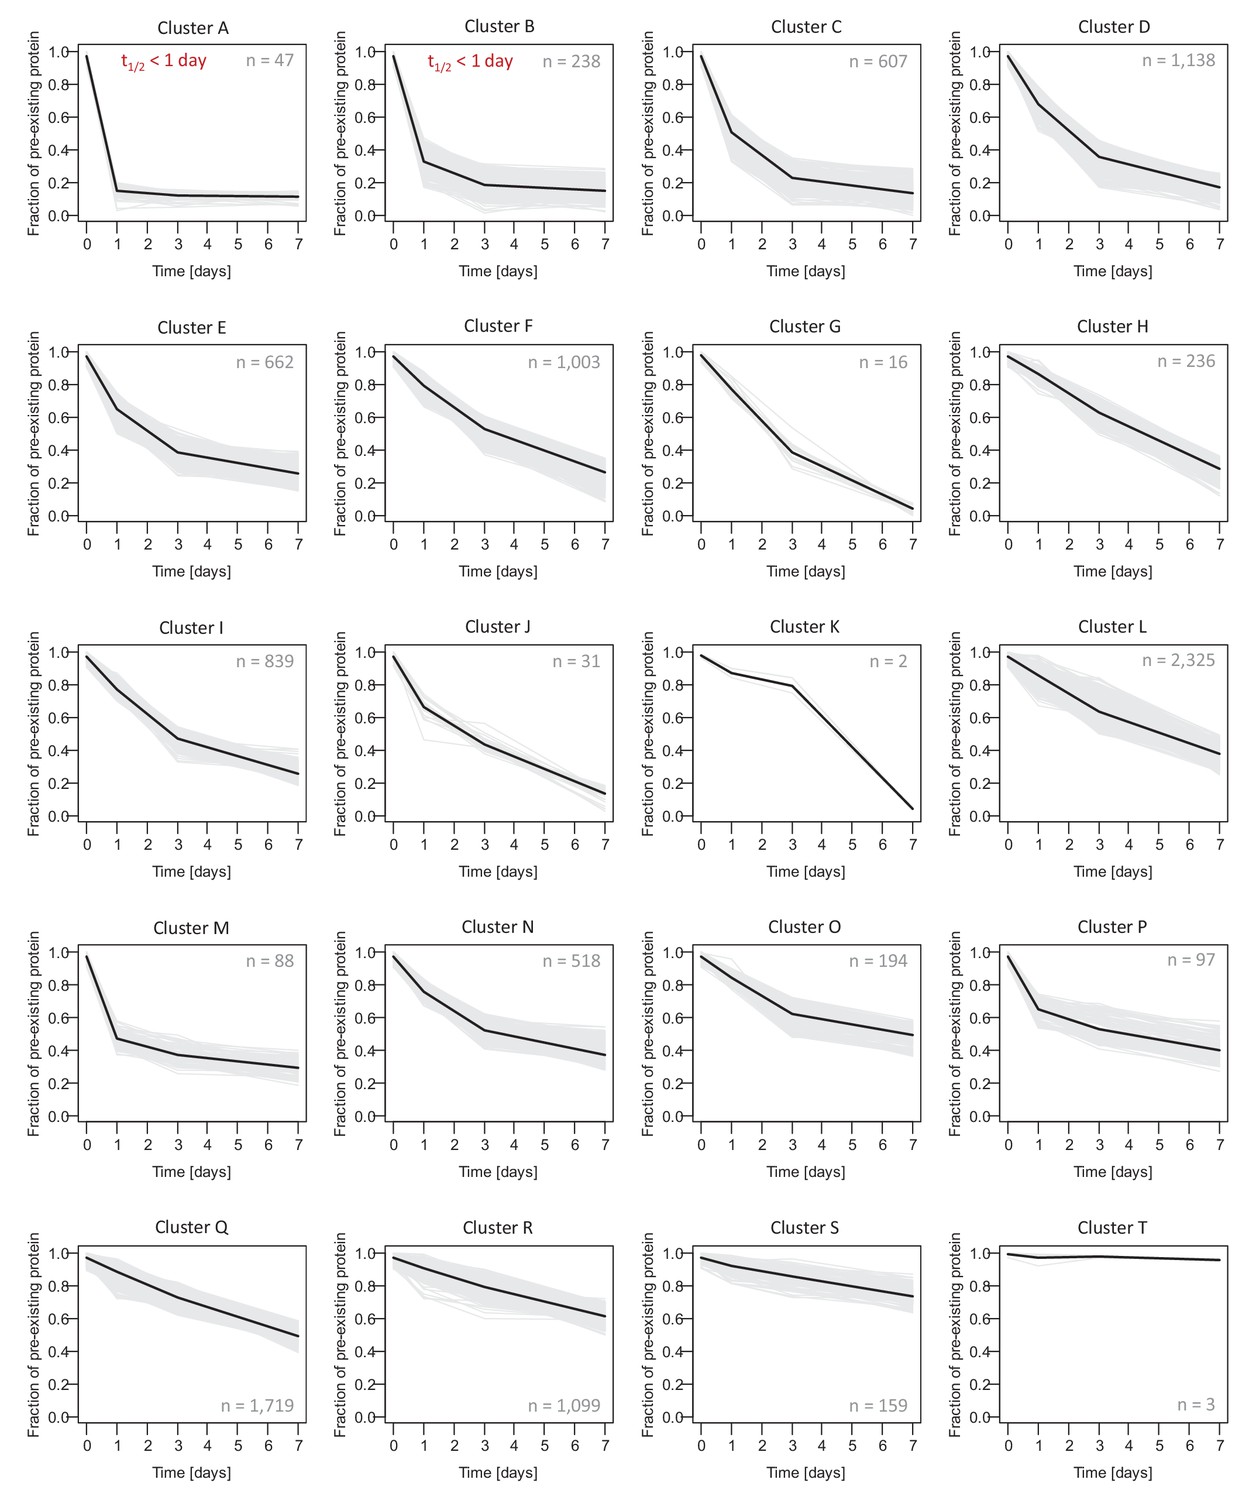
Protein decay clusters.
The decay curves of all protein groups (from mixed, neuron-enriched and glia-enriched cultures) were assigned to one of 20 clusters using hierarchical clustering (K-Means method). Decay curves for individual protein groups are shown as grey lines, and the average decay behavior for each cluster is shown as bold black line. Proteins groups assigned to cluster 6 and 7 are excluded from half-life determination, since most of the pre-existing proteins was degraded already after 1 day resulting in inaccurate exponential fitting. For down-stream analysis, these proteins were assigned a half-life <1 day. Protein groups in cluster 20 are long-lived proteins. Due to the minimum changes during the measurement time course of 7 days, their half-lives (determined by exponential fitting) are only rough estimates.
Figure 2
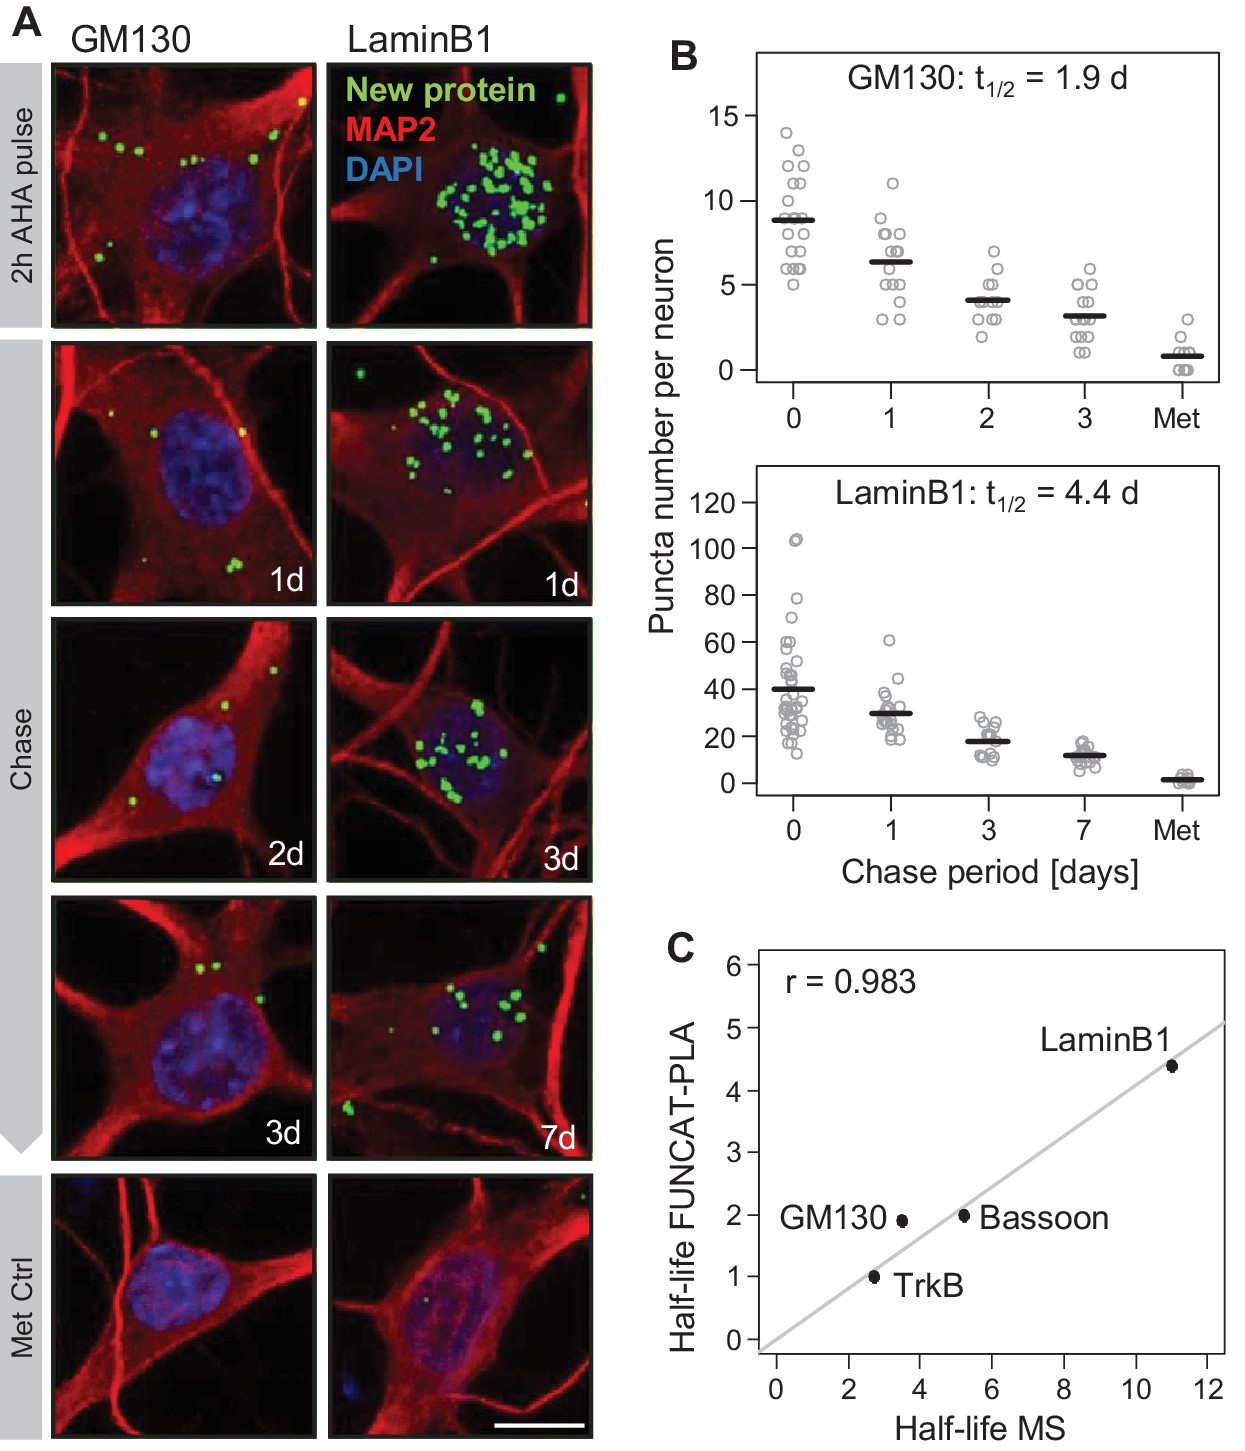
Validation of mass spectrometry results with metabolic labeling and visualization.
Protein half-lives were determined by FUNCAT-PLA for GM130 and LaminB1. Degradation of newly synthesized proteins (following a 2 hr AHA pulse) was monitored for 0 (no chase), 1, 2 and 3 days for GM130 and for 0, 1, 3 and 7 days for LaminB1. (A) Representative images of neurons with newly synthesized LaminB1 and GM130 as indicated (green), cell body and dendrites (MAP2, red), nuclei (DAPI, blue). Puncta were dilated for visualization purposes only. Scale bar = 10 μm. (B) Group analysis of experiments shown in A. Puncta number per neuron is shown for individual cells (grey dots) as well as the mean (black line). Protein half-life was determined based on exponential fitting of the mean puncta number per cell. (C) Protein half-lives measured by FUNCAT-PLA and MS exhibit a high and significant correlation (Pearson correlation (r) = 0.983); data for TrkB and Bassoon were obtained from tom Dieck et al., 2015.
-
Figure 2—source data 1
FUNCAT-PLA results.
- https://doi.org/10.7554/eLife.34202.008
Figure 3 with 1 supplement

Half-lives of proteins with different cellular locations and functions.
(A) Half-life distribution of proteins in different cellular compartments (LocTree annotation; score ≥50) and of synaptic proteins (extracted based on UniProt GO annotation). Number of protein groups assigned to each compartment is given in brackets. Mitochondrial proteins are significantly longer-lived compared to the complete set of quantified half-lives. Except in mitochondria, membrane proteins tend to be shorter-lived compared to soluble proteins in each compartment. Selected GO terms for cellular component (B) as well as biological process, molecular function and Panther protein class (C) that are over-represented (p-value<0.05) in distinct half-life segments. The complete set of over-represented GO terms and the full name of abbreviated GO terms (marked with *) are given in Figure 3—source data 2.
-
Figure 3—source data 1
Half-lives of proteins at different sub-cellular localizations.
- https://doi.org/10.7554/eLife.34202.011
-
Figure 3—source data 2
GO analysis of half-life segments.
- https://doi.org/10.7554/eLife.34202.012
Figure 3—figure supplement 1
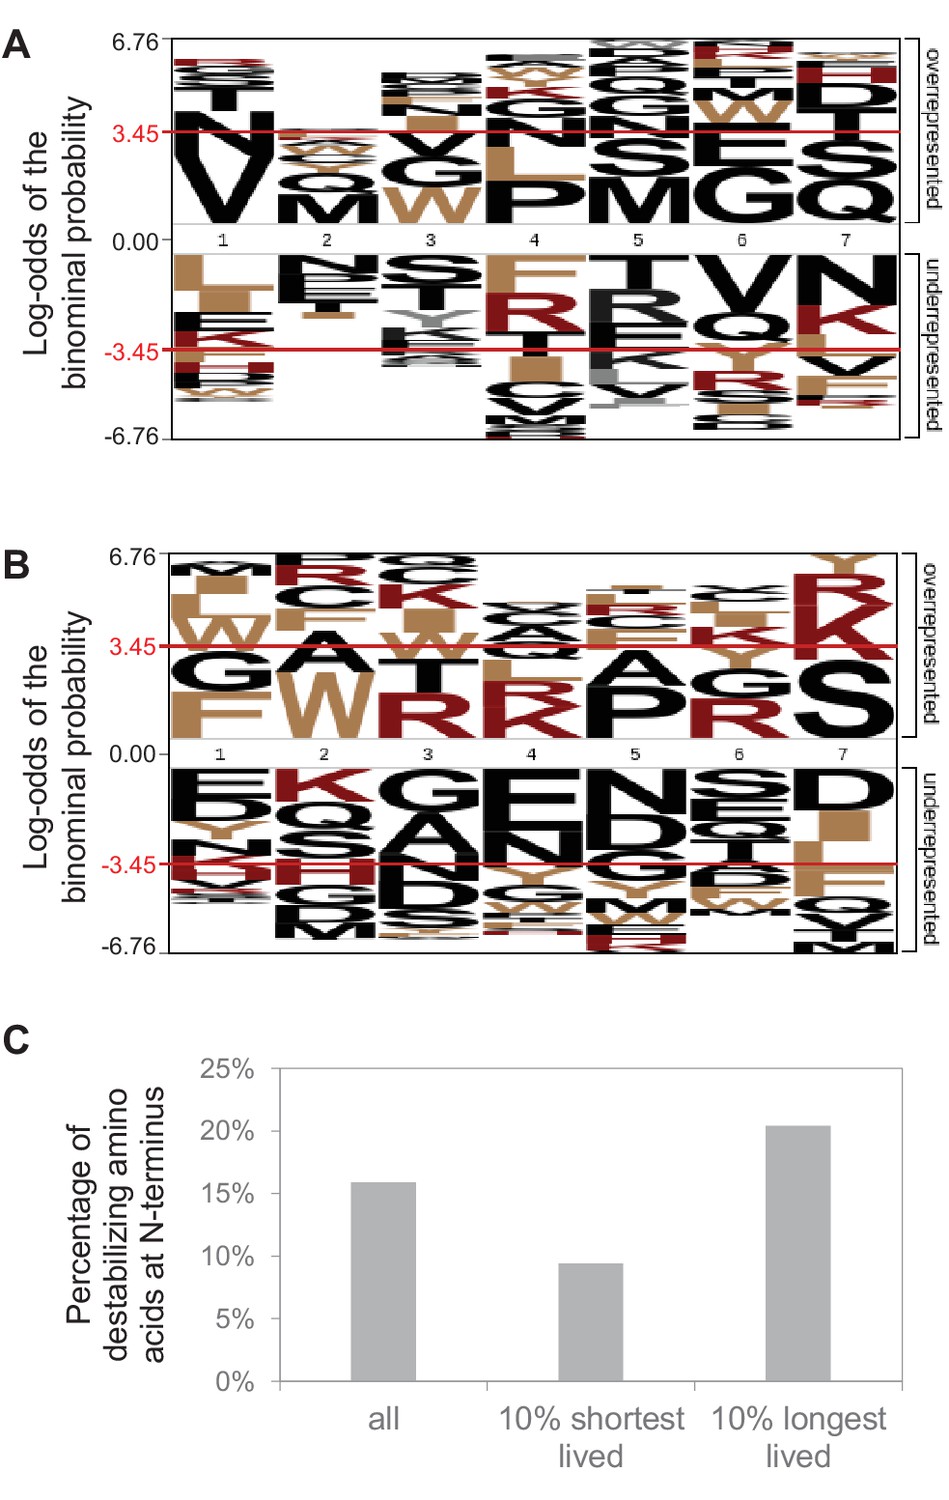
N-terminal sequence analysis.
N-terminal sequence analysis of protein groups that contain one protein. Initiator methionine is not considered. (A) No significant over-representation or under-representation of individual amino acids at the N-terminus (position 1; p<0.05 indicated by red line) of short-lived proteins (10% with shortest half-lives). All other protein groups were used as reference. (B) Same for long-lived proteins (10% with longest half-lives). (C) Percentage of proteins with a destabilizing amino acid (R, K, H, F, W, Y, I, L) at the N-terminus.
Figure 4
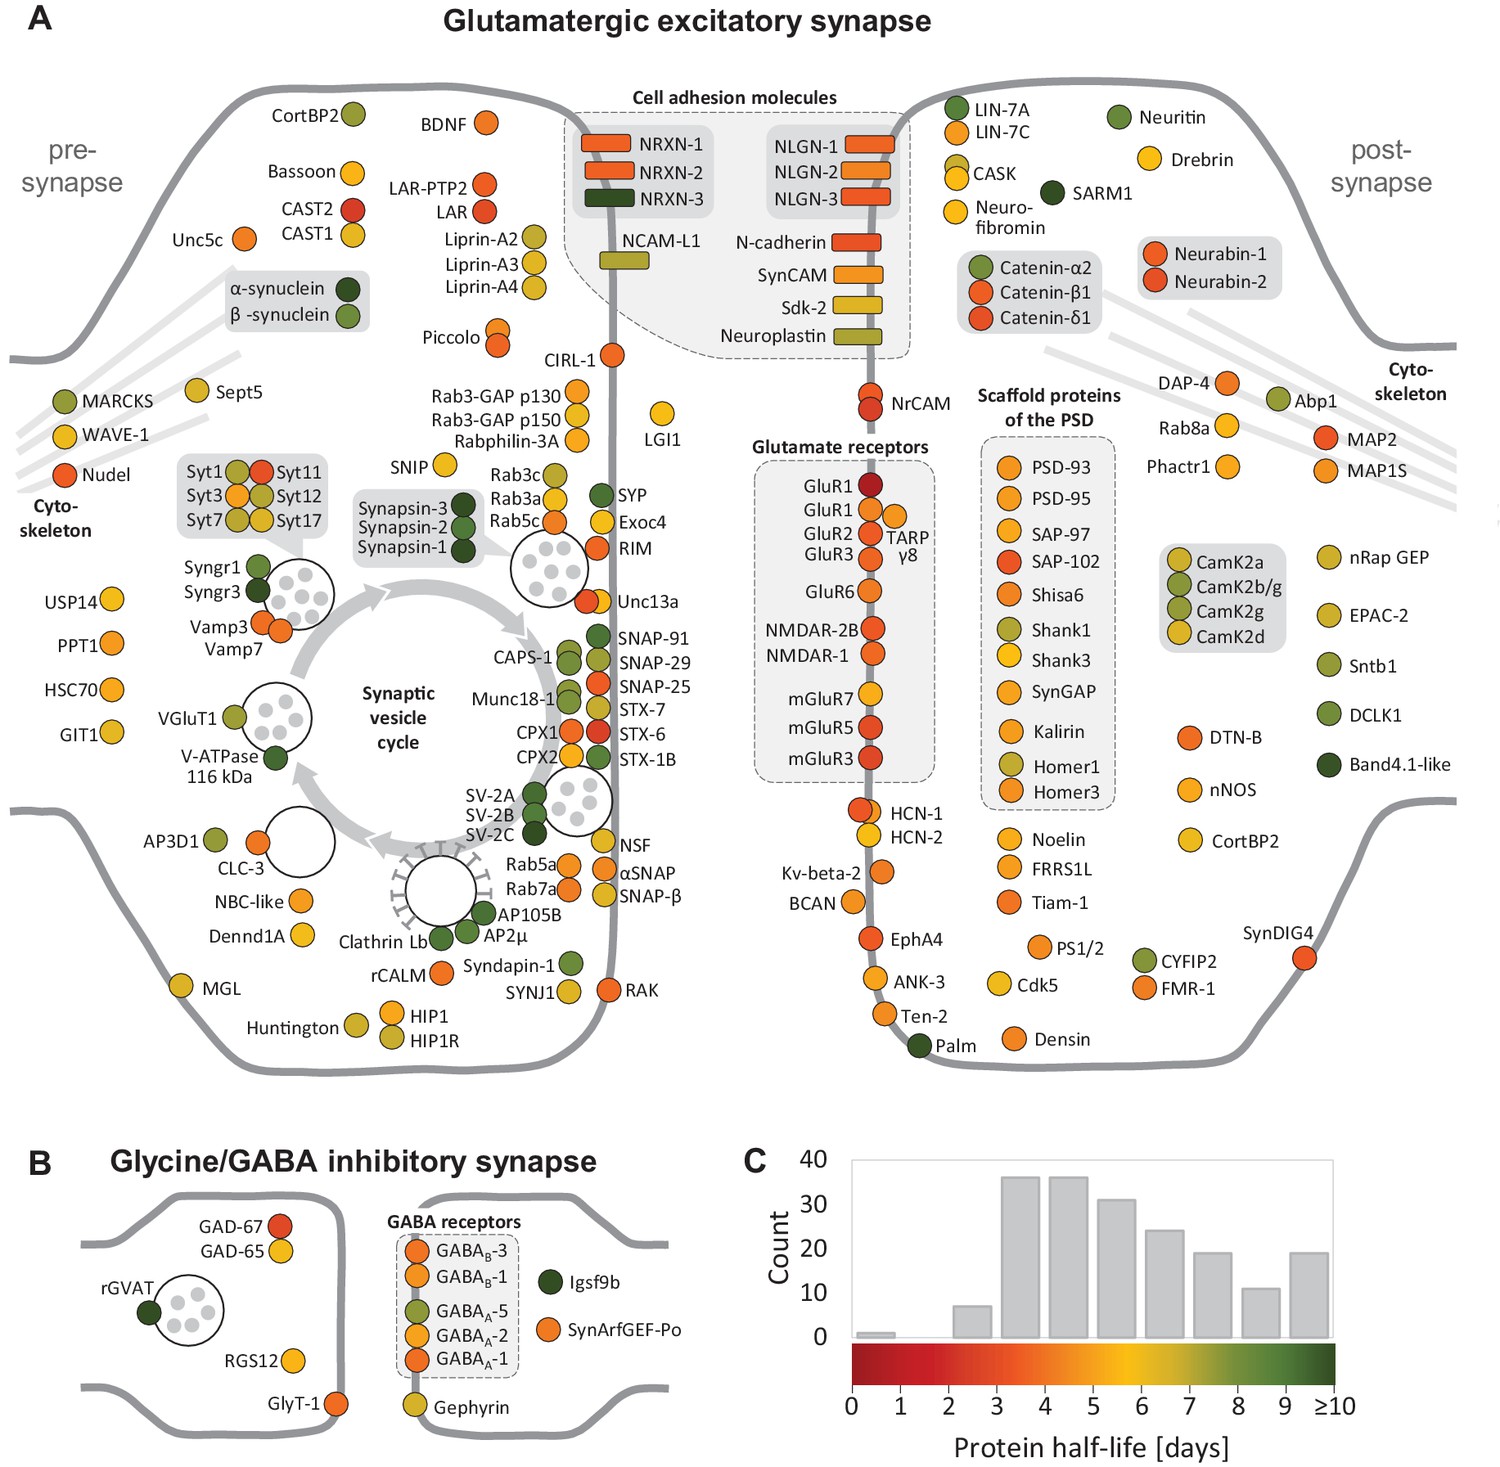
Half-lives of synaptic proteins.
Proteins located at glutamatergic synapses (A) and glycinergic or GABAergic synapses (B). Half-lives are indicated by a color code from red (short-lived) to green (long-lived). Multiple circles for the same protein name show different isoforms. Interacting proteins are displayed in closer proximity. Proteins with similar functions are grouped together and the synaptic vesicle cycle is indicated by arrows. Abbreviated protein names are explained in Figure 4—source data 1.
-
Figure 4—source data 1
Half-lives of synaptic proteins.
- https://doi.org/10.7554/eLife.34202.014
Figure 5 with 1 supplement
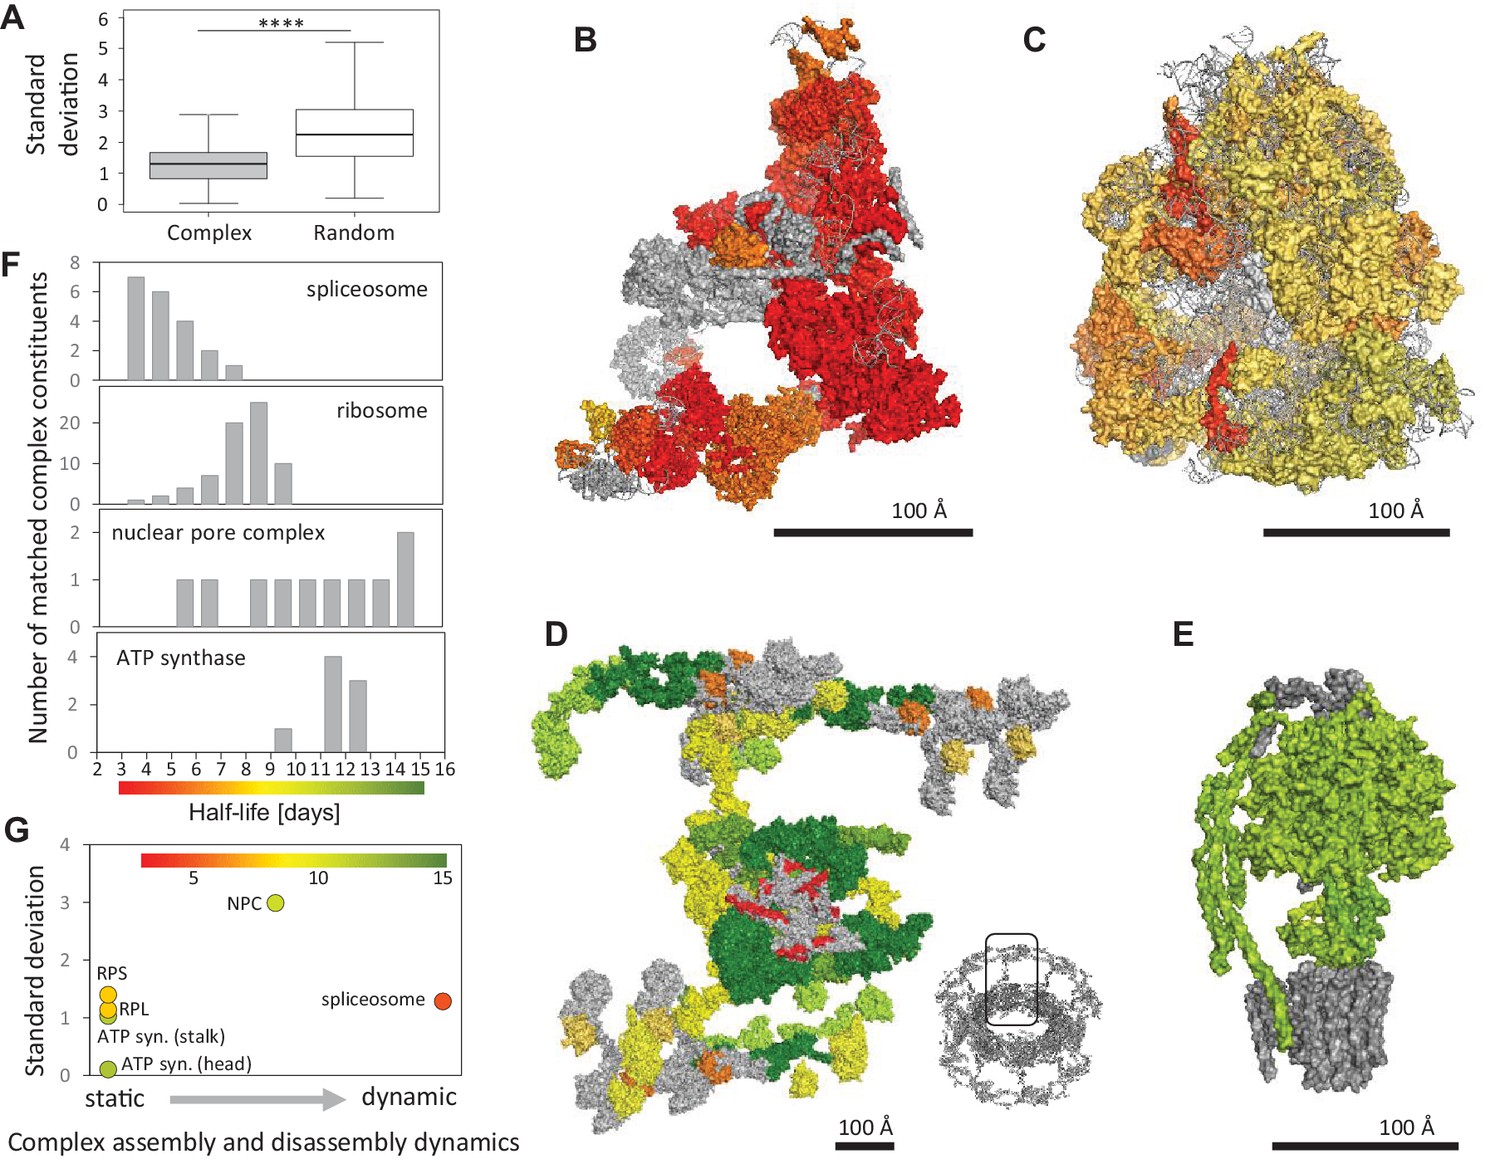
Protein half-lives within multi-protein complexes.
(A) Standard deviation (SD) for half-lives within multi-protein complexes compared to SD between randomly sampled proteins. (B) Structures of the spliceosome (PDB code: 5O9Z), (C) the ribosome (PDB code: 3J7R), (D) the nuclear pore complex (multiple PDB codes, see Materials and methods) and (E) the ATP-synthase (PDB code: 5LQX) are color-coded according to the protein half-lives. For the nuclear pore complex (D) only one repeating unit is displayed. The whole complex is shown as an insert (bottom right). RNA molecules and proteins for which no half-life was determined are shown in grey. (F) Half-life distributions of the complex constituents and the corresponding color scales. (G) Relationship between the SD of complex members and complex assembly and disassembly dynamics. Average half-lives of complex members are indicated by the indicated color scale.
-
Figure 5—source data 1
Half-lives of protein complex constituents.
- https://doi.org/10.7554/eLife.34202.017
-
Figure 5—source data 2
Half-lives of constituents of the ribosome, ATP-synthase, spliceosome and nuclear pore complex.
- https://doi.org/10.7554/eLife.34202.018
Figure 5—figure supplement 1
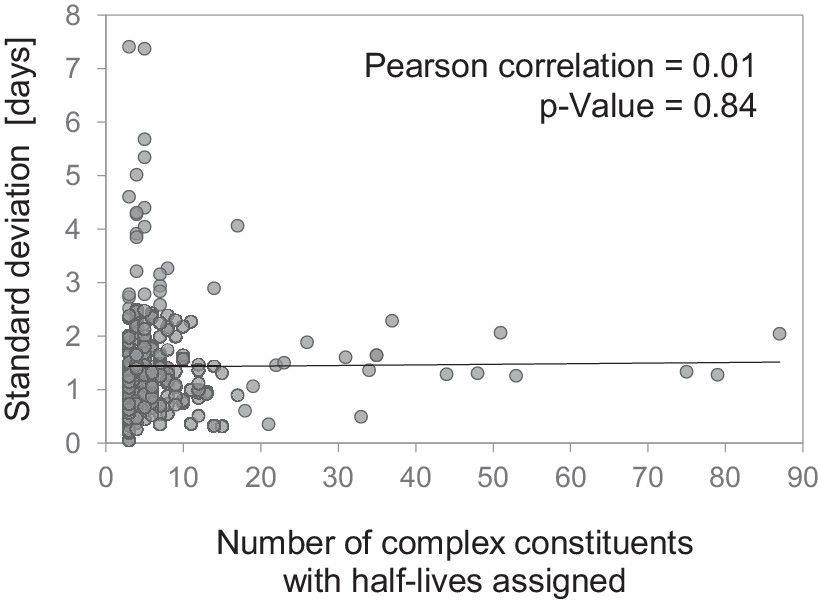
Correlation of half-life variability within protein complexes and complex size.
Standard deviation of half-lives within 314 multi-protein complexes versus number of complex constituents for which a half-life was determined. No significant correlation was found (Pearson correlation = 0.01; p-value=0.84).
Figure 6 with 5 supplements
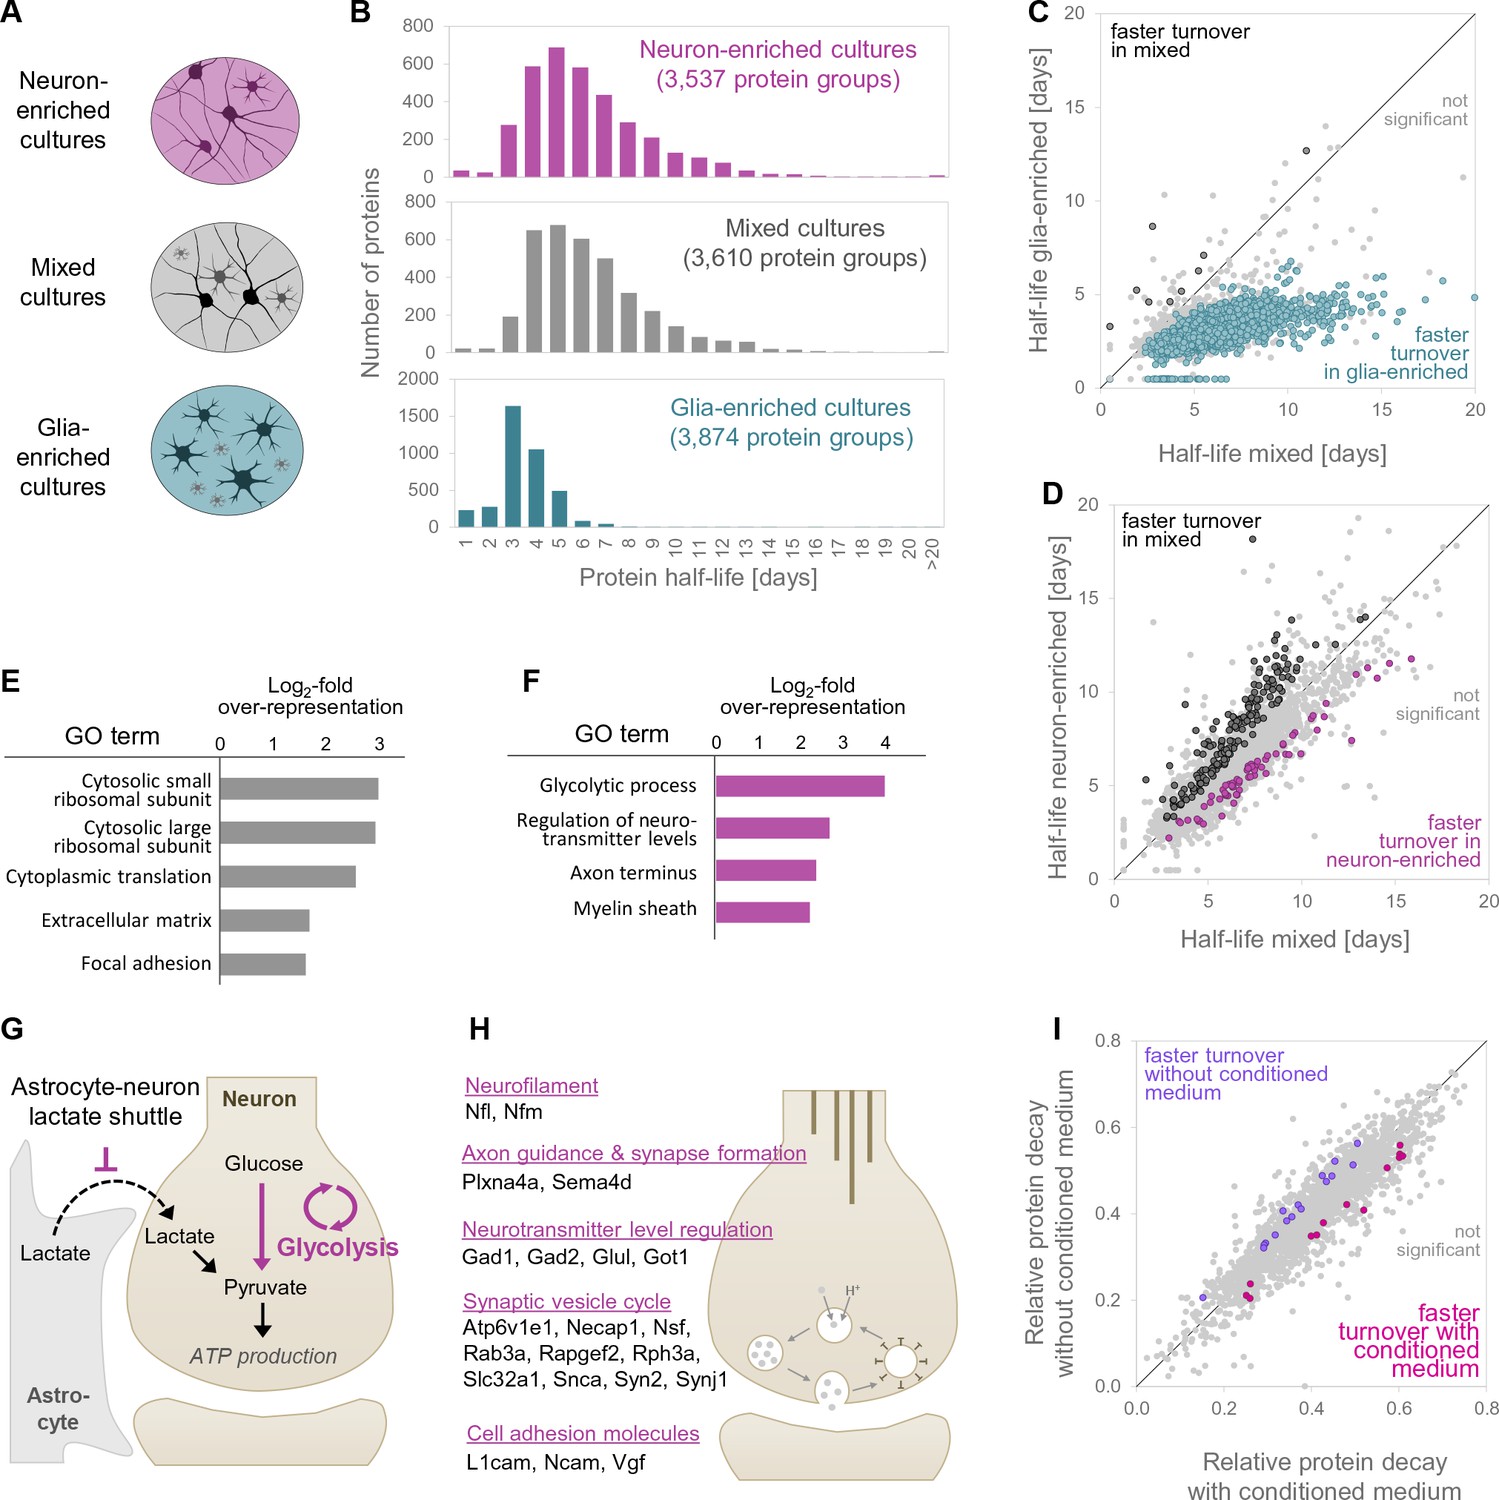
Protein turnover rates of different cell types in different cellular environments.
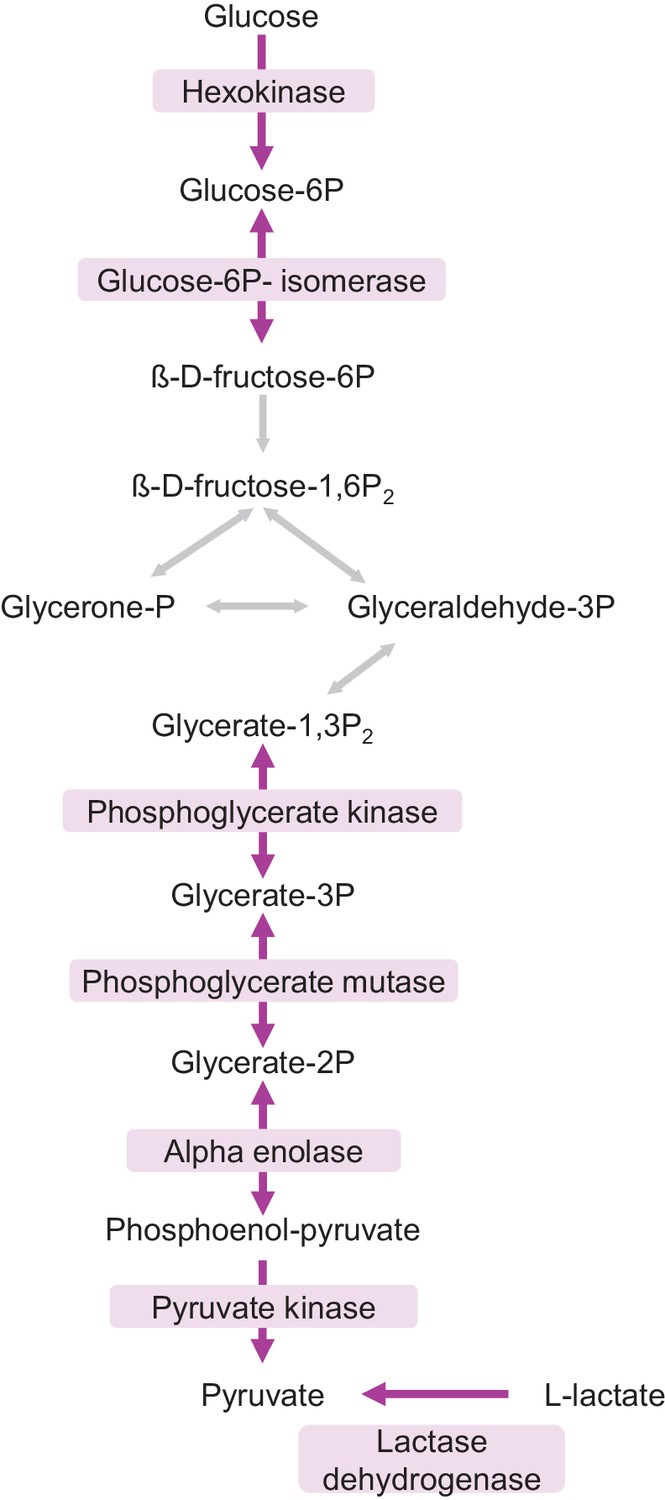
(A) Different cell culture types and environments for which protein turnover was investigated. (B) Protein half-life distributions for different primary neuronal culture types (mixed, neuron-enriched and glia-enriched cultures). (C and D) show protein-wise half-life comparisons for proteins in glia-enriched versus mixed cultures as well as neuron-enriched versus mixed cultures. Proteins with significantly regulated turnover rates (p<0.05 at≥2 of 3 time points, Bonferroni corrected) are highlighted in color. (E) GO over-representation analysis of proteins with significantly faster turnover rates in mixed cultures compared to neuron-enriched cultures. Selected over-represented GO terms (p<0.05) and their log2-fold over-representation are shown. (F) Same as E for proteins with significantly faster turnover rates in neuron-enriched cultures compared to mixed cultures. (G) Proposed mechanism to explain the increased turnover of glycolytic enzymes in neuron-enriched cultures. In the absence of glia cells, neurons are not supplied with lactate via the astrocyte-neuron-lactate-shuttle and hence pyruvate production relies on glycolysis exclusively. Glycolytic enzymes might be used more frequently, damaged more frequently and replaced earlier. (H) Selected proteins with significantly faster turnover rates in neuron-enriched cultures that are involved in synaptic processes. (I) Protein-wise turnover comparisons for proteins from neuron-enriched cultures maintained with or without conditioned medium. Proteins with significantly regulated turnover rates (p<0.05, Bonferroni corrected) are highlighted in color.
-
Figure 6—source data 1
Relative protein abundances in different culture types.
- https://doi.org/10.7554/eLife.34202.025
-
Figure 6—source data 2
Protein half-life comparison between different culture types.
- https://doi.org/10.7554/eLife.34202.026
-
Figure 6—source data 3
GO analysis of proteins with different turnover rates in mixed and neuron-enriched cultures.
- https://doi.org/10.7554/eLife.34202.027
-
Figure 6—source data 4
Proteins with different turnover rates in neuron-enriched cultures with and without conditioned medium.
- https://doi.org/10.7554/eLife.34202.028
Figure 6—figure supplement 1
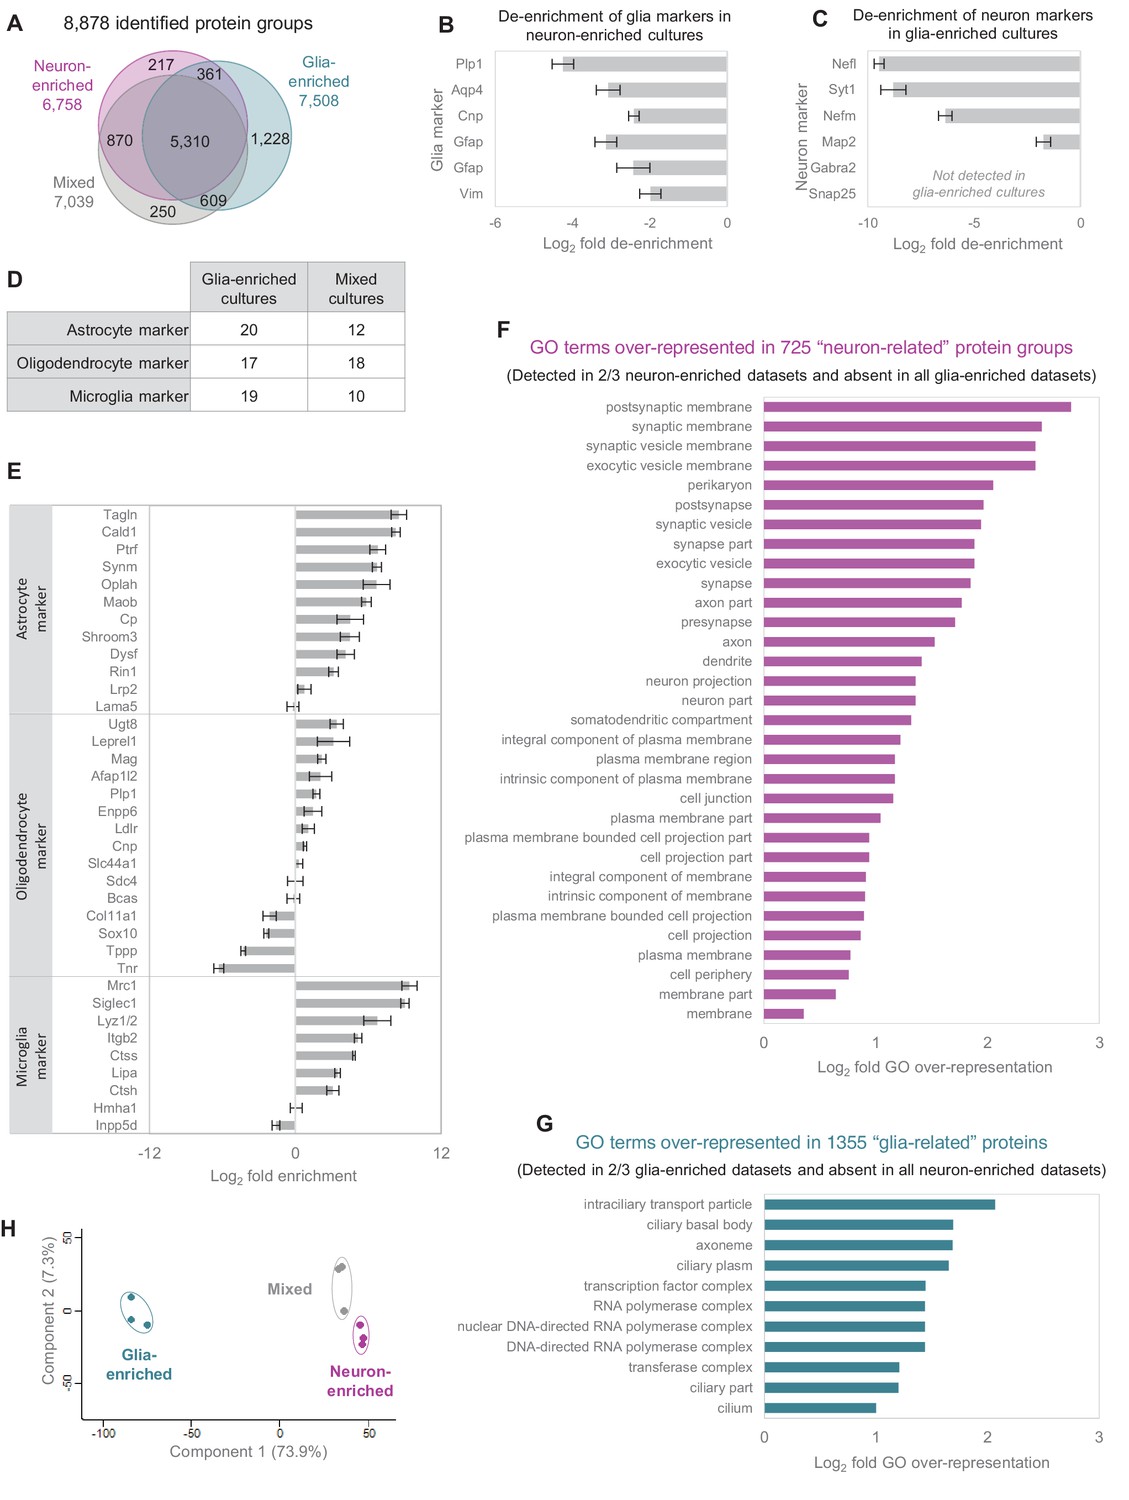
Comparison of different culture types.
(A) Number of identified protein groups in the different culture types. (B) Established glia markers are de-enriched in neuron-enriched cultures. Bar diagram shows log2 fold change between neuron-enriched cultures and mixed cultures and error bars indicate SEM. (C) Established neuron markers are de-enriched in glia-enriched cultures. Bar diagram shows log2 fold change between glia-enriched cultures and mixed cultures and error bars indicate SEM. (D) Number of quantified astrocyte, oligodendrocyte and microglia marker proteins in glia-enriched versus mixed cultures. (E) Comparison of relative protein expression levels of astrocyte, oligodendrocyte and microglia markers in glia-enriched cultures versus mixed cultures. Error bars show the standard deviation. (F) GO over-representation analysis for 725 ‘neuron-related’ protein groups (detected in ≥2 biological replicates in neuron-enriched cultures and never detected in glia-enriched cultures). (G) GO over-representation analysis for 1,355 ‘glia-related’ protein groups (detected in ≥2 biological replicates in glia-enriched cultures and never detected in neuron-enriched cultures). (H) Different culture types form distinct clusters in a principle component analysis (PCA). For PCA, log2 transformed relative abundances of 3214 protein groups, which were detected in all biological replicates of all culture types, were used.
Figure 6—figure supplement 2
Faster protein turnover of glycolytic enzymes in neuron-enriched cultures.
Glycolysis pathway. Proteins with faster turnover in neuron-enriched cultures compared to mixed cultures are highlighted in purple.
Figure 6—figure supplement 3
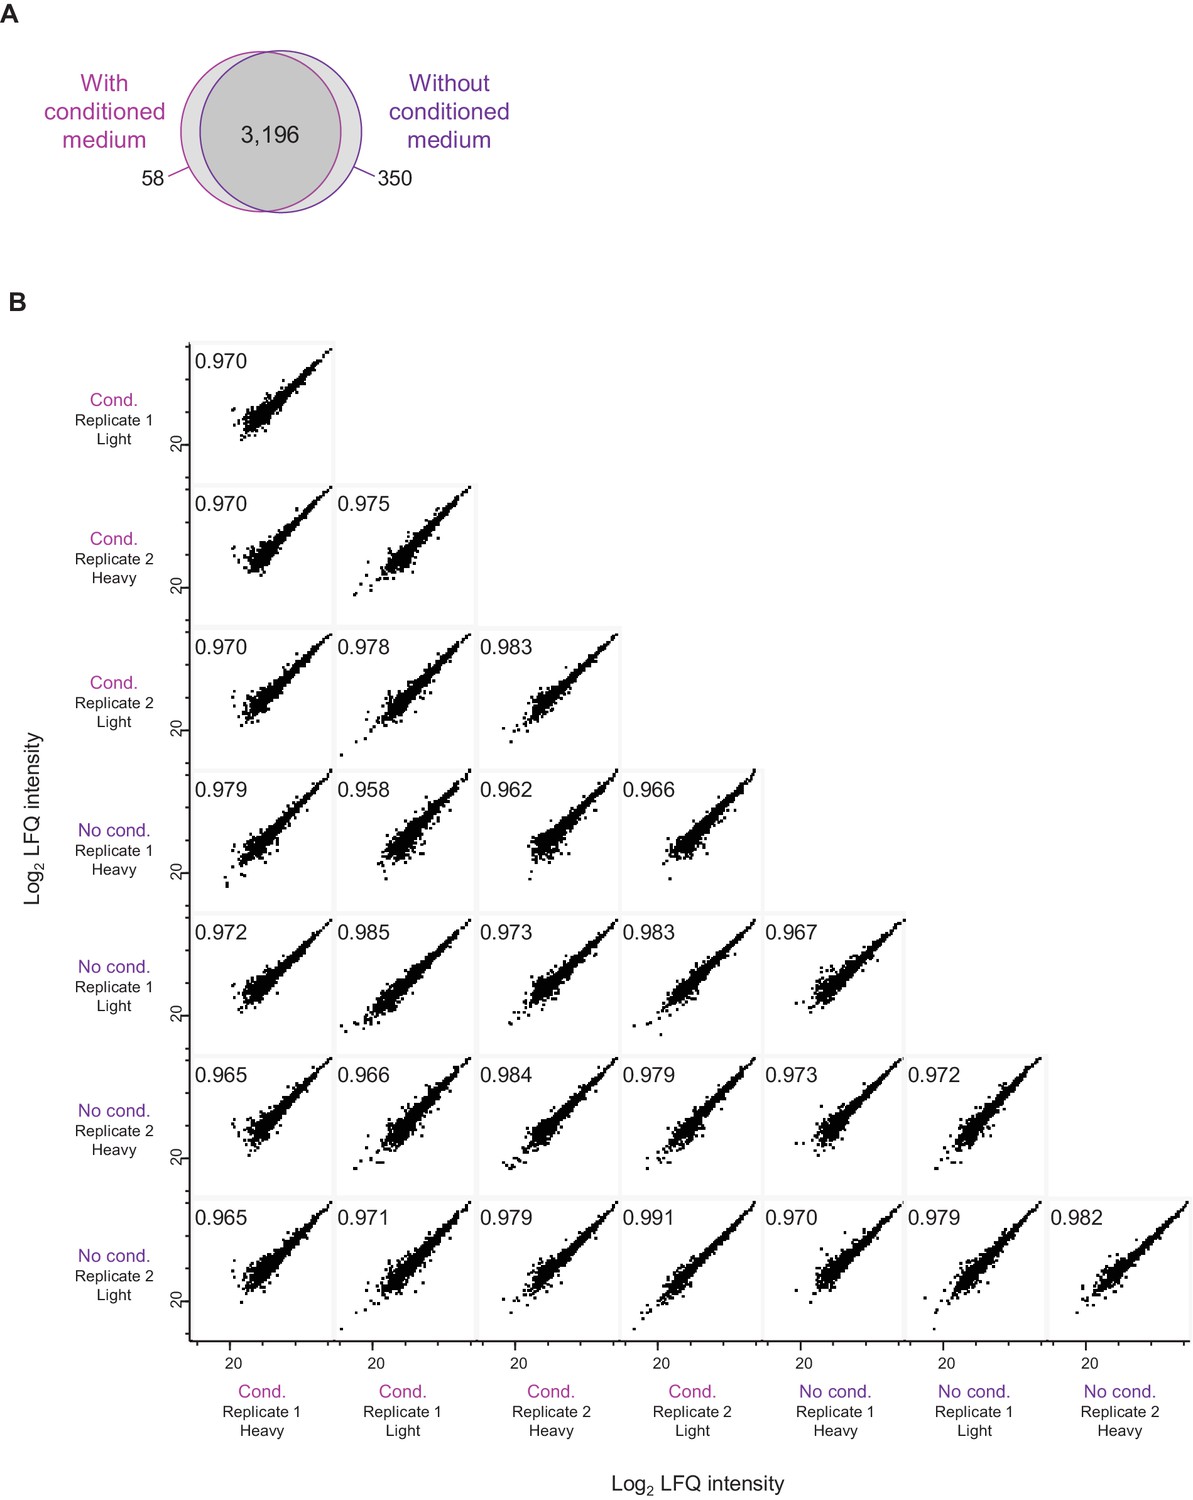
Comparison of neuron-enriched cultures with and without conditioned medium.
(A) Venn diagram shows the number of detected protein groups in neuron-enriched cultures with and without conditioned medium. (B) Comparison of relative protein abundances. Log2 LFQ intensities are compared between independent samples obtained from neuron-enriched cultures with and without conditioned medium. The Pearson correlation (top left of each diagram) is very high for all pair-wise sample comparisons (≥0.962).
Figure 6—figure supplement 4
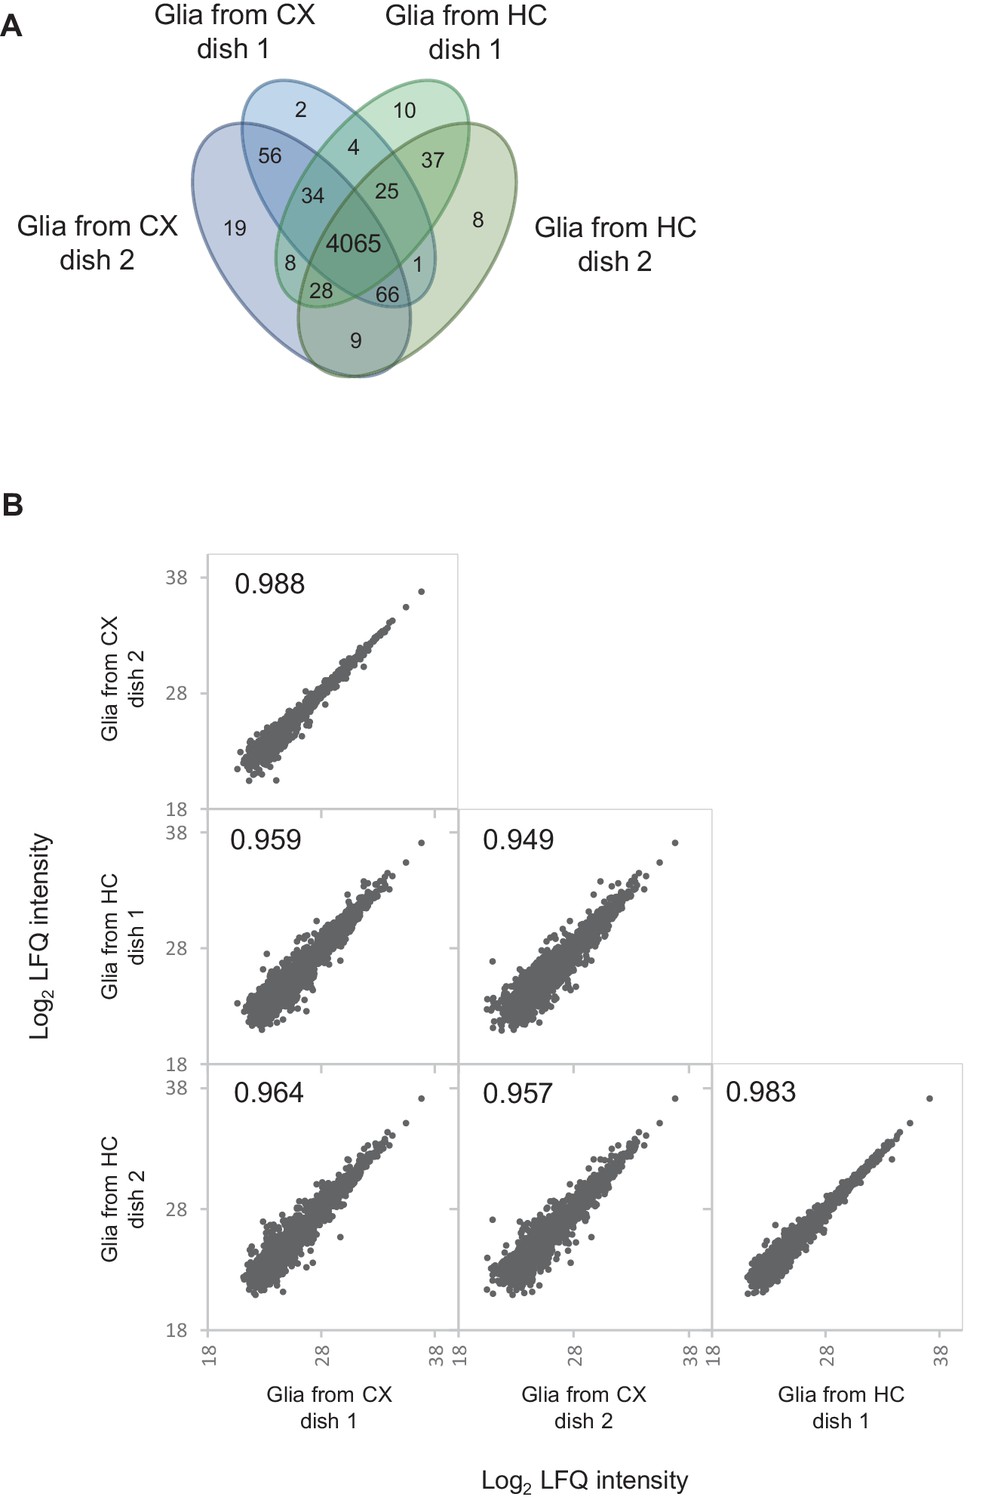
Proteomic comparison of glia-enriched cultures prepared from cortex and hippocampus.
Proteomic comparison between glia-enriched cultures prepared from cortex and hippocampus reveals high similarity between these cultures. (A) Venn diagram showing the number of quantified proteins in each two dishes of glia-enriched cultures from cortex and hippocampus, respectively. 97% of the protein were quantified in both cultures types. (B) Correlation of log2 transformed protein LFQ intensities. LFQ intensities show a very high correlation (Pearson correlation ≥0.949) between glia-enriched cultures from cortex and hippocampus.
Figure 6—figure supplement 5
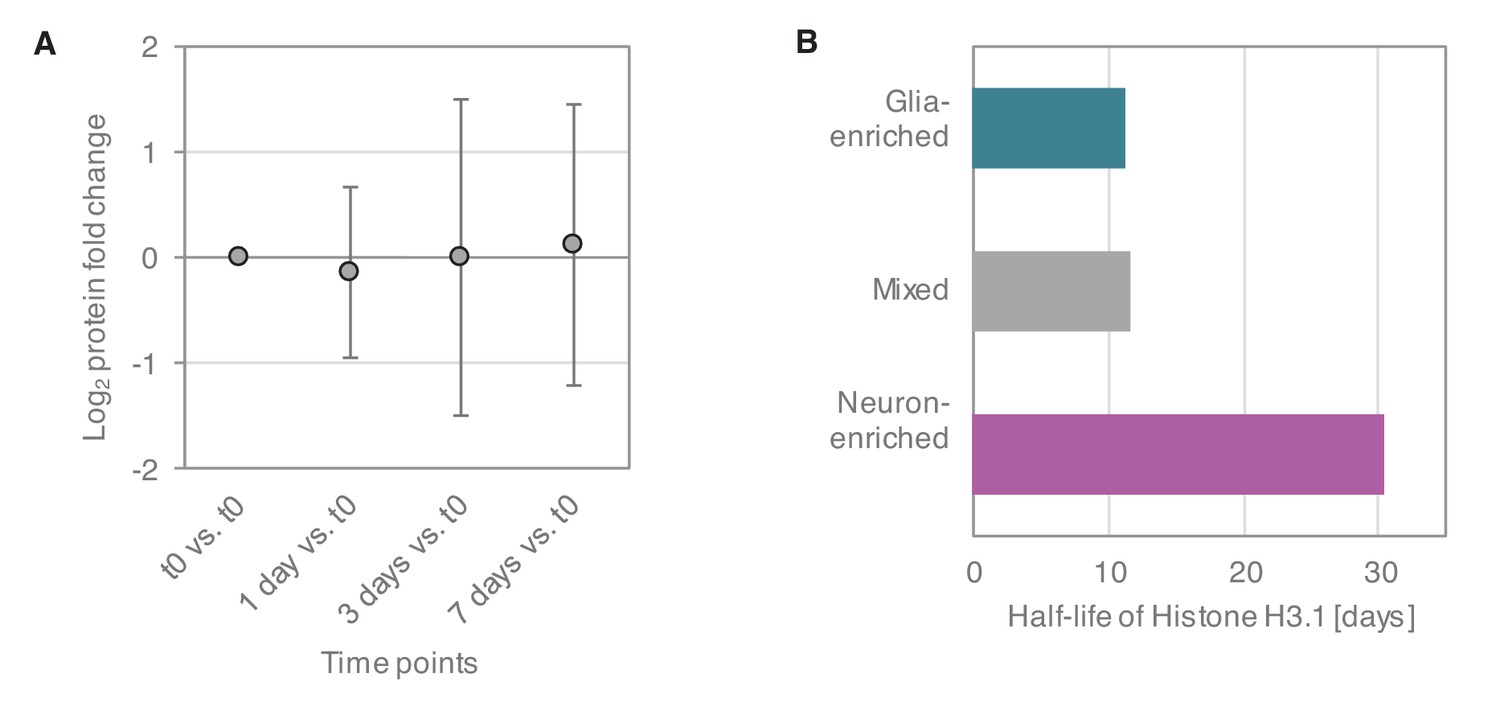
Estimation of cell division in primary cultures.
(A) Relative expression levels of glia marker proteins in mixed cultures over the time course of the dynamic SILAC experiment (7 days). Average of log2 fold changes (each time point versus t0) of relative expression levels of 43 astrocyte, oligodendrocyte and microglia markers are shown. Whiskers show the standard deviation. Although different markers show different trends, there is no systematic increase in glia marker proteins over the time course of the SILAC experiment. (B) Protein half-lives of the cell division-dependent Histone H3.1 in the different culture types.
Additional files
-
Supplementary file 1
Half-lives, rate constants, standard errors and coefficients of determination for all proteins in all culture types.
- https://doi.org/10.7554/eLife.34202.029
-
Supplementary file 2
MS parameters.
- https://doi.org/10.7554/eLife.34202.030
-
Supplementary file 3
Sample tables and MaxQuant parameter sets.
- https://doi.org/10.7554/eLife.34202.031
-
Transparent reporting form
- https://doi.org/10.7554/eLife.34202.032
Download links
A two-part list of links to download the article, or parts of the article, in various formats.
Downloads (link to download the article as PDF)
Open citations (links to open the citations from this article in various online reference manager services)
Cite this article (links to download the citations from this article in formats compatible with various reference manager tools)
Local and global influences on protein turnover in neurons and glia
eLife 7:e34202.
https://doi.org/10.7554/eLife.34202


