HIV-1 Env trimer opens through an asymmetric intermediate in which individual protomers adopt distinct conformations
- Yale University School of Medicine, United States
- National Institutes of Health, United States
- Weill Cornell Medical College of Cornell University, United States
- Tufts University School of Medicine, United States
Figures
Figure 1 with 4 supplements
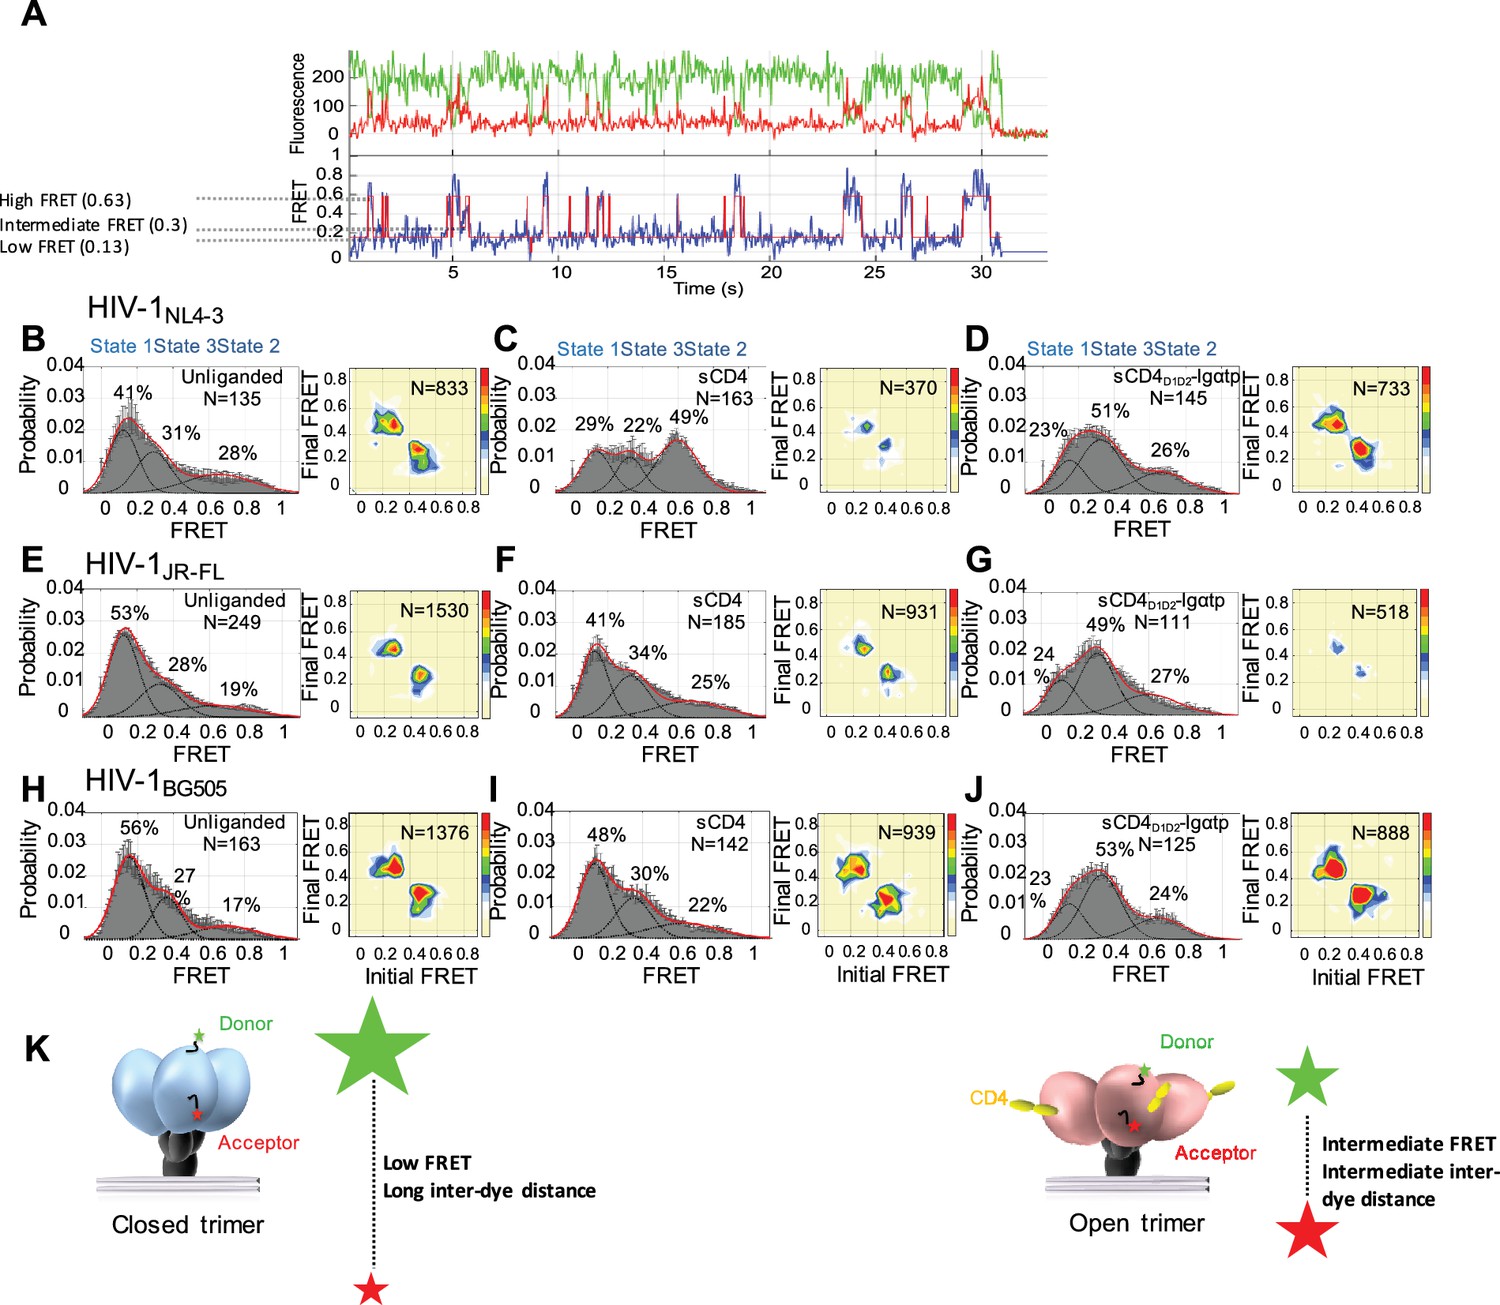
State 3 corresponds to the gp120 conformation of the three-CD4-bound HIV-1 Env trimer.
(A) Representative smFRET trace for unliganded HIV-1NL4-3 Env. (Top) The donor fluorophore (green) was attached to the V1 loop and the acceptor fluorophore (red) was attached to the V4 loop. (Bottom) Corresponding FRET trajectory (blue) with overlaid idealization generated by Hidden Markov Modeling (HMM) (red). (B) (Left) Probability distribution of FRET values compiled from all the individual HIV-1NL4-3 Env molecules (N = number of FRET traces analyzed). The histogram was fitted to a sum of three Gaussian distributions, with means of 0.13, 0.3 and 0.63, which are corresponding to States 1, 3 and 2, as indicated. The percentage indicates the occupancy of each FRET state. Error bars represent standard errors calculated from histograms from three independent sets of FRET traces. (Right) Transition Density Plot (TDP) of all the observed transitions in unliganded HIV-1NL4-3 Env. Color bar shows the scale used to indicate the frequency of each transition. (C, D) sCD4 (0.1 mg/ml) (C) or sCD4D1D2-Igαtp (0.1 mg/ml) (D) was incubated with the virus for 30 min prior to imaging. FRET histogram and TDP are as in (B). (E–G) Probability distributions (left) and TDPs (right) for HIV-1JR-FL Env for the unliganded (E) (Note: FRET histogram and TDP were from previous data set for direct comparison [Herschhorn et al., 2016]), sCD4-bound (0.1 mg/ml) (F) and sCD4D1D2-Igαtp-bound (0.1 mg/ml) (G). (H–J) Probability distributions (left) and TDPs (right) for HIV-1BG505 Env for the unliganded (H), sCD4-bound (0.1 mg/ml) (I) and sCD4D1D2-Igαtp-bound (0.1 mg/ml) (J) viruses are displayed as in HIV-1NL4-3. (K) Schematic illustration of the closed and open conformations of the Env trimer. The unliganded conformation is in blue and CD4-bound conformation is in pink. Green and red starts represent donor and acceptor fluorophores, respectively. Sizes of the stars represent relative change of fluorescence between donor and acceptor dyes and dotted line indicated changes of inter-dye distances.
Figure 1—figure supplement 1
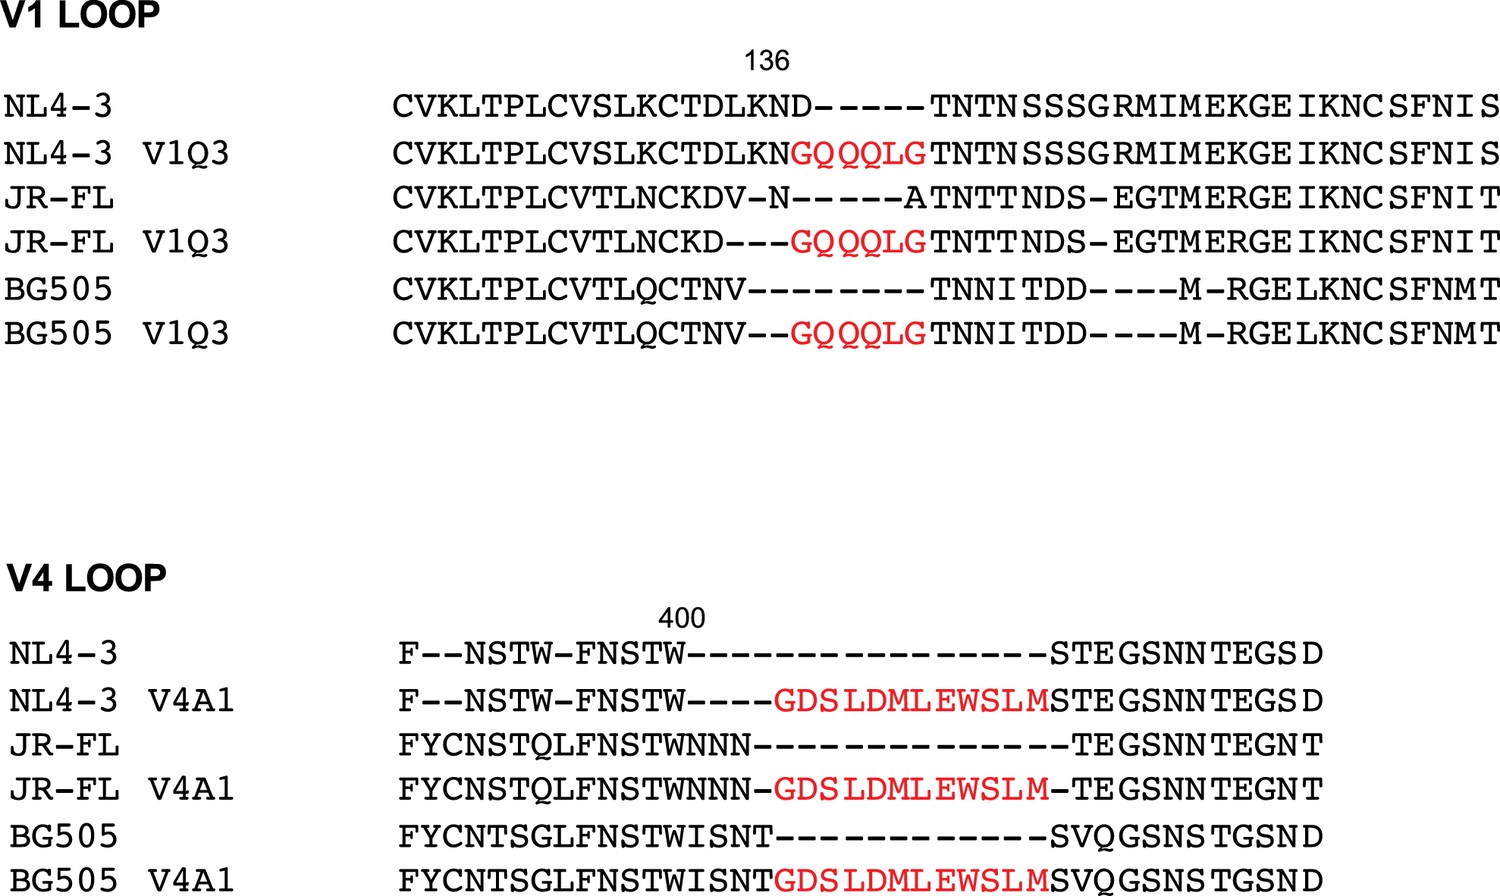
Peptide insertion sites into the V1 and V4 loops of gp120 of three HIV-1 isolates.
Q3 and A1 peptides were inserted into the V1 and V4 loops of gp120 in HIV-1NL4-3, HIV-1JR-FL, HIV-1BG505, respectively (Munro et al., 2014)(HIV-1BG505, this report).
Figure 1—figure supplement 2
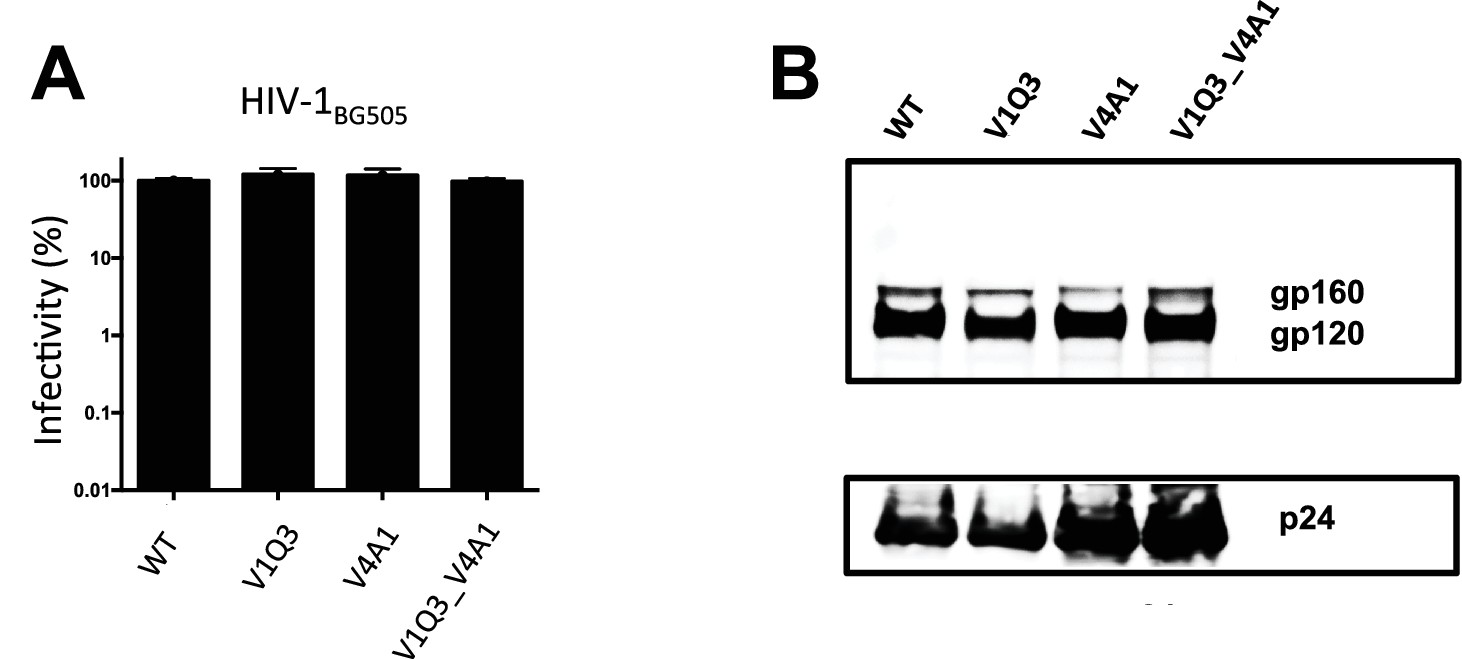
Infectivity and Env incorporation of single or dually tagged HIV-1BG505 viruses.
Q3 (GQQQLG) or A1 (GDSLDMLLEWSLM) tags were inserted separately or together into the V1 and V4 loops of full-length Q23_BG505 virus. (A) Infectivity was measured from three independent experiments by Gaussia Luciferase assay and normalized to WT (%). (B) Env incorporation into virions was detected by Western blotting using an antiserum to HIV-1 gp120 (NIH AIDS Reagent Program) well as an anti-p24 antibody.
Figure 1—figure supplement 3
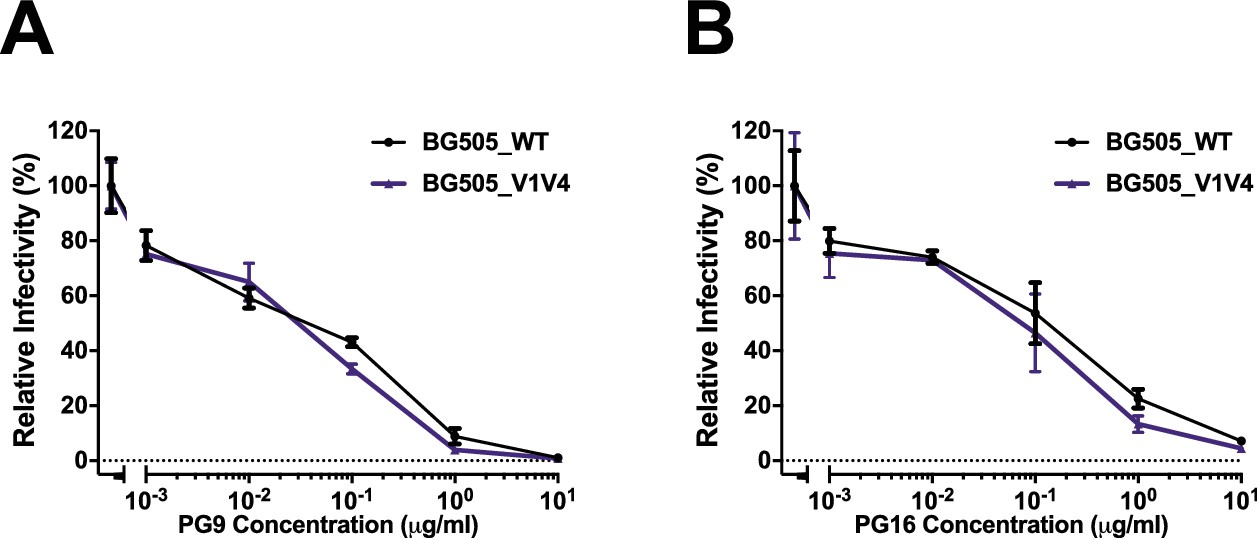
Dually tagged HIV-1BG505 antibodies are neutralized by trimer specific antibodies.
Neutralization of HIV-1 BG505_WT (black) and dually labeled BG505_V1Q3_V4A1 (purple) by the broadly neutralizing antibodies (A) PG9 and (B) PG16. X-axis depicts increasing concentration of antibodies (μg/ml) and the y-axis shows the relative infectivity compared to control in the absence of ligands. Infectivity was measured using the Gaussia Luciferase assay.
Figure 1—figure supplement 4
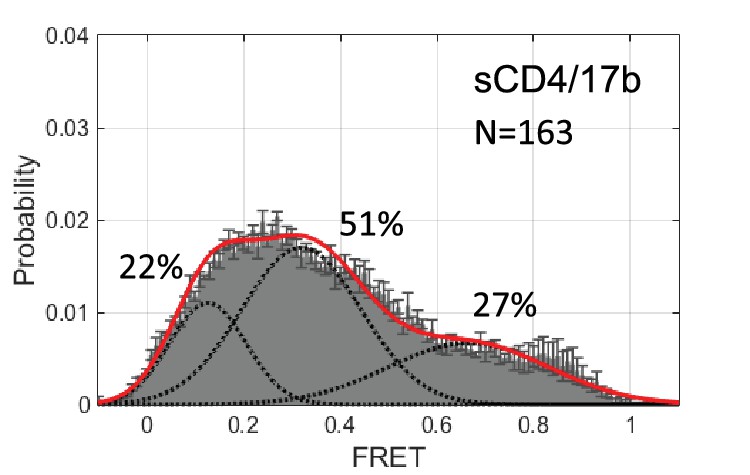
smFRET histogram for HIV-1BG505 Env bound to sCD4 and 17b.
HIV-1BG505 Env carrying virions were incubated with sCD4 and 17b (0.1 mg/ml each) at room temperature for 30 min prior to TIR-FM imaging. FRET trajectories were compiled into histogram and fitted into 3-state Gaussian curves.
Figure 2 with 3 supplements
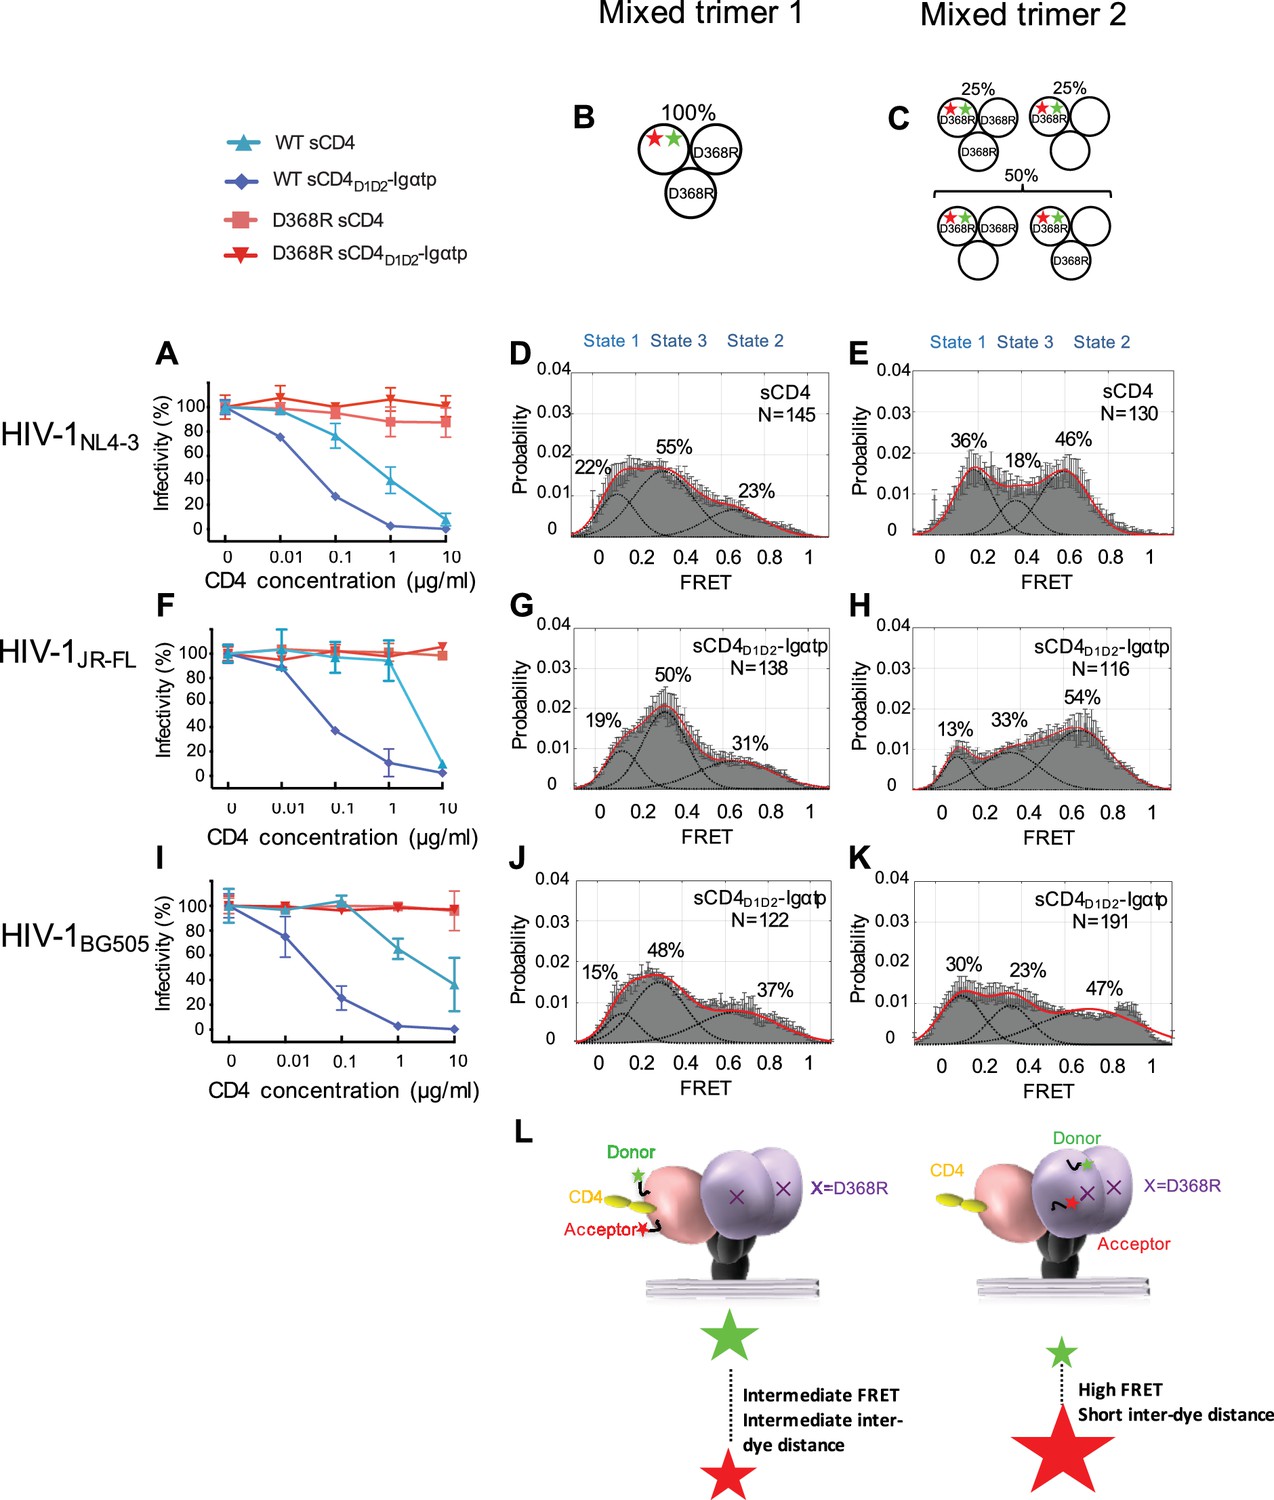
State 2 corresponds to an asymmetric trimer, in which a single CD4 molecule engages HIV-1 Env.
(A) Neutralization curves of WT and D368R HIVNL4-3 viruses by sCD4 and sCD4D1D2-Igαtp. Data represent three independent experiments ± standard deviation. (B) Scheme to illustrate generation of mixed HIV-1 Env trimer 1, in which the two unlabeled protomers contained the D368R mutation to prevent CD4 binding, and the CD4-binding competent WT protomer carried the donor and acceptor fluorophores (green, red stars in scheme above). (C) Scheme to illustrate generation of mixed HIV-1 trimer 2, in which sCD4 can only engage gp120 domains adjacent to the labeled domain. Given the co-transfection protocol of indicated HIV-1 plasmids, only 50% of all trimers are expected to exhibit this configuration. 25% of trimers are expected to carry D368R mutation in all three protomers and the remaining 25% would carry two CD4-binding competent protomers next to the labeled mutant gp120. (D) FRET histogram as in Figure 1 for the mixed HIV-1NL4-3 Env trimer 1. (E) FRET histogram for the mixed HIV-1NL4-3 Env trimer 2. Neutralization curves for HIV-1JR-FL (F) or HIV-1BG505 (I) were shown as in HIV-1NL4-3. FRET histograms for mixed HIV-1JR-FL (G–H) and HIV-1BG505 (J–K) Env trimer 1 and 2 are shown as HIV-1NL4-3. Viruses were incubated with sCD4 (0.1 mg/ml) or sCD4D1D2-Igαtp (0.01 mg/ml) for 30 min prior to imaging as indicated. (L) Schematic illustration of the asymmetric opening of the Env trimer. The CD4-bound conformation is in pink, and the conformational intermediate in the asymmetric trimer is in purple. The purple x indicates the D368R mutation. Green and red stars represent donor and acceptor fluorophores, respectively. Sizes of the stars represent relative change of fluorescence between donor and acceptor dyes and dotted line indicated changes of inter-dye distances.
Figure 2—figure supplement 1
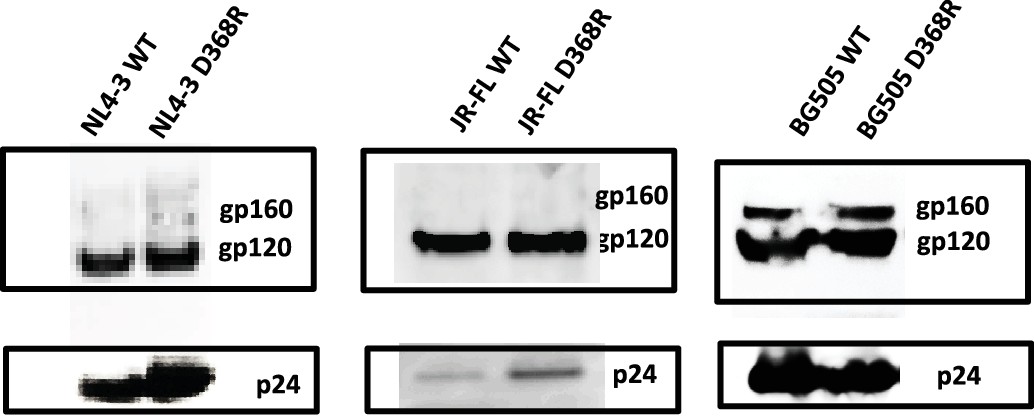
D368R carrying Envs are expressed and incorporated into virions similar to wild-type.
HIV-1 containing WT or D368R Env were produced in HEK293 cells and viral supernatants collected 40 hr post-transfection. Virus was concentrated by centrifugation at 20,000 g and analyzed by SDS-PAGE and Western blot analyses using the anti-Env antibody 2G12 or patient serum (NIH AIDS Reagent Program) to detect Env of HIV-1NL4-3 and HIV-1JR-FL w, or HIV-1BG505, respectively, and anti-p24 to detect capsid.
Figure 2—figure supplement 2
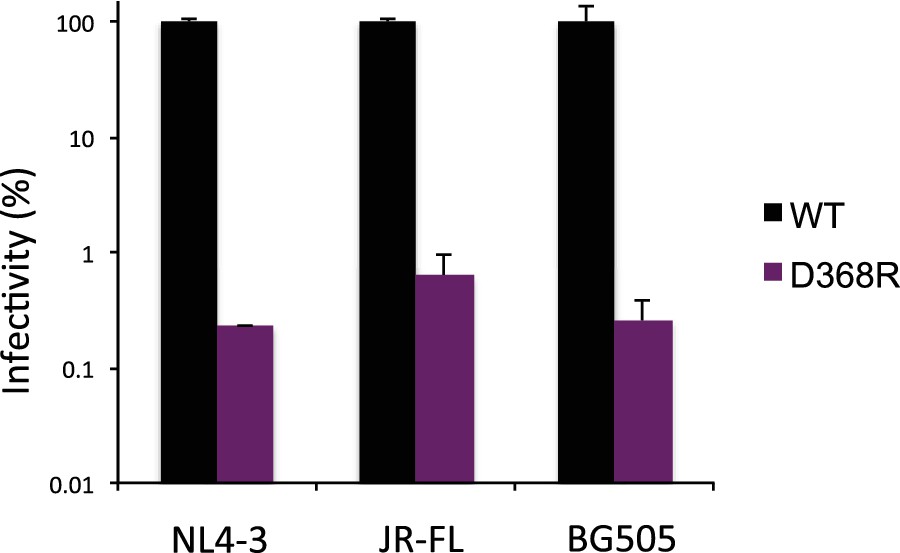
Infectivity of HIV-1D368R viruses.
Infectivity of WT and D368R containing HIV-1 isolates was determined from three independent measurements with ±standard deviation (SD); presented normalized to WT infectivity (%).
Figure 2—figure supplement 3

D368R inhibits sCD4 and sCD4D1D2-Igαtp binding of all three HIV-1 Envs.
(A) FRET histograms as in Figure 1 for the unliganded (left), sCD4-bound (middle) and sCD4D1D2-Igαtp-bound (right) HIV-1NL4-3 Envs carrying the D368R mutation in all protomers. (B) FRET histograms as in (A) for the HIV-1JR-FL Env carrying the D368R mutation in all protomers. (C) FRET histograms as in (A) for the HIV-1BG505 Env carrying the D368R mutation in all protomers. sCD4 (0.1 mg/ml) and sCD4D1D2-Igαtp (0.01 mg/ml) were incubated for 30 min prior to imaging.
Figure 3 with 1 supplement
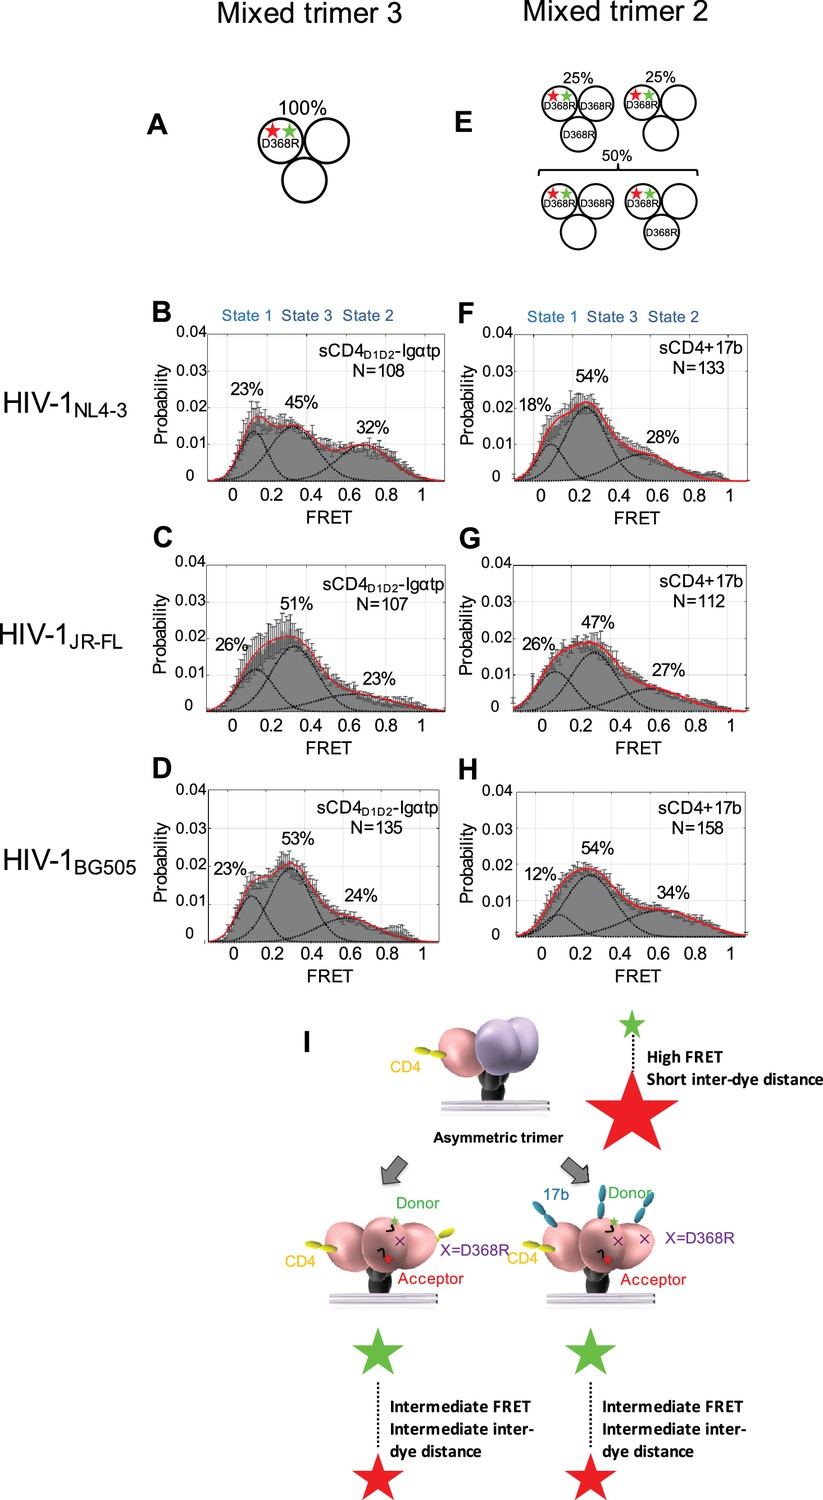
Binding of additional CD4 molecules or coreceptors completely opens the Env trimer.
(A) Scheme to illustrate generation of mixed HIV-1 Env trimer 3, in which two unlabeled protomers are CD4-binding competent and the one protomer carrying the donor and acceptor fluorophores (green, red stars in scheme above) is CD4-binding defective because it has the D368R mutation. (B–D) FRET histograms as in Figure 1 for the mixed HIV-1 Env trimer 3. sCD4D1D2-Igαtp (0.01 mg/ml) was incubated with the virus for 30 min prior to imaging. (E) Scheme to illustrate generation of mixed HIV-1 Env trimer 2, as in Figure 2. (F–H) FRET histograms as in Figure 1 for the mixed HIV-1 Env trimer 2. sCD4 (0.1 mg/ml) and 17b (0.1 mg/ml) were incubated with the virus for 30 min prior to imaging. (I) Schematic illustration of the further activation of the Env trimer. from the asymmetric intermediate. The CD4-bound conformation is in pink, and the conformational intermediate in the asymmetric trimer is in purple. The purple x indicates the D368R mutation. Green and red starts represent donor and acceptor fluorophores, respectively. Sizes of the stars represent relative change of fluorescence between donor and acceptor dyes and dotted line indicated changes of inter-dye distances.
Figure 3—figure supplement 1
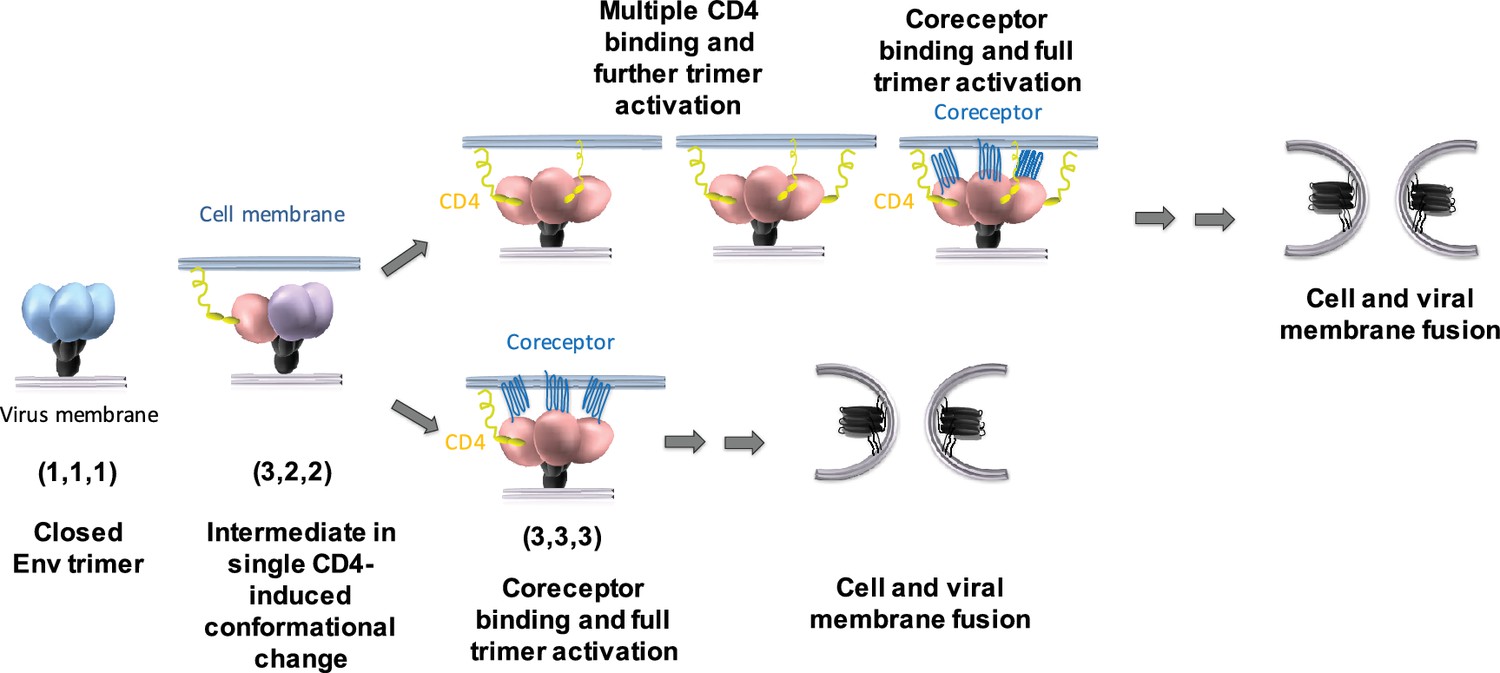
Model for the activation of the HIV-1 Env trimer through asymmetric intermediates.
The Env configuration of the structural trimer intermediates depicts the conformational state of each protomer (State 1 = blue, State 2 = purple, State 3 = pink) within the trimer. See text for details.
Figure 4 with 3 supplements
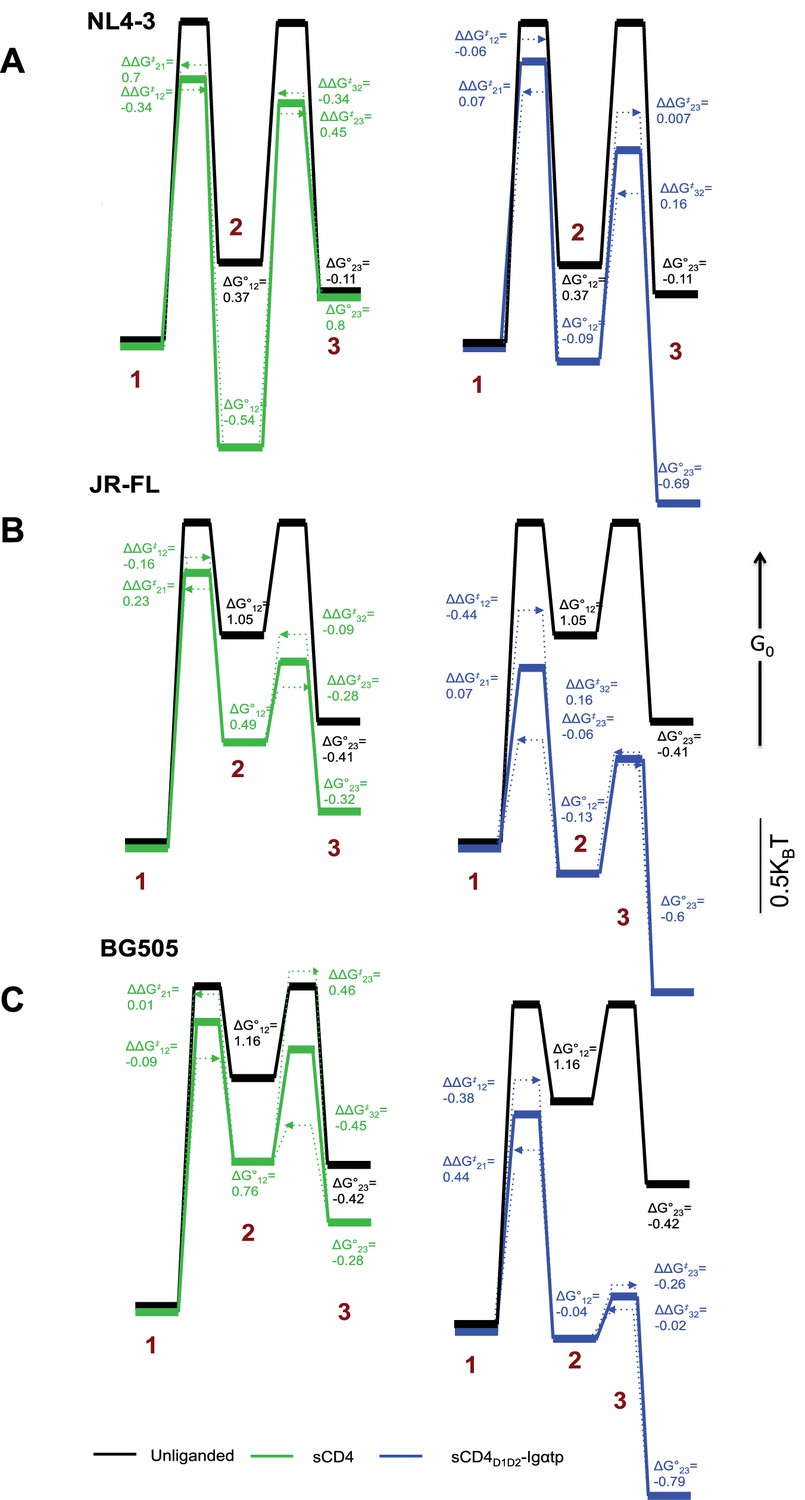
Kinetic analysis of HIV-1 Env binding to CD4.
Differences in free energies (ΔG°ij) between the FRET states, and the changes in activation energies (ΔΔG‡ij) arising from sCD4 and sCD4D1D2-Igαtp binding to (A) HIV-1NL4-3 (B) HIV-1JR-FL and (C) HIV-1BG505. ΔG°ij values were calculated from the occupancies of each FRET state in the FRET histograms. ΔΔG‡ij values were calculated from the rate constants for the observed transitions for the unliganded (black), sCD4-bound (green) and sCD4D1D2-Igαtp-bound (blue) HIV-1 Env. The dotted arrow lines indicate the actual ΔΔG‡ij of the forward and backward transitions while the solid line in between indicate the averaged value of the two. Energies are displayed in units of kBT, where kB is Boltzmann constant, and T is temperature.
Figure 4—figure supplement 1
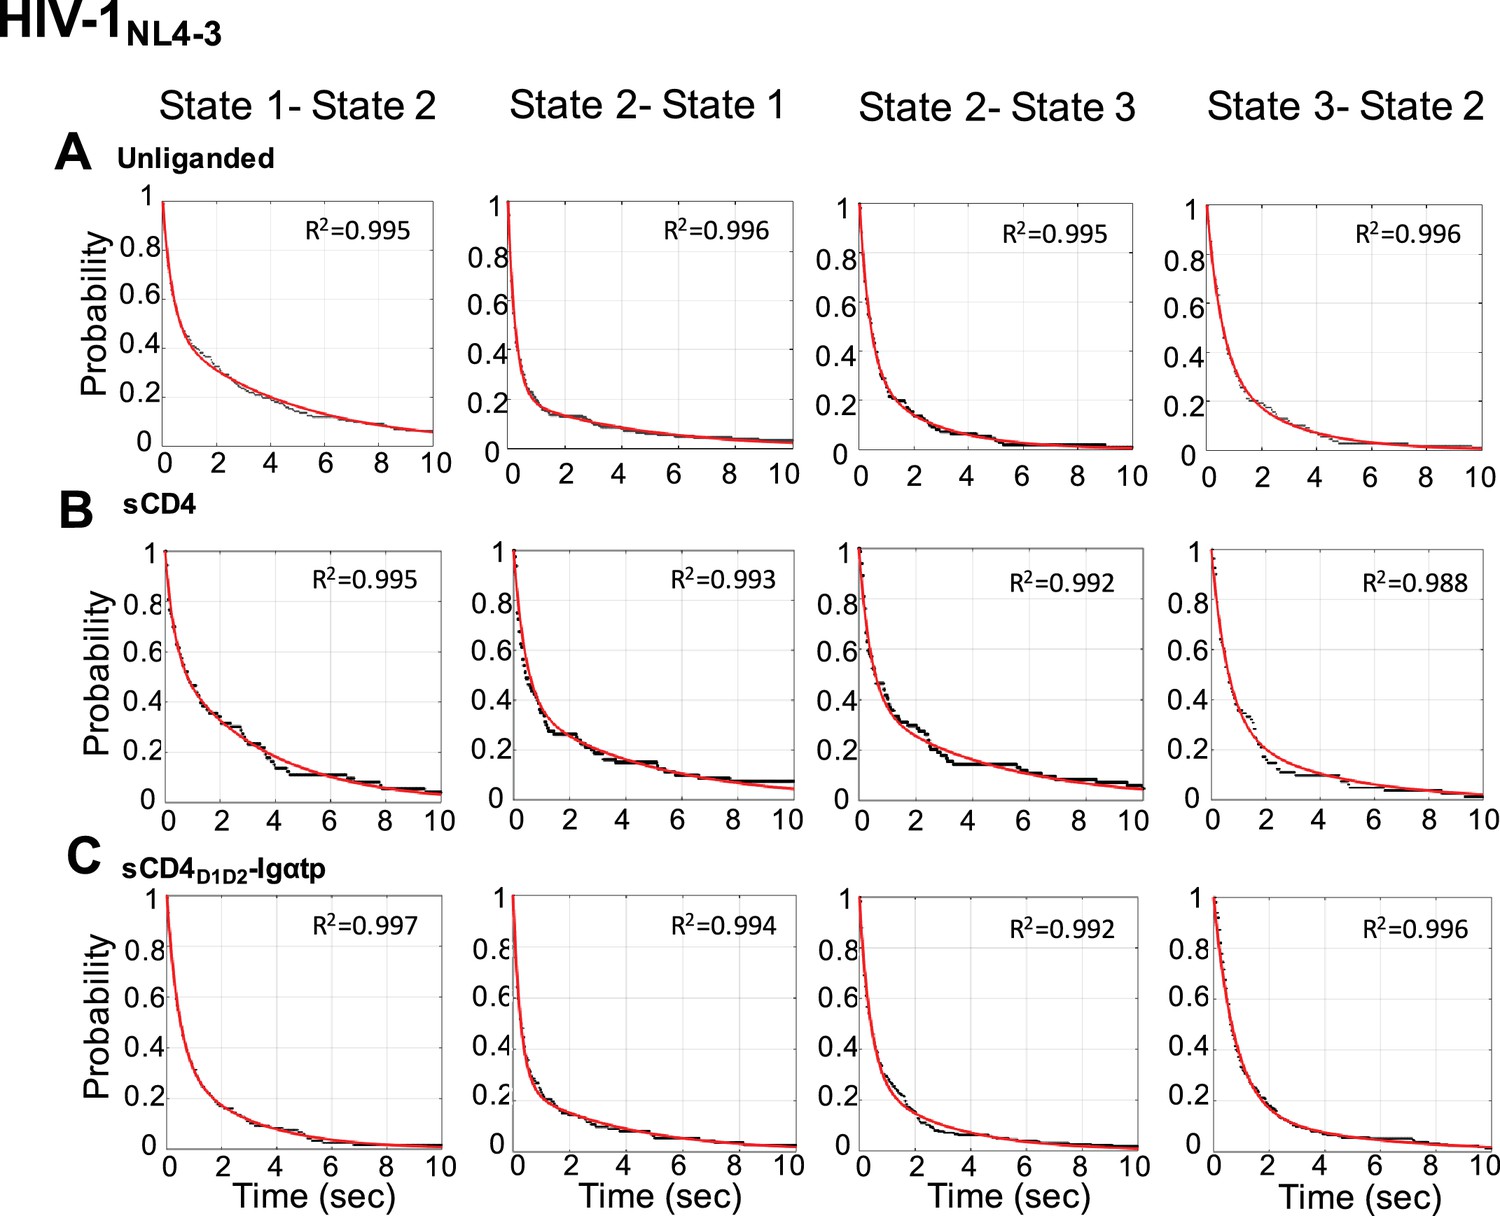
Survival probability distributions for transitions observed in HIV-1NL4-3 Env.
(A–C) Survival probability distributions (gray) for each transition for the unliganded (A), sCD4-bound (B), and sCD4D1D2-Igαtp-bound (C) HIV-1NL4-3 Env. Each distribution was fit to the sum of two exponential distributions (y = A1 exp –k1t + A2 exp –k2t) (red). R2 of curve fitting was indicated in each panel.
Figure 4—figure supplement 2
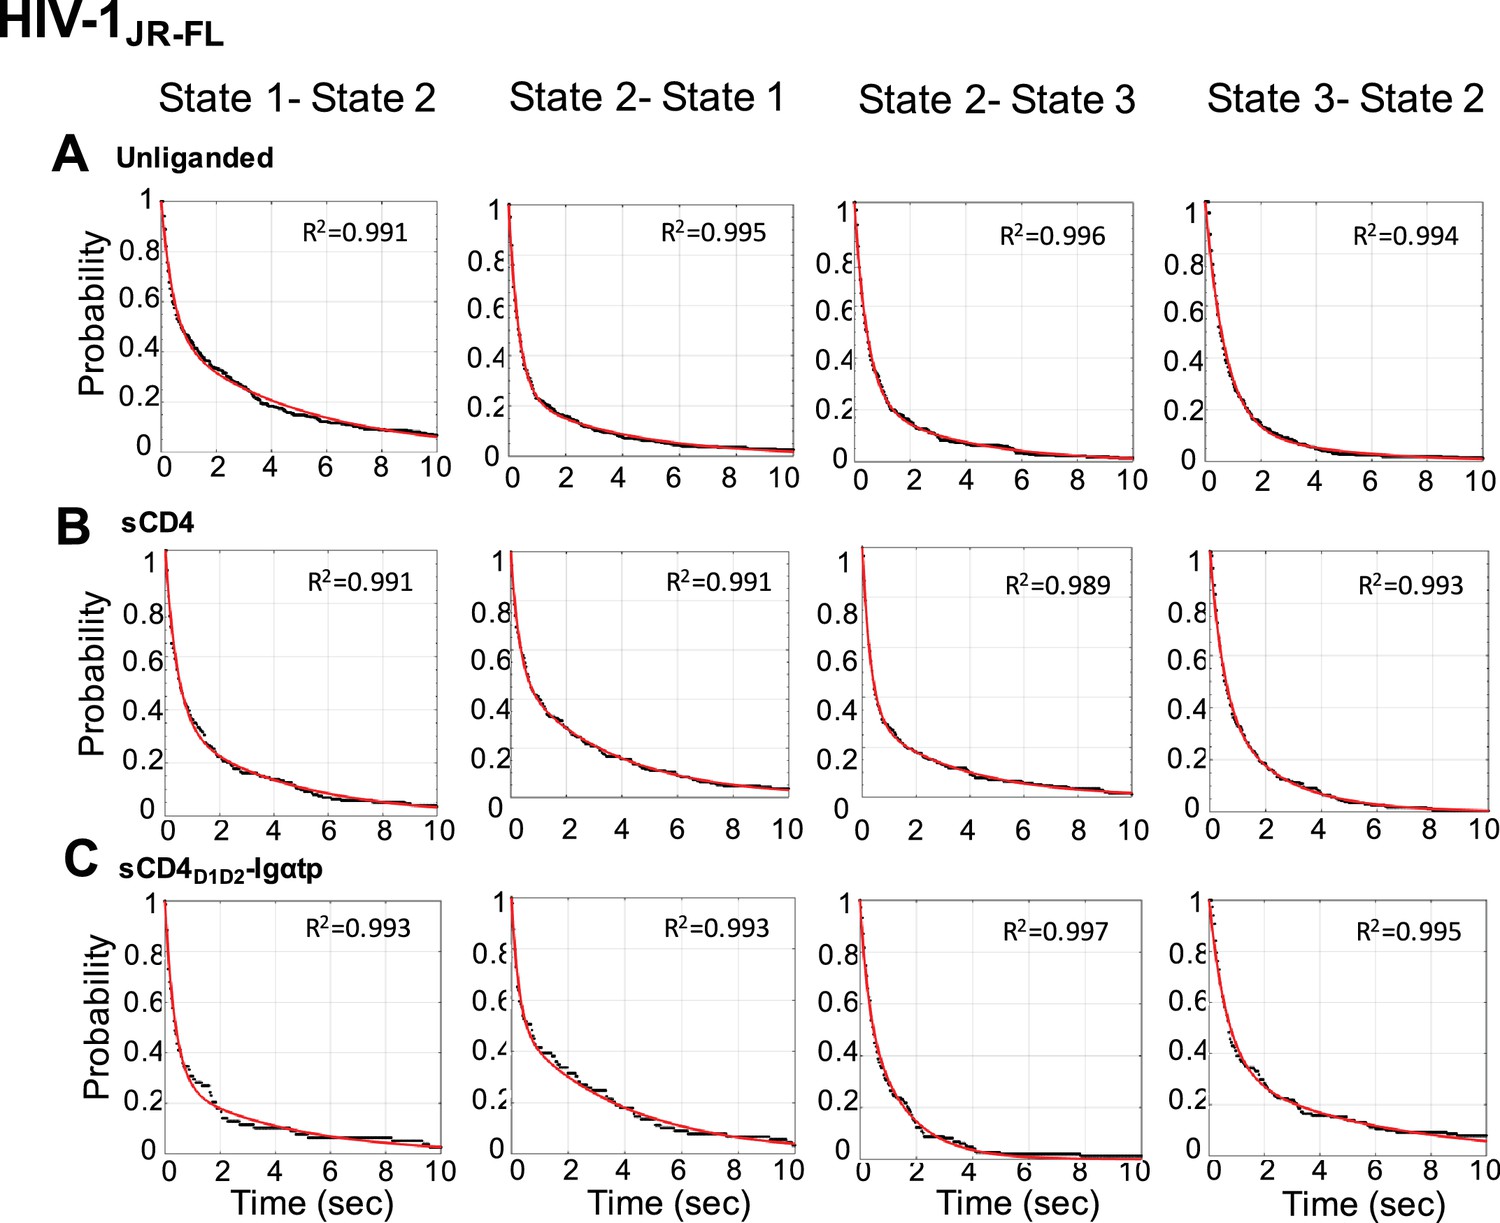
Survival probability distributions for transitions observed in HIV-1JR-FL Env.
Survival probability distributions as in Figure 4—figure supplement 1 for HIV-1JR-FL Env.
Figure 4—figure supplement 3

Survival probability distributions for transitions observed in HIV-1BG505 Env.
Survival probability distributions as in Figure 4—figure supplement 1 for HIV-1BG505 Env.
Tables
Table 1
Rates of transition between all observed FRET states for all three HIV-1 Envs.
The distribution of dwell times in each FRET state, determined through Hidden Markov Modeling (HMM), were fit to the sum of two exponential distributions (y = A1 exp –k1t + A2 exp –k2t) (Figure 4—figure supplements 1–3). The weighted average of the two rate constants from each fit are presented. Error bars represent 95% confidence intervals propagated from the kinetics analysis.
| HIV-1NL4-3 | k1→2 (s−1) | k2→1 (s−1) | k2→3 (s−1) | k3→2 (s−1) |
|---|---|---|---|---|
| Unliganded | 1.50 ± 0.04 | 3.05 ± 0.04 | 1.89 ± 0.05 | 1.32 ± 0.04 |
| sCD4 | 2.10 ± 0.04 | 1.52 ± 0.04 | 1.21 ± 0.03 | 1.85 ± 0.03 |
| sCD4D1D2-Igαtp | 1.60 ± 0.02 | 2.84 ± 0.04 | 1.87 ± 0.04 | 1.13 ± 0.02 |
| HIV-1JR-FL | ||||
| Unliganded | 1.30 ± 0.03 | 2.21 ± 0.03 | 1.70 ± 0.02 | 1.25 ± 0.02 |
| sCD4 | 1.52 ± 0.03 | 1.76 ± 0.04 | 2.25 ± 0.03 | 1.37 ± 0.05 |
| sCD4D1D2-Igαtp | 2.02 ± 0.06 | 2.06 ± 0.05 | 1.81 ± 0.06 | 1.06 ± 0.03 |
| HIV-1BG505 | ||||
| Unliganded | 1.10 ± 0.04 | 4.37 ± 0.08 | 2.86 ± 0.05 | 1.77 ± 0.03 |
| sCD4 | 1.21 ± 0.03 | 4.32 ± 0.08 | 1.81 ± 0.09 | 2.79 ± 0.04 |
| sCD4D1D2-Igαtp | 1.62 ± 0.06 | 2.82 ± 0.05 | 2.92 ± 0.04 | 2.31 ± 0.05 |
Table 2
IC50 of sCD4 or sCD4D1D2-Igαtp of all three HIV-1 isolates.
Neutralization data were analyzed by nonlinear regression analysis and the Ab concentrations (μg/ml) at which 50% of virus infectivity was inhibited, were calculated.
| sCD4 | sCD4D1D2-Igαtp | |||
|---|---|---|---|---|
| WT | D368R | WT | D368R | |
| HIV-1NL4-3 | 0.56 | >50 | 0.03 | >50 |
| HIV-1JR-FL | 3.43 | >50 | 0.06 | >50 |
| HIV-1BG505 | 1.26 | >50 | 0.03 | >50 |
Additional files
-
Transparent reporting form
- https://doi.org/10.7554/eLife.34271.019
Download links
A two-part list of links to download the article, or parts of the article, in various formats.
Downloads (link to download the article as PDF)
Open citations (links to open the citations from this article in various online reference manager services)
Cite this article (links to download the citations from this article in formats compatible with various reference manager tools)
HIV-1 Env trimer opens through an asymmetric intermediate in which individual protomers adopt distinct conformations
eLife 7:e34271.
https://doi.org/10.7554/eLife.34271


