Wnt5a signaling induced phosphorylation increases APT1 activity and promotes melanoma metastatic behavior
- University of Pennsylvania, United States
- University of Chicago, United States
Figures
Figure 1

Wnt5a signaling induces APT1 phosphorylation on serines 209 and 210.
(A) Annotated MS/MS spectrum of identified S209 phosphopeptide of protein APT1. The image represents the observed fragment ions collected using MS/MS (HCD). Colored lines represent matches between observed and expected fragment ions of the given peptides. Specifically, blue lines represent matches with y-type fragments, red lines with b-type fragments, and purple lines show immonium ions. (B) Annotated MS/MS spectrum of identified S210 phosphopeptide of protein APT1, as described in A. (C) APT1WT-CFP-FLAG was immunoprecipitated from lysates prepared from WM239A melanoma cells expressing APT1WT-CFP-FLAG treated with control buffer or 150 ng/ml of purified Wnt5a for 15 min and analyzed by SDS-PAGE followed by immunoblotting to detect phosphorylated APT1 using antibodies to pS209-APT1 and pS210-APT1. (D) Western blot of whole cell lysate (WCL) from WM239A cells expressing APT1WT-CFP-FLAG treated with control buffer or 150 ng/ml of Wnt5a for 15 min. (E) WM239A cells expressing APT1WT-CFP-FLAG were treated with control buffer or 150 ng/ml of Wnt5a for increasing lengths of time and then APT1WT-CFP-FLAG was immunoprecipitated and analyzed by SDS-PAGE and immunoblotting to detect phosphorylated APT1 with anti-p210-APT1 antibody. (F) WM239A cells expressing APT1WT-CFP-FLAG (WT) or APT1SA -CFP-FLAG (SA) were treated with control buffer or 150 ng/ml of Wnt5a for 15 min. APT1 was immunoprecipitated and analyzed by SDS-PAGE and immunoblotting to detect phosphorylated APT1 with anti-pS209-APT1 antibodies. (G) Three-dimensional model of APT1, showing the positions of Ser209 and Ser210 (magenta) adjacent to the catalytic residues Ser119, Asp174 and His208 (cyan).
Figure 2 with 1 supplement

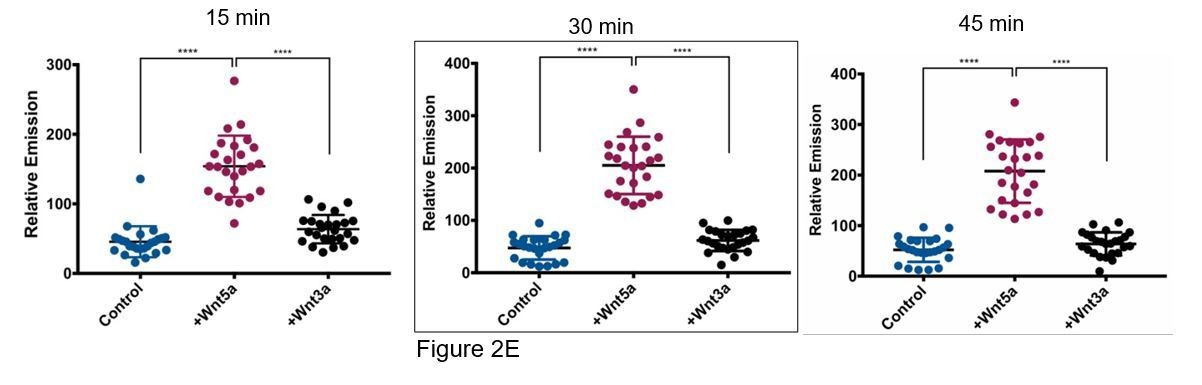
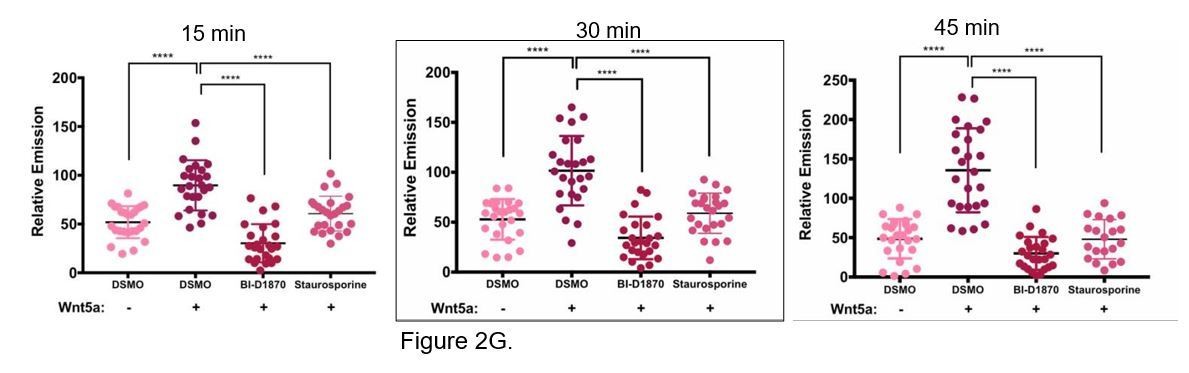
Wnt5a stimulation increases APT1 depalmitoylating activity through phosphorylation.
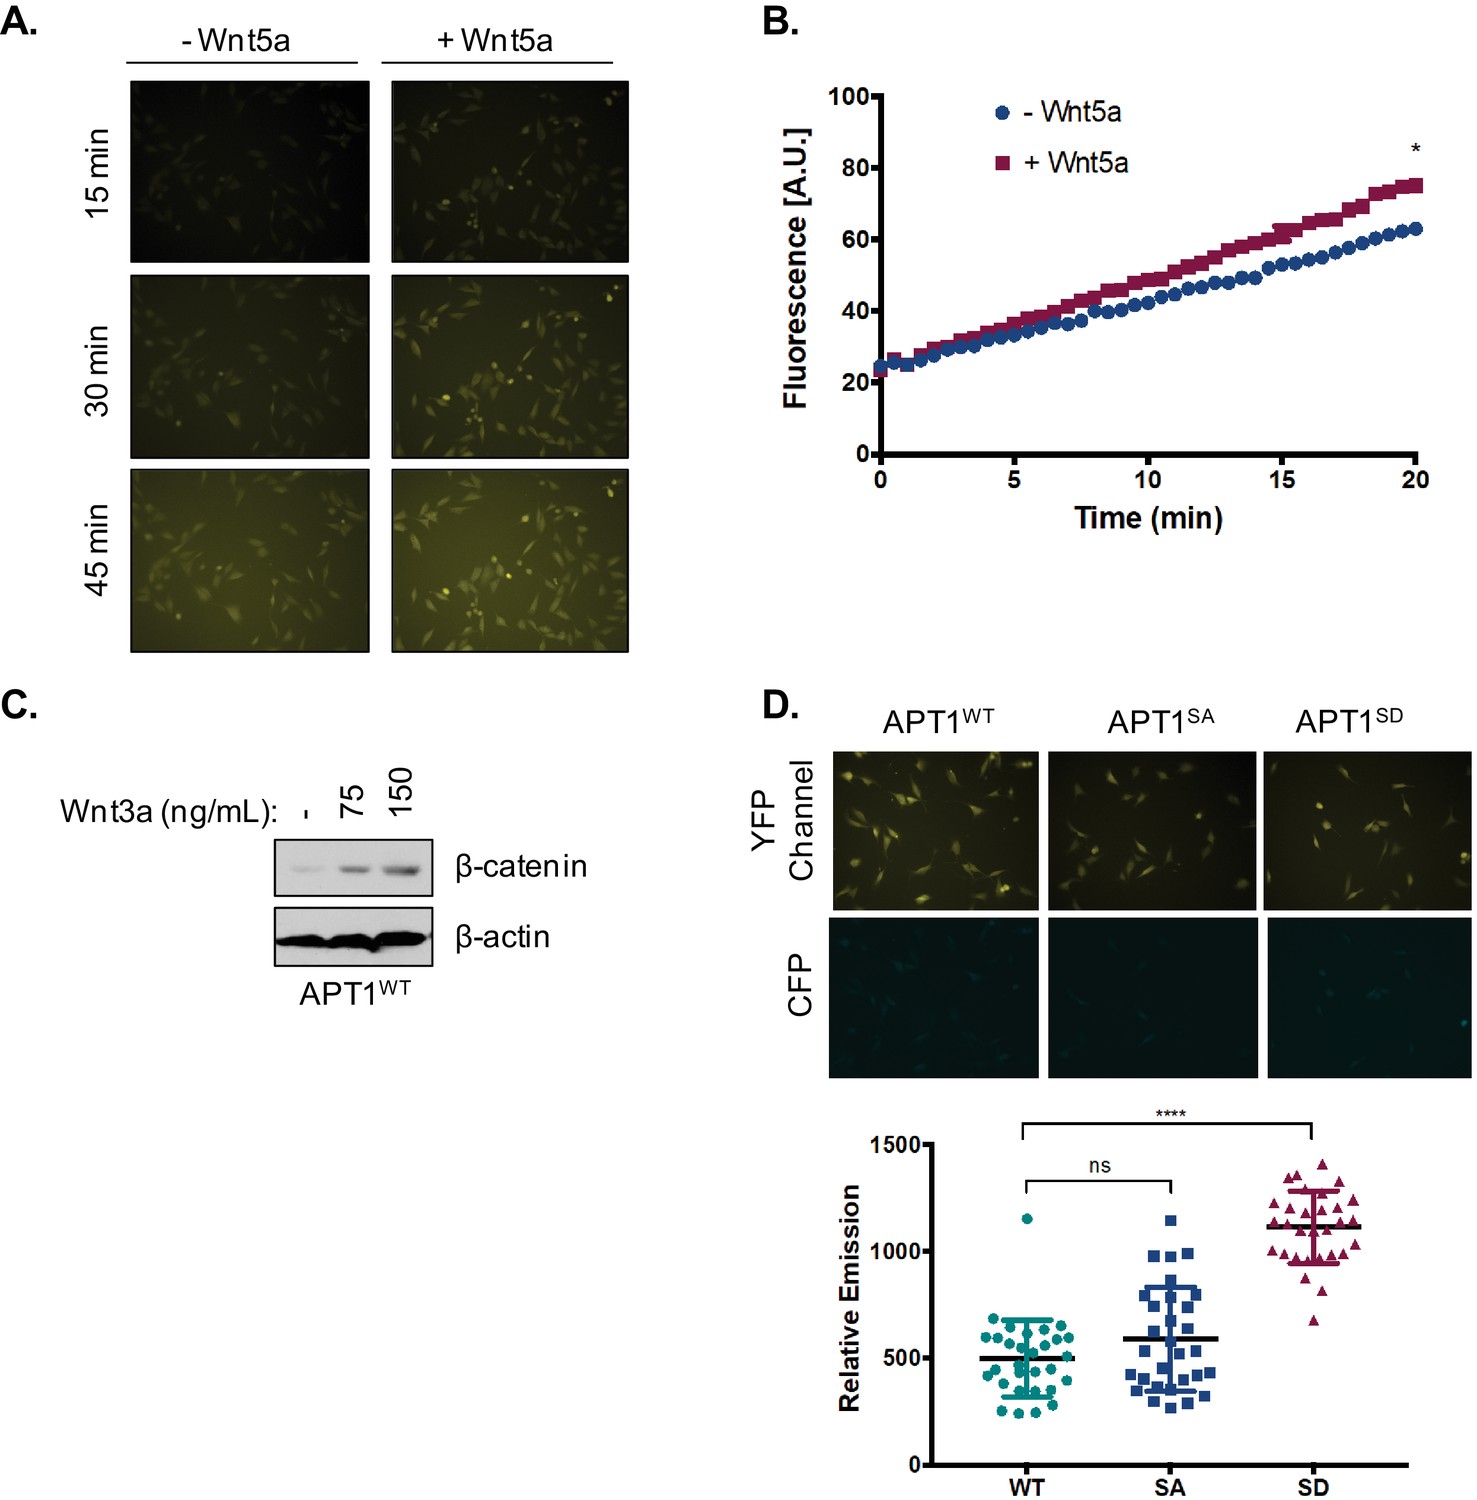
(A) In vitro fluorescence assays using 5 μM of depalmitoylation probe DPP-3 in HEPES (20 mM, pH 7.4, 150 mM NaCl, 0.1% Triton X-100) with either 50 nM purified APT1WT, APT1S209D or catalytically inactive APT1S119A and fluorescence emission was measured over time (λex490/9 nm; λem545/20 nm). Error bars indicate s.e.m., n = 3 replicates per condition. Results shown are from a representative trial from three independent experiments. (B) Linear regression of APT1WT (WT) enzymatic activity measured by fluorescence emission of increasing DPP-3 substrate concentrations over time. Results are averaged from six independent experiments. (C) Linear regression of APT1S209D (SD) enzymatic activity measured by fluorescence emission of increasing DPP-3 substrate concentrations over time. Results are averaged from six independent runs. (D) Quantification of relative fluorescence of WM239A cells treated with control buffer or 150 ng/ml of Wnt5a, loaded with 10 μM DPP-3, and then analyzed by live-cell fluorescence microscopy over time. Error bars indicate s.d., n = 25 cells per condition, ****p<0.0001 by unpaired t-test analysis. Results shown are from three experiments. (E) Quantification of relative fluorescence of WM239A cells expressing APT1WT treated with control buffer, 150 ng/ml of Wnt5a, or 150 ng/ml of Wnt3a, loaded with 5 μM DPP-3, and then analyzed by live-cell fluorescence microscopy after 30 min. Error bars indicate s.d., n = 25 cells per condition, ****p<0.0001 by unpaired t-test analysis. Results shown are from three experiments. (F) Quantification of relative fluorescence generated by WM239A cells expressing either APT1WT (WT), APT1SA (SA), or APT1S209D (SD) treated with control buffer or 150 ng/ml Wnt5a, loaded with 10 μM DPP-3, and then analyzed by live-cell fluorescence microscopy after 30 min. Error bars indicate s.d., n = 17–32 cells per condition, ****p<0.0001 by unpaired t-test analysis. Results shown are from three experiments. (G) Quantification of relative fluorescence of WM239A APT1WT cells treated with kinases inhibitors 10 μM BI-D1870, or 0.2 μM staurosporine or DMSO control for 1 hr, loaded with 10 μM DPP-3, treated with Wnt5a and analyzed by live-cell fluorescence microscopy after 30 min. Error bars indicate s.d., n = 25 cells per condition, ****p<0.0001 by unpaired t-test analysis. Results shown are from three experiments.Quantification for all live-cell microscopy was determined by measuring the mean intensity of relative fluorescence for region of interests (background fluorescence was subtracted from mean intensity).
Figure 2—figure supplement 1
Activity of APT1 in response to Wnt5a stimulation or the phosphomimetic mutation.
(A) Representative images of WM239A cells loaded with 10 μM DPP-3, treated with control buffer or 150 ng/ml Wnt5a, and then analyzed by live-cell fluorescence microscopy at 15 min, 30 min, and 45 min, quantified in Figure 2D. (B) APT1WT was immunoprecipitated from WM239A whole cell lysate pre-treated with control buffer or 150 ng/ml Wnt5a and analyzed by in vitro fluorescence assay. *p<0.05 by unpaired t-test analysis of – Wnt5a and +Wnt5 a groups. (C) WM239A APT1WT cells were treated with control buffer, 75 nl/ml, or 150 ng/ml of recombinant Wnt3a for 1 hr, lysate was harvested and analyzed by SDS-PAGE to determine β-catenin stabilization. (D) Top panel: Representative images of APT1WT, APT1SA and APT1S209D WM239A cells treated with 10 μM of DPP-3 for 15 min, and then analyzed by live-cell microscopy. Bottom panel: Quantification of relative fluorescence of WM239A APT1WT (WT), APT1SA (SA), and APT1S209D (SD) cells treated with control buffer or 150 ng/ml Wnt5a, loaded with 10 μM DPP-3, and then analyzed by live-cell fluorescence microscopy after 30 min. Error bars indicate s.d., n = 17–32 cells per condition, ****p<0.0001 by unpaired t-test analysis.
Figure 3
APT1 phosphorylation increases APT1 depalmitoylating activity in cells and increases melanoma invasion.
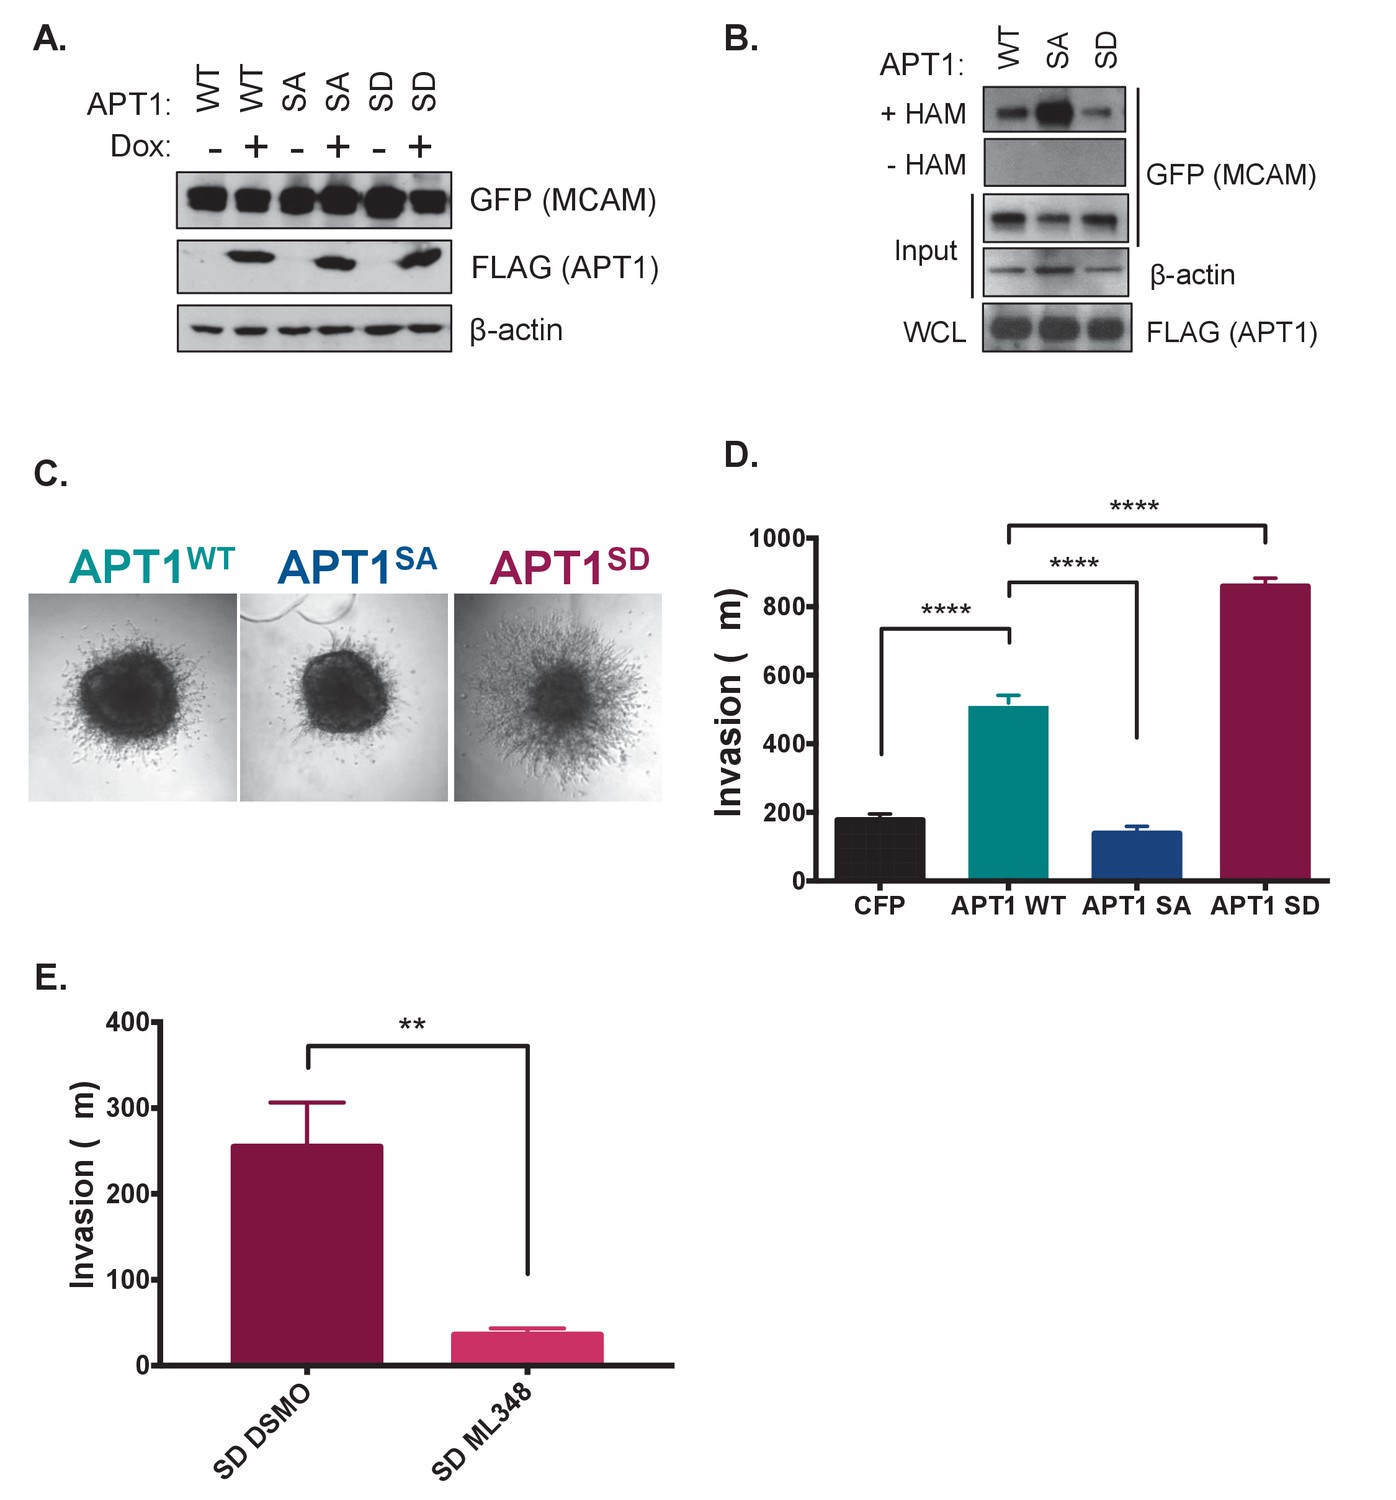
(A) HEK 293T cells transfected with constitutively transcribed MCAM-GFP and doxycycline inducible APT1WT-FLAG (WT), APT1SA-FLAG (SA), or APT1S209D-FLAG (SD). After 15 hr of induction with 1 μg/ml doxycycline, APT1 protein expression was determined by immunoblotting with anti-GFP (MCAM-GFP) and anti-FLAG (APT1-FLAG) antibodies. (B) An acyl biotin exchange (ABE) assay was used to measure MCAM palmitoylation in cell lysates from cell lines described in (A). In the ABE assay addition of hydroxylamine (+HAM) removes palmitate from cysteine residues that are then conjugated to biotin-HPDP. Biotinylated proteins are then isolated on streptavidin beads and palmitoylated proteins are analyzed by SDS-PAGE followed by immunoblotting. Hydroxylamine is withheld as a negative control (-HAM) MCAM-GFP is detected with anti-GFP antibodies and APT1-FLAG is detected with anti-FLAG antibodies. Results shown are a representative trial from three independent experiments. (C) WM239A melanoma cells expressing APT1WT (WT), APT1SA (SA), or APT1S209D (SD) were grown on agarose to form spheroids that were embedded in collagen and images were taken on day seven and the distance invaded was measured. Representative images from day seven are shown. (D) Quantification of WM239A spheroid invasion assay in (C). Error bars indicate s.e.m., n = 14–34 spheroids counted per condition, ****p<0.0001 by unpaired t-test analysis. Results shown are from four experiments. (E) Quantification of WM239A spheroid invasion assay of APT1S209D (SD) treated with DSMO control or 10 μM ML348, every other day for 7 days and distance invaded measured at day 7. Error bars indicate s.e.m., n = 6 spheroids counted per condition, **p=0.0017 by unpaired t-test analysis. Results shown are a representative trial from three independent experiments.
Figure 4
APT1 phosphorylation impedes APT1 dimer formation.
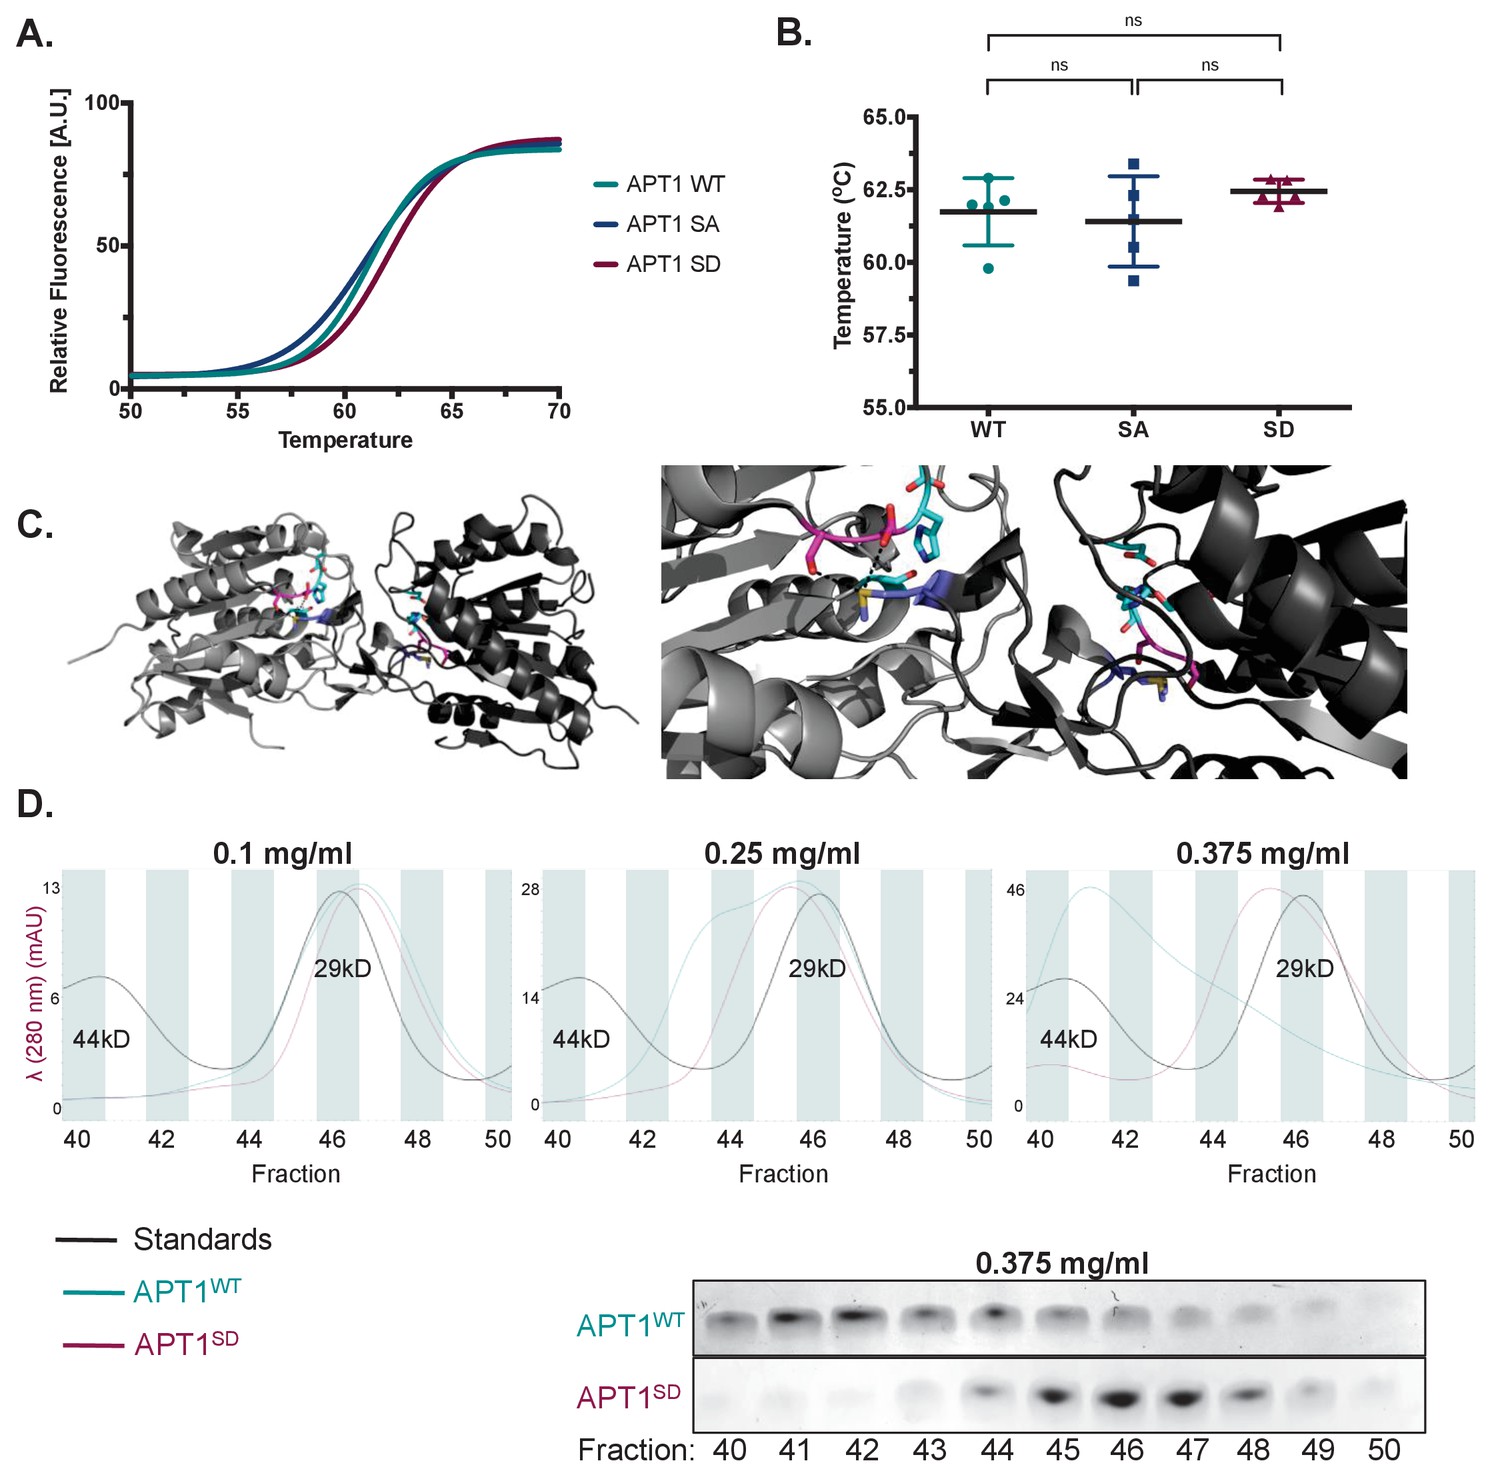
(A) Differential scanning fluorimetry (DSF) of purified APT1WT, APT1SA and APT1S209D. (B) Melting curves of purified APT1WT, APT1SA and APT1S209D as determined by DSF. Results shown from DSF analysis are a representative trial from three independent experiments. (C) Left panel: Three-dimensional model of crystal structure of APT1 dimer interface. Ser209 and Ser210 (pink) are located 4.3 Å away from Met65 (blue) of the adjacent APT1 monomer. Catalytic triad Ser119, Asp174 and His208 are highlighted (cyan). Right panel: Zoom in of APT1 dimer interface. (D) Top panels: Chromatogram of purified APT1WT (cyan), APT1S209D (magenta), and molecular weight standards Ovalbumin (44kD) and Carbonic anhydrase (29kD) (black) from size-exclusion chromatography at three protein concentrations (Y-axis indicates the mAU of the APT1SD). Bottom panel: SDS-PAGE followed by coomassie staining of eluted fractions after separation by size-exclusion chromatography of APT1WT and APT1S209D.
Figure 5 with 1 supplement

Increased phospho-APT1 staining correlates with increased melanoma tumor grade and metastasis.
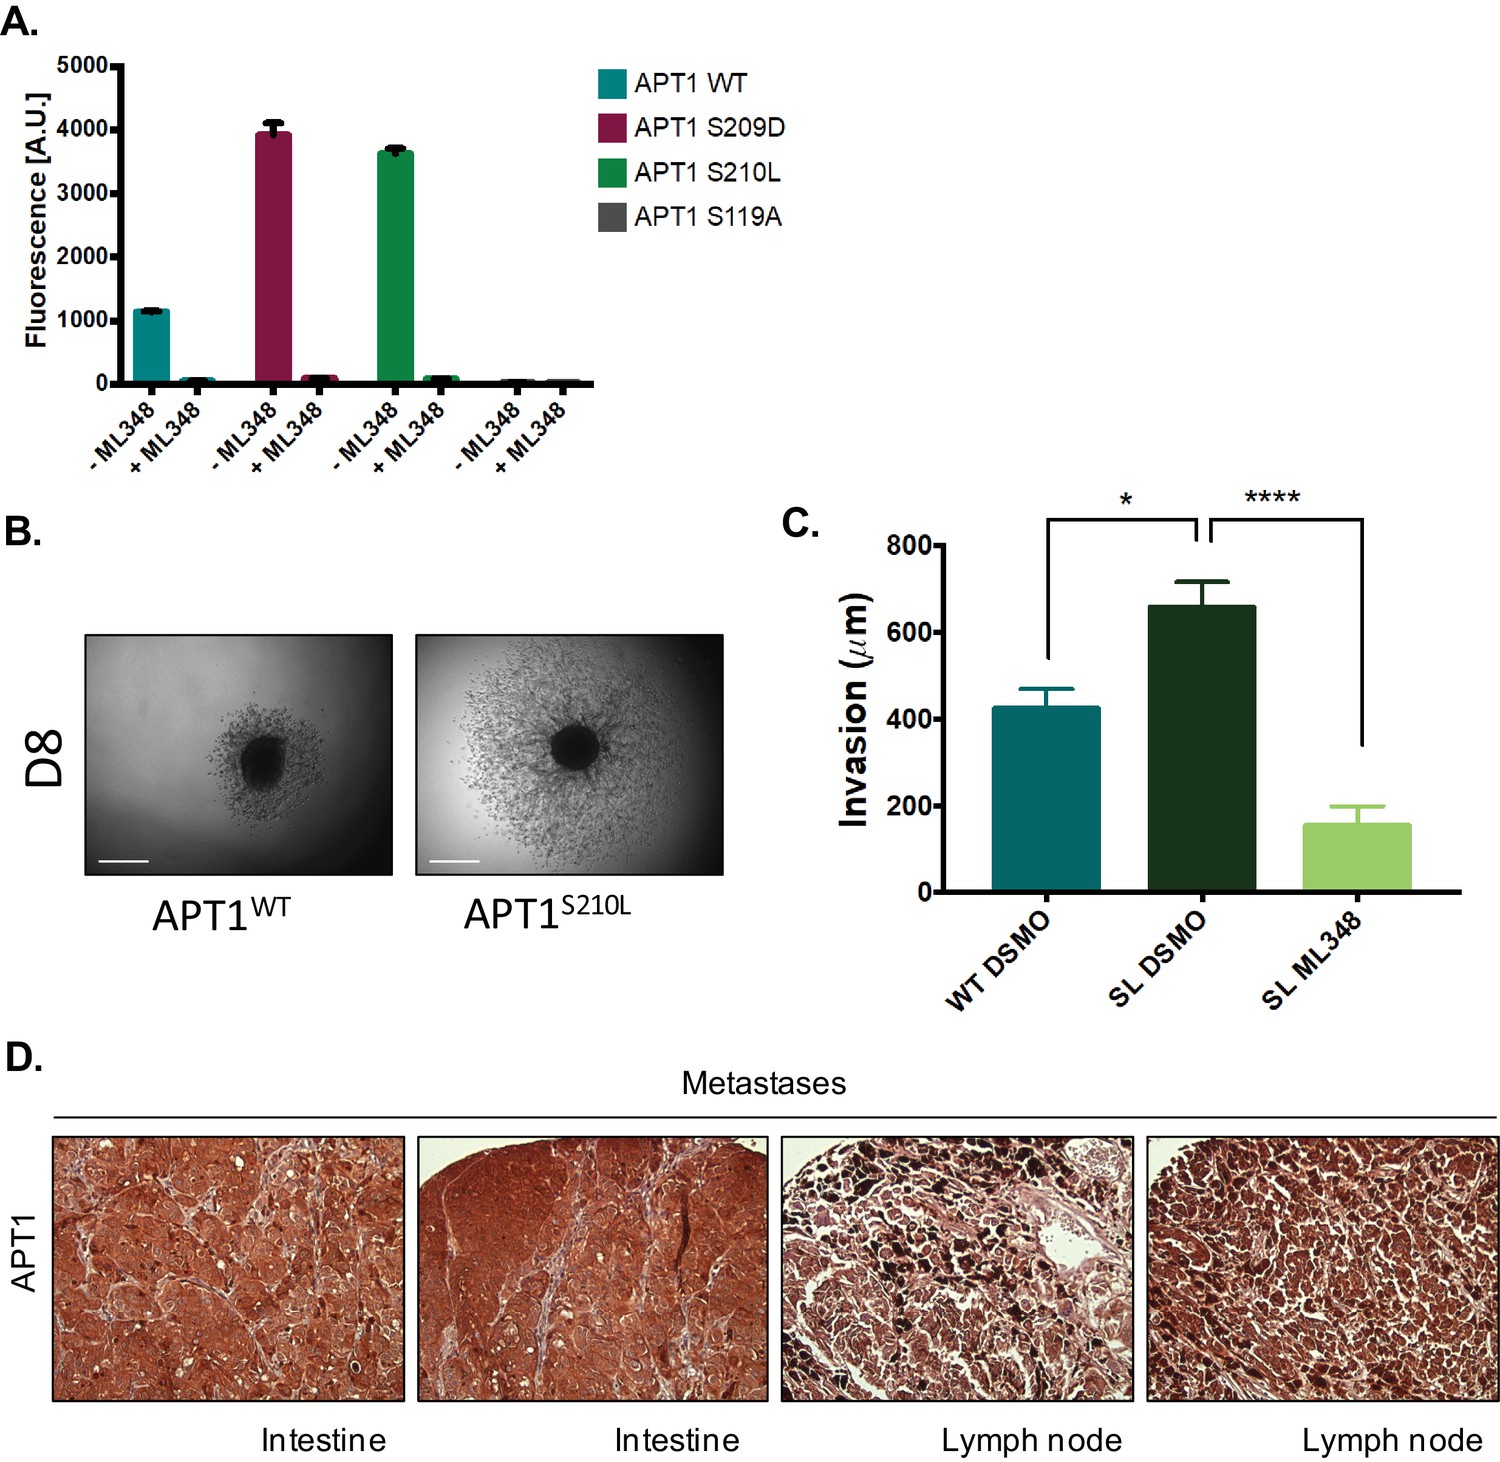
(A) Schematic of APT1 mutations from human tumor samples. Adapted from results generated using cBioPortal (Gao et al., 2013 and Cerami et al., 2012). (B) In vitro fluorescence assays of 5 μM of DPP-3 with either 50 nM purified APT1WT, APT1S210L APT1S209D, or catalytically inactive APT1S119A and fluorescence emission was measured (λex490/9 nm; λem545/20 nm). Error bars indicate s.e.m., n = 3 replicates per condition. Results shown are a representative trial from three independent experiments. (C) Three-dimensional model of crystal structure of APT1 dimer interface with Ser210 to Leu mutation. Ser210Leu (pink) is located 5.5 Å away from Met65 (blue) of the adjacent APT1 monomer. Catalytic triad Ser119, Asp174 and His208 are shown in cyan. (D) Quantification of WM239A CFP-FLAG (CFP), APT1WT-CFP-FLAG (WT), and APT1S210L-CFP-FLAG (S210L) spheroids embedded in collagen and distance invaded measured at day 8. Error bars indicate s.e.m., n = 8 spheroids per condition, *p=0.0150 by unpaired t-test analysis. Results shown are from three independent experiments. (E) Immunohistochemistry staining of melanoma tumors in a human melanoma tumor array using pS209-APT1 and APT1 antibodies. (F) Immunohistochemistry staining of metastatic tumor samples in a human melanoma tumor array using anti-pS209-APT1.
Figure 5—figure supplement 1
Response of the APT1 S210L mutant to the APT1 inhibitor ML348.
(A) Quantification of fluorescence response of 5 μM DPP-3 treated with either 50 nM purified APT1 (APT1WT, APT1S209D, APT1S210L, or catalytically inactive APT1S119A) for 30 min each in the presence or absence of 50 µM ML348 (λex490/9 nm; λem545/20 nm). Error bars indicate s.d., n = 3 replicates per condition. Results shown are a representative trial from three experiments. (B) Representative images of APT1WT and APT1S210L collagen invasion assay in Figure 5D. Images are of spheroids on day 8 (D8). Scale bar = 500 µm. (C) Quantification of WM239A spheroid invasion assay of APT1S210L (SL) treated with DSMO control or 10 μM ML348 every other day for 7 days and distance invaded measured on day 7. Error bars indicate s.e.m., n = 5–6 spheroids per condition, ****p<0.0001 by unpaired t-test analysis. Results are from three independent experiments. (D) Immunohistochemistry staining of metastatic tumors in a human melanoma tumor array using anti-APT1 antibodies.
Author response image 1
Author response image 2
Tables
Table 1
Enzyme kinetics of APT1WT and APT1S209D.
Table of initial velocities (V0) of APT1WT and APT1S209D. Values were determined by incubating purified APT1WT and APT1S209D with increasing concentrations of DPP-3 substrates and measuring fluorescence for 240 s. The initial velocity of the reactions for APT1WT and APT1S209D activity was calculated by fitting the linear regression of the fluorescence vs. time. Results are averaged from six independent experiments.
| Fluoresence/Time (V0) | ||
|---|---|---|
| Substrate | APT1WT | APT1SD |
| 0.25μM | 0.2012 ± 0.008627 | 0.4704 ± 0.01765 |
| 0.5 µM | 0.2316 ± 0.02656 | 0.8083 ± 0.03173 |
| 1.0 µM | 0.5496 ± 0.01478 | 1.612 ± 0.04416 |
| 5.0 µM | 0.6573 ± 0.03547 | 4.627 ± 0.2237 |
Additional files
-
Transparent reporting form
- https://doi.org/10.7554/eLife.34362.010
Download links
A two-part list of links to download the article, or parts of the article, in various formats.
Downloads (link to download the article as PDF)
Open citations (links to open the citations from this article in various online reference manager services)
Cite this article (links to download the citations from this article in formats compatible with various reference manager tools)
Wnt5a signaling induced phosphorylation increases APT1 activity and promotes melanoma metastatic behavior
eLife 7:e34362.
https://doi.org/10.7554/eLife.34362


