Dkk2 promotes neural crest specification by activating Wnt/β-catenin signaling in a GSK3β independent manner
- New York University, United States
- Daegu University, Republic of Korea
Figures
Figure 1 with 2 supplements
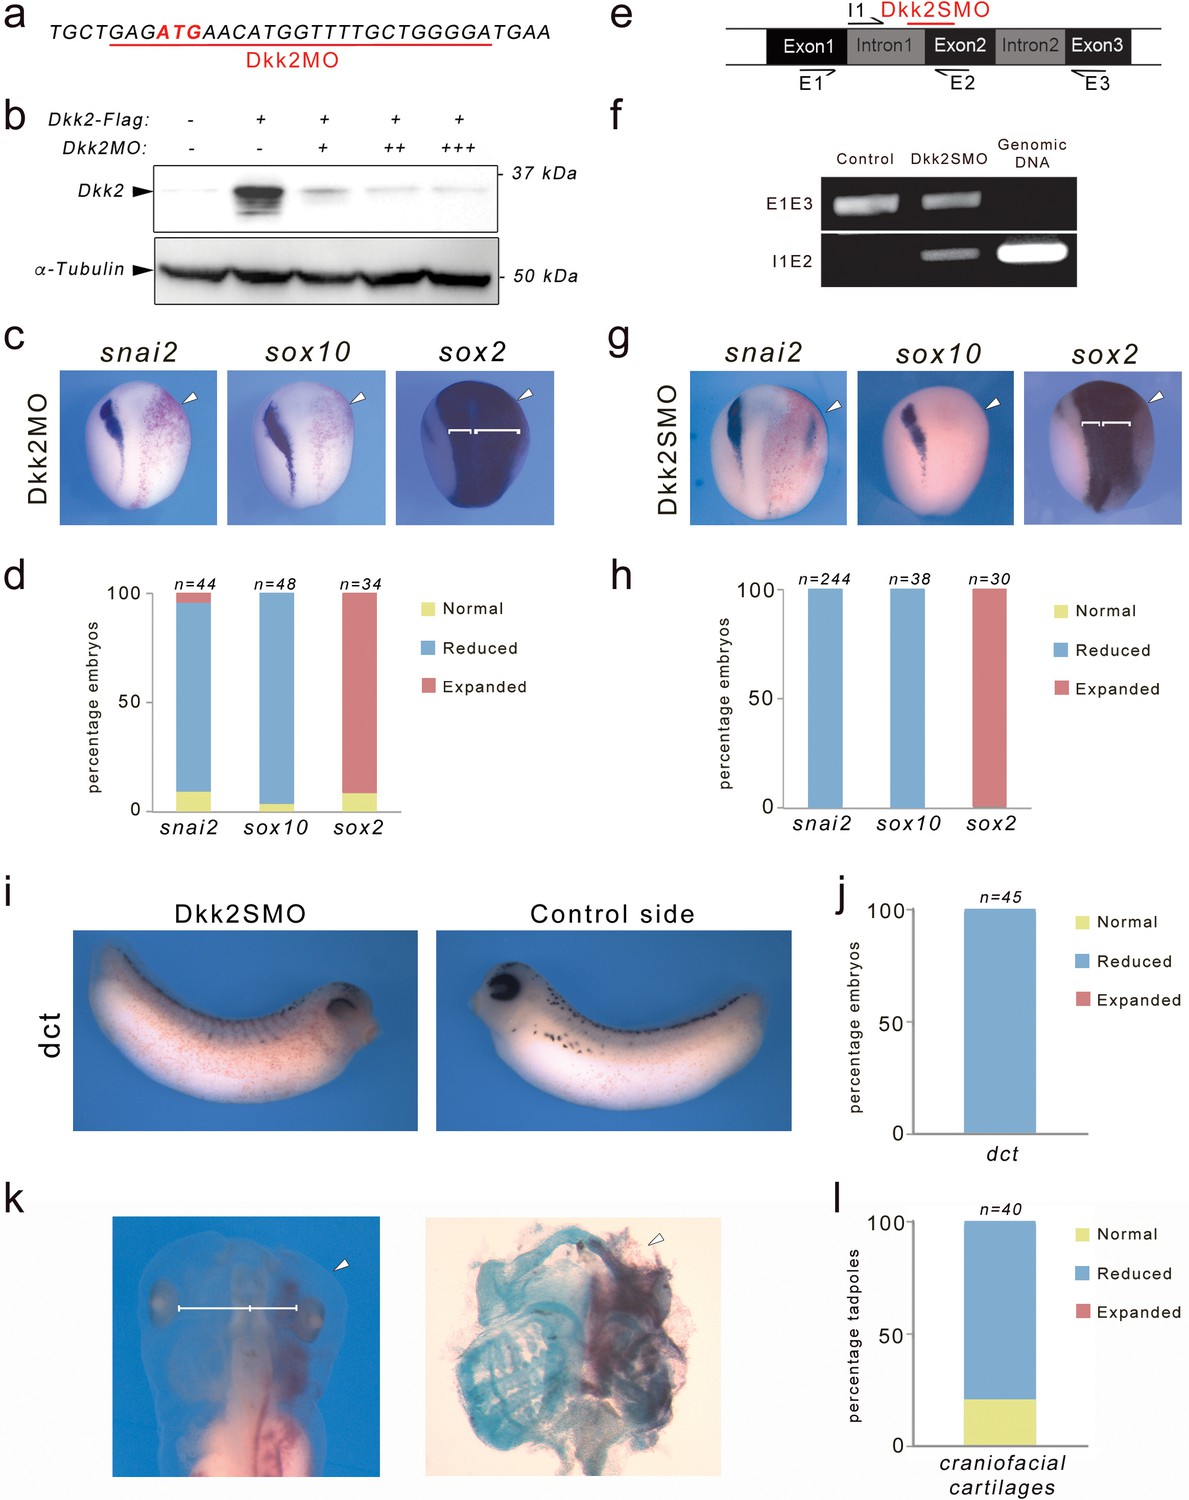
Dkk2 knockdown blocks neural crest formation in vivo.
(a) The translation blocking MO (Dkk2MO) targets the initiation codon. (b) Western blot using lysates from embryos injected with Dkk2-Flag mRNA (10 ng) alone or in combination with increasing amounts of Dkk2MO, 2 ng (+), 5 ng (++), and 10 ng (+++), shows that Dkk2MO blocks Dkk2 protein accumulation in vivo. α-tubulin is shown as a loading control. (c) Unilateral injection of Dkk2MO (30 ng) at the 2 cell stage caused a reduction of snai2 and sox10 expression and a lateral expansion of sox2 expression domain (brackets). The injected side (arrowheads) is to the right as indicated by the presence of the lineage tracer (Red-Gal). Dorsal views, anterior to top. (d) Quantification of the Dkk2MO phenotype. (e) Schematic representation of the dkk2 locus. The PCR primers used for the analysis of spliced transcripts are indicated. The position of the splice (Dkk2SMO) blocking MO is shown (red). (f) In Dkk2SMO-injected embryos a larger dkk2 transcript is detected due to intron 1 retention. For all samples, the RT-PCR was performed under the same experimental conditions. (g) Unilateral injection of Dkk2SMO (30 ng) also resulted in a reduction of snai2 and sox10 expression and a lateral expansion of sox2 expression domain (brackets). The injected side (arrowheads) is to the right as indicated by the presence of the lineage tracer (Red-Gal). Dorsal views, anterior to top. (h) Quantification of the Dkk2SMO phenotype. (i) At stage 30, Dkk2SMO-injected embryos show reduced dct expression. Lateral views, dorsal to top. (j) Quantification of the Dkk2SMO phenotype. (k) At stage 45, Dkk2SMO-injected tadpoles (20 ng) have reduced craniofacial structures (left panel). The white line indicates the distance between the brain and the eyes. These tadpoles have reduced craniofacial cartilages as revealed by alcian blue staining (right panel). In both panels the injected side (arrowheads) is to the right as indicated by the presence of the lineage tracer (Red-Gal). Ventral view, anterior to top. (l) Quantification of the results from three independent experiments. In all the graphs (d, h, j, l), the number of embryos analyzed (n) is indicated on the top of each bar.
-
Figure 1—source data 1
Quantification of Dkk2 knockdown phenotype.
- https://doi.org/10.7554/eLife.34404.005
Figure 1—figure supplement 1
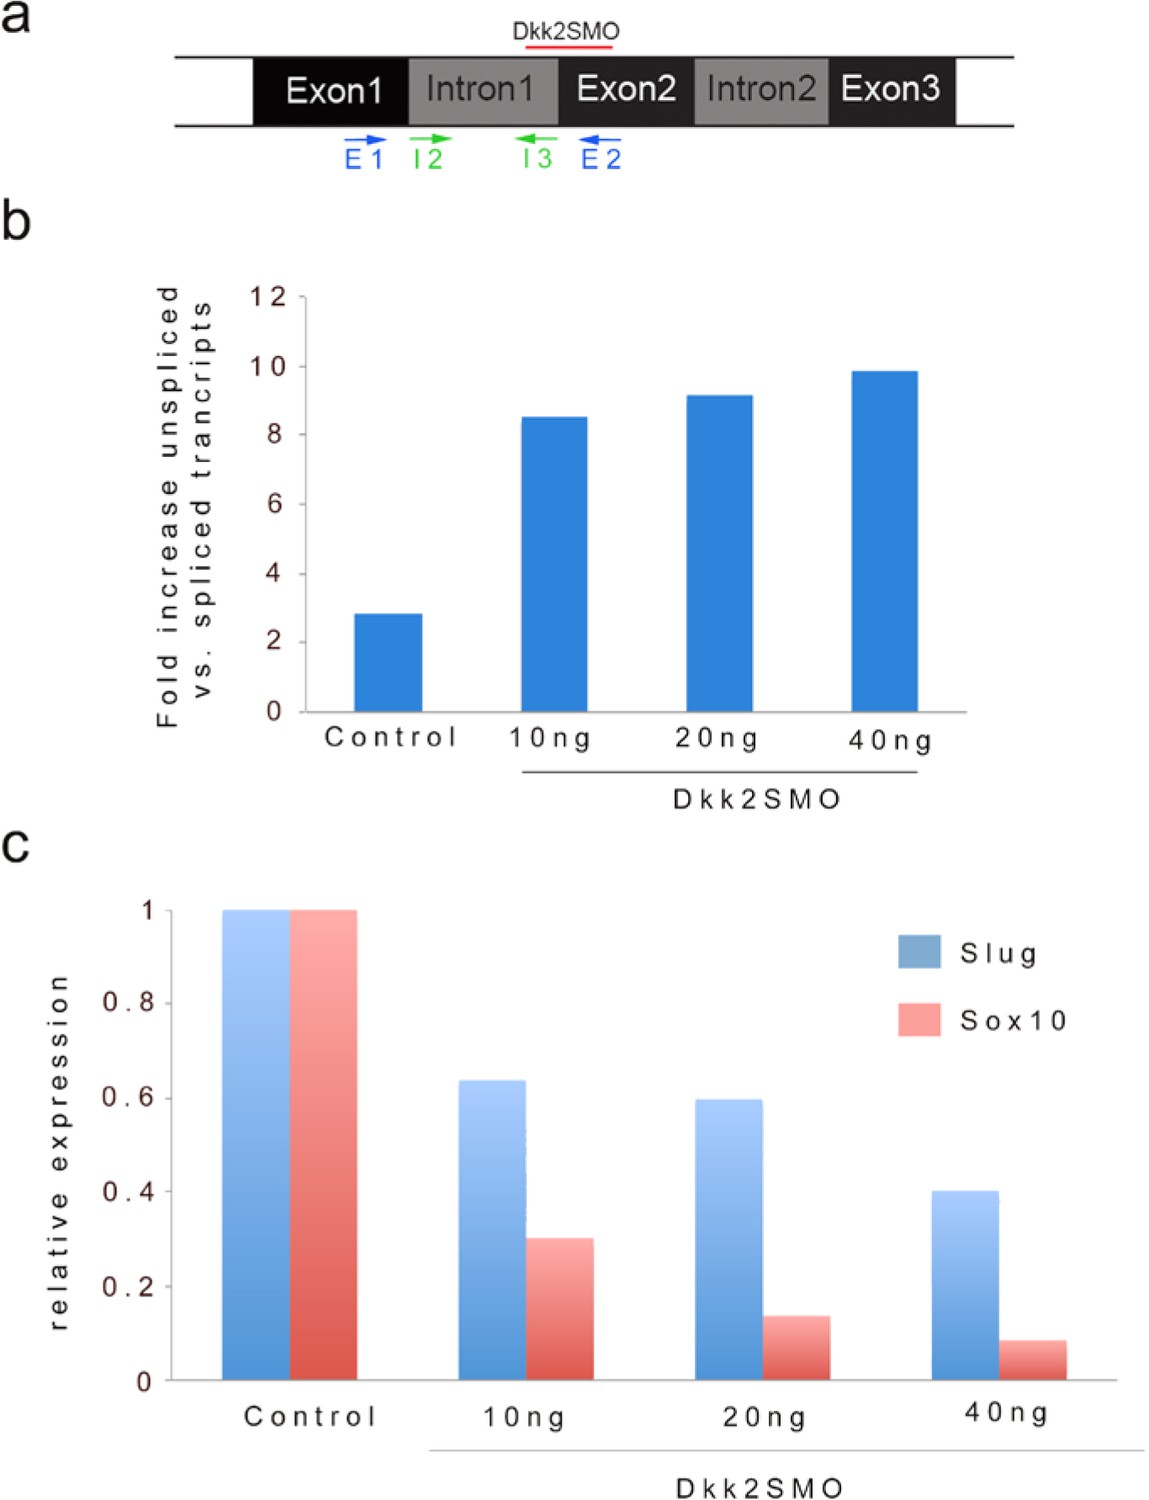
Quantification of unspliced vs. spliced transcripts in MO-injected embryos.
(a) Schematic representation of the dkk2 locus. The position of the splice blocking MO (Dkk2SMO) is shown (red line). The PCR primers used to analyze the spliced (E1/E2) and unspliced (I2/I3) transcripts are indicated. (b) qRT-PCR analysis of fold increase in unspliced (intron one retention) vs. spliced transcripts upon injection of increasing doses of MO. (c) Increasing amount of MO resulted in a dose-dependent decrease in snai2 and sox10 expression in these embryos. A representative experiment is shown.
Figure 1—figure supplement 2
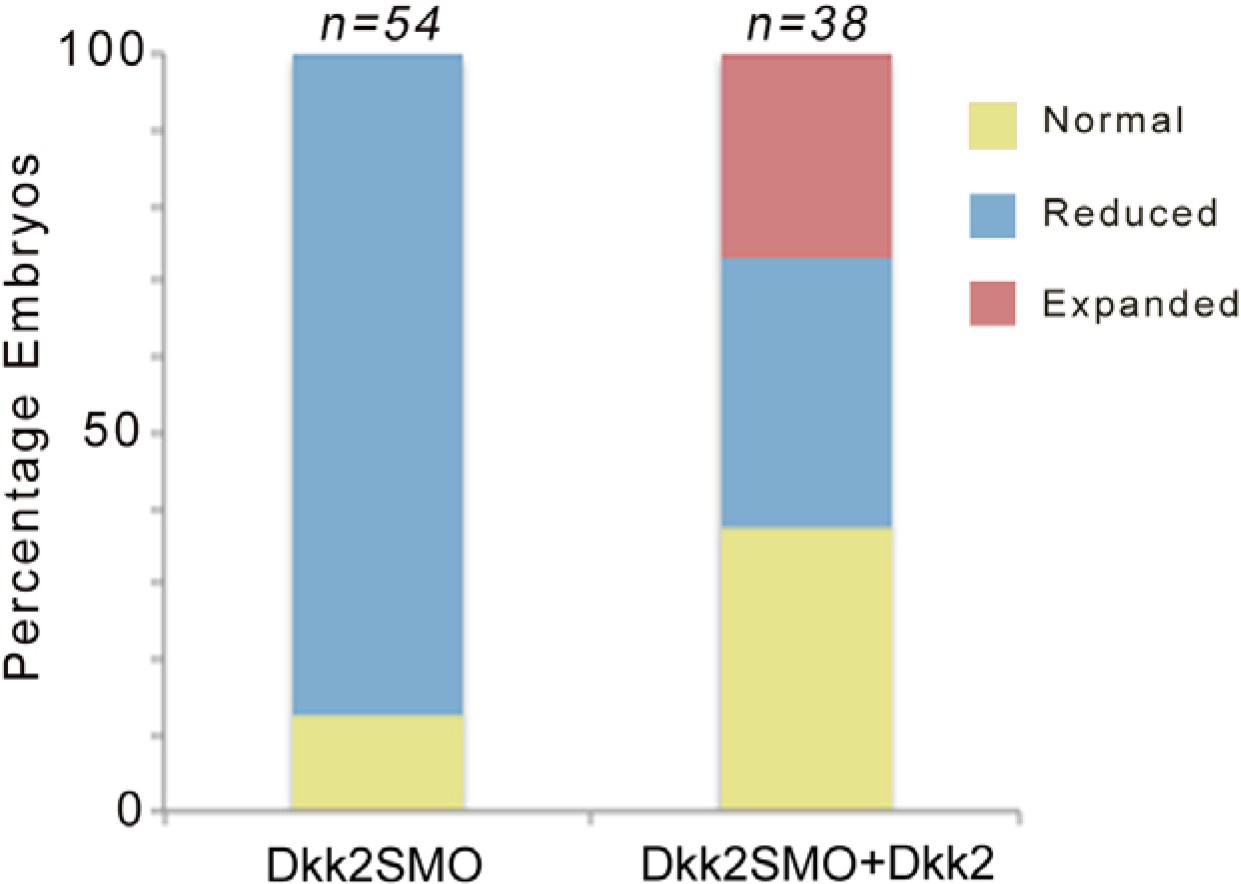
Dkk2 plasmid DNA injection rescues snai2 expression in morphant embryos.
Injection of Xenopus Dkk2 plasmid DNA (10 pg) restores snai2 expression in Dkk2SMO-injected (30 ng) embryos. Results from two independent experiments. For the phenotype of Dkk2 gain of function see Figure 6.
Figure 2

Dkk2 knockdown does not affect the expression of neural plate border specifiers and mesoderm formation.
(a). Unilateral injection of Dkk2SMO (20 ng) did not affect the expression levels of pax3, sox8 and snai1, although their expression was shifted laterally. (b) The neural crest specifier twist1 was reduced, while sox9 expression was shifted laterally in most embryos. The epidermal marker, krt, was reduced in a pattern consistent with the expansion of the neural plate. (c) The expression levels of the mesoderm markers myod, actc1 and pcdh8 were unchanged in Dkk2-depleted embryos, although pcdh8 expression domain was shifted anteriorly in a subset of morphant embryos. (a–c) Dorsal views, anterior to top. (d) Quantification of the Dkk2SMO phenotype. The number of embryos analyzed (n) is indicated on the top of each bar.
-
Figure 2—source data 1
Quantification of Dkk2 knockdown phenotype.
- https://doi.org/10.7554/eLife.34404.007
Figure 3
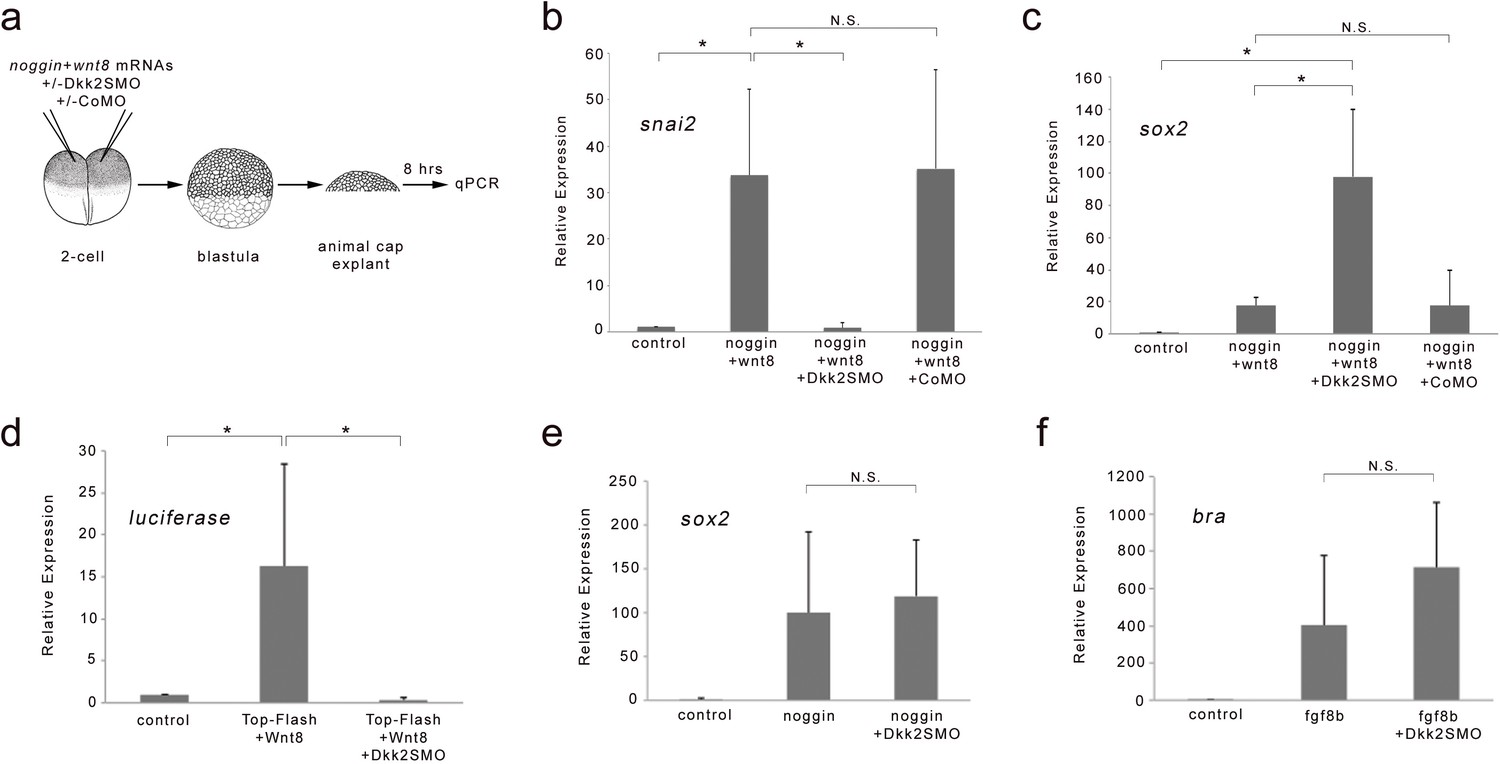
Dkk2 knockdown blocks neural crest induction by Wnt8 in neuralized animal cap explants.
(a) At the 2 cell stage, mRNAs encoding noggin (50 pg) and wnt8 (100 pg) were injected in the animal pole region alone or in combination with Dkk2SMO (30 ng) or CoMO (30 ng). At the blastula stage (NF stage 9), animal cap explants were dissected and cultured for 8 hr and analyzed by qRT-PCR. (b–c) Attenuation of Bmp signaling in combination with Wnt8 induces snai2 expression. Dkk2SMO blocks snai2 induction by Wnt8 to promote neural plate fate (sox2 expression). A CoMO had no effect on the neural crest-inducing activity of Wnt8. (d) wnt8 (100 pg mRNA) expression activates a TOP-FLASH reporter (10 pg DNA) construct in animal cap explants, an activity that is completely blocked by Dkk2SMO coinjection (30 ng). (e) The induction of the neural plate gene sox2 by noggin (50 pg mRNA), and (f) the induction of the mesoderm gene bra by Fgf8b (100 pg mRNA) were unaffected by Dkk2SMO injection (30 ng). Graph represents mean ± s.e.m. of 3 independent experiments. *p<0.03; paired two tailed Student’s t-test. n.s. not significant.
Figure 4
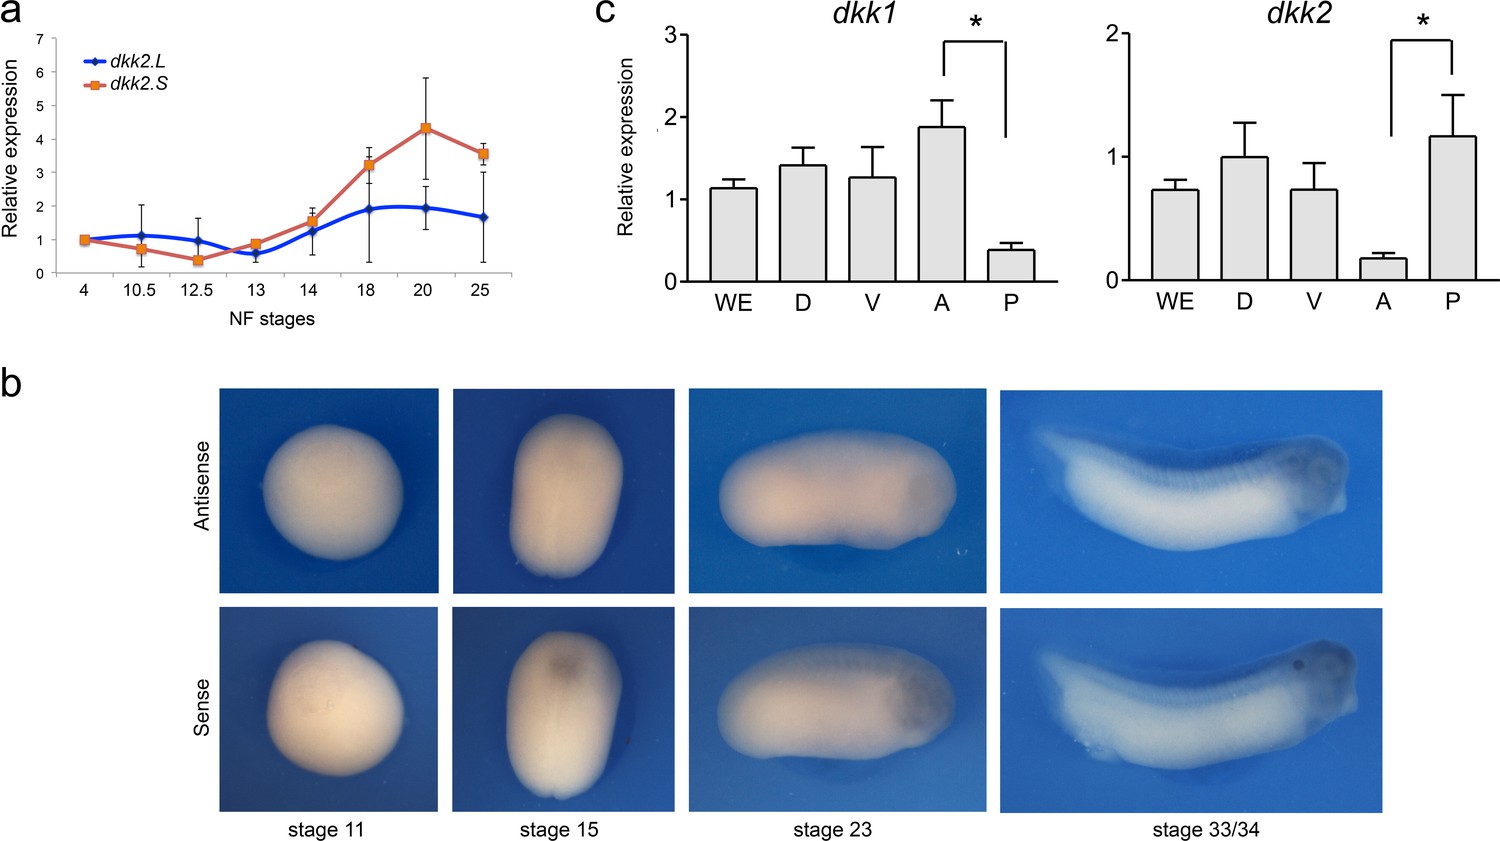
Developmental expression of dkk2.
(a) Temporal expression of dkk2.L and dkk2.S by qRT-PCR. (b) By in situ hybridization, at all stages examined (NF stage 11-33/34) dkk2 does not appear to be spatially restricted. Sense probe is shown as a control. (c) qRT-PCR analysis of dkk1 and dkk2 expression in dissected embryos at stage 15. WE; whole embryo; D, dorsal half; V, ventral half; A, anterior half; P, posterior half. The values were normalized to Ef1a and presented as mean ± s.e.m. * p<0.05, Student’s t-test.
Figure 5
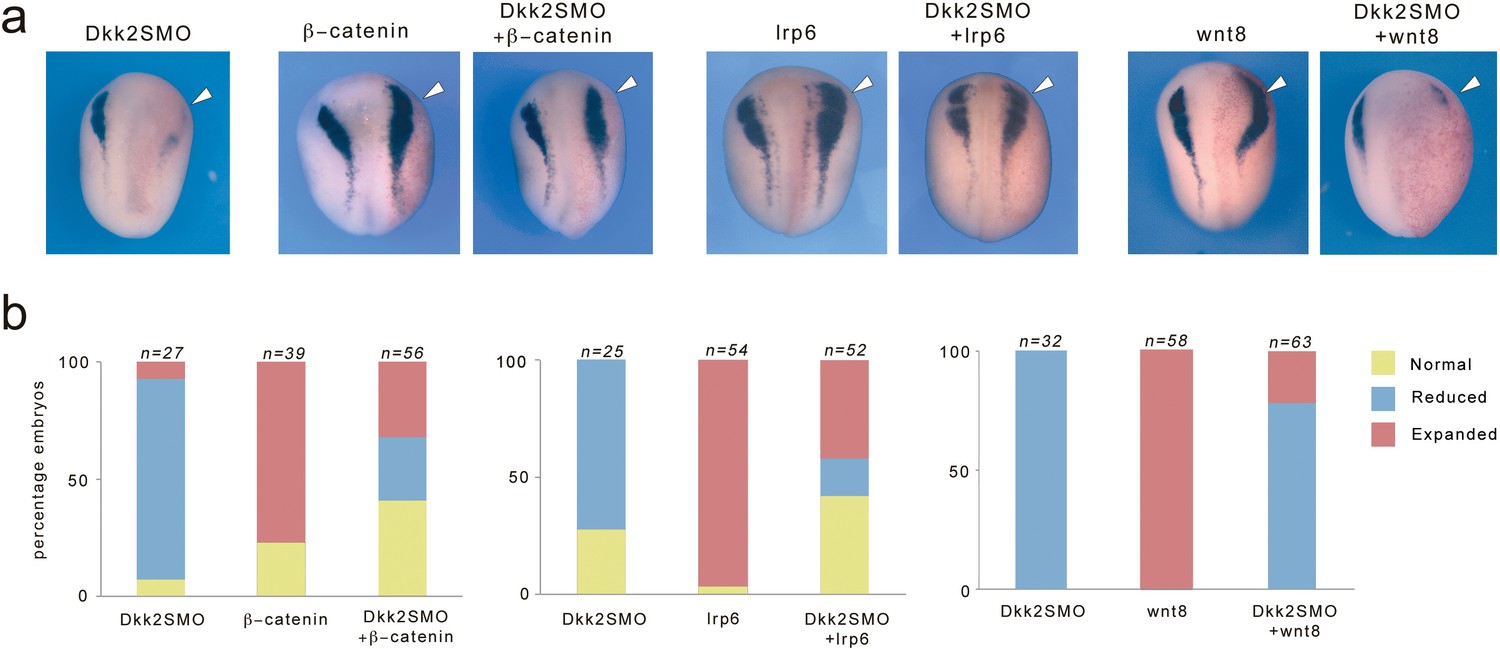
Expression of Lrp6 and β-catenin rescue neural crest formation in Dkk2-depleted embryos.
(a) Unilateral injection of Dkk2SMO (30 ng) reduced snai2 expression. This phenotype was efficiently rescued by injection of plasmid DNA encoding lrp6 (50 pg) or β-catenin (50 pg), and to a lesser extent by plasmid DNA encoding wnt8 (200 pg). Single injection of either plasmid DNA expanded snai2 expression domain. The injected side (arrowheads) is to the right as indicated by the presence of the lineage tracer (Red-Gal). Dorsal views, anterior to top. (b) Quantification of the phenotypes. The number of embryos analyzed (n) is indicated on the top of each bar.
-
Figure 5—source data 1
Quantification of Dkk2 knockdown phenotype upon β-catenin, lrp6 or wnt8 coexpression.
- https://doi.org/10.7554/eLife.34404.011
Figure 6
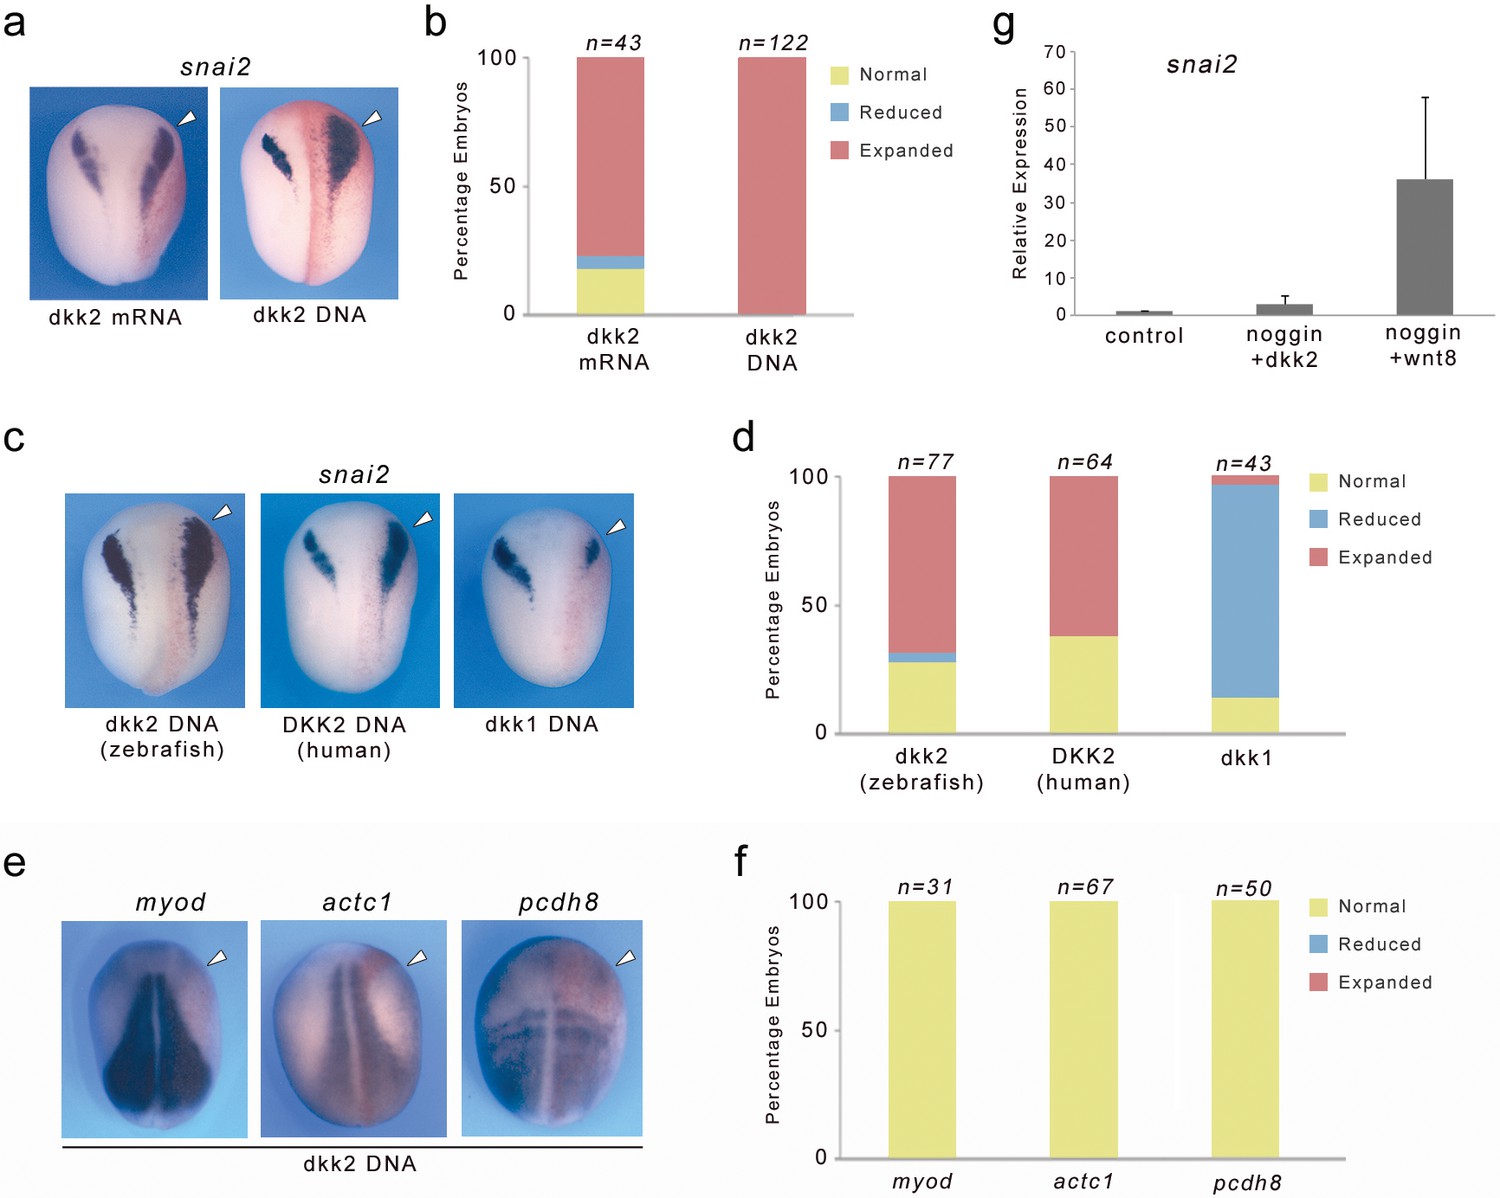
Dkk2 overexpression induces snai2 expression in vivo but cannot substitute for Wnt8 activity in neuralized animal cap explants.
(a) Unilateral injection of dkk2 mRNA (500 pg) or dkk2 plasmid DNA (25 pg) expanded snai2 expression domain laterally. (b) Quantification of the Dkk2 overexpression phenotype. The number of embryos analyzed (n) is indicated on the top of each bar. (c) Zebrafish or Human Dkk2 plasmid DNA injections also expanded snai2 expression, while dkk1 overexpression blocked snai2 expression. (e) The expression of the mesoderm markers myod, actc1 and pcdh8 was unchanged upon Dkk2 overexpression. (d, f) Quantification of the phenotypes. The number of embryos analyzed (n) is indicated on the top of each bar. (a, c, e) The injected side (arrowheads) is to the right as indicated by the presence of the lineage tracer (Red-Gal). Dorsal views, anterior to top. (g) Unlike wnt8, injection of dkk2 mRNA (500 pg) is unable to induce snai2 in animal cap explants neuralized by noggin.
-
Figure 6—source data 1
Quantification of Dkk2 gain-of-function phenotype.
- https://doi.org/10.7554/eLife.34404.013
Figure 7
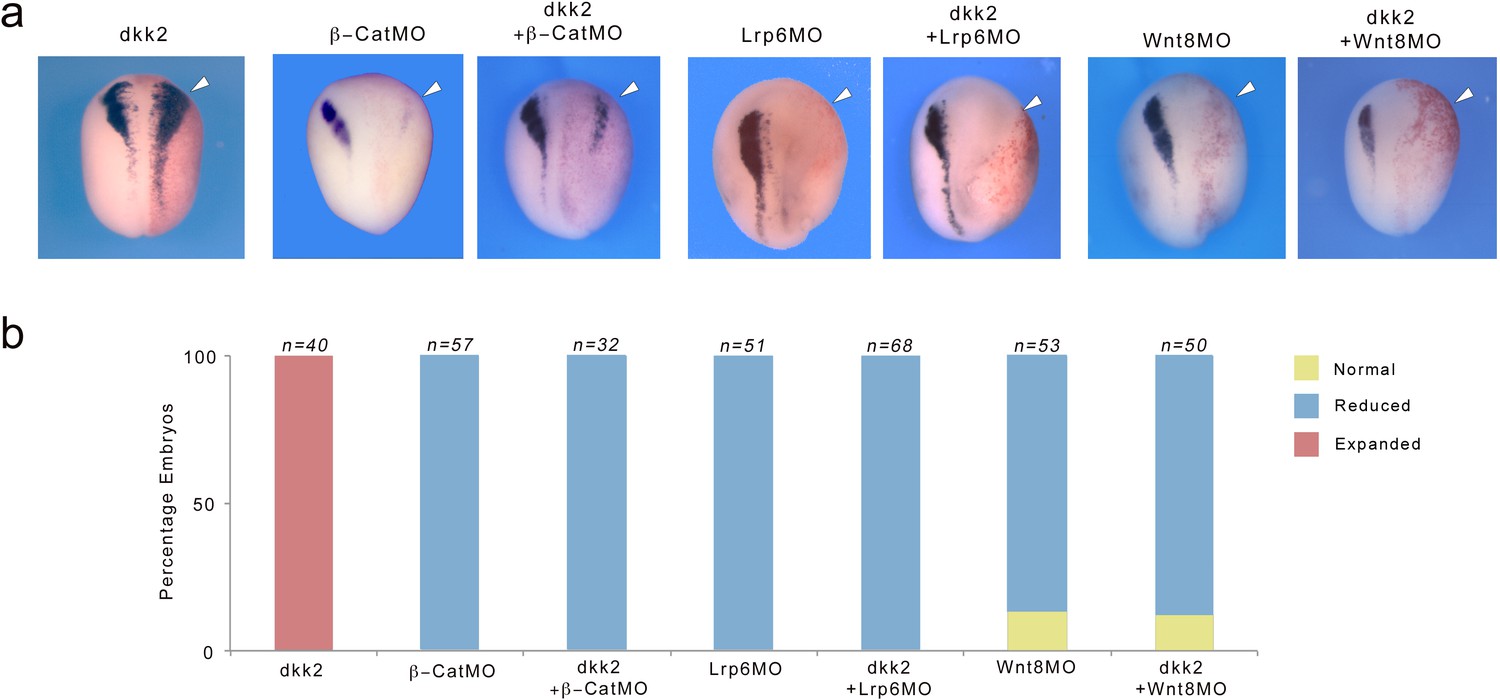
Dkk2 neural crest-inducing activity requires active Wnt/β-catenin signaling.
(a) Unilateral injection of dkk2 plasmid DNA (50 pg) expanded snai2 expression domain laterally (arrowhead). This activity was blocked in the context of β-catenin- (β-catMO; 20 ng), Lrp6- (Lrp6MO; 20 ng) or Wnt8- (Wnt8MO; 40 ng) depleted embryos. The injected side (arrowheads) is to the right as indicated by the presence of the lineage tracer (Red-Gal). Dorsal views, anterior to top. (b) Quantification of the phenotypes. The number of embryos analyzed (n) is indicated on the top of each bar.
-
Figure 7—source data 1
Quantification of β-catenin, Lrp6 and Wnt8 knockdown phenotypes upon Dkk2 coexpression.
- https://doi.org/10.7554/eLife.34404.015
Figure 8
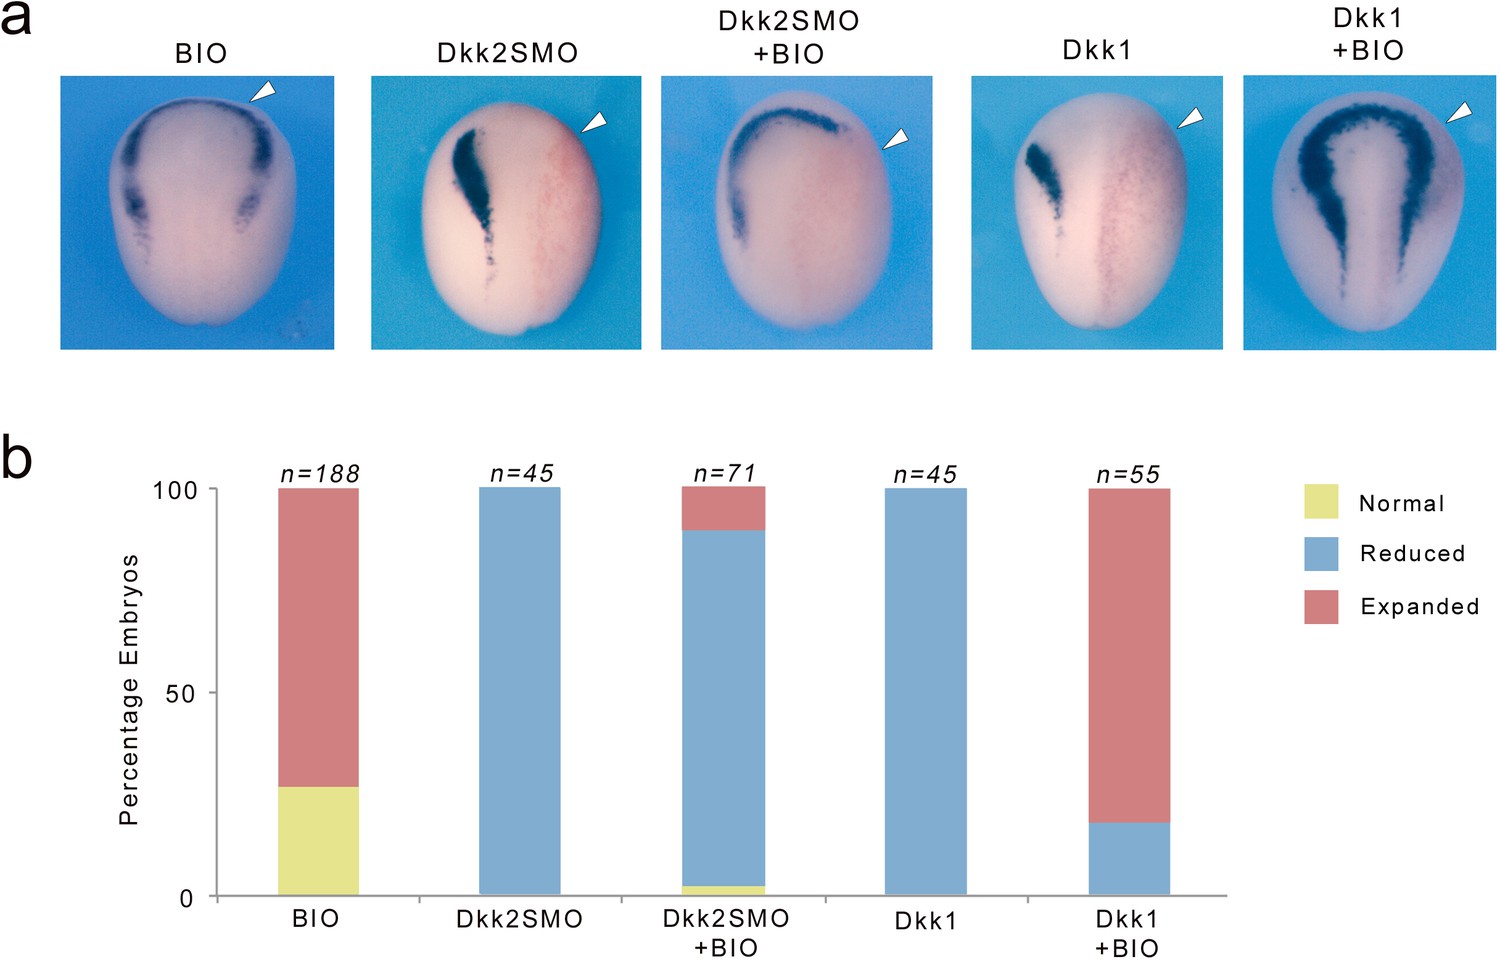
Dkk2 mediates its activity independently of GSK3.
(a) BIO treatment (10 μM) expanded sox10 expression domain anteriorly. Unilateral injection of Dkk2SMO (30 ng) reduced sox10 expression a phenotype that cannot be rescued by BIO treatment. In contrast the Wnt inhibitory activity of Dkk1 (50 pg) on sox10 expression was efficiently rescued by BIO treatment. The injected side (arrowheads) is to the right as indicated by the presence of the lineage tracer (Red-Gal). Dorsal views, anterior to top. (b) Quantification of the phenotypes. The number of embryos analyzed (n) is indicated on the top of each bar.
-
Figure 8—source data 1
Quantification of Dkk2 knockdown and Dkk1 overexpression phenotypes upon BIO treatment.
- https://doi.org/10.7554/eLife.34404.017
Figure 9 with 1 supplement

Model for neural crest induction by Dkk2 and Wnt8.
During neural crest induction, Lrp6 mediates two independent signaling events triggered by Wnt8 and Dkk2 converging on β-catenin to promote neural crest formation (snai2 induction). The Lrp6/Wnt/Fzd complex signals through disheveled (DVL) leading to inhibition of GSK-3β and stabilization of β-catenin. The Lrp6/Dkk2 complex signals through an alternate pathway converging on β-catenin. The components of this alternate pathway are unknown.
Figure 9—figure supplement 1

Dkk2 function is required for dorsal axis duplication by Wnt8.
(a) Ventral injection of wnt8 mRNA (50 pg) in the equatorial region of 4 cell stage embryos resulted in secondary dorsal axis formation at stage 30. Injection of Dkk2SMO (30 ng) significantly reduced dorsal axis duplication by Wnt8. A CoMO (30 ng) did not interfere with Wnt8 dorsal axis duplication activity. Dorsal views, anterior to top. (b) Percentage of axis duplication (complete, include head structures) in different experimental conditions from three independent experiments. The number of embryos analyzed (n) is indicated on the top of each bar.
Author response image 1

Author response image 2

Additional files
-
Transparent reporting form
- https://doi.org/10.7554/eLife.34404.020
Download links
A two-part list of links to download the article, or parts of the article, in various formats.
Downloads (link to download the article as PDF)
Open citations (links to open the citations from this article in various online reference manager services)
Cite this article (links to download the citations from this article in formats compatible with various reference manager tools)
Dkk2 promotes neural crest specification by activating Wnt/β-catenin signaling in a GSK3β independent manner
eLife 7:e34404.
https://doi.org/10.7554/eLife.34404


