Mapping mutational effects along the evolutionary landscape of HIV envelope
- Fred Hutchinson Cancer Research Center, United States
- University of Washington, United States
Figures
Figure 1 with 1 supplement

Phylogenetic tree showing the relationship of BG505 and BF520 to other clade A Envs.
The tree shows the 69 Envs in the alignment in Figure 1—source data 1, which is a subsample of clade A sequences from the group M alignment in the Los Alamos HIV sequence database (http://www.hiv.lanl.gov). Sites not mutagenized in our experiments (the signal peptide and cytoplasmic tail) or that are poorly alignable were masked as indicated in Figure 1—source data 2, leaving 616 alignable sites. The pairwise identity of BG505 and BF520 to other sequences at alignable sites is in Figure 1—figure supplement 1. The tree topology was inferred using RAxML (Stamatakis, 2014) under the GTRCAT model of nucleotide substitution, and branch lengths were optimized under the M0 Goldman-Yang model (Yang et al., 2000) using phydms (Hilton et al., 2017).
-
Figure 1—source data 1
The alignment of clade A env coding sequences is in cladeA_alignment.fasta.
- https://doi.org/10.7554/eLife.34420.004
-
Figure 1—source data 2
The 240 Env sites masked in all phylogenetic analyses because they were not mutagenized in our experiments or are poorly alignable are listed in alignment_mask.csv.
- https://doi.org/10.7554/eLife.34420.005
Figure 1—figure supplement 1
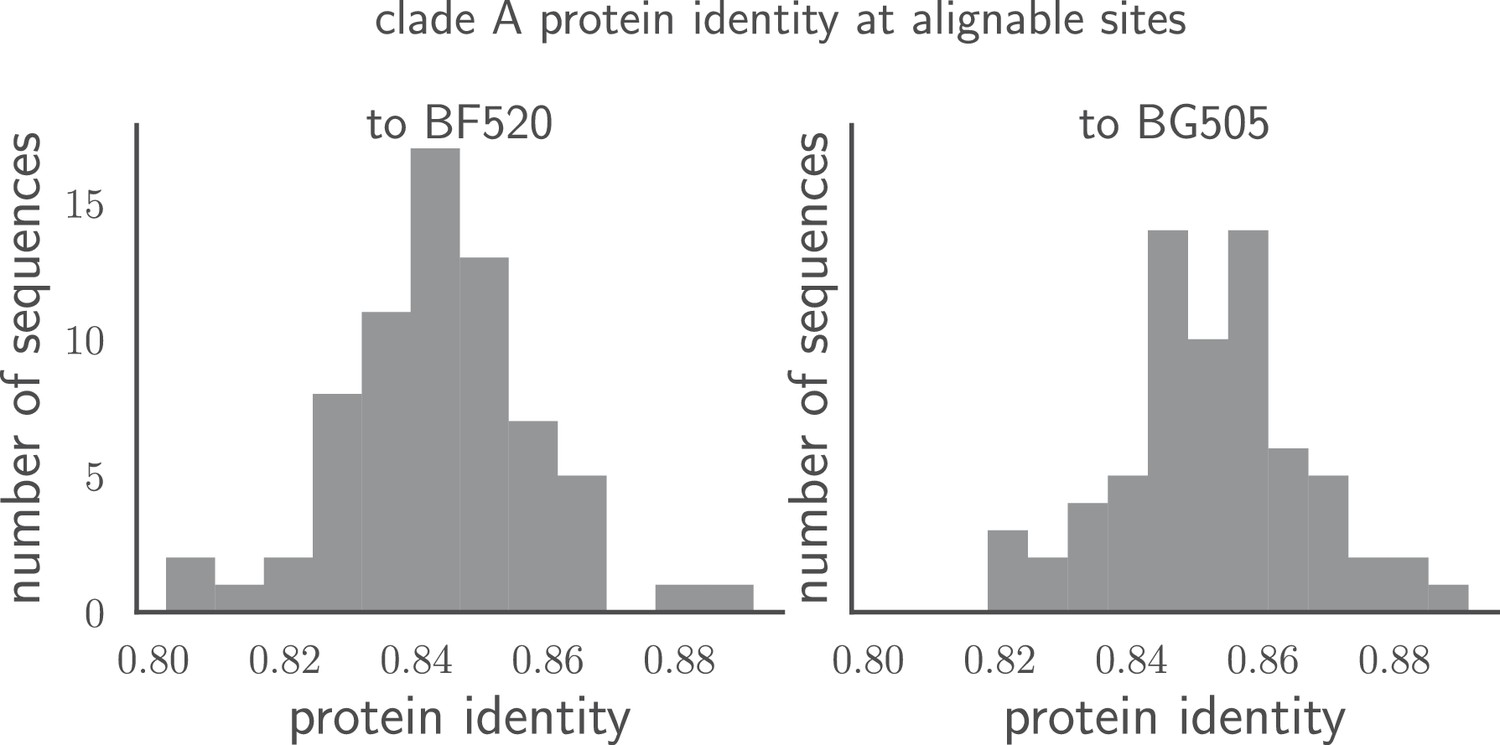
Pairwise identity of all Env sequences to BG505 and BF520.
The histograms show the pairwise amino acid identity of each Env to all other sequences in the clade A alignment in Figure 1—source data 1 after masking the sites delineated in tree-source data 1. There are 616 non-masked sites. The pairwise protein identity between BG505 and BF520 is 86.2% (721 of 836 sites identical) when considering all sites, and 89.1% (549 of 616 sites identical) when considering just the non-masked sites.
Figure 2 with 1 supplement
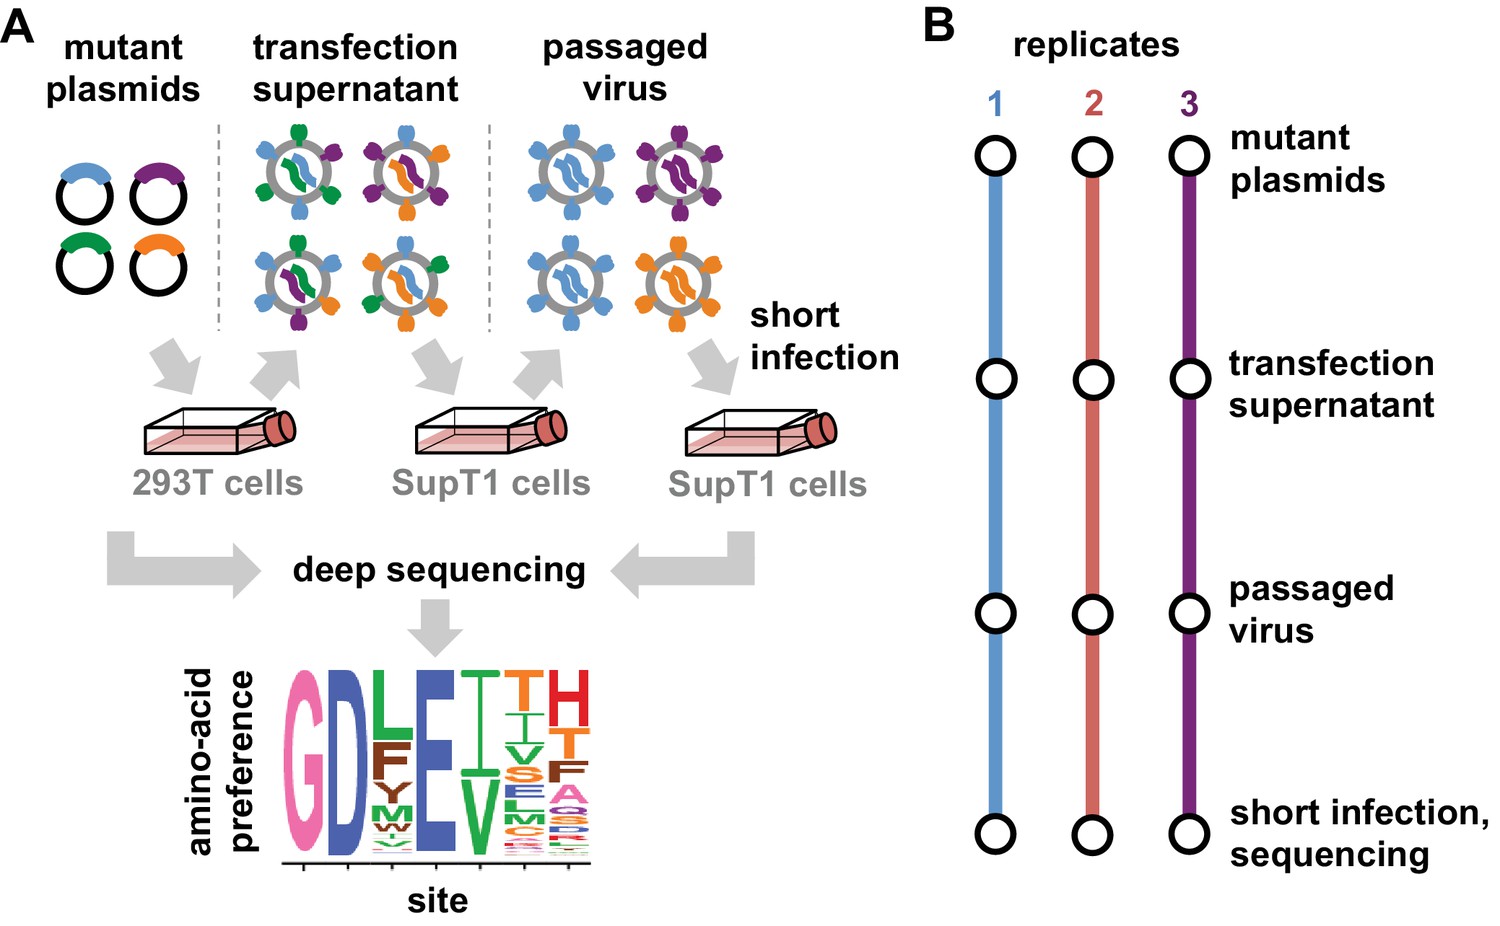
Deep mutational scanning workflow.
(A) We made libraries of proviral HIV plasmids with random codon-level mutations in the env gene. The number of mutations per gene approximately followed a Poisson distribution with a mean between 1 and 1.5 (Figure 2—figure supplement 1). We transfected the plasmids into 293T cells to generate mutant viruses, which lack a genotype-phenotype link since cells are multiply transfected. To establish a genotype-phenotype link and select for Env variants that support HIV growth, we passaged the libraries in SupT1.CCR5 cells for four days at a low multiplicity of infection (MOI) of 0.01. To isolate the env genes from only viruses that encoded a functional Env protein, we infected the passaged libraries into SupT1.CCR5 cells at high MOI and harvested reverse-transcribed non-integrated viral DNA after 12 hr. We then deep sequenced the env genes from these final samples as well as the initial plasmid library, using molecular barcoding to reduce sequencing errors. We also deep sequenced identically handled wildtype controls to estimate error rates. Using these sequencing data, we estimated the preference for each of the 20 amino acids at each site in Env. These data are represented in logo plots, with the height of each letter proportional to that site’s preference for that amino acid. (B) We conducted this experiment in full biological triplicate for both BG505 and BF520, beginning each replicate with independent creation of the plasmid mutant library. These replicates therefore account for all sources of noise and error in the experiments.
Figure 2—figure supplement 1
Sanger sequencing of selected clones from the mutant plasmid libraries.
We Sanger sequenced 44 clones of BG505 Env sampled roughly evenly from each of the three replicate mutant plasmid libraries. (A) There was an average of 1.5 mutant codons per clone, with the number of mutations per clone roughly following a Poisson distribution. (B) The mutant codons had a mix of single-, double-, and triple-nucleotide changes, with an elevated number of single-nucleotide changes than expected. (C) Nucleotide frequencies were fairly uniform in the mutant codons. (D) Mutations were distributed roughly evenly along the mutagenized region of env (30–699 in the sequential numbering scheme used in this plot). (E) For clones with multiple mutations, we computed the pairwise distance in primary sequence between each codon mutation and plotted the cumulative distribution of these distances (red line). We also simulated the expected distribution of pairwise distances if mutations occurred entirely independently (blue line). The observed distribution is close to the expected distribution. Comparable data for the BF520 libraries is provided in (Dingens et al., 2017).
Figure 3 with 1 supplement
The deep mutational scanning selects for functional Envs and yields measurements that are well correlated among replicates.
(A) The average per-codon mutation frequency when sequencing plasmids encoding wildtype Env (DNA), plasmid mutant libraries (mutDNA), mutant viruses after the final infection (mutvirus), and virus generated from wild-type plasmids (virus). Mutations are categorized as nonsynonymous, synonymous, or stop codon. The DNA samples show that sequencing errors are rare, and the virus samples show that viral-replication errors are well below the frequency of mutations in the mutDNA samples. Comparing the mutvirus to mutDNA shows clear purifying selection against stop codons and some nonsynonymous mutations, particularly after subtracting the background error rates given by the virus and DNA samples (Figure 3—source data 2). More extensive plots from the analysis of the deep sequencing data are in Supplementary file 1 and 2. (B) Correlations between replicates in the measured preferences of each site in Env for all 20 amino acids. Blue indicates replicate measurements on BF520, red indicates replicate measurements on BG505, and gray indicates across-Env measurements of BF520 versus BG505. is the Pearson correlation coefficient. The numerical values for the preferences are in Figure 3—source data 2. Figure 3—figure supplement 1 shows the correlations using contour rather than scatter plots.
-
Figure 3—source data 1
Average frequencies of nonsynonymous, synonymous, and stop-codon mutations as plotted in mutfreqs are in avgmutfreqs.csv.
There is only one DNA sample for BF520 which is listed three times with each BF520 replicate. We calculate the error-corrected pre-selection mutation frequency as the mutDNA minus DNA, and the error-corrected post-selection mutation frequency as the mutvirus minus the virus. We use these error-corrected frequencies to calculate the percent of mutations remaining after selection.
- https://doi.org/10.7554/eLife.34420.010
-
Figure 3—source data 2
Preferences for each replicate and averages are in all_prefs_unscaled.zip.
- https://doi.org/10.7554/eLife.34420.011
Figure 3—figure supplement 1
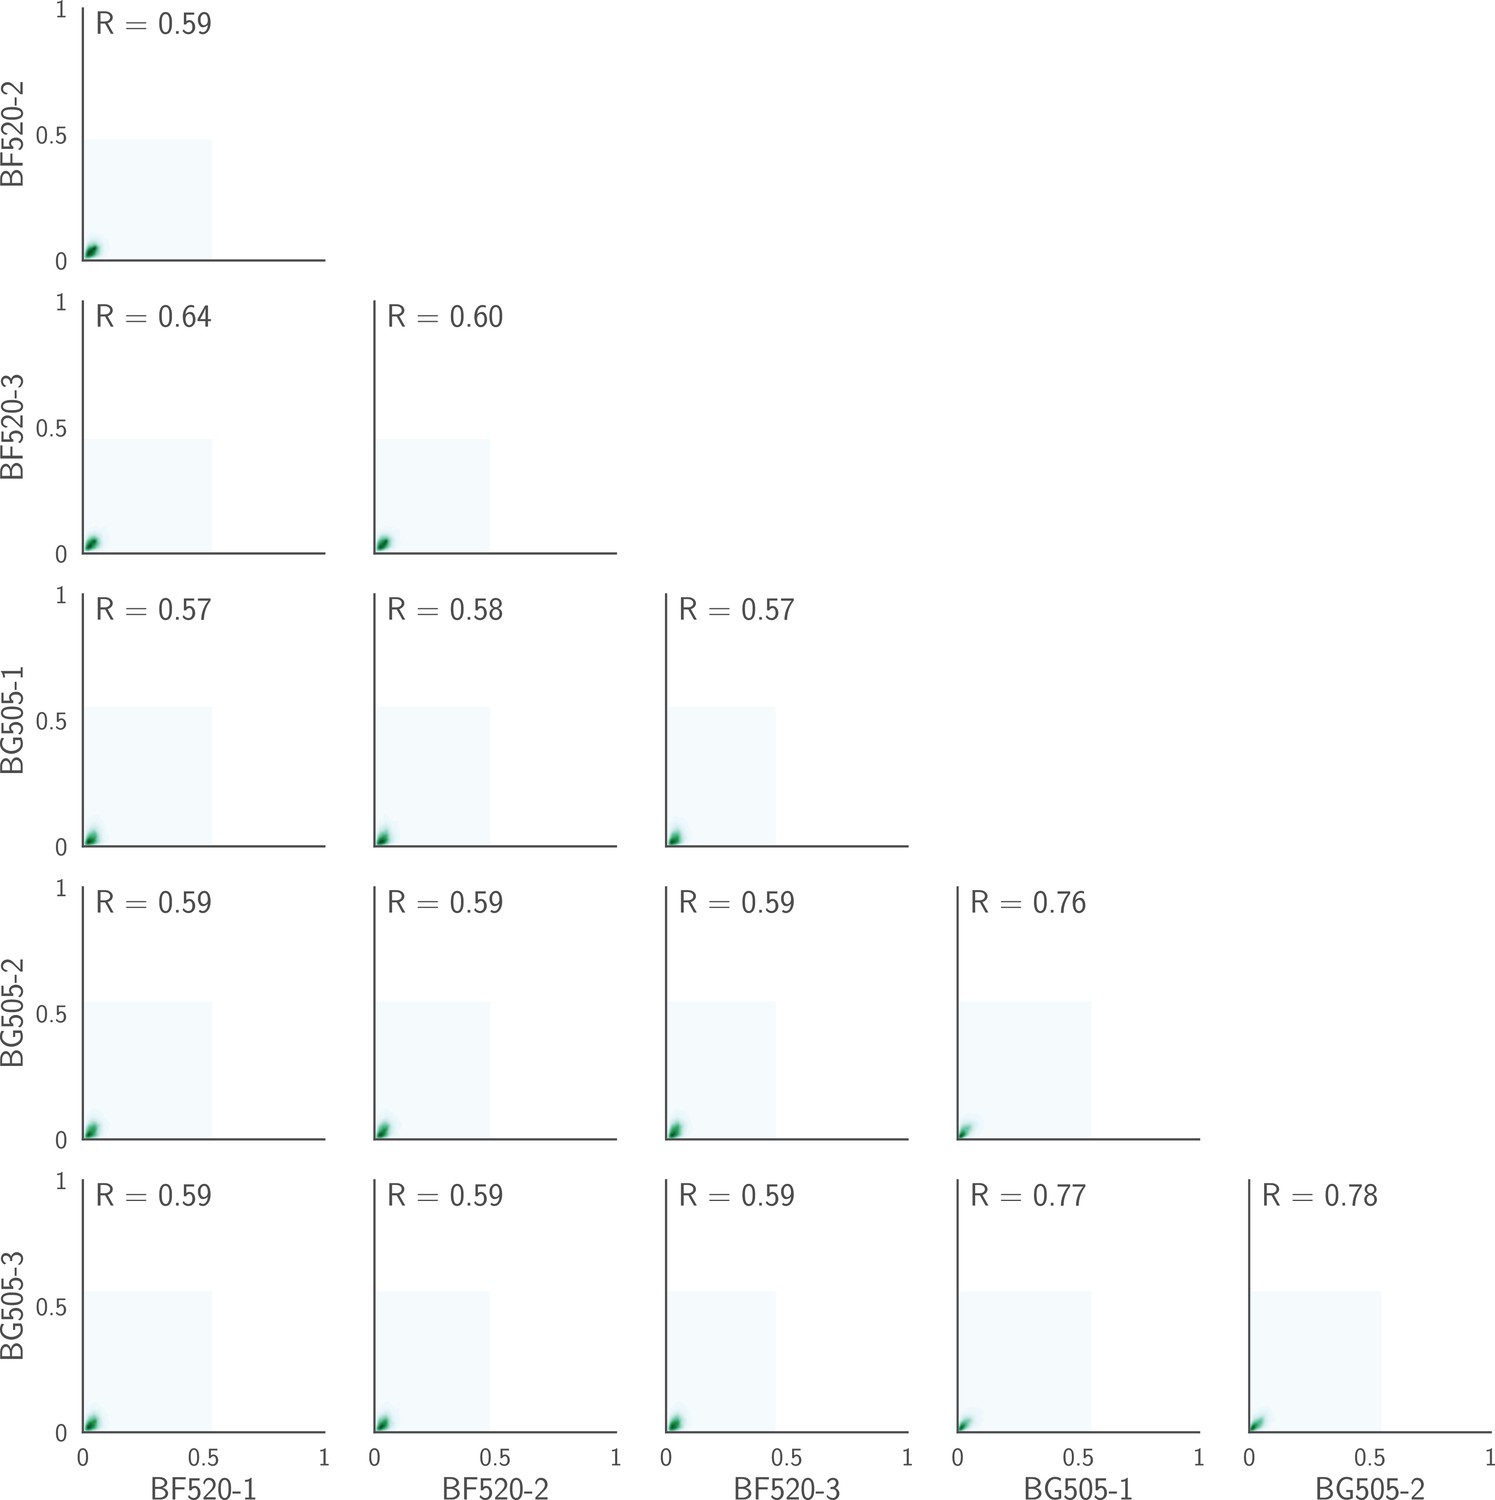
Correlations plotted on a contour rather than a scatter plot.
This figure shows the same data as in Figure 3B except that it shows KDE contour plots rather than points. As is obvious from this representation, the vast majority of the points fall near the origin (very low preference in both replicates), and most of the correlation signal is therefore due to the relatively modest number of amino acids that have high preference at any given site. This is expected, since most amino acid mutations at most sites will be strongly deleterious, and so have low preference.
Figure 4

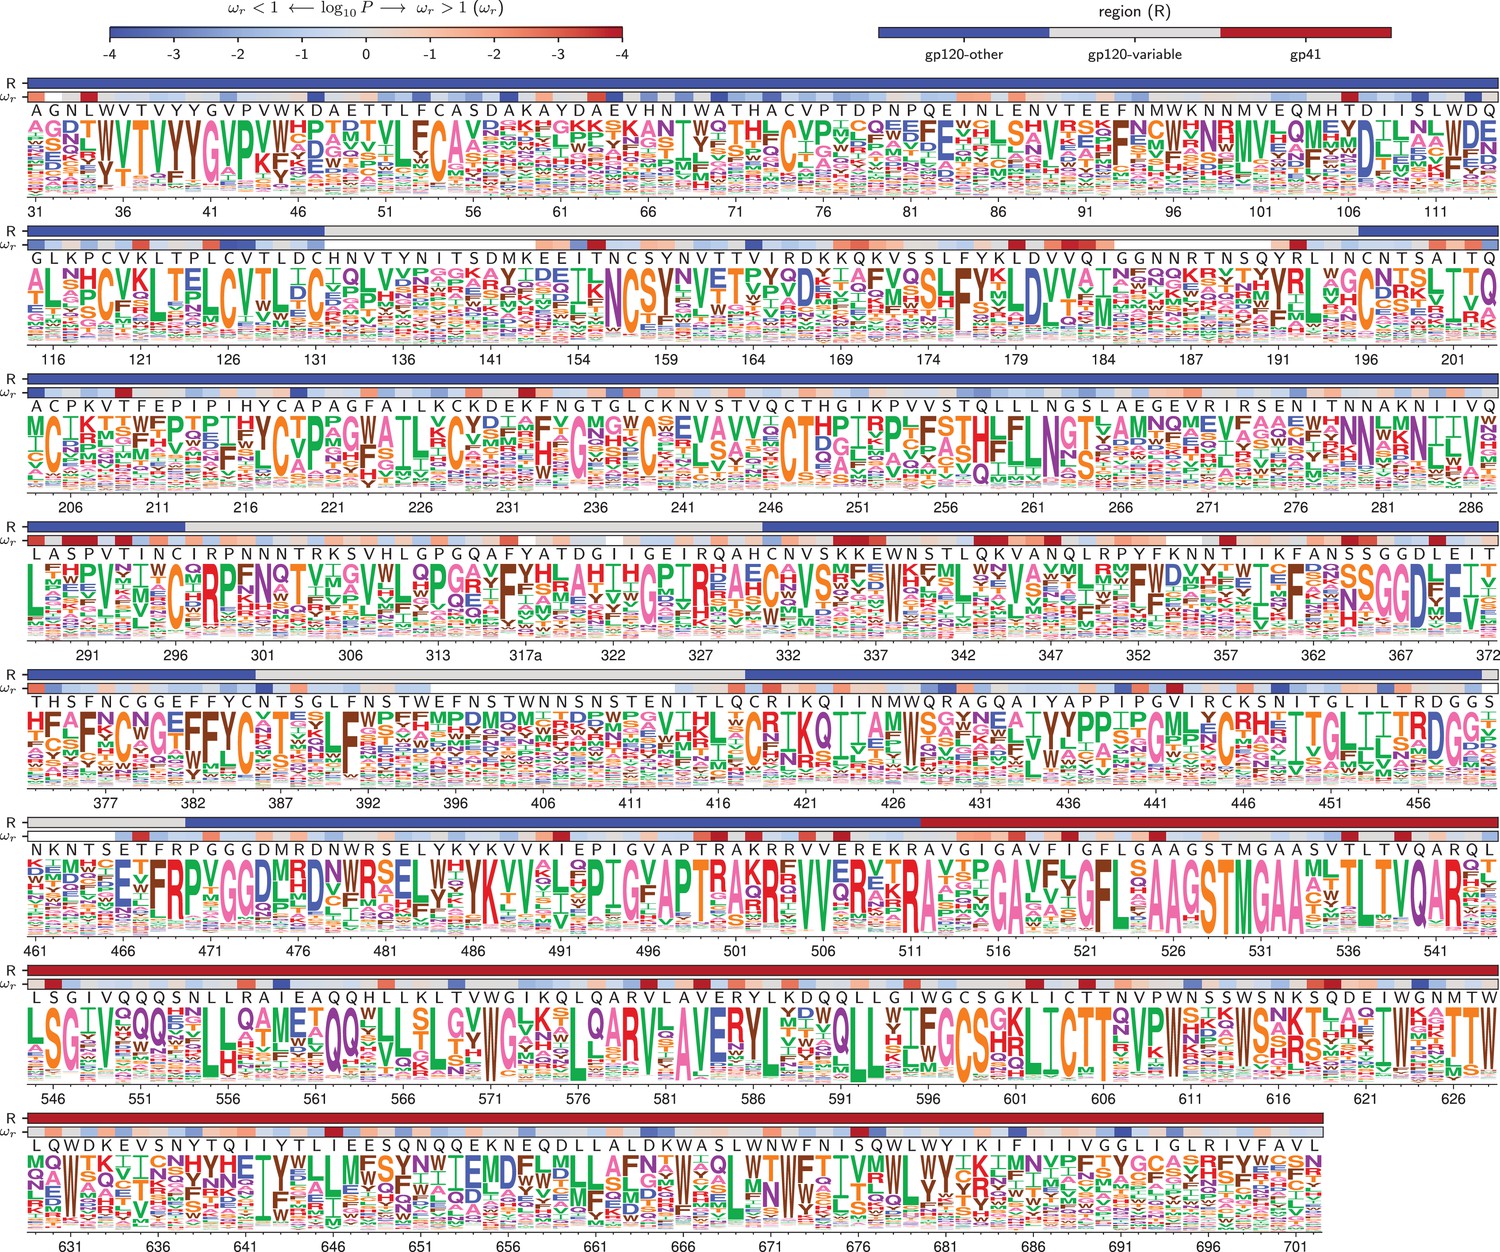
Amino acid preferences for the BG505 Env.
At each site, the height of the letter is proportional for that site’s preference for that amino acid. The top color bar indicates the region of Env (gp120 variable loop, gp120 not variable loop, or gp41). The lower color bar indicates the evidence that the site evolves faster () or slower () than expected given the experiments (Bloom, 2017). We report the p-value for rather than the value of itself since point estimates of are unreliable for individual sites due to low numbers of observations, making the p-value a better indicator of the strength of the statistical evidence for faster or slower than expected evolution (Kosakovsky Pond and Frost, 2005; Murrell et al., 2012). The letters above the logos indicate the wildtype amino acid in BG505. Sites are numbered using the HXB2 scheme (Korber et al., 1998). This logo plot shows the site-specific amino acid preferences for BG505 after averaging the replicates and re-scaling by the stringency parameter in Table 1. The figure was generated using dms_tools2 (Bloom, 2015), which in turn utilizes weblogo (Crooks et al., 2004). The numerical values of the preferences are in Figure 4—source data 1, the mapping from sequential to HXB2 numbering is in Figure 4—source data 2, and the values are in Figure 4—source data 3.
-
Figure 4—source data 1
The numerical values of the amino acid preferences plotted in this figure are in rescaled_BG505_prefs.csv.
- https://doi.org/10.7554/eLife.34420.016
-
Figure 4—source data 2
The sequence of BG505 Env and mapping from sequential (original column) to HXB2 numbering (new column) is in BG505_to_HXB2.csv.
- https://doi.org/10.7554/eLife.34420.017
-
Figure 4—source data 3
The values and associated p-values for BG505 in HXB2 numbering are in BG505_omegabysite.tsv.
- https://doi.org/10.7554/eLife.34420.018
Figure 5
Amino acid preferences for the BF520 Env.
This figure is the same as Figure 4 except that it shows the data for BF520 instead of BG505. The numerical values of the preferences are in Figure 5—source data 1, the mapping from sequential to HXB2 numbering is in Figure 5—source data 2, and the values are in Figure 5—source data 3.
-
Figure 5—source data 1
The numerical values of the amino acid preferences plotted in this figure are in rescaled_BF520_prefs.csv.
- https://doi.org/10.7554/eLife.34420.020
-
Figure 5—source data 2
The sequence of BF520 Env and mapping from sequential (original column) to HXB2 numbering (new column) is in BF520_to_HXB2.csv.
- https://doi.org/10.7554/eLife.34420.021
-
Figure 5—source data 3
The values and associated p-values for BF520 in HXB2 numbering are in BF520_omegabysite.tsv.
- https://doi.org/10.7554/eLife.34420.022
Figure 6
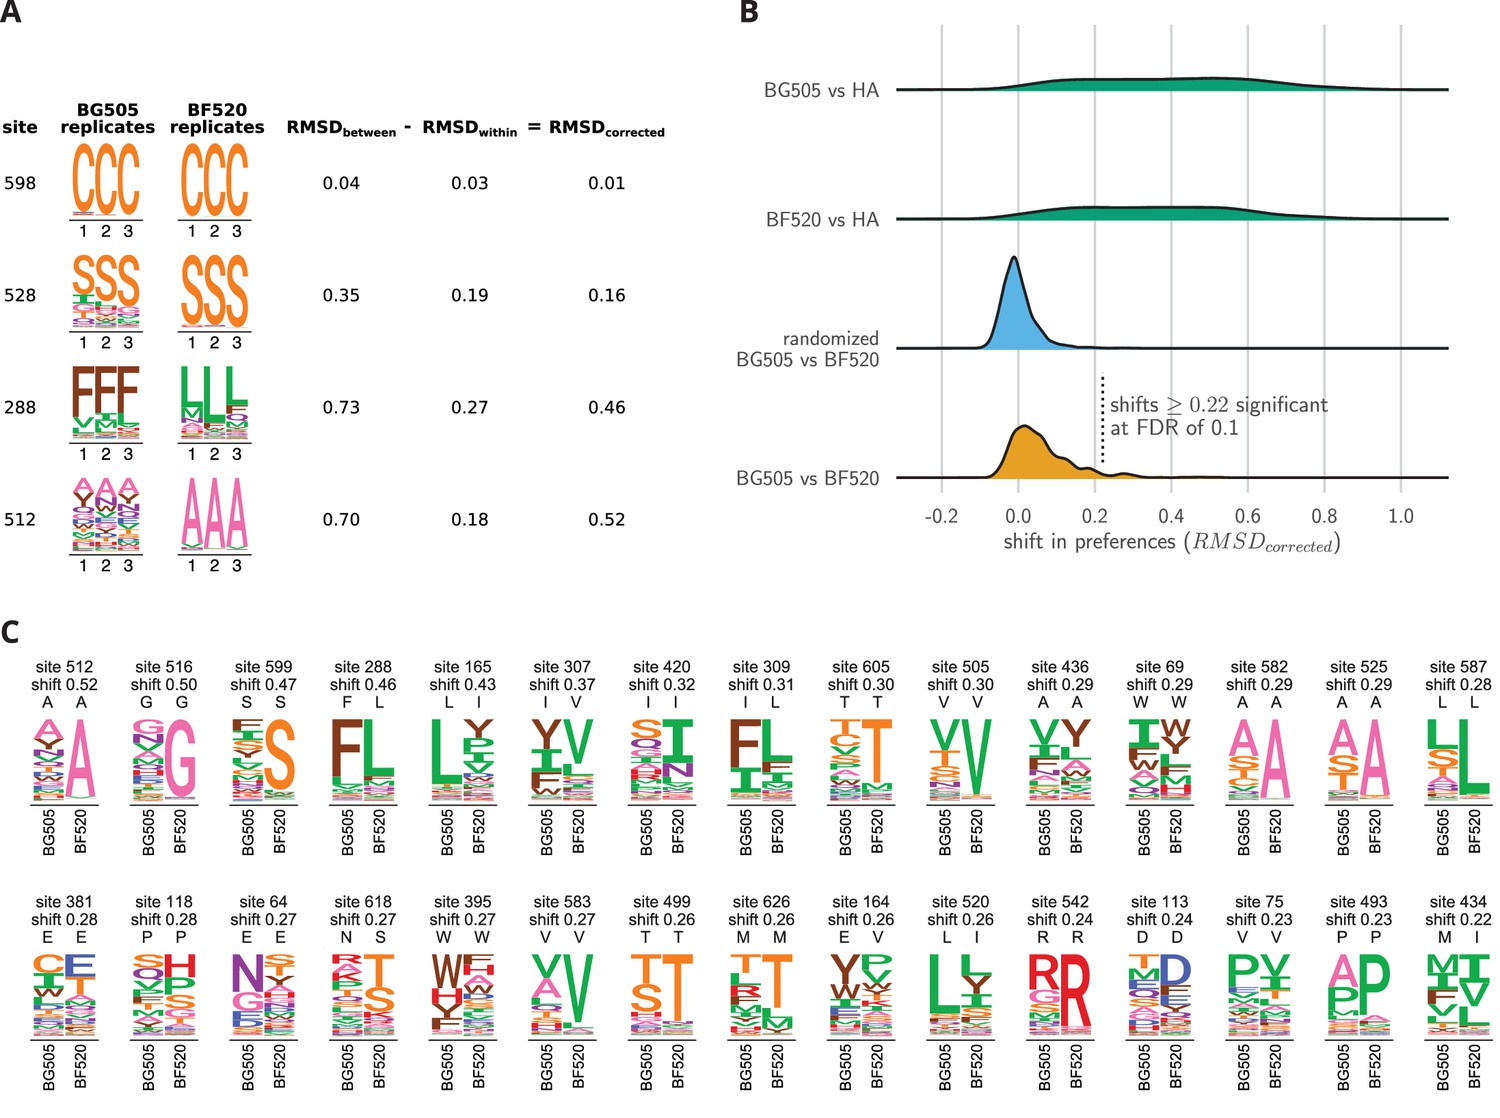
Env sites with shifted amino acid preferences between BG505 and BF520.
Note that the preferences have been re-scaled using the stringency parameters in Table 1 to enable direct comparison across Envs. (A) Calculation of the corrected distance between the amino acid preferences of BG505 and BF520 at four example sites. We have triplicate measurements for each Env. We calculate the distance between each pair of replicate measurements, and group these into comparisons between the two Envs and within replicates for the same Env. We compute the root-mean-square distance (RMSD) for both sets of comparisons, which we denote as RMSD and RMSD. The latter quantity is a measure of experimental noise. The noise-corrected distance between Envs at a site, RMSD, is simply the distance between the two Envs minus this noise. (B) The bottom distribution (orange) shows the corrected distances between BG505 and BF520 at all alignable sites (see Figure 6— source data 1 for numerical values). The next distribution (blue) is a null generated by computing the corrected distances on all randomizations of the replicates among Envs. The top two distributions (green) compare Env to the non-homologous influenza hemagglutinin (HA) protein (Doud and Bloom, 2016) simply putting sites into correspondence based on sequence number. We compute the p-value that a site has shifted between BG505 and BF520 as the fraction of the null distribution that exceeds that shift, and identify significant shifts at a false discovery rate (FDR) of 0.1 using the method of (Benjamini and Hochberg, 1995). Using this approach, 30 of the 659 sites have significant shifts (corrected distance 0.22). (C) All sites that have significantly shifted their amino acid preferences at an FDR of 0.01. For each site, the logo stacks show the across-replicate average preferences for BG505 and BF520. The wild-type amino acid for that Env is indicated using the small black letters above each logo plot; note how the wild-type amino acid is frequently but not always the most preferred one. The sites are sorted by the magnitude of the shift.
-
Figure 6—source data 1
The corrected distances between BG505 and BF520 at each site are in BG505_to_BF520_prefs_dist.csv.
- https://doi.org/10.7554/eLife.34420.024
Figure 7 with 2 supplements
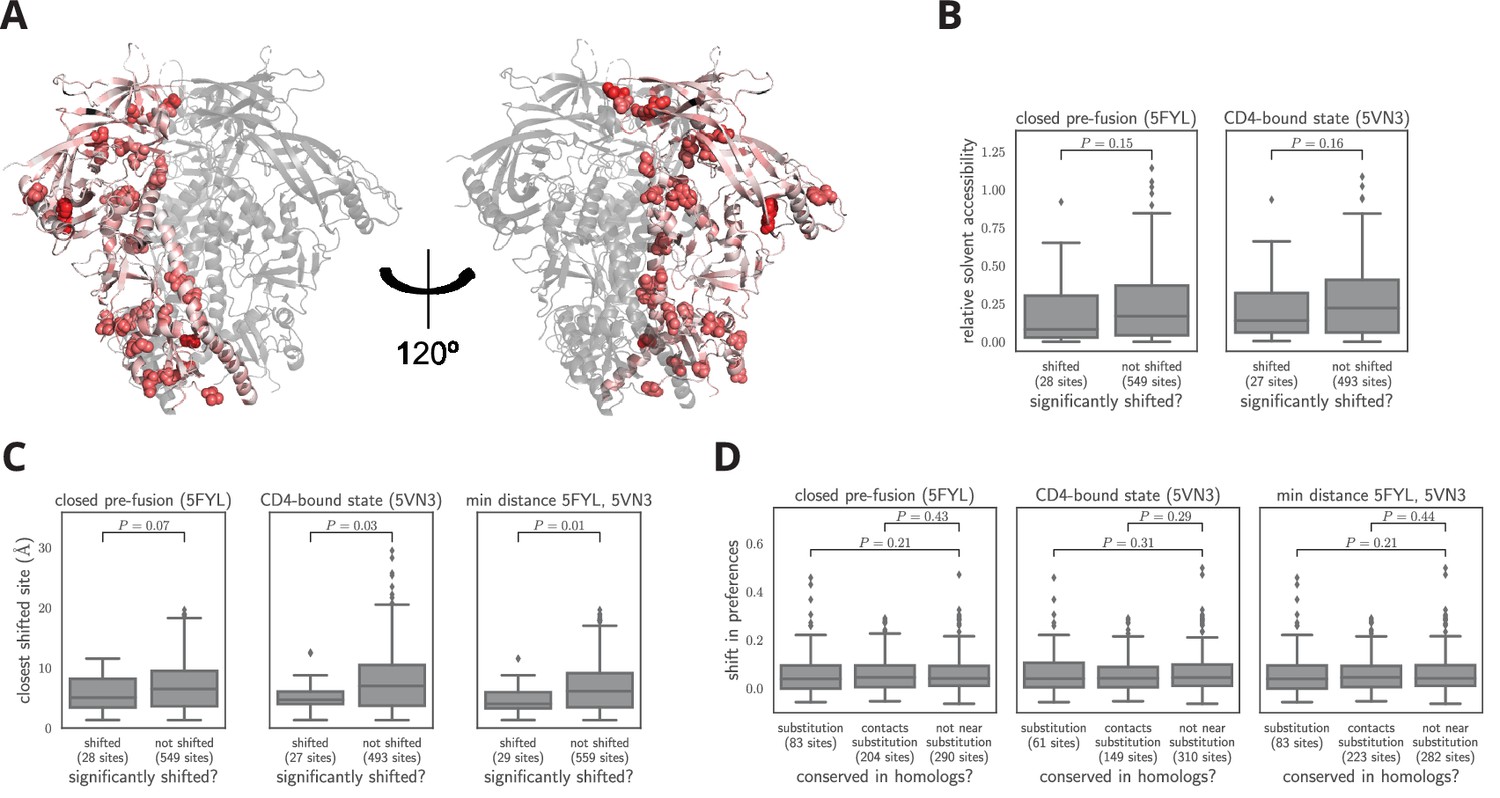
Characteristics of significantly shifted sites.
(A) One monomer of the closed pre-fusion Env trimer (Stewart-Jones et al., 2016) is colored from white to red according to the magnitude of the mutational shift at each site (red indicates large shift). Sites that are significantly shifted according to Figure 6B are in spheres, and all other sites are in cartoon representation. (B) There is no significant difference in the relative solvent accessibility of sites that have and have not undergone significant shifts. This observation holds for both the closed trimer conformation in (A) and the CD4-bound trimer conformation (Ozorowski et al., 2017). The absolute solvent accessibility of each site was calculated using DSSP (Kabsch and Sander, 1983) and normalized to a relative solvent accessibility using the absolute accessibilities from Tien et al. (2013). (C) Sites of significant shifts are clustered in the structures of both the closed and open Env trimers. The left two plots show the distance of each significantly shifted and not-shifted site to the closest other shifted site in the indicated structure. The right-most plot shows the minimum distance across both conformations. The trend for shifts to cluster becomes stronger when considering the minimum distance, suggesting multiple conformations contribute to this trend. (D) Large mutational shifts are not strongly enriched at sites that have substituted between BG505 and BF520, or at sites that contact sites that have substituted. The plots show the magnitudes of the shifts among structurally resolved sites that have substituted between BG505 and BF520, the non-substituted sites that physically contact a substitution in the indicated structure(s) (any non-hydrogen atom within 3.5 angstroms), and all other sites. Figure 7— source data 1 shows that there is a borderline-significant tendency of significantly shifted sites to have substituted. All plots only show sites that are structurally resolved in the indicated structure(s). Structural distances and solvent accessibilities were calculated using all monomers in the trimer. P-values were calculated using the Mann-Whitney test. Figure 7—figure supplement 1 and Figure 7—figure supplement 2 zoom in on some relevant clusters of sites.
-
Figure 7—source data 1
The sites of significant shifts in Figure 6B are somewhat more likely to have substituted between BG505 and BF520.
This association is borderline statistically significant, with p = 0.055 using a Fisher’s exact test on the contingency table in shifts_vs_subs_table.csv.
- https://doi.org/10.7554/eLife.34420.028
Figure 7—figure supplement 1
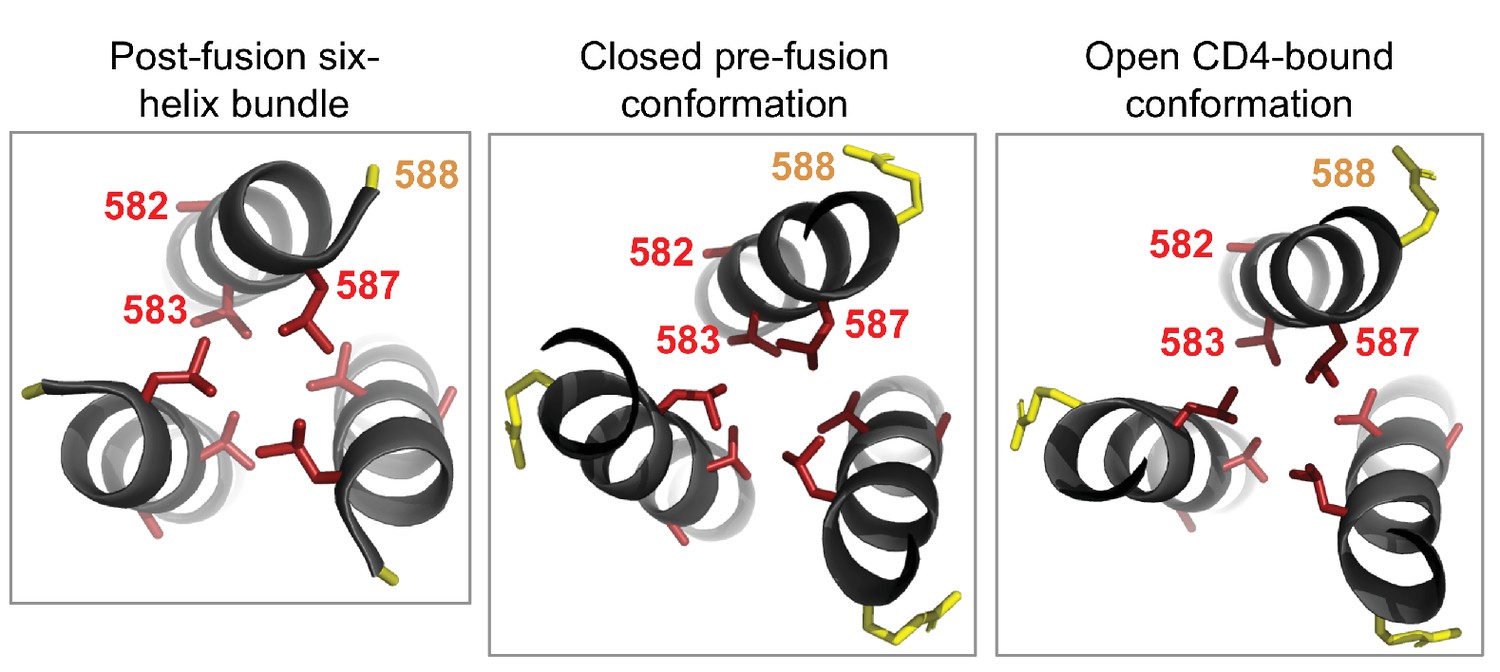
Cluster of shifted sites in the post-fusion six-helix bundle of Env.
The left-most panel shows the six-helix bundle of Env (Weissenhorn et al., 1997), focusing on the central three helices, each of which is derived from a different Env monomer and which pack together to form the bundle’s core. The other three helices that make up this bundle are located in another part of the structure. There are 80 residues per monomer that are resolved in this structure, including four significantly shifted sites and five substituted sites. Of these, three of the shifted sites (582, 583, and 587) and one substituted site (588) form a cluster at one end of the bundle. We show the side chains for each of these sites colored according to whether the site has shifted (red) or substituted (yellow). We wondered whether this cluster was unique to the six-helix bundle, but found that it is also present in roughly the same structural arrangement in both the closed pre-fusion conformation (center panel) and the open CD4-bound conformation (right panel; note that some of the surrounding residues in both the closed and open structures have been hidden for the sake of clarity). As shown in Figure 6C, each of the shifted sites are more tolerant of mutations in BG505 than in BF520. The two shifted sites that point inward towards the bundle’s core (583 and 587) may be important for packing. Based on these structures, it is difficult to discern if or how the substituted site may impact the preferences at the shifted sites nearby.
Figure 7—figure supplement 2
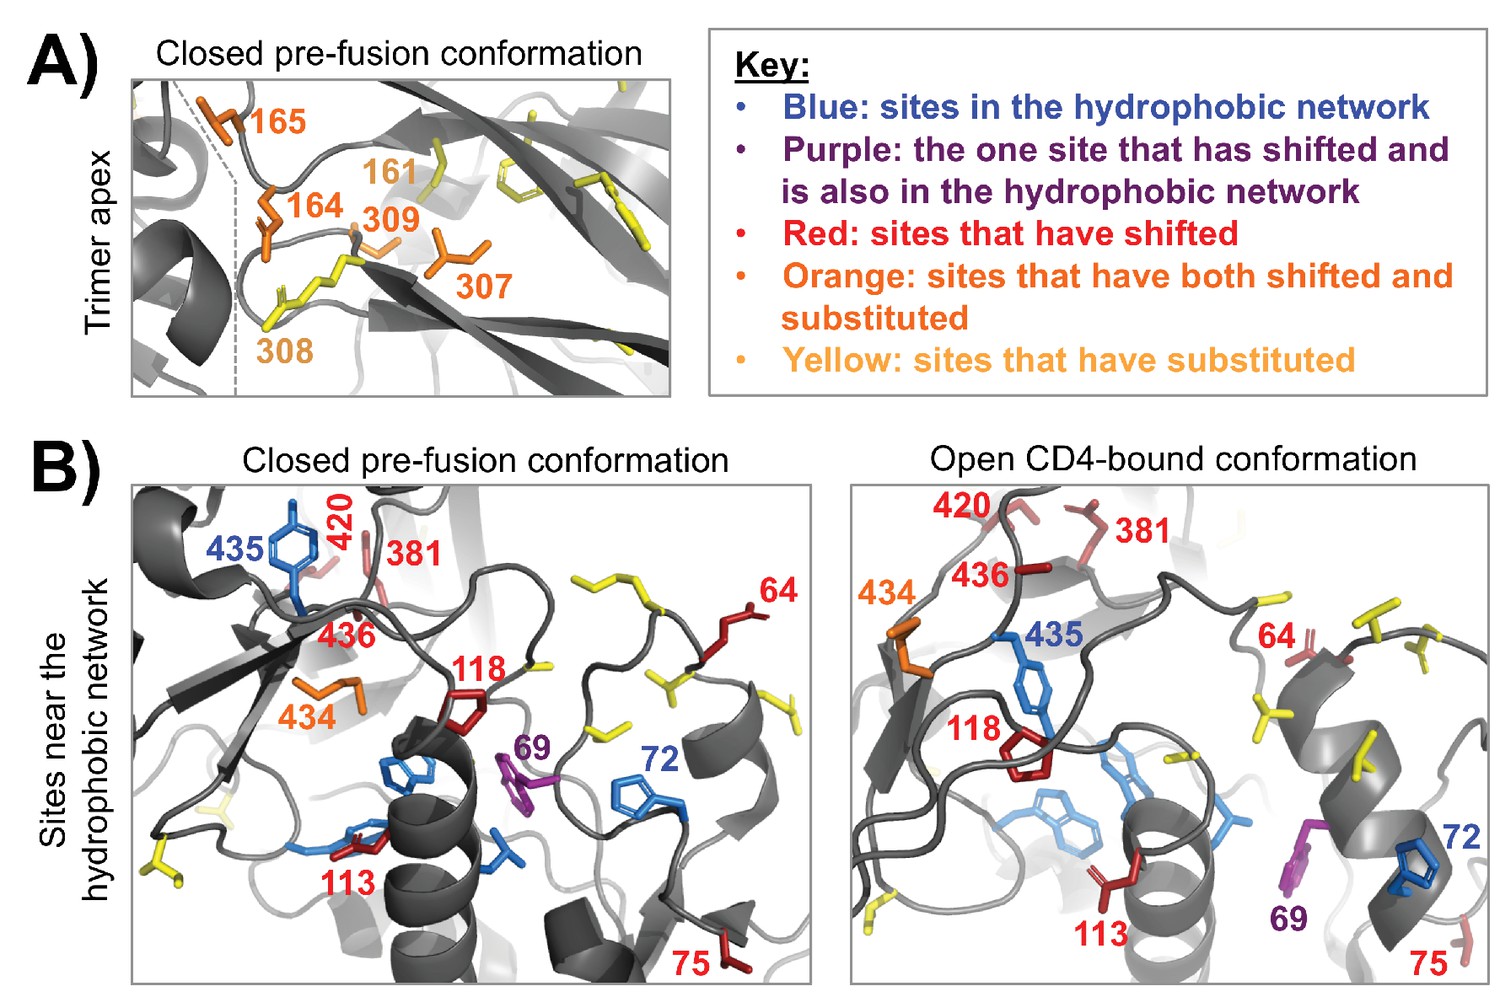
Clusters of shifted sites in highly dynamic regions of Env.
A fine-grained view of two clusters of shifted sites, both of which are in conformationally dynamic regions of Env. In each structure, we only show side chains for shifted sites or other sites of interest, which include substituted sites and sites that are proposed to take part in a hydrophobic network that helps control Env’s dynamics (Ozorowski et al., 2017). These side chains are colored according to the key in the upper right. (A) A cluster of four shifted sites at the apex of the closed pre-fusion conformation of Env (Stewart-Jones et al., 2016), a region that is not resolved in the open CD4-bound conformation. These sites are in Env’s first/second variable loop (164 and 165) and its third variable loop (307 and 309), which pack against one another and against an adjacent Env protomer (the inter-protomer boundary is indicated by a dashed line). Each of the shifted sites has substituted. And these sites are in the immediate vicinity of other non-shifted, but substituted sites. Thus, it seems likely that these shifts at least partially arise from short-range epistatic interactions within this cluster. However, longer range epistatic interactions with more distant sites also seem plausible given the highly dynamic nature of this region. (B) A cluster of shifted sites that are adjacent to a network of hydrophobic residues (blue/purple) that help mediate the conformational change between the closed pre-fusion state to the open CD4-bound state (Ozorowski et al., 2017). One of the shifted sites (purple) is in this network. These sites are shown in context of both structural states, the latter of which is from Ozorowski et al., 2017). Nearly one third of the shifted residues cluster within this structural region (9/30). In contrast to panel (A), only a few of the shifted sites are adjacent to substitutions or have substituted themselves. This trend is found in both the closed and open conformations, suggesting that the shifts may be primarily due to long-range epistatic interactions.
Figure 8
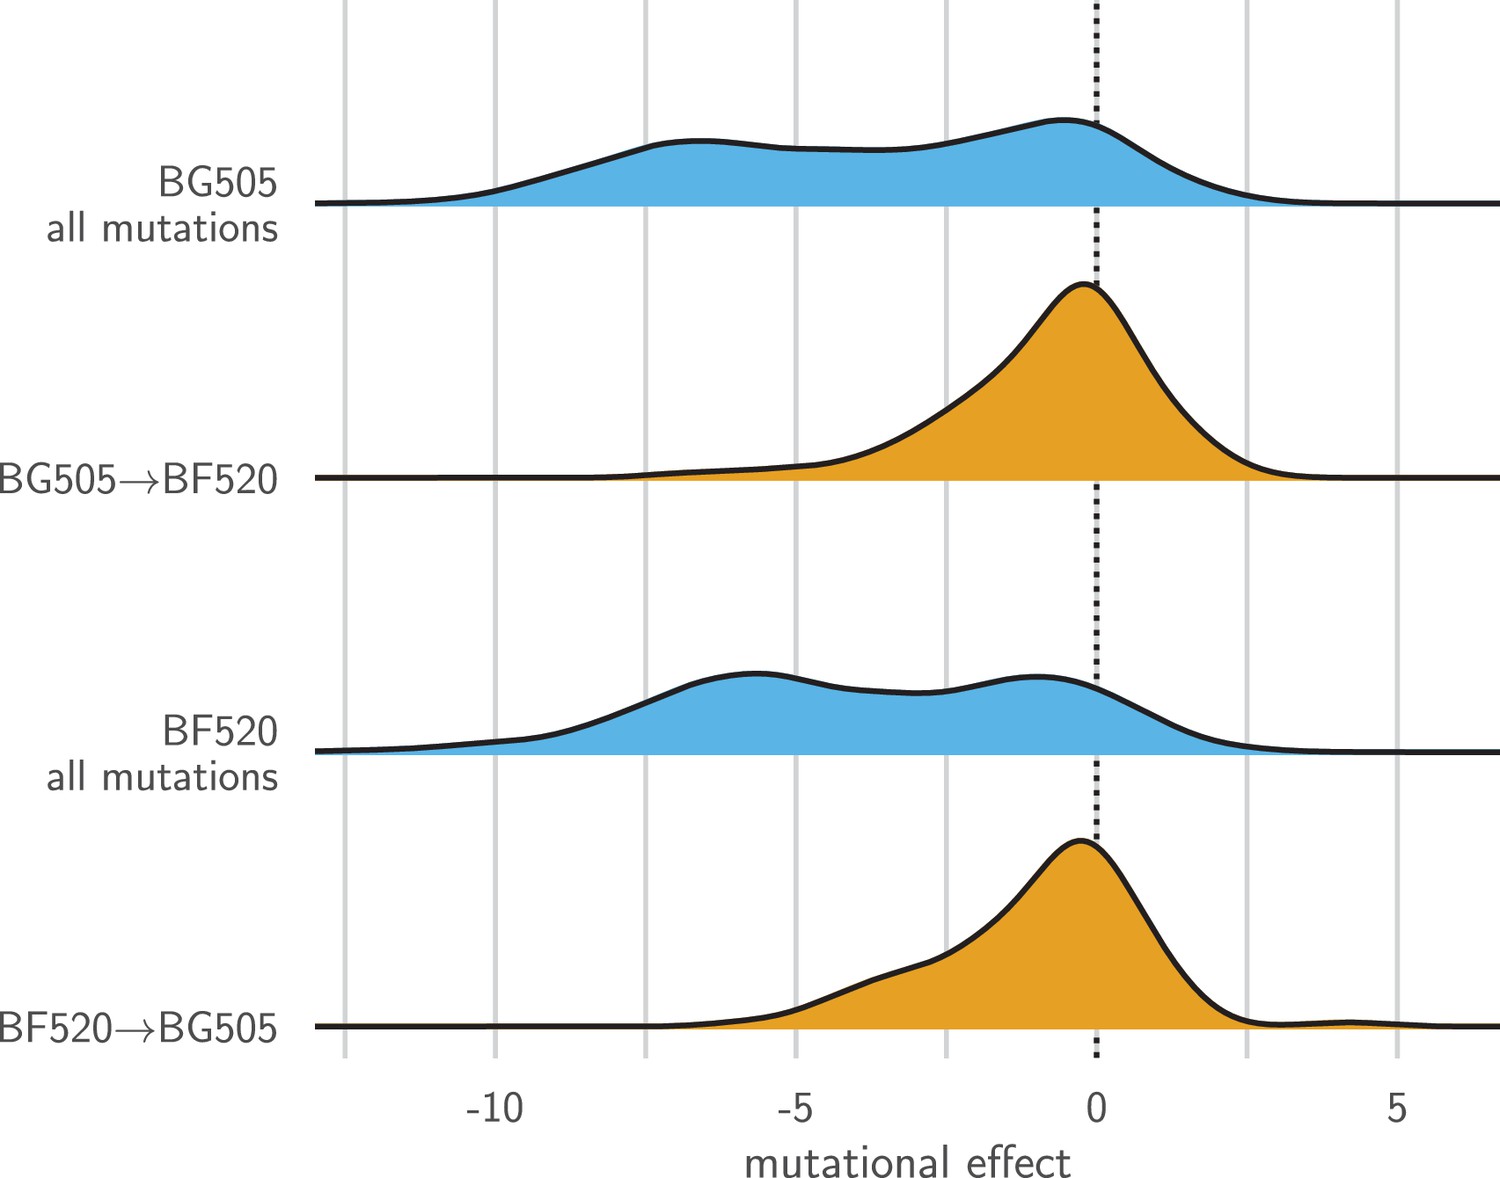
Entrenchment of substitutions during Env evolution.
There are 12,521 possible amino acid mutations at the 659 mutagenized sites alignable between BG505 and BF520. The blue densities show the effects of all these mutations to each Env. The orange densities show the effects of just the 92 mutations that convert BG505 to BF520 or vice versa. In the absence of entrenchment, mutating a site in BG505 to its identity in BF520 should have the opposite effect of mutating the site in BF520 to its identity in BG505. In this case, we would expect the BF520BG505 distribution to be the mirror image of the BG505BF520 distribution—and both distributions should be centered around zero if the two Envs are equivalently functional. Instead, mutating a site in either Env to its identity in the other Env tends to be deleterious, indicating that substitutions are often entrenched in the Env in which they have fixed. The effect of a mutation is quantified as the log of the ratio of the site’s preference for the mutant amino acid to the preference for the wild-type amino acid.
Figure 9 with 3 supplements
Sites in Env that evolve faster or slower in nature than expected given the functional constraints measured in the lab.
We calculated the statistical evidence that each site evolves faster () or slower () than expected given the experimentally measured amino acid preferences using the method of Bloom, 2017). (A) One monomer of the Env trimer (Stewart-Jones et al., 2016) is colored from blue to white to red based on the strength of evidence that sites evolve slower than expected (blue), as expected (white) or faster than expected (red) given the BG505 experiments. Sites for which we lack estimates are colored black. Sites where the rate of evolution is significantly different than expected at a false discovery rate of 0.05 are shown in spheres. (B) Like (A) but using the data from the BF520 experiments. For both Envs, sites that evolve significantly slower or faster than expected are often on Env’s surface Figure 9—figure supplement 1. (C) The results are similar regardless of whether the BG505 or BF520 experiments are used. Many of the sites of slower-than-expected evolution are asparagines in N-linked glycosylation motifs Figure 9—figure supplement 2. All sites that evolve slower than expected for both experimental datasets are in Figure 9—figure supplement 3. (D) A large cluster of sites that evolve slower than expected is likely involved in Env’s transition between open and closed conformational states. Gray boxes indicate sites that (Ozorowski et al., 2017) proposed form a hydrophobic network that regulates the conformational change; blue boxes and sticks indicate sites that evolve slower than expected. All analyses used the phylogenetic tree in Figure 1. The and -values are in Figure 9— source data 1.
-
Figure 9—source data 1
The and -values are in merged_omegabysite.csv.
- https://doi.org/10.7554/eLife.34420.034
Figure 9—figure supplement 1
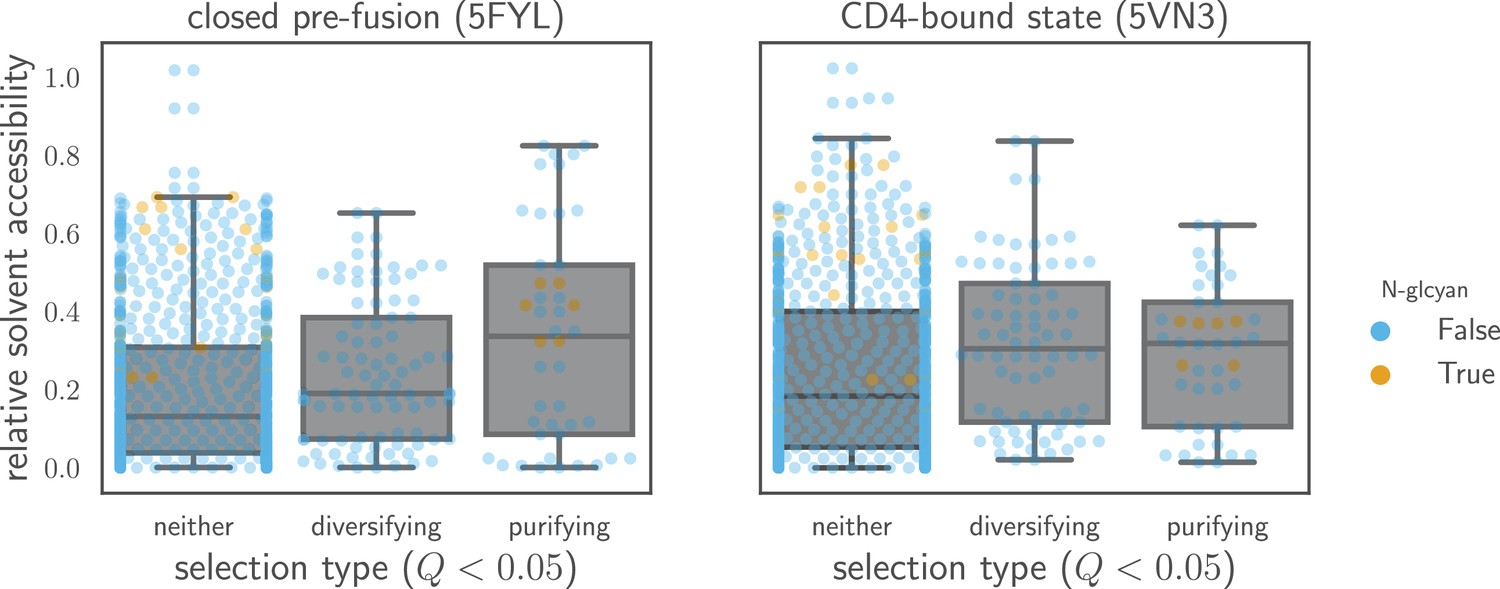
Relative solvent accessibilities of sites evolving faster or slower than expected.
Sites are grouped by whether they have (diversifying selection) or (purifying selection) at in both Envs, or whether they fall into neither of these categories. Relative solvent accessibilities were calculated as in Figure 7. As can be seen from these box plots with overlaid points for each site, sites of both diversifying and purifying selection tend to have higher relative solvent accessibility than other sites.
Figure 9—figure supplement 2
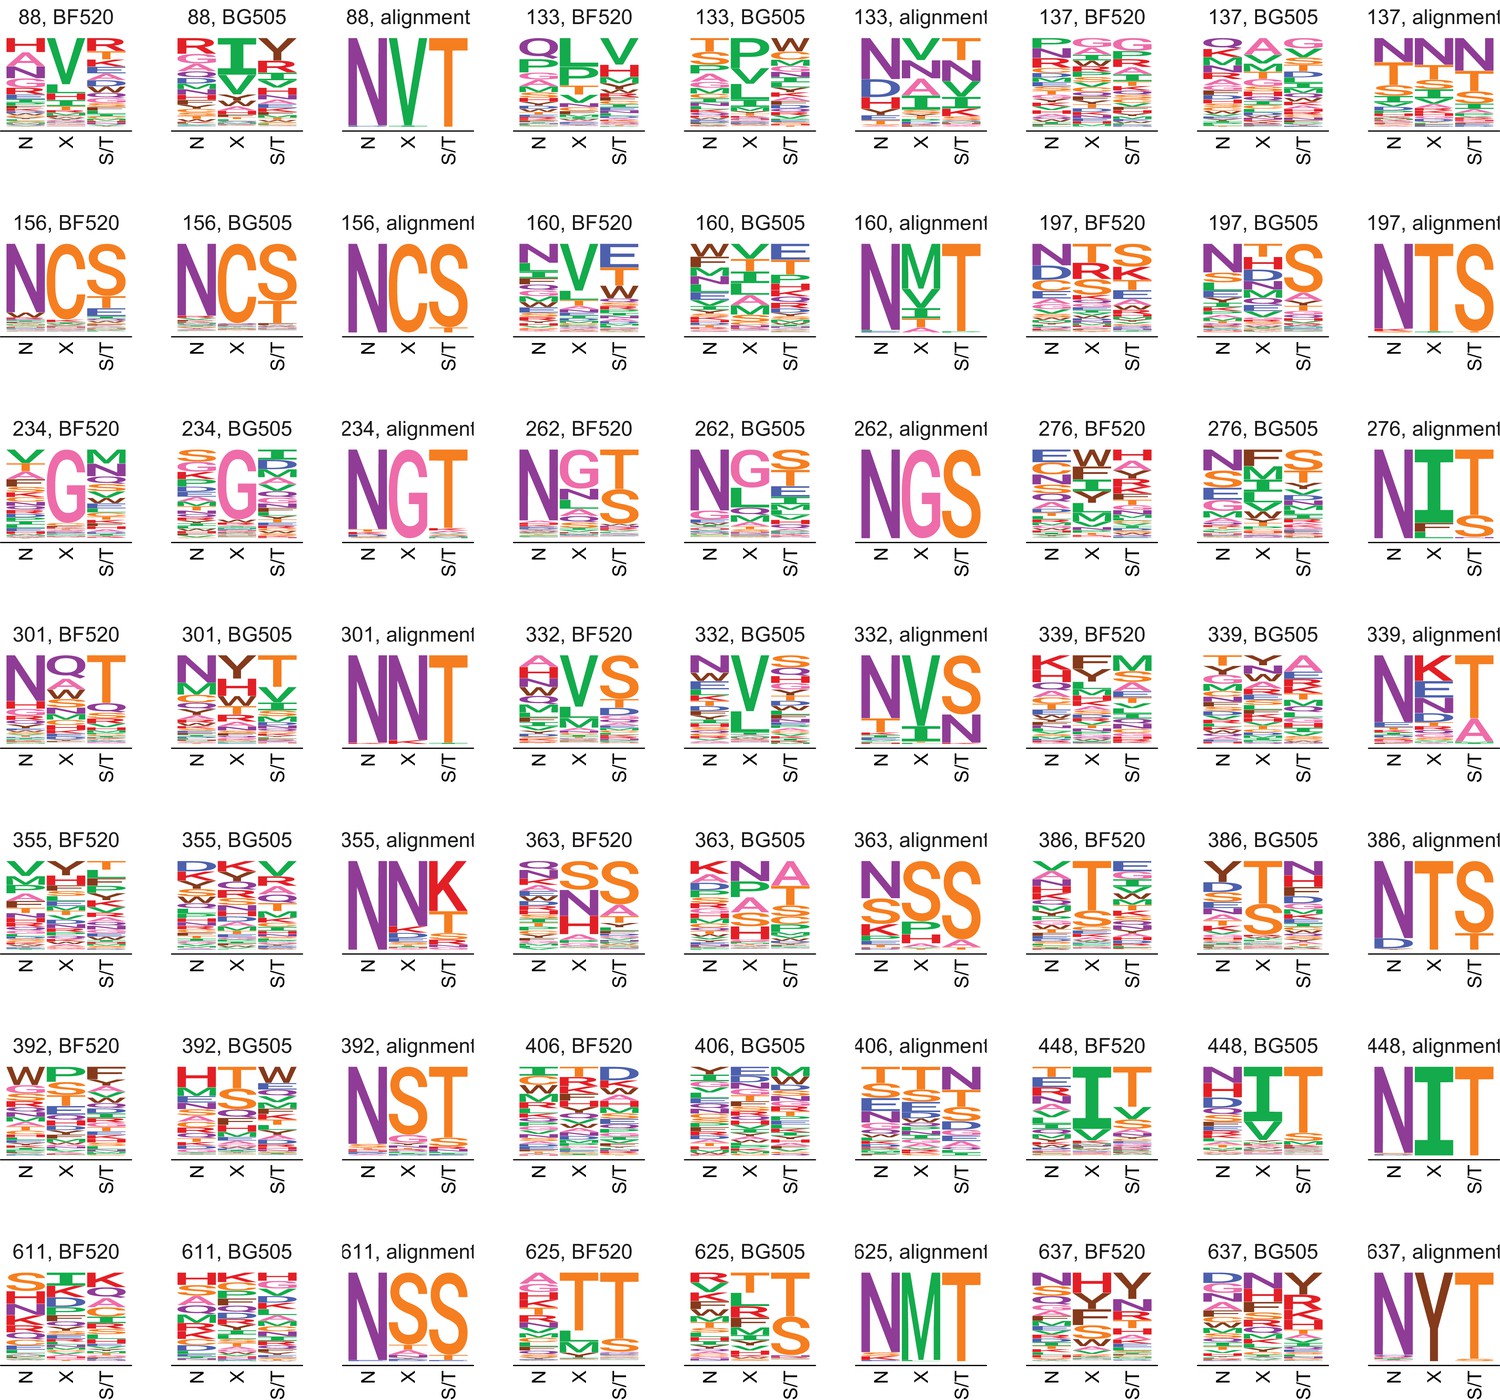
Amino acid preferences and alignment frequencies for glycosylation motifs.
This plot shows all sites that are N-linked glycosylation motifs in both BG505 and BF520. Each motif is named by the residue number of the asparagine, and the preferences (averaged across replicates) for each Env are shown as well as the frequencies of amino acids across the clade A alignment at each of the three positions in the motif (N-X-S/T). As can be seen from this plot, the experiments measure relatively broad mutational tolerance at many sites where the natural Env sequences have a strongly conserved motif. We suspect this is because many glycans serve as a shield against immunity in nature—a function that is not required in cell culture.
Figure 9—figure supplement 3
Amino acid preferences and alignment frequencies of sites that evolve slower than expected.
This plot shows all sites that are evolving more slowly than expected in natural sequences given the preferences measured in both Envs. Specifically, it shows all sites with at for the ExpCMs for both BG505 and BF520. For each site, the plots show the preferences averaged across replicates and re-scaled for each Env, as well as the frequencies of amino acids in the clade A Env alignment. The -value indicated is the maximum of that for the two Envs.
Tables
Table 1
Evolutionary models informed by the deep mutational scanning describe HIV’s evolution in nature much better than a standard substitution model.
Shown are the results of maximum likelihood fitting of substitution models to the clade A phylogeny in tree. Experimentally informed codon models (Hilton et al., 2017) utilizing the across-replicate average of the deep mutational scanning describe Env’s natural evolution far better than a standard codon substitution model (Yang et al., 2000) as judged by comparing the Akaike information criteria (Posada and Buckley, 2004). Both ExpCM’s have a stringency parameter 1. All models draw from a gamma distribution, and the table shows the mean () and shape parameters ( and ) of this distribution. The last two columns show the number of sites evolving faster () or slower () than expected at a false discovery rate of 0.05, as determined using the approach in Bloom, 2017) (see also the last section of the Results). Analyses were performed using phydms (Hilton et al., 2017, http://jbloomlab.github.io/phydms/). Table 1—source data 1. shows the results for additional substitution models.
| Model | AIC | LogLikelihood | nParams | Stringency | Nsites | Nsites | |||
|---|---|---|---|---|---|---|---|---|---|
| ExpCM BF520 | 0.0 | −35218.8 | 7 | 2.8 | 1.4 | 1.0 | 0.7 | 66 | 35 |
| ExpCM BG505 | 269.0 | −35353.3 | 7 | 2.1 | 1.3 | 0.9 | 0.7 | 65 | 53 |
| Goldman-Yang M5 | 3455.1 | −36941.4 | 12 | nan | 0.8 | 0.6 | 0.7 | 14 | 211 |
-
Table 1—source data 1
Results for phylogenetic models where is not drawn from a gamma-distribution or where the preferences are averaged across sites to eliminate the site specificity are in modelcomparison.md.
- https://doi.org/10.7554/eLife.34420.014
Additional files
-
Supplementary file 1
The code to perform all steps in the analysis is in analysis_code.zip.
Specifically, this file contains a Jupyter notebook that performs the analysis, all required input data, and all reasonably sized output files. The Jupyter notebook downloads the deep sequencing data, processes it with the dms_tools2 software (Bloom, 2015, https://jbloomlab.github.io/dms_tools2/), and also performs a variety of downstream analyses that generate most of the figures for this paper.
- https://doi.org/10.7554/eLife.34420.035
-
Supplementary file 2
An HTML rendering of the Jupyter notebook that performs the computational analysis.
The actual notebook is in Supplementary file 1, but if you just want to look at the analysis rather than run it, then you may prefer this file instead. In particular, the notebook contains plots detailing the deep sequencing data analysis as generated using the dms_tools2 software (Bloom, 2015, https://jbloomlab.github.io/dms_tools2/).
- https://doi.org/10.7554/eLife.34420.036
-
Supplementary file 3
The sequence of the wildtype BG505 env used in our study is in FASTA format in the file BG505_env.fasta.
- https://doi.org/10.7554/eLife.34420.037
-
Supplementary file 4
The sequences of the primers used for the BG505 codon mutagenesis are in the file BG505_codon_mutagenesis_primers.txt.
- https://doi.org/10.7554/eLife.34420.038
-
Supplementary file 5
The primers used for the BG505 barcoded-subamplicon sequencing are in the file BG505_bcsubamp_primers.txt.
- https://doi.org/10.7554/eLife.34420.039
-
Transparent reporting form
- https://doi.org/10.7554/eLife.34420.040
Download links
A two-part list of links to download the article, or parts of the article, in various formats.
Downloads (link to download the article as PDF)
Open citations (links to open the citations from this article in various online reference manager services)
Cite this article (links to download the citations from this article in formats compatible with various reference manager tools)
Mapping mutational effects along the evolutionary landscape of HIV envelope
eLife 7:e34420.
https://doi.org/10.7554/eLife.34420


