Signals from the brain and olfactory epithelium control shaping of the mammalian nasal capsule cartilage
- Julian Petersen

- Marketa Tesarova
- Bara Szarowska
- Maria Eleni Kastriti
- Meng Xie
- Karl Annusver
- Maria Kasper
- Orsolya Symmons
- Leslie Pan
- Francois Spitz
- Maria Hovorakova
- Tomas Zikmund
- Kazunori Sunadome
- Michael P Matise
- Hui Wang
- Ulrika Marklund
- Hind Abdo
- Patrik Ernfors
- Pascal Maire
- Maud Wurmser
- Andrei S Chagin
- Igor Adameyko
- Karolinska Institutet, Sweden
- Medical University Vienna, Austria
- Brno University of Technology, Czech Republic
- University of Pennsylvania, United States
- European Molecular Biology Laboratory, Germany
- Institut Pasteur, France
- Institute of Experimental Medicine, The Czech Academy of Sciences, Czech Republic
- Rutgers-Robert Wood Johnson Medical School, United States
- Reproduction and Cancer, Institute Cochin, France
- Sechenov First Moscow State Medical University, Russia
- Institute of Science and Technology IST Austria, Austria
Figures
Figure 1 with 1 supplement
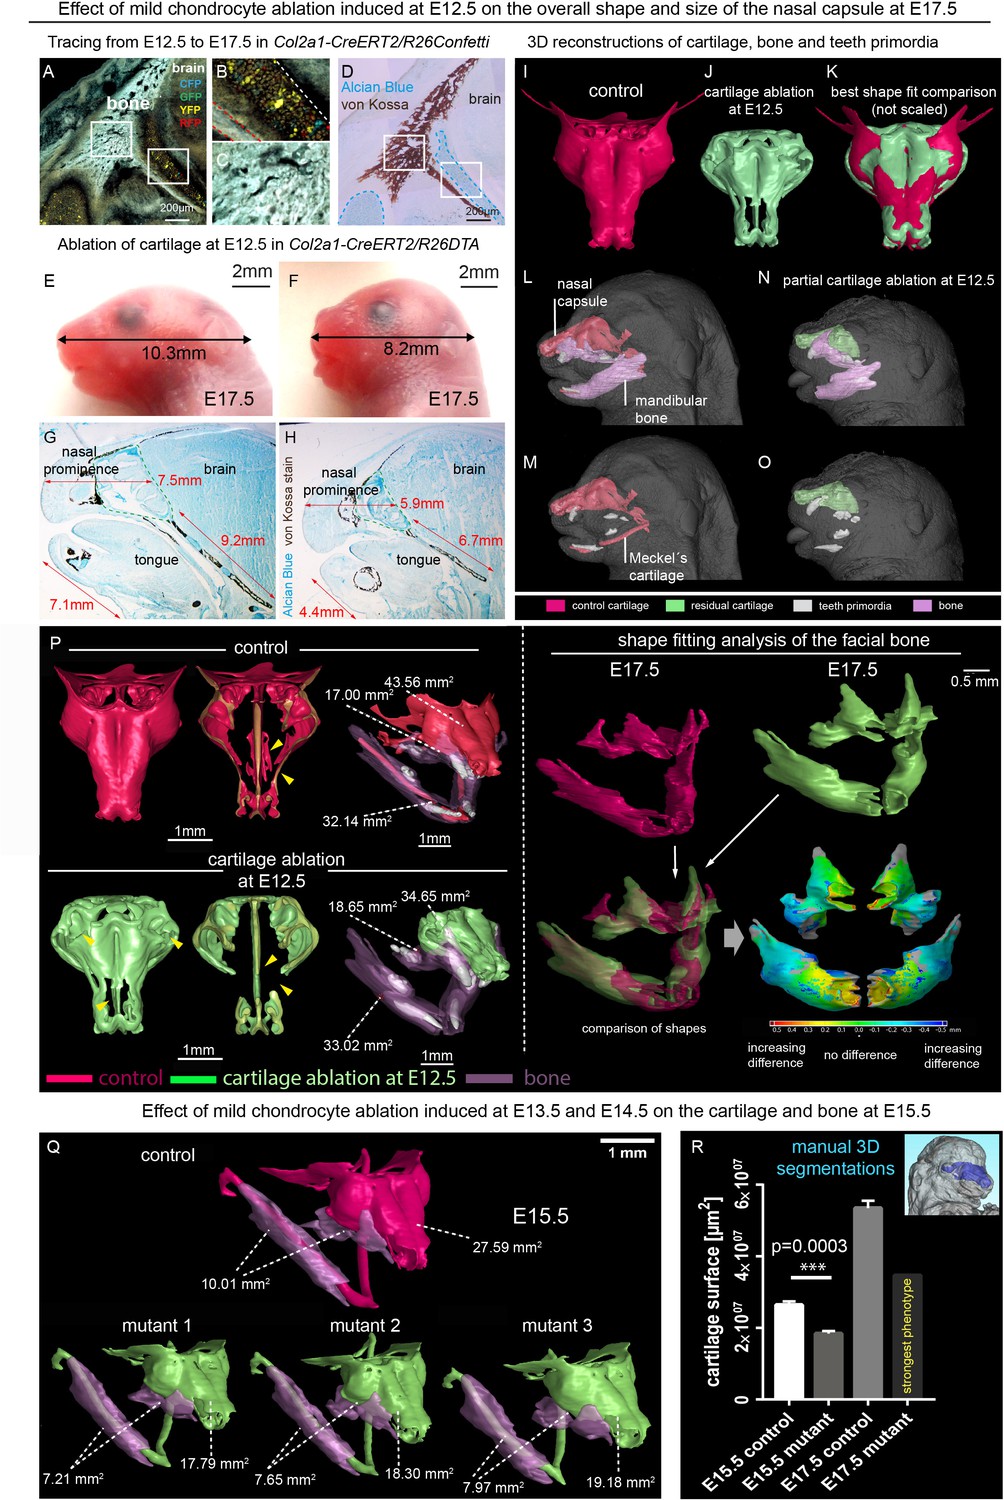
Correct chondrocranium development is essential for shaping the embryonic face.
(A–C) Genetic tracing induced at E12.5 in Col2a1-CreERT2/R26Confetti shows recombination in chondrocytes (B) only and not in a lineage of membranous bone osteoblasts and their progenitors (C), 25 µm cryo-sections (A–D, G–H) were imaged with a confocal microscope (A–C) or phase contrast microscope (D, G–H). (D) Traced sections have been stained using Alcian Blue (cartilage, blue) and von Kossa (brown, mineralized tissue). (E–F) Wild type (E) and Col2a1-CreERT2/R26DTA (F) embryos with cartilage being partially ablated as a result of tamoxifen injection (2.5 mg) at E12.5, both analyzed at E17.5. (G–H) Sagittal sections of the anterior head from wild type (G) and Col2a1-CreERT2/R26DTA (H) embryos stained with Alcian Blue (blue, stains for cartilage) and von Kossa staining (black, stains for mineralized bone tissue). Olfactory system is outlined by green dashed line for better orientation. Note that physiological growth of the cartilage sets the proper size of the facial compartment. (I–O) 3D-reconstructions of frontal chondrocranium together with bone and teeth primordia in control (I, L, M) and cartilage-ablated (J, N, O) embryos. (K) Best fit comparison of control (red) and cartilage-ablated (light green) 3D chondrocranium models. (P) 3D-reconstruction of frontal chondrocranium and formed cartilage including GOM Inspect software analysis of the mutant bone (Q) overview of analyzed mutants (injected with low dose of tamoxifen (2.5 mg) at both E13.5 and E14.5 and analyzed at E15.5) and formed bone in one representative control and three mutants (R) Bar-graphs showing the manual 3D segmentation of the surface area of cartilage. Data are obtained from three control samples and three mutant mice for (E15.5) and three control samples and one mutant sample with the most pronounced phenotype for (E17.5). The error bars show mean and standard deviation (SD). For the comparison, we used unpaired Student t-test (95% confidence interval −9974138 to −6056665). Raw data are available in Figure 1—source data 1.
-
Figure 1—source data 1
Raw values of cartilage surface measurments corresponding to Graph in Figure 1R.
- https://doi.org/10.7554/eLife.34465.004
Figure 1—figure supplement 1
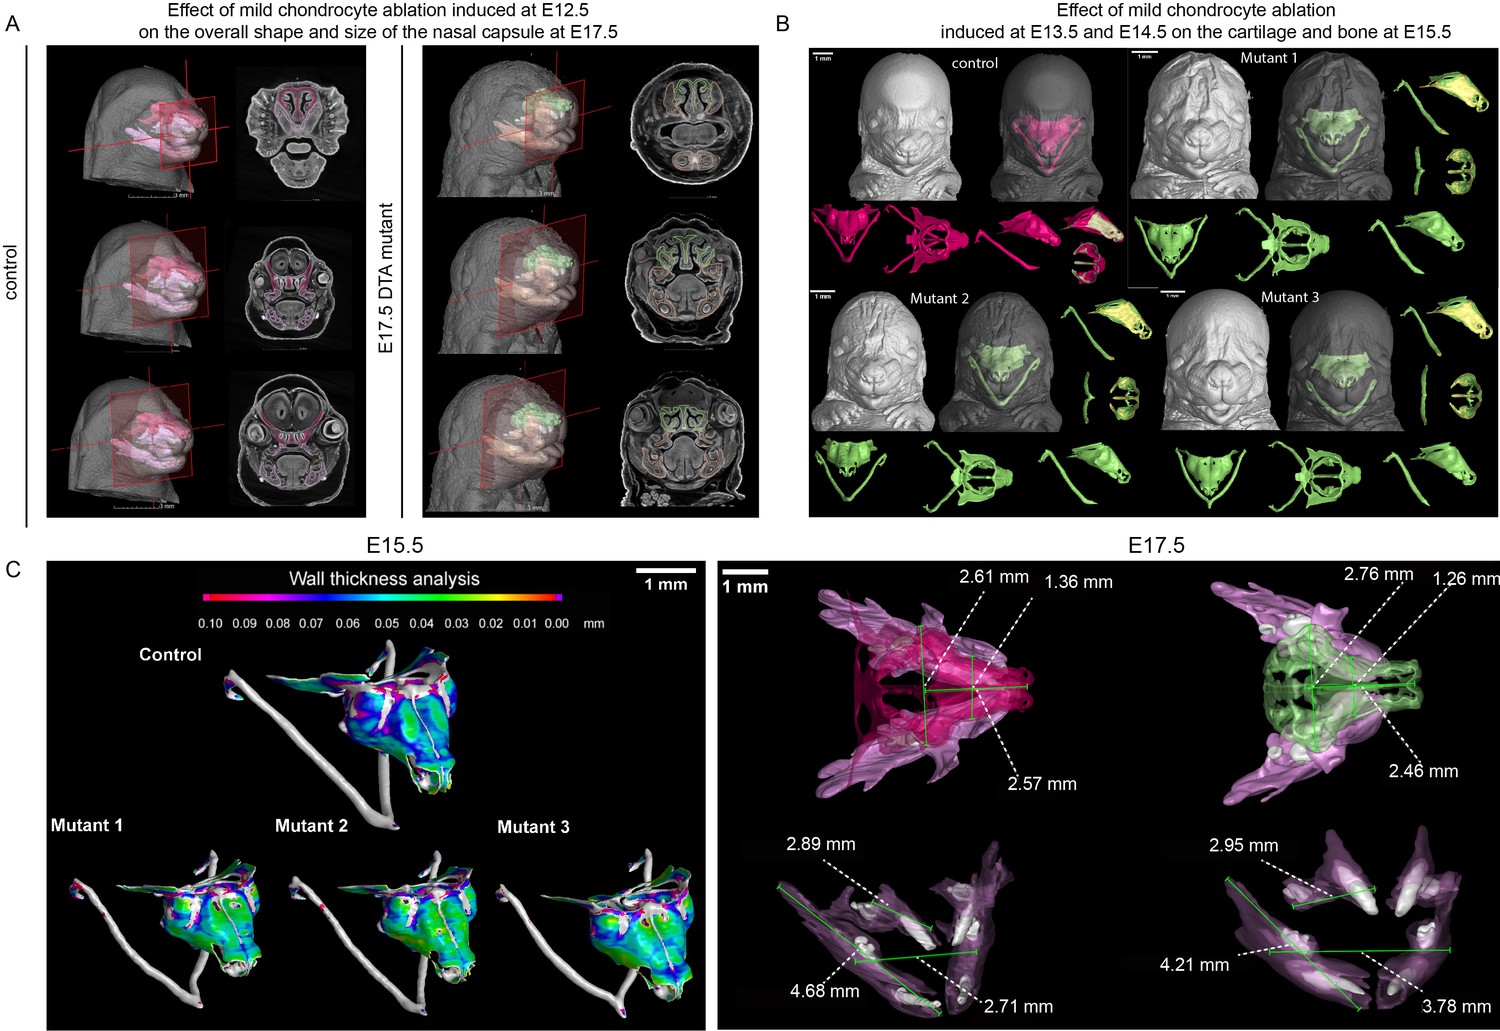
Mild ablation of cartilage using Col2a1-CreERT2/R26DTA.
(A) Coronal cross-section of Col2a1-CreERT2/R26DTA control at E17.5 mutants (mild cartilage ablation was induced by low dose of tamoxifen (2.5 mg) administered at E12.5) and 3D reconstruction of the changed/absent geometries of cartilaginous elements. In control red color represents bone, pink color represents cartilage. In the DTA mutant green color represents bone whereas orange color represents cartilage (B) Overview of three analyzed Col2a1-CreERT2/R26DTA E15.5 mutants (mild cartilage ablation was induced by low dose of tamoxifen (2.5 mg) administered at both E13.5 and E14.5 and analyzed at E15.5) and 3D reconstruction of the changed/absent geometries of cartilaginous elements (C) Wall thickness analysis of stereotypical control sample and three analyzed mutants (low-dose tamoxifen (2.5 mg) administered at both E13.5 and E14.5 and analyzed at E15.5).
Figure 2 with 1 supplement
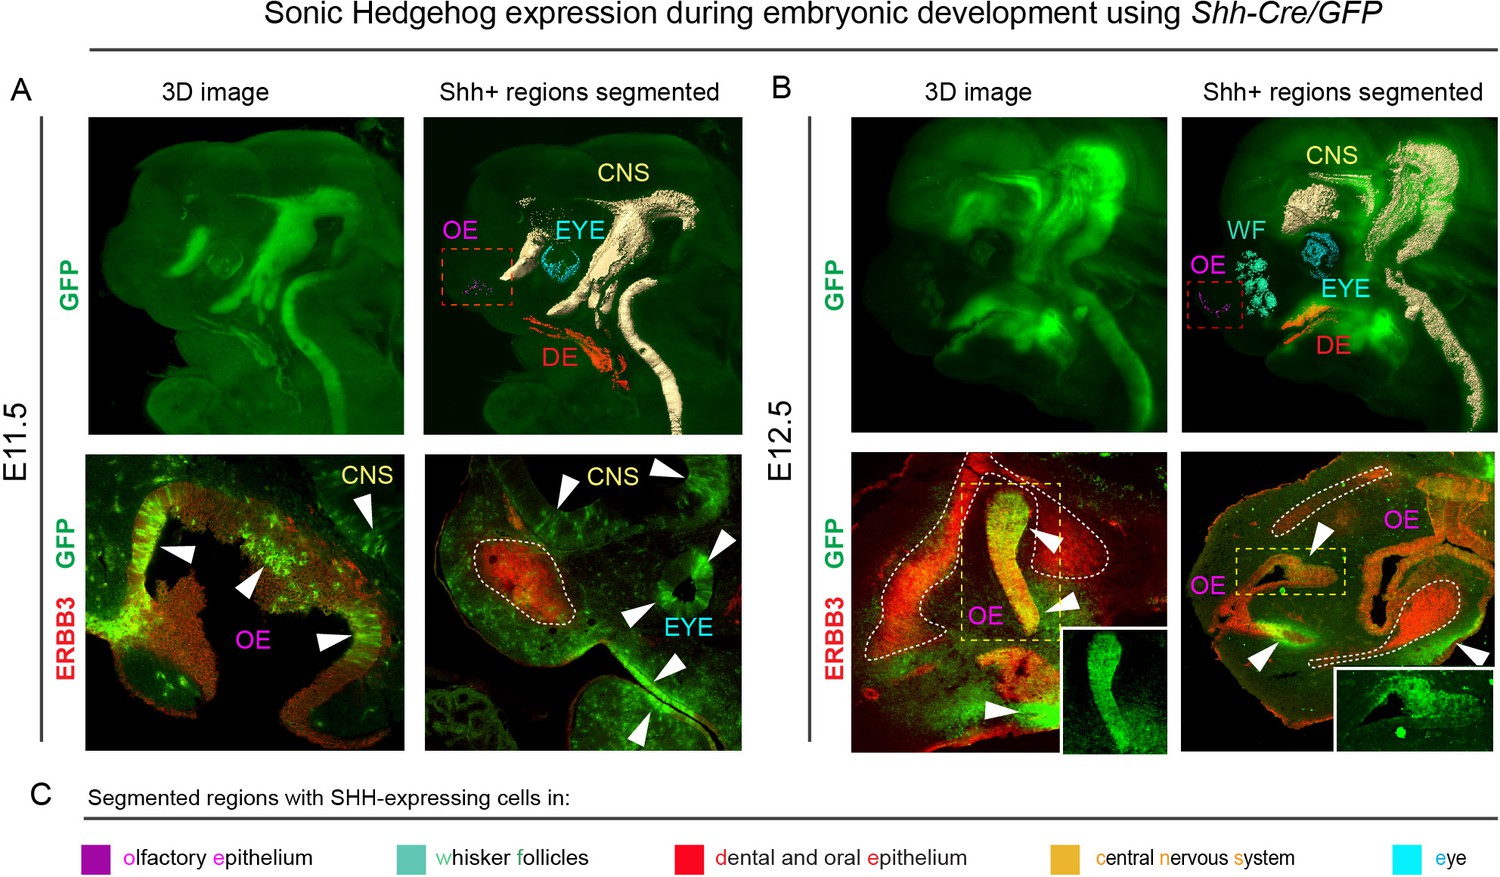
Shh is expressed through the early facial development in distinct regions of the head.
The expression pattern of Shh during developmental stages E11.5 (A) and E12.5 (B) in B6.Cg-Shhtm1(EGFP/cre)Cjt/J, segmented Shh-expression regions are color-coded and clarified in legend (C). Immunohistochemical (IHC) staining shows olfactory neuroepithelium and newly formed mesenchymal condensation as ERBB3 positive. White arrows point at GFP-expressing parts of various tissues. Red rectangle in (A) and (B) upper panel mark the olfactory neuroepithelium, yellow rectangle in (B) shows area magnified in the right bottom corner. White dotted line outlines the shape of mesenchymal condensation. IHC staining was performed on 20 µm cryosections and imaged using a confocal microscope.
Figure 2—figure supplement 1
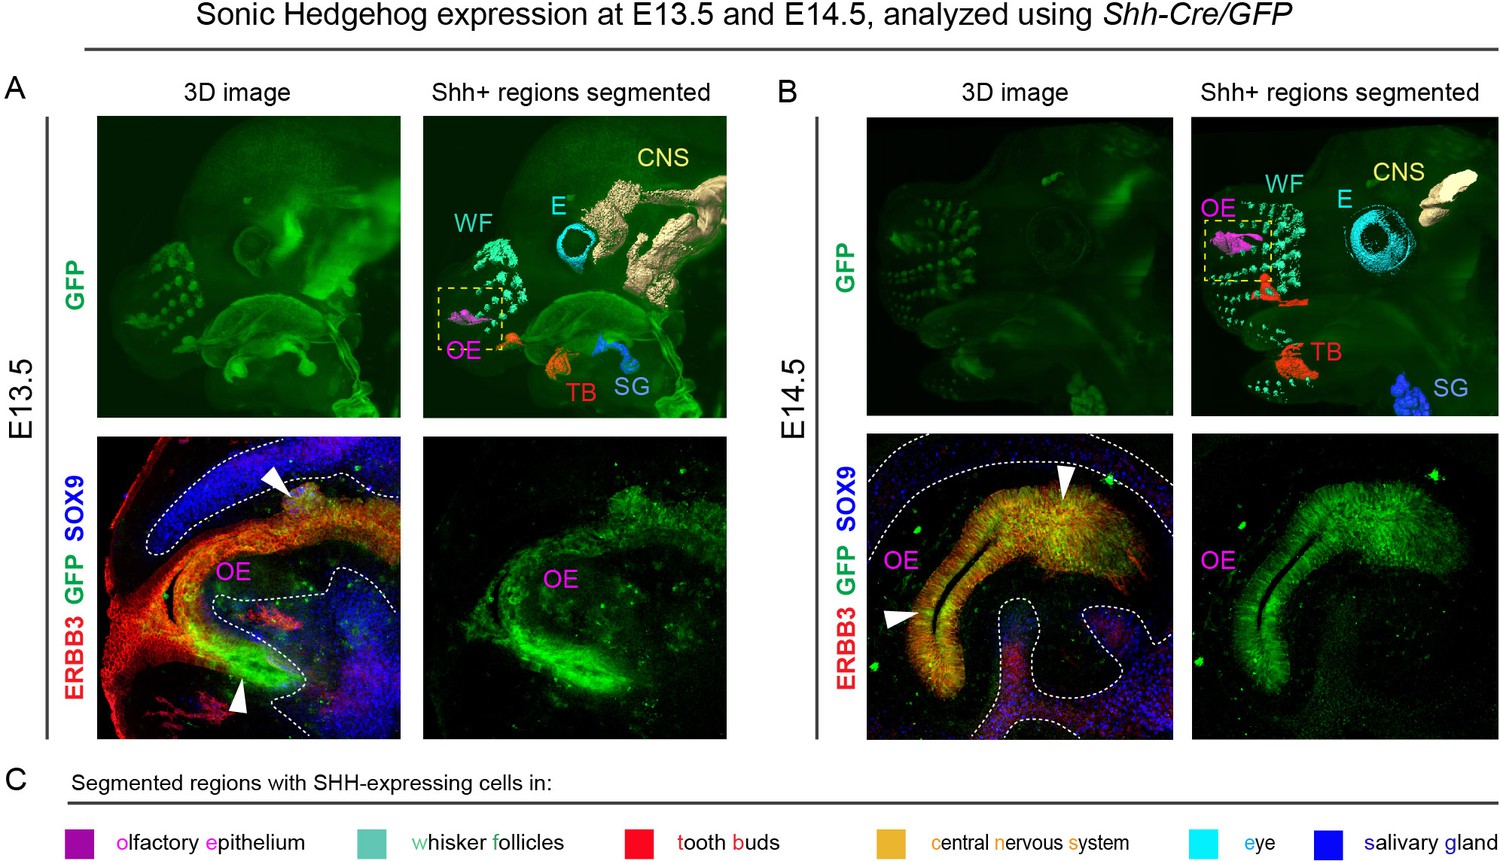
Shh is expressed through the later facial development in distinct regions of the head.
The expression pattern of Shh between developmental stages E13.5 (A) and E14.5 (B), segmented Shh-expression regions are color-coded and clarified in a legend (C). Immunohistochemical staining (25 µm cryosections) shows olfactory neuroepithelium as ERBB3 positive and surrounding cartilage as SOX9 positive. White arrows point at GFP-expressing parts of olfactory neuroepithelium. Yellow dotted linein the upper panels shows the area selected for immunohistological staining shown in the bottom panels. White dotted line outlines the shape of cartilage. Upper panels were imaged using a Light Sheet Microscope system Z1 from Carl Zeiss. Lower panels were obtained with confocal microscope.
Figure 3 with 4 supplements

Shh signal from the brain induces a posterior part of a nasal capsule.
(A) Model of overall shape resulting from the excision of Shh from the floor plate using Nkx2.2-Cre/Shhfloxed/floxed shows visible phenotype in the E12.5 mutant embryo comprising, for instance, from the cleft of upper lip, non-prominent or missing nasal vestibule and diminished curvature of the snout. (B–C, E–F) micro-CT scans-based 3D reconstructions of chondrogenic mesenchymal condensations in E12.5 mutant and control embryos. Note the missing posterior part of the developing nasal capsule and the missing septum in the mutant. (D) best-fit computed comparison of the overall shape and size of mutant and control embryo. (G–H) 3D models of chondrocrania of mutant (Nkx2.2-Cre/Shhfloxed/floxed) and control embryo, analyzed at E15.5. Among the main differences are missing frontal part of nasal cartilage, missing lateral parts of developing nasal capsule, malpositioned asymmetric cartilage, not fully closed foramina for pervading nerves and vasculature and various disconnected cartilaginous segments. (I) Segmented cartilage and bones projected in the overall shape of the head of mutant (bottom) and control (upper) embryo. Note the malpositioned incisors in the maxilla of the mutant and missing part of the frontal nasal capsule formed by the bone. (J) Wall thickness analysis of the cartilages in the E15.5 head of mutant (bottom) and control (upper) embryo show no evident differences in the thickness of formed cartilage.
Figure 3—figure supplement 1
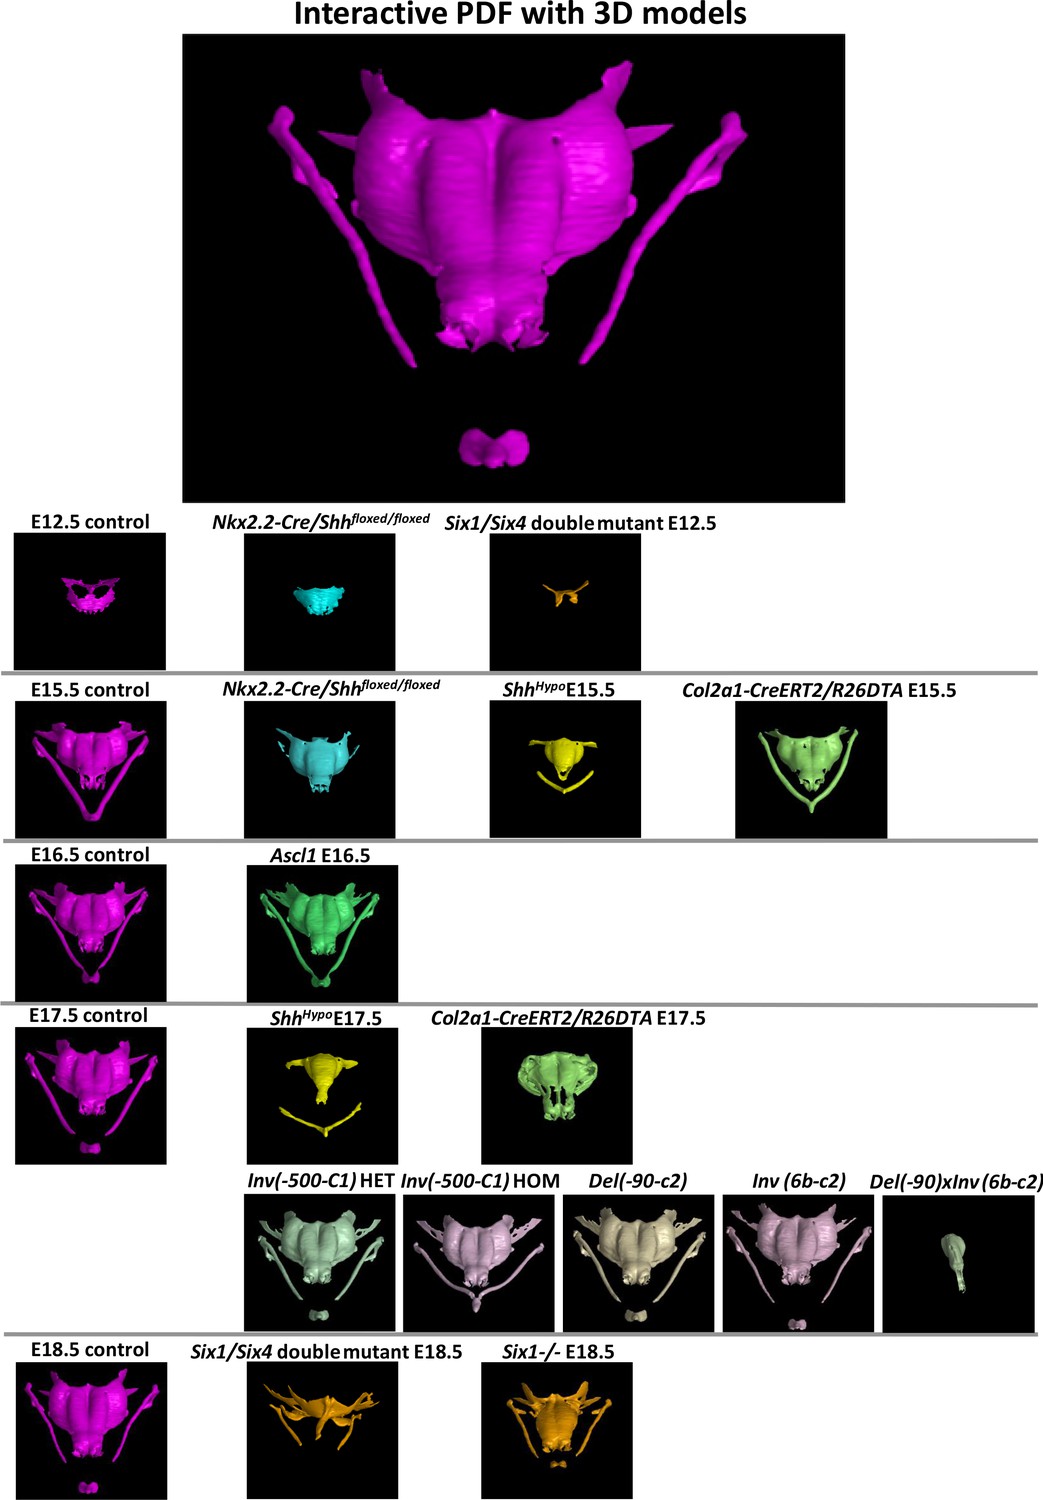
‘Interactive PDF’.
Interactive file enables detailed browsing of segmented 3D models of all mutant embryos. Segmented models of cartilaginous nasal capsules of mutants and appropriate controls: Nkx2.2-Cre/Shhfloxed/floxed E12.5 and E15.5 with both control stages; E18.5 Six1/Six4 double knock out with E18.5 control; wild-type E17.5 embryo, Inv(−500 C1) heterozygous embryos, Inv(−500 C1) homozygous embryo, Del(−90 C2) embryo, Inv(6b-C2) embryo, Del(−90 C2)xInv(6b-C2) embryo.
Figure 3—figure supplement 2
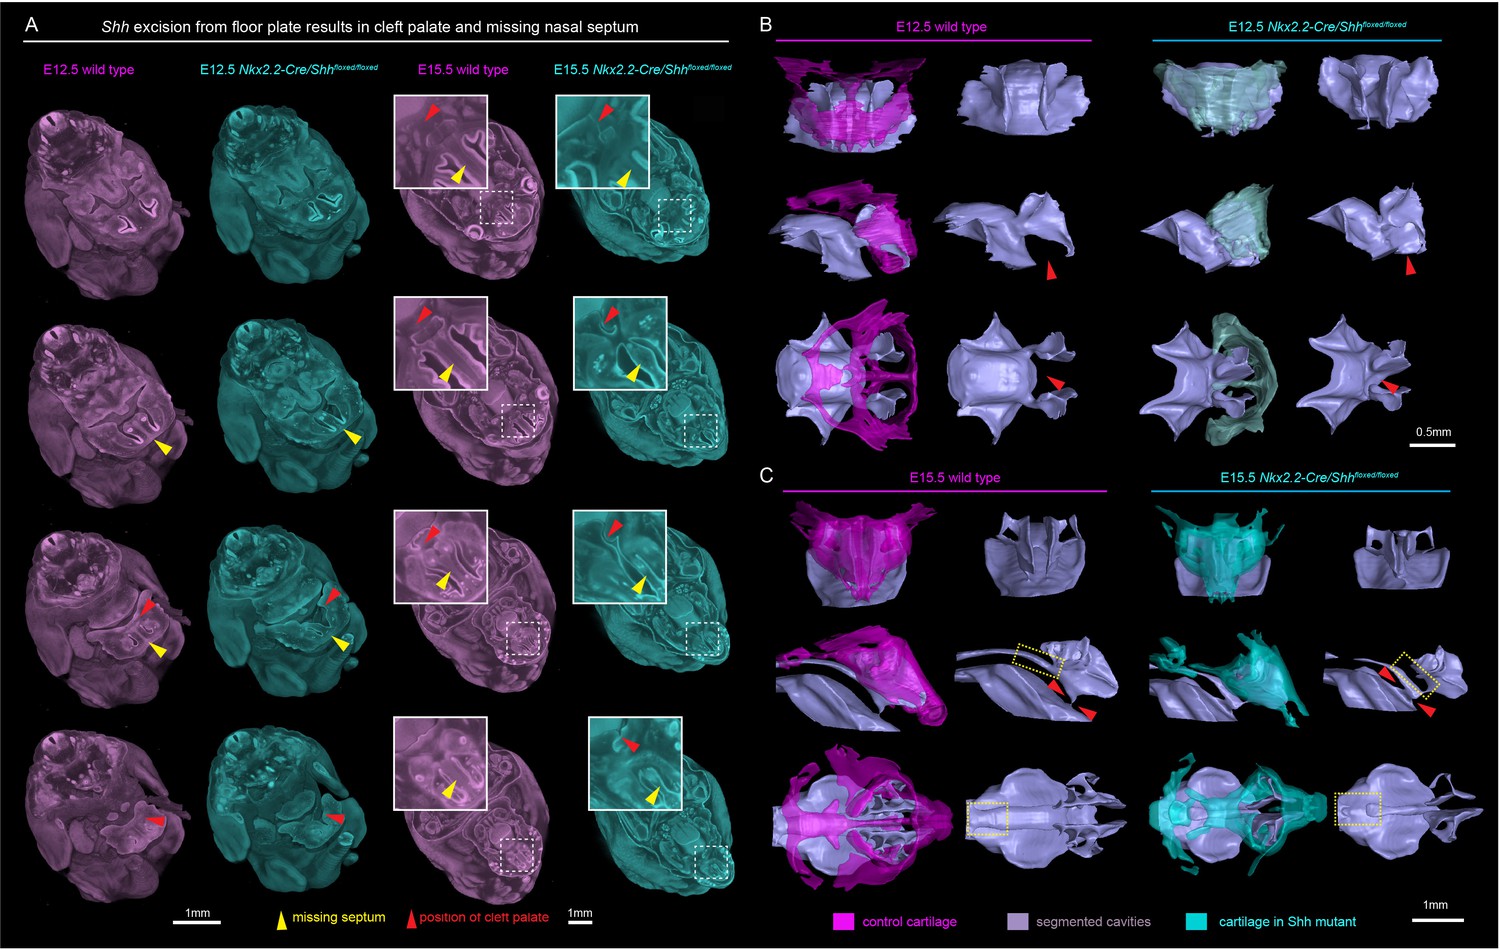
Ablation of Shh from the floor plate results in the cleft palate.
(A) E12.5 control (magenta) and mutant (blue-green, Nkx2.2-Cre/Shhfloxed/floxed) clipping planes through the head shows cleft palate (red arrows) and missing septum (yellow arrows) in mutant embryo and corresponding locations in control embryo. (B) Segmentation of cartilage forming the nasal capsule (magenta for E12.5 control embryo; blue-green for E12.5 mutant embryo) and cavities (grey-colored) located inside the capsule and their interconnections show cleft and abnormal connections of the cavities in the mutant. (C) Segmentation of cartilage forming the nasal capsule (magenta for E15.5 control embryo; blue-green for E15.5 mutant embryo) and cavities (grey-colored) located inside and their interconnections show cleft and abnormal and interrupted connections of the cavities in the mutant.
Figure 3—figure supplement 3
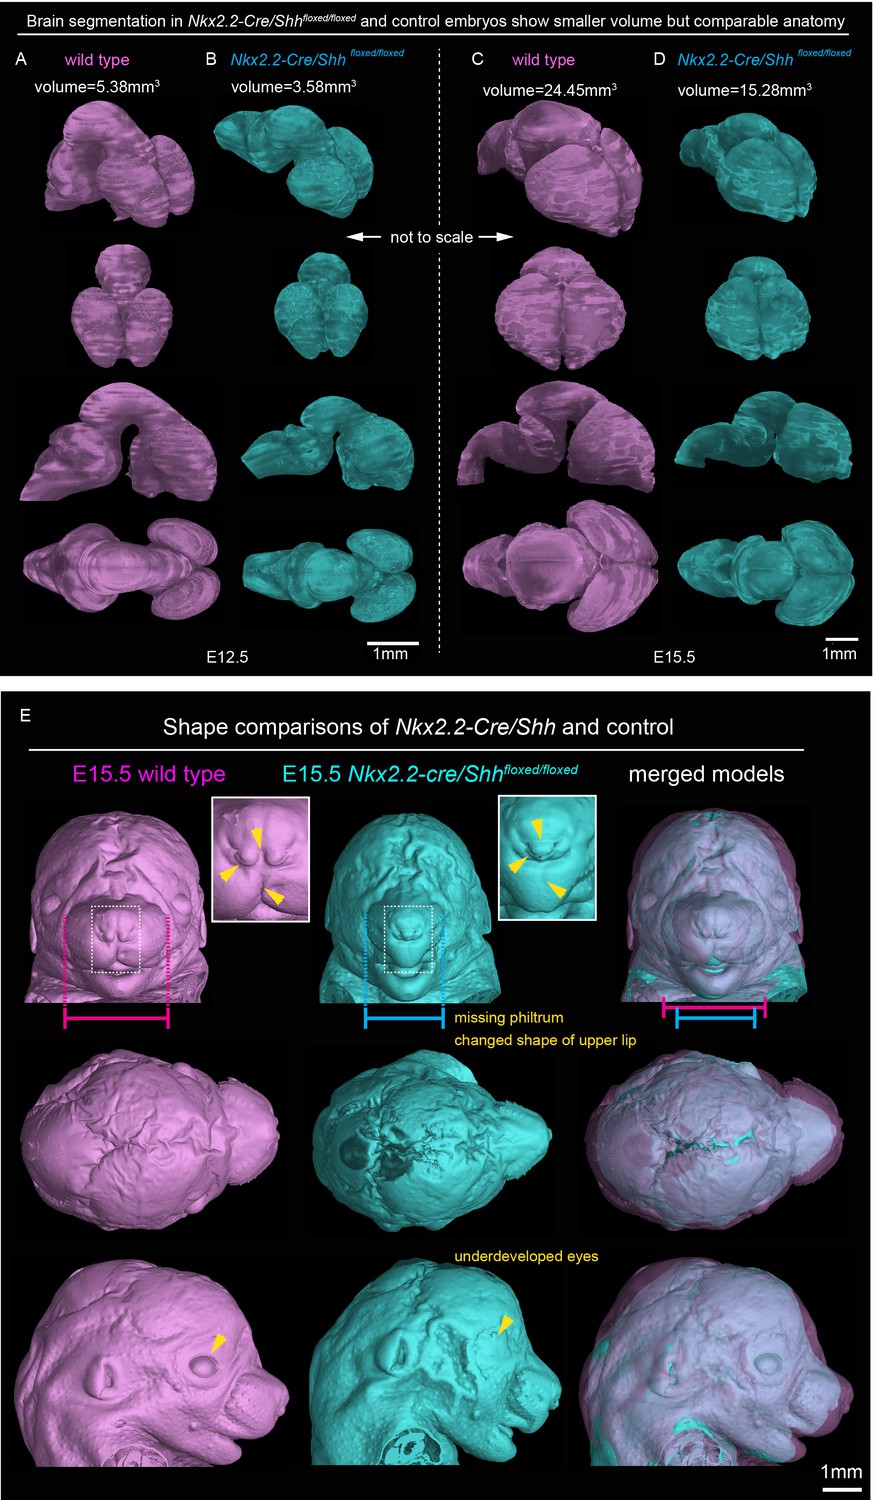
Brain volume and overall anatomy in mutants with Shh genetically deleted from the floor plate of the developing CNS.
3D-visualizations of brains in (A) E12.5 wild type, (B) E12.5 Nkx2.2-Cre/Shhfloxed/floxed, (C) E15.5 wild type and (D) E15.5 Nkx2.2-Cre/Shhfloxed/floxed embryo show decreased volume of the brains in the mutants but preserved anatomy compared to the littermate controls. (E) Comparisons of shape of E15.5 wild type and Nkx2.2-Cre/Shhfloxed/floxed embryo. Pink and blue bars shows the difference of the width of the snout and additional changes in overall anatomy or geometry are marked by yellow arrows and text.
Figure 3—figure supplement 4

Phenotypic manifestation of Shh genetic ablation from the floor-plate, analyzed at E15.5 upper part of spine.
(A–C, E–G) 3D-models of upper parts of spine of (E–H) mutant (Nkx2.2-Cre/Shhfloxed/floxed) and (A–D) control embryo, analyzed at E15.5. (D, H) raw CT slices showing corresponding location marked with white dotted rectangle in (A) and (E). Mutant embryo shows incomplete transverse foramina of cervical vertebrae. (I) Further analysis of showing left and right vertebral arteries traversing the transverse foramina of the cervical vertebrae. (J) Raw CT data – slices showing the different chondrogenesis in both E12.5 and E15.5 embryos between wild type and Nkx2.2-Cre/Shhfloxed/floxed. Major differences are pointed at by arrows.
Figure 4 with 2 supplements
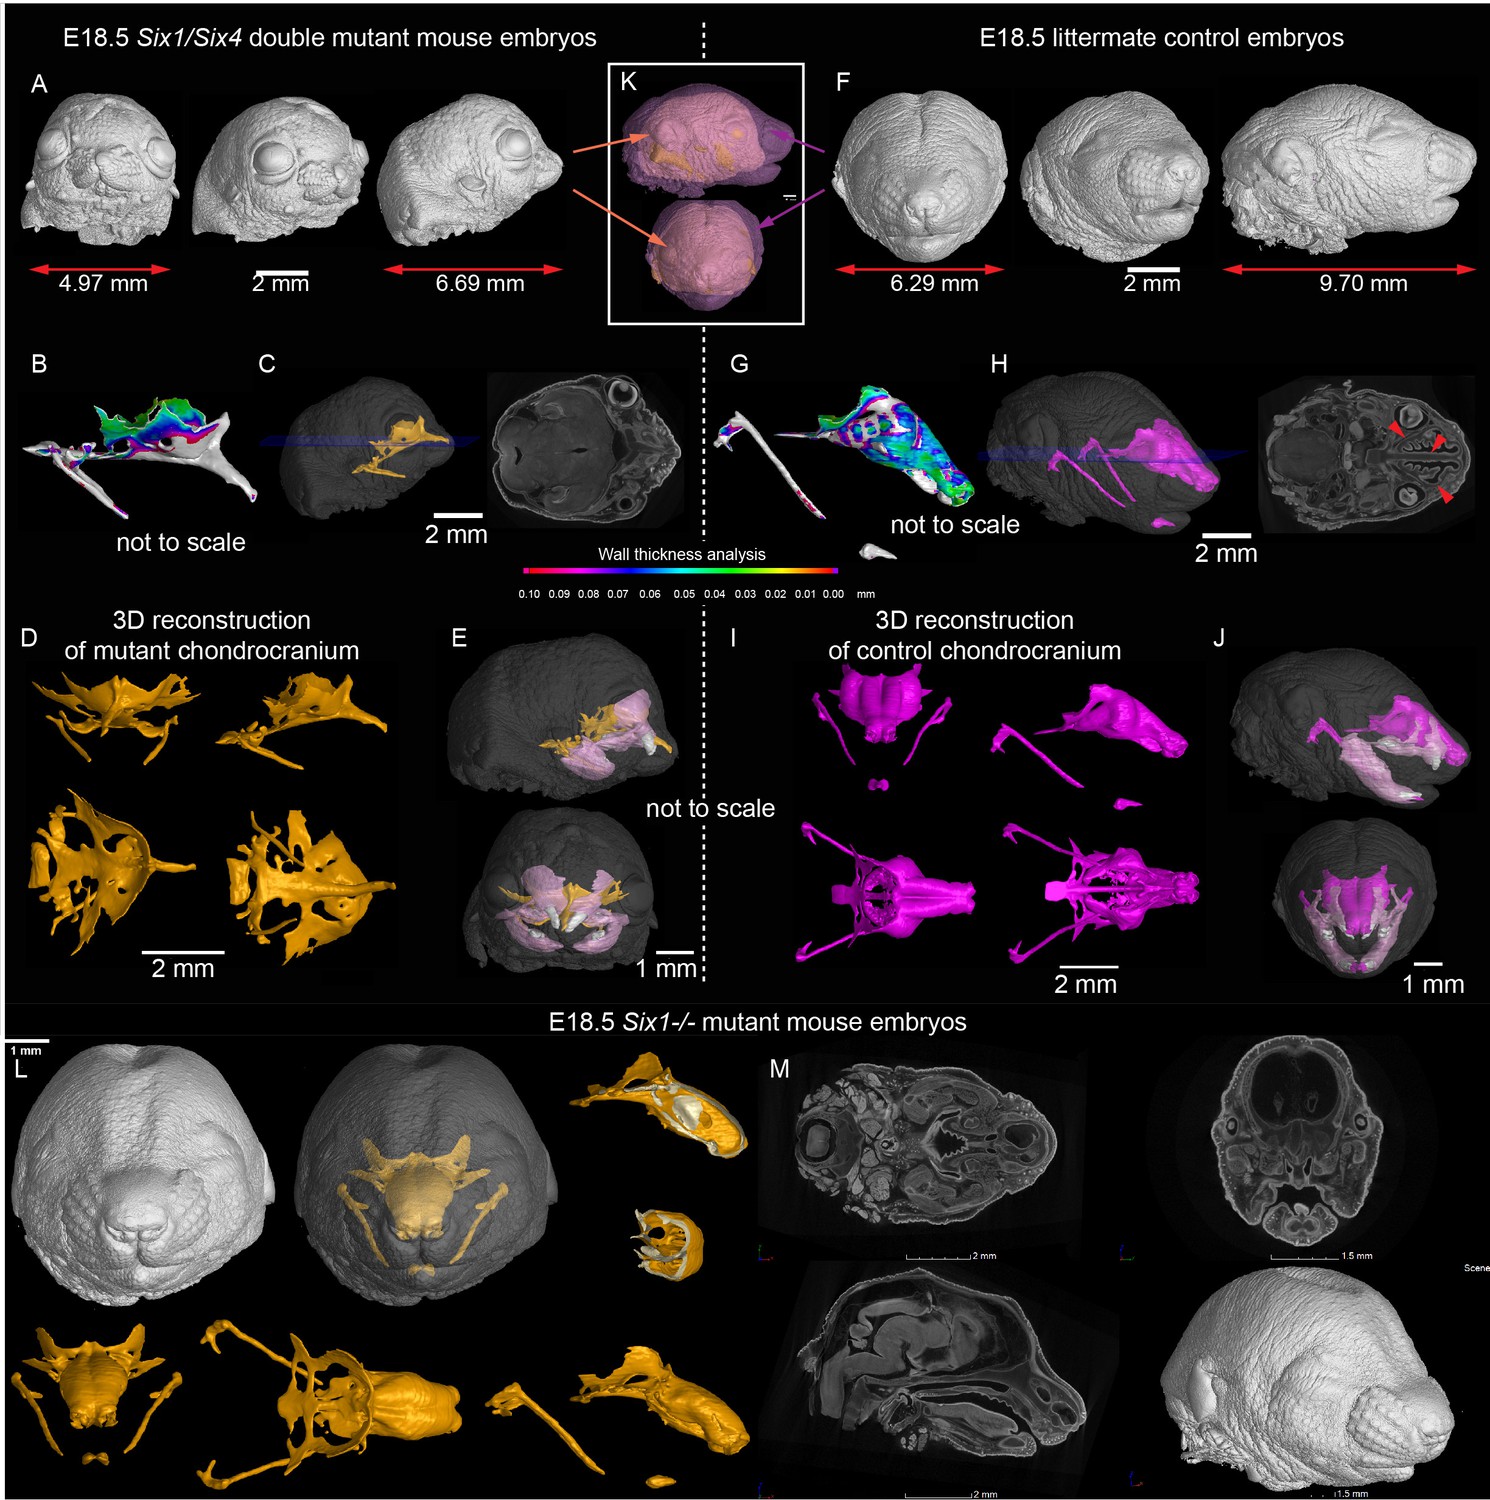
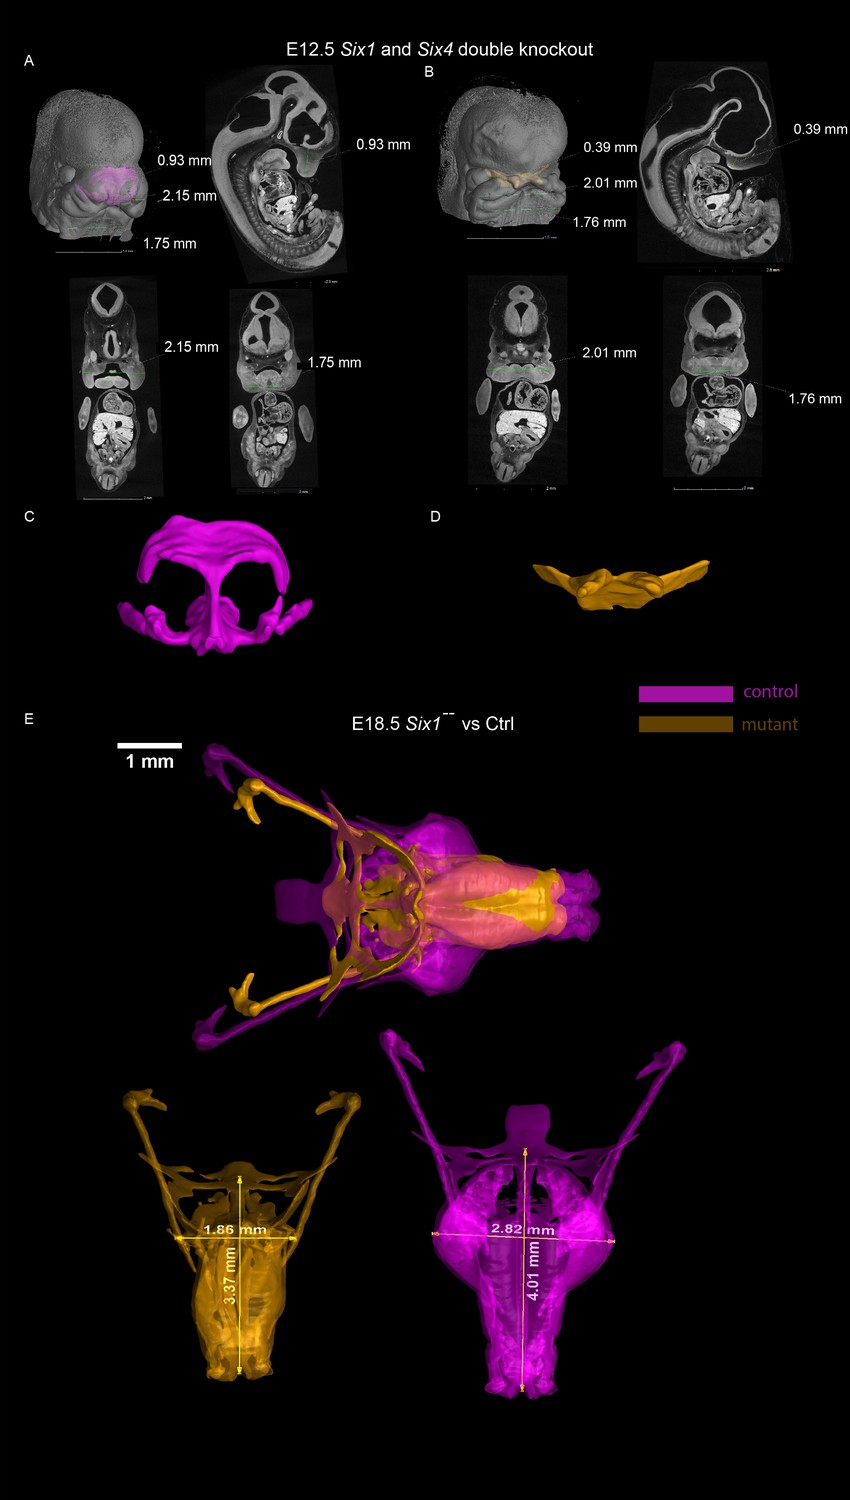
Signals from the olfactory epithelium induce the anterior part of the nasal capsule.
(A–J) Six1/Six4 double knock out mouse embryo compared to littermate control and analyzed at E18.5 using micro-CT and 3D-reconstruction. (A, E, K) overall shape and size of the mutant head is different from the control head, showing brachycephalic phenotype, bulging eyes, misshaped earlobes positioned more frontal and lower than the control embryo (F, J, K). Note also the left-right asymmetry of the snout of the mutant. (B, G) Wall thickness analysis of mutant (B) and control (G) embryo. (C, H) single plane from raw CT data shows missing olfactory neuroepithelium in the Six1/Six4 double mutant and control. Note also missing nasal capsule but retained septum in the mutant. (D–E, I–J) various views on segmented 3D model of chondrocranium of mutant (D–E) and control (I–J) embryo. Among the obvious differences are missing roof and lateral parts of nasal capsule while the septum is preserved. (L) Six1 single knock out mouse embryo analyzed at E18.5 using micro-CT 3D reconstruction (M) single plane cross-sections from raw CT of Six1 single knock out E18.5 embryo.
Figure 4—figure supplement 1
Analysis of mesenchymal condensations in Six1/Six4 double knock out embryos at E12.5.
(A–D) general anatomy of the head, sagittal cross-section and frontal view at E12.5 wild type embryo (A) and Six1/Six4 double knock out (B) E12.5 embryos and segmented chondrogenic mesenchymal condensation forming future nasal capsule of wild type (C) and mutant (D). (E) 3D comparisons of Six1-/- nasal capsule with control.
Figure 4—figure supplement 2
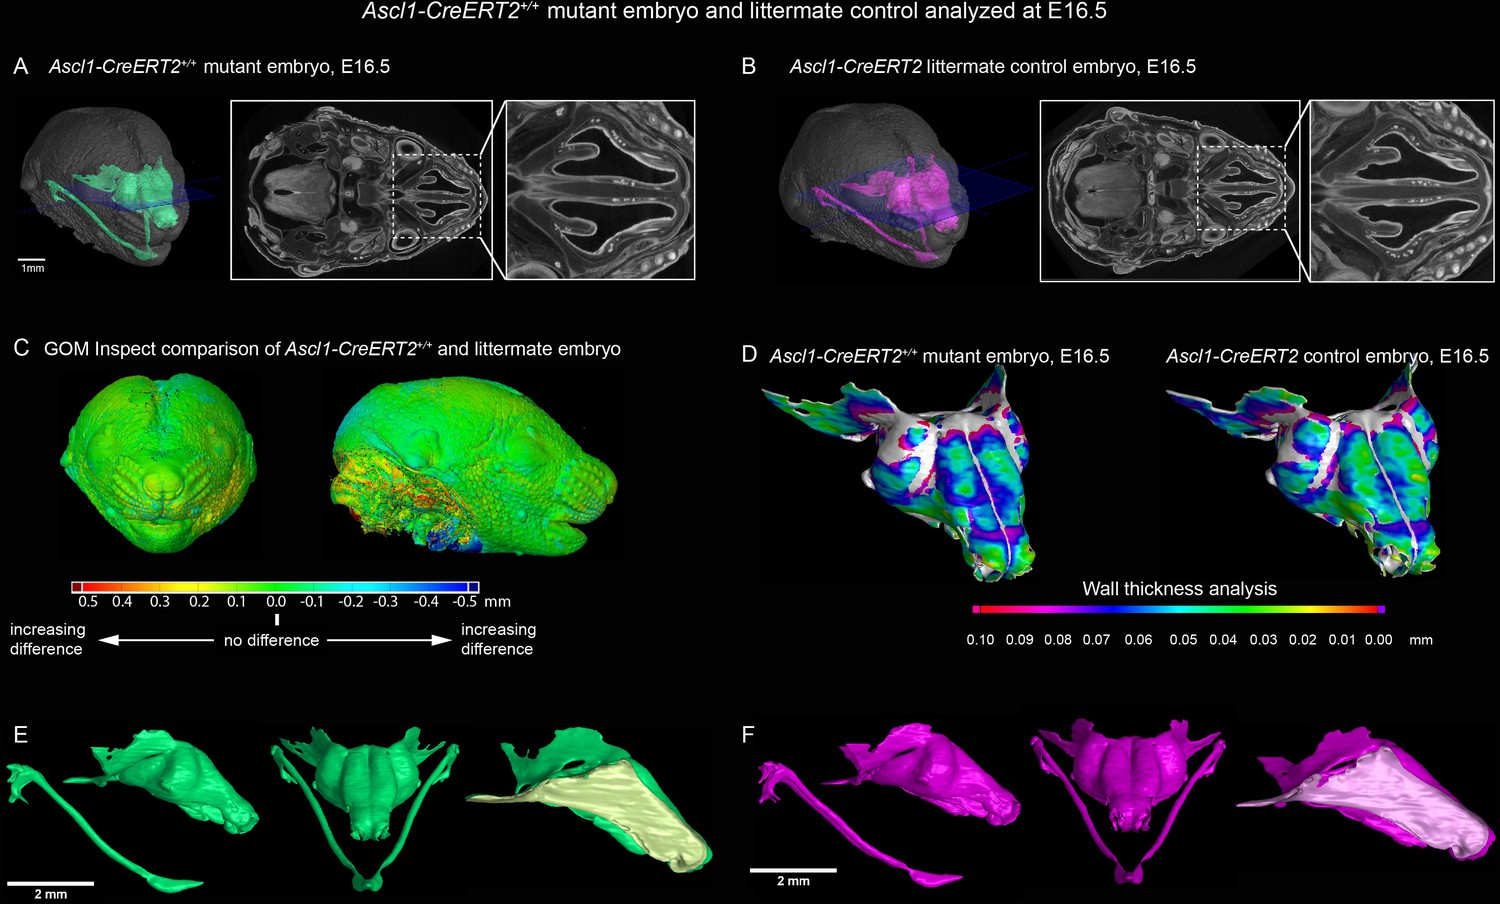
Ascl1 knockout embryo analyzed at E16.5 does not show any significant changes in formed nasal capsule.
(A) Ascl1 knockout embryo with segmented nasal capsule and (B) littermate control. (C) GOM Inspect software analysis and shape comparison between mutant and control embryos. (D) Wall-thickness analysis of mutant (left) and control (right) embryos shows no significant changes. (E–F) Segmented nasal capsules of mutant (left, green) and control (right, magenta) embryos.
Figure 5 with 1 supplement
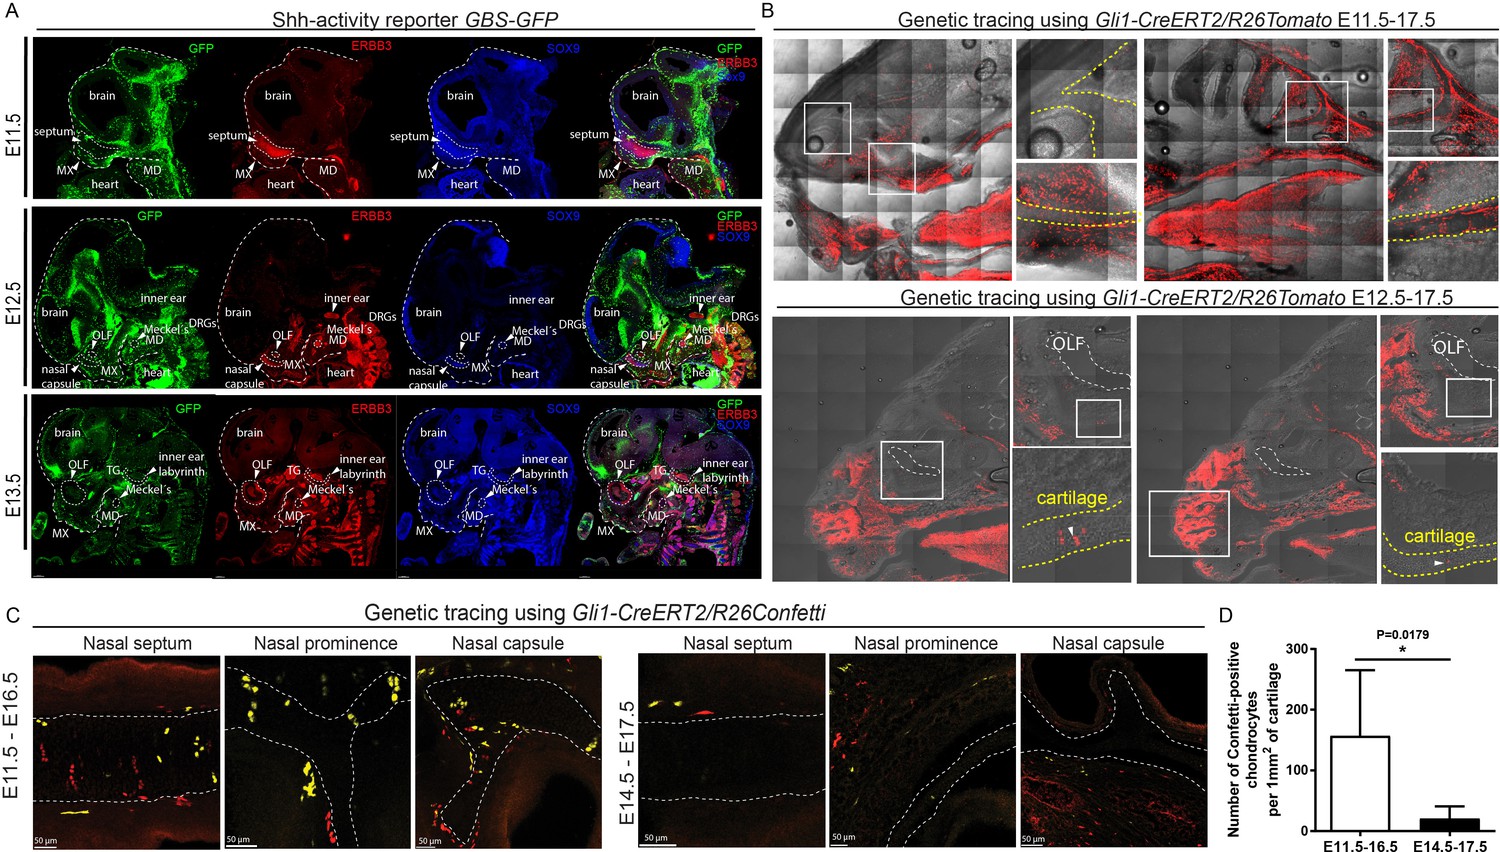
Mapping of the expression of Gli1 and Shh signaling activity in mouse embryonic head.
(A) Mapping of the activity of the SHH signaling in mouse embryonic head at E11.5, E12.5 and E13.5 prechondrogenic and early chondrogenic stages using GBS-GFP activity reporter. (B) Genetic tracing using Gli1-CreERT2/R26Tomato induced at E11.5 (upper panel) and E12.5 (bottom panel) and analyzed at E17.5. Dotted line outlines cartilaginous structures within the nasal capsule. White squares outline the magnified area. DRG = dorsal root ganglion, OLF = Olfactory system, MX = maxillar prominence, MD = mandibular prominence. TG = trigeminal ganglion. (C) Genetic tracing using Gli1-CreERT2/R26Confetti, induced at E11.5 and analyzed at E16.5 (left panel) and induced at E14.5 and analyzed at E17.5 (right panel) shows the contribution of Gli1-traced positive cells to the cartilaginous structures in the embryonic head. (D) Quantification of the contribution of Gli1-traced positive cells to the cartilage. (A–C) 20 µm cryosections were used for the IHC staining and analysis. A confocal microscope has been used for imaging.
Figure 5—figure supplement 1
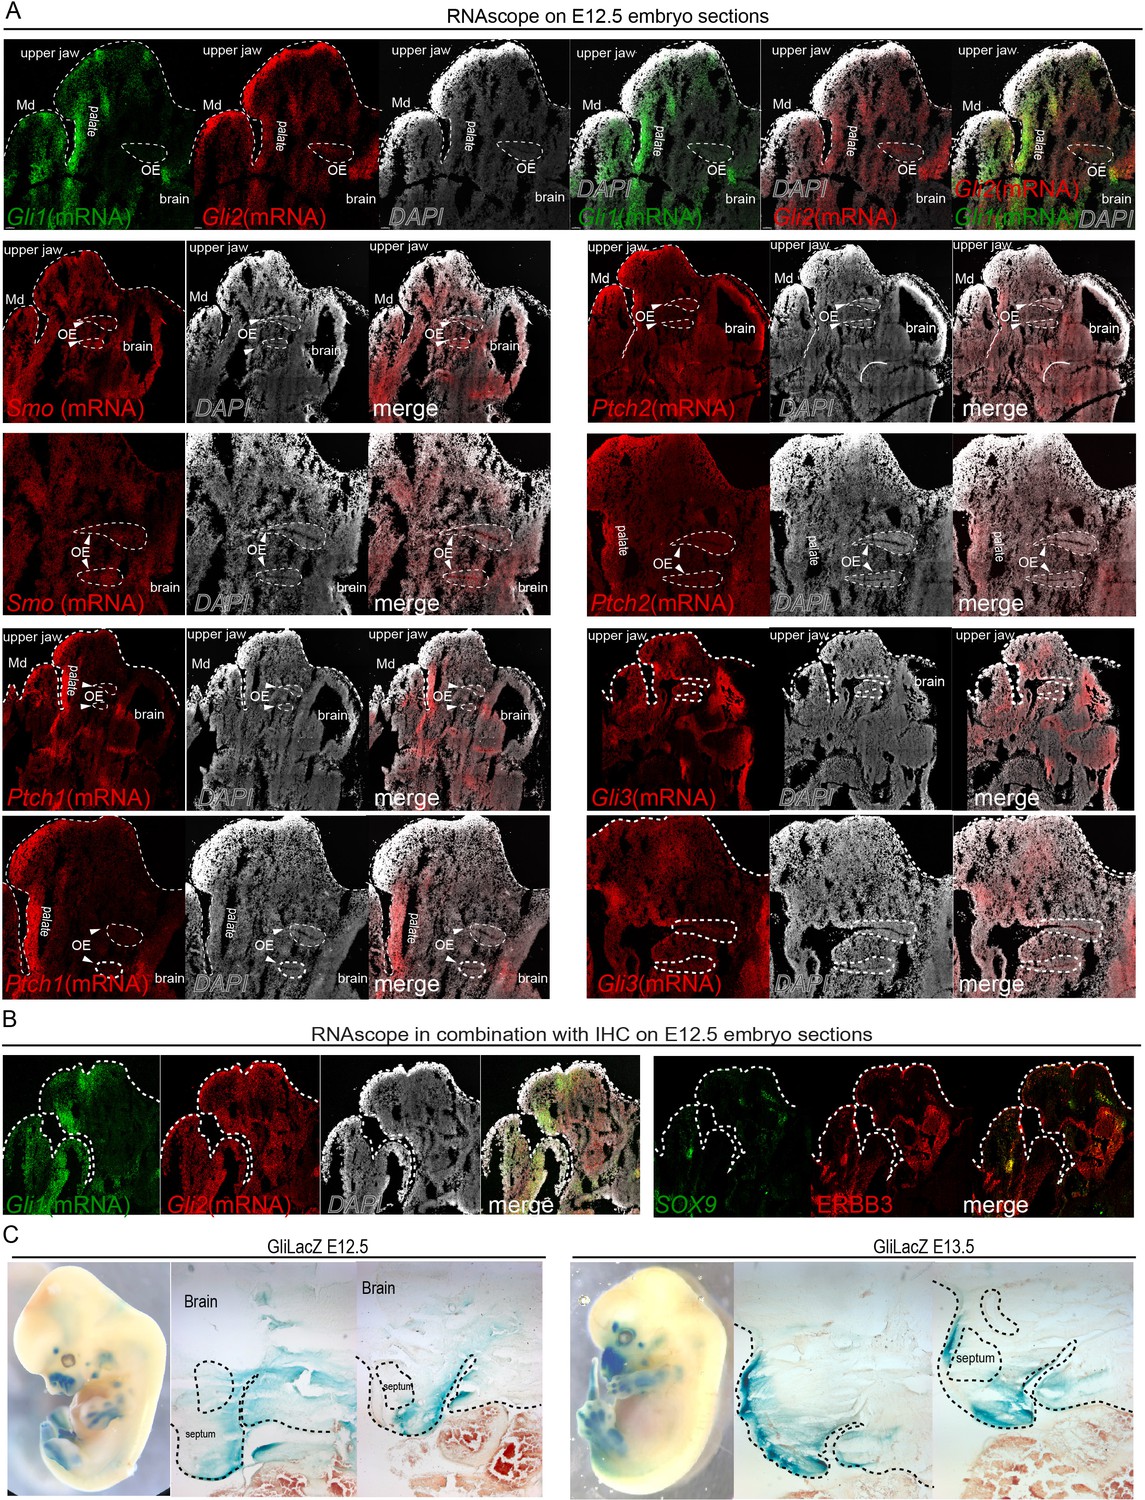
Mapping of the presence of major SHH signaling components in the E12.5 embryo.
(A) Mapping of the presence of mRNA for Gli1, Gli2, Gli3, Smoothened (Smo), Patched1 (Ptch1), Patched2 (Ptch2) on the sagittal sections of embryonic E12.5 heads using RNA-Scope method. For better visualization, the major structures are outlined by dotted lines. OE-olfactory epithelium, upper jaw, Md-mandible. (B) RNA-Scope mapping of Gli1, Gli2 with subsequent immunohistological analysis of the positions of mesenchymal condensations and other relevant structures stained for SOX9 and ERBB3 on the same slides. (C) X-gal staining for revealing expression of Gli1-LacZ in E12.5 and E13.5 embryos, whole mount and on cryosections. Areas of interest are outlined by dotted lines (e.g. septum). (A–B) 8 µm thick cryosections were used and scanned with a confocal microscope (C) 25 µm thick cryosections were used and imaged with a phase contrast microscope.
Figure 6 with 3 supplements
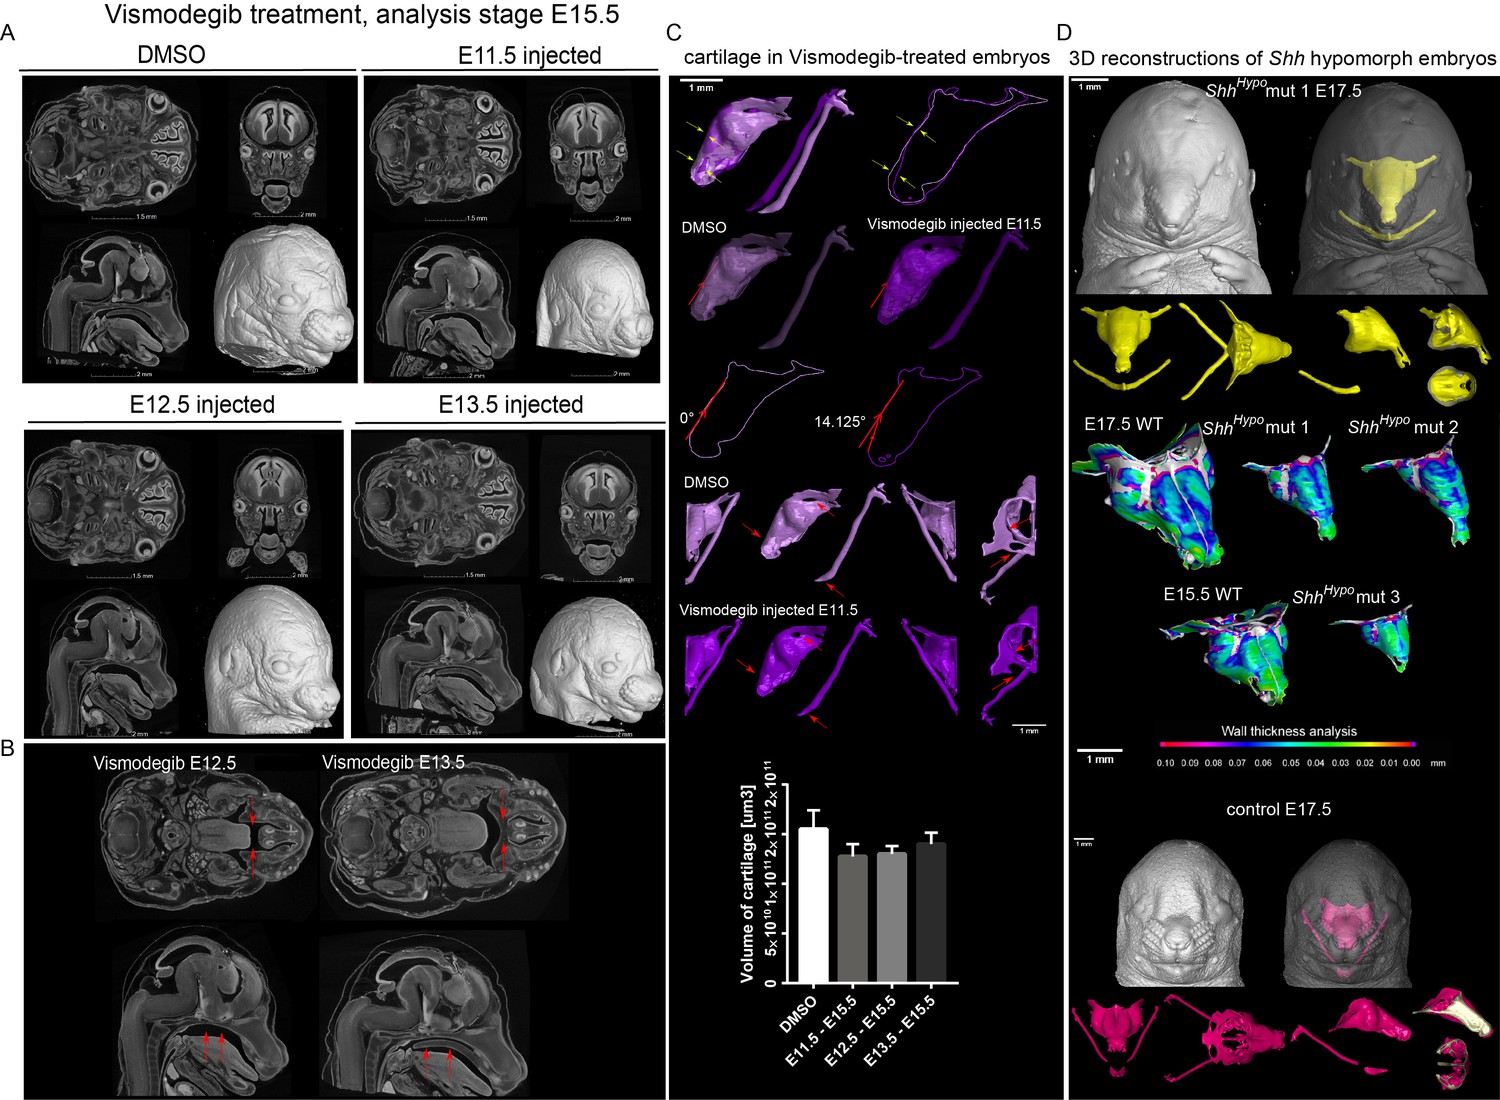
Effect of Vismodegib treatment on the size and structure of nasal cartilage.
(A) Panel shows raw CT data, cross-sections from various planes from DMSO (control treatment), Vismodegib inhibitor administered at E11.5, E12.5 or E13.5, all analyzed at E15.5 (B) Raw CT cross-sections show absent/disrupted cartilaginous structures in Vismodegib-treated embryos (C) 3D reconstruction and comparison of inhibitor-treated (Vismodegib E11.5-E15.5) and control (DMSO-treated) embryos and their nasal capsules. Arrows point at differences in anatomy and overall geometry of the nasal capsule. Graph representation of overall cartilage change of inhibitor-treated embryos. Raw data are available in Figure 6—source data 1. (D) 3D-reconstruction of the nasal capsule of Shh hypomorph (analyzed at E15.5 and E17.5) including wall thickness analysis.
-
Figure 6—source data 1
Raw values of cartilage measurements corresponding to Graph in Figure 6C.
- https://doi.org/10.7554/eLife.34465.021
Figure 6—figure supplement 1
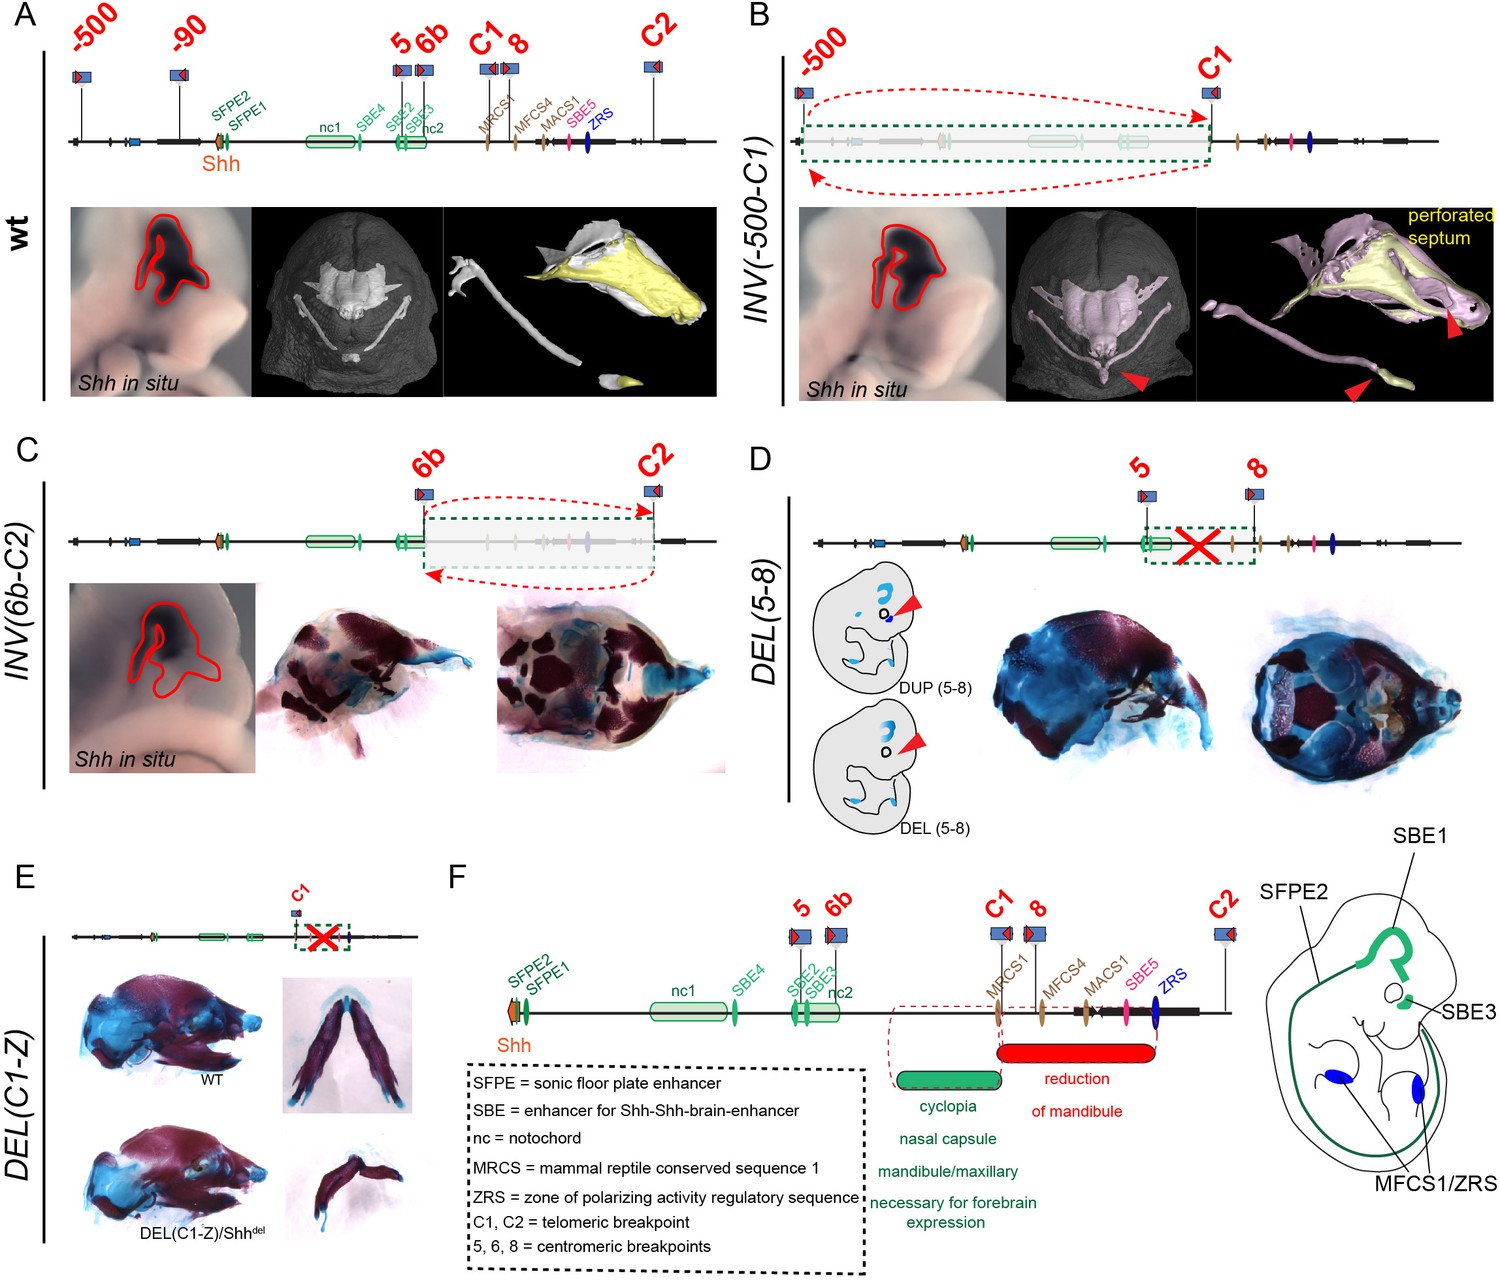
Mutations of various regulatory regions controlling expression of Shh, their positions and effect on chondrogenesis.
Schematic drawing of the genomic region of Shh including the main enhancers. Mutations points for Deletion or Inversion are indicated. (A) In situ staining for Shh shows the expression of Shh at E10.5 in the frontal brain region in wild type mice. (B) Homozygous INV(−500 C1) has very mild effect on the septum. In situ staining for Shh shows very similar expression compared to the wt (C-D) Homozygous INV(6b-C2) and homozygous DEL(5-8) results in a misshapen nasal capsule roof. In situ staining for Shh staining shows a diminished expression of Shh especially in the forebrain (E) Homozygous DEL(C1-Z) does not show any gross abnormalities in the nasal capsule cartilage. (F) Summary of the findings illustrated in a schematic drawing. All in situ data are close-up views of embryos shown in (Symmons et al., 2016).
Figure 6—figure supplement 2
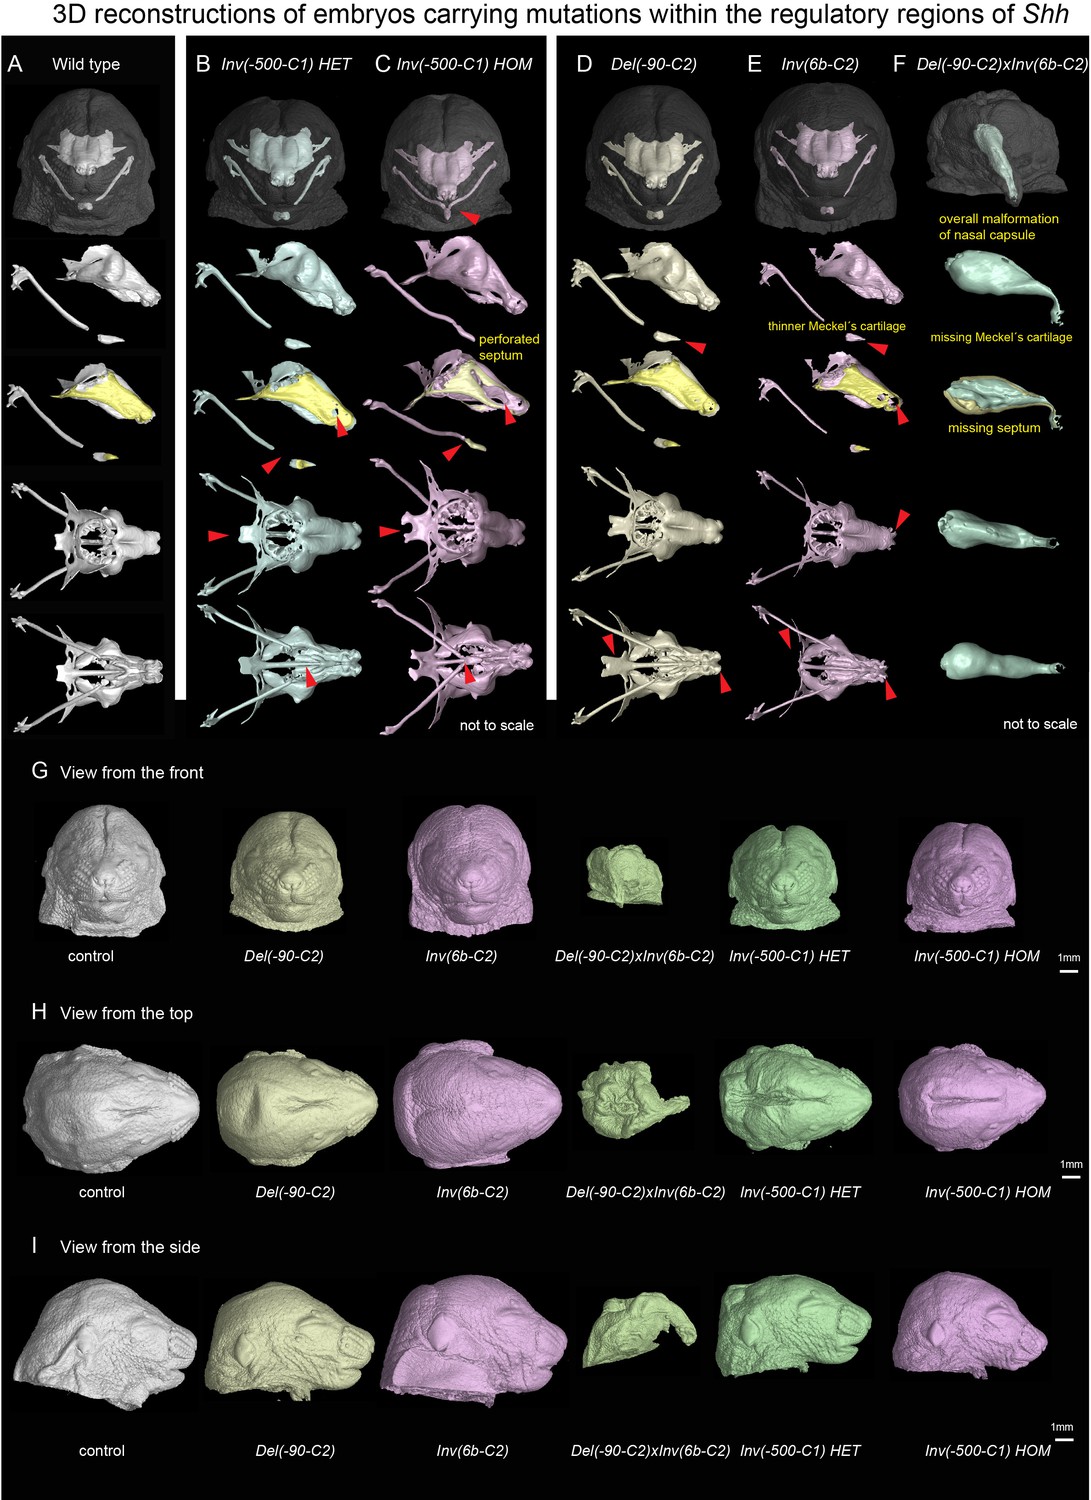
Mutated genomic regions containing regulatory sequences controlling expression of Shh show a variety of similar and dissimilar phenotypes.
(A–F) Control and mutated embryos with segmented nasal capsule, clipping plane at the level of midline to visualize septum, view from the top and from the bottom. (A) Wild-type E17.5 embryo. (B) INV(−500 C1) heterozygous embryos. (C) INV(−500 C1) homozygous embryo. (D) Heterozygous DEL(−90 C2) embryo. (E) Heterozygous INV(6b-C2) embryo. (F) DEL(−90 C2)xINV(6b-C2) embryo. Red arrows point at disrupted or missing landmarks. (G–I) Mutated genomic regions containing Shh regulatory regions and the overall appearance of the head. The view from the front (G), from the top (H) and from the side (I) of mutated enhancers and adequate controls.
Figure 6—figure supplement 3
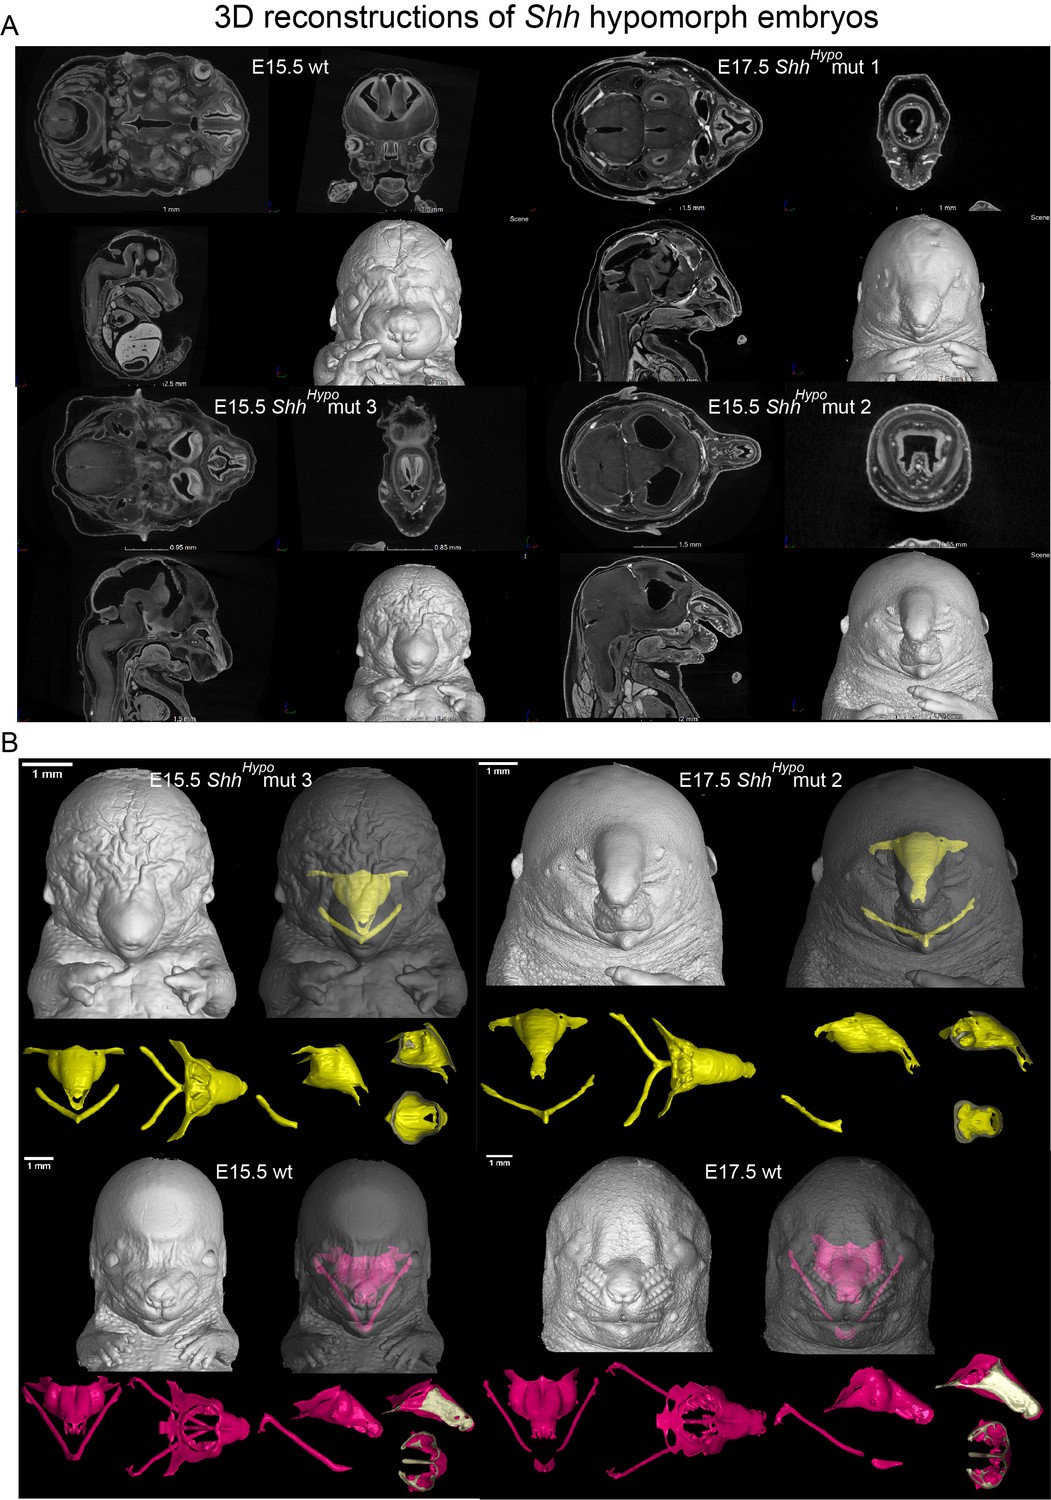
The effect of reduced SHH signaling on chondrogenesis at E15.5 and E17.5.
(A) Tomographic cross-sections of raw CT data and 3D models embryonic heads obtained from micro-CT scans of several ShhHypo embryos at E15.5 and E17.5. (Genotypes: Shh-GFP/Shh-GFP, +/+ at E15.5; Shh-GFP/Shh-GFP, GBS-GFP/+ at E17.5). (B) 3D models of nasal capsules and Meckel cartilages of Shh hypomorphs at E15.5 and E17.5.
Figure 7
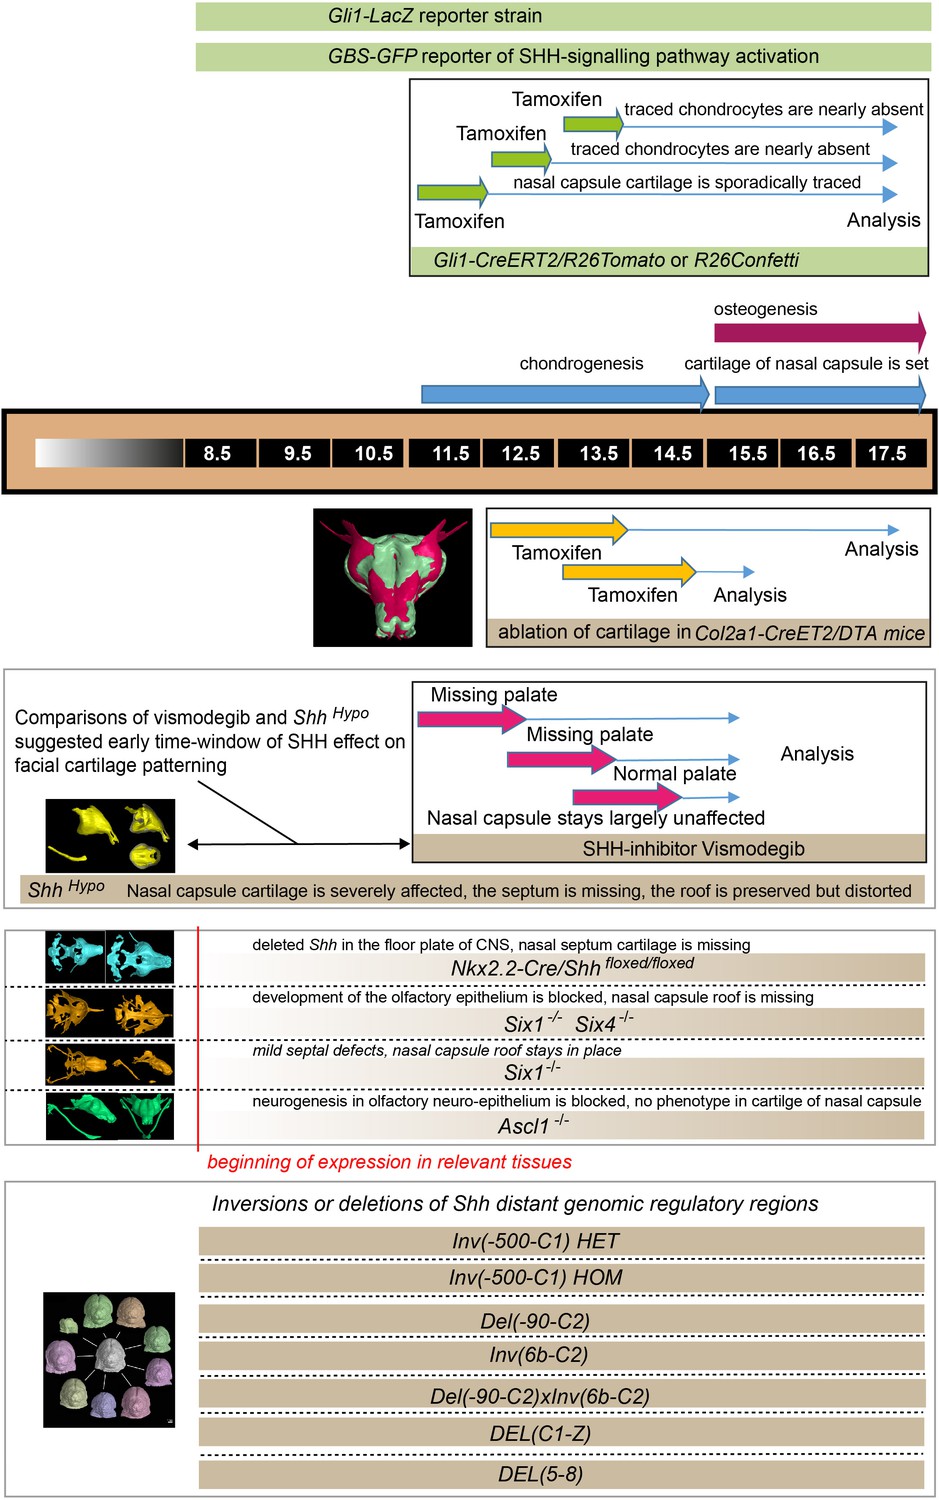
llustration depicting the timeline of all experiments and the beginning of effects.
The results of all genetic perturbations and treatments with drugs as well as their comparative phenotypes are summarized.
Tables
Key resources table
| Reagent type species or resource | Designation | Source or reference | Identifiers | Additional information |
|---|---|---|---|---|
| Strain | Col2a1-CreERT2 | Nakamura et al. (2006) | Received from S. Mackem | |
| Strain | R26Confetti | https://www.jax.org/strain/013731 | Received from H. Clevers | |
| Strain | R26DTA | Voehringer et al. (2008) | Received from Jackson | |
| Strain | Six1 KO | Grifone et al. (2005) | Received from P. Maire | |
| Strain | Six1/4 double KO | Grifone et al. (2005) | Received from P. Maire | |
| Strain | Nkx2.2-Cre/Shhflx/flx | Yu et al., 2013 | Received from M. Matise | |
| Strain | Ascl1 (Mash1) | Cau et al. (1997) | Received from U. Marklund | |
| Strain | B6.Cg-Shhtm1EGFP/creCjt/J | Harfe et al. (2004) | Received from M. Hovorakova | |
| Strain | Gli1-CreERT2 | https://www.jax.org/strain/007913 | Received from M.Kasper | |
| Strain | Gli1-lacZ | https://www.jax.org/strain/008211 | Received from M.Kasper | |
| Strain | Shh-GFP | https://www.jax.org/strain/008466 (Chamberlain et al., 2008) | Received from Jackson | |
| Strain | TgGBS-GFP | Balaskas et al. (2012) | Received from A. Kicheva | |
| Strain | Rosa-CAG-LSL-tdTomato -WPRE | https://www.jax.org/strain/007914 | Received from M. Kasper | |
| Strain | INV-500-C1 | F. Spitz (Symmons et al., 2016) | Received from F. Spitz | |
| Strain | INV6b-C2 | F. Spitz (Symmons et al., 2016) | Received from F. Spitz | |
| Strain | Del-90-C2 | F. Spitz (Symmons et al., 2016) | Received from F. Spitz | |
| Strain | DELC1-Z | F. Spitz (Symmons et al., 2016) | Received from F. Spitz | |
| Strain | DEL5-8 | F. Spitz (Symmons et al., 2016) | Received from F. Spitz | |
| Antibody | SOX9 | Sigma Aldrich, HPA001758 | one to 1000 in PBS-T over night at RT | |
| Antibody | ERBB3 | RnD Systems, AF4518 | one to 500 in PBS-T over night at RT | |
| Drug | Vismodegib | LoRusso et al. (2011) | 0.1 mg/kg | |
| Software | IMARIS | http://www.bitplane.com/ | ||
| Software | GOM Inspect | https://www.gom.com/de/3d- software/gom-inspect.html | ||
| Software | VGStudio Max | https://www.volumegraphics.com /en/products/vgstudio-max.html | ||
| RNAscope probes | Gli1 (311001), Gli2 (405771), Gli3 (445511), Smo (318411), Ptch1 (402811) and Ptch2 (435131) | https://acdbio.com/rnascope%C2% AE-technology-novel-rna-situ- hybridization-research-platform |
Additional files
-
Transparent reporting form
- https://doi.org/10.7554/eLife.34465.023
Download links
A two-part list of links to download the article, or parts of the article, in various formats.
Downloads (link to download the article as PDF)
Open citations (links to open the citations from this article in various online reference manager services)
Cite this article (links to download the citations from this article in formats compatible with various reference manager tools)
Signals from the brain and olfactory epithelium control shaping of the mammalian nasal capsule cartilage
eLife 7:e34465.
https://doi.org/10.7554/eLife.34465


