Decoupling from yolk sac is required for extraembryonic tissue spreading in the scuttle fly Megaselia abdita
- Centre for Organismal Studies Heidelberg, Germany
- European Molecular Biology Laboratory, Germany
- Heidelberg University, Germany
Figures
Figure 1 with 1 supplement
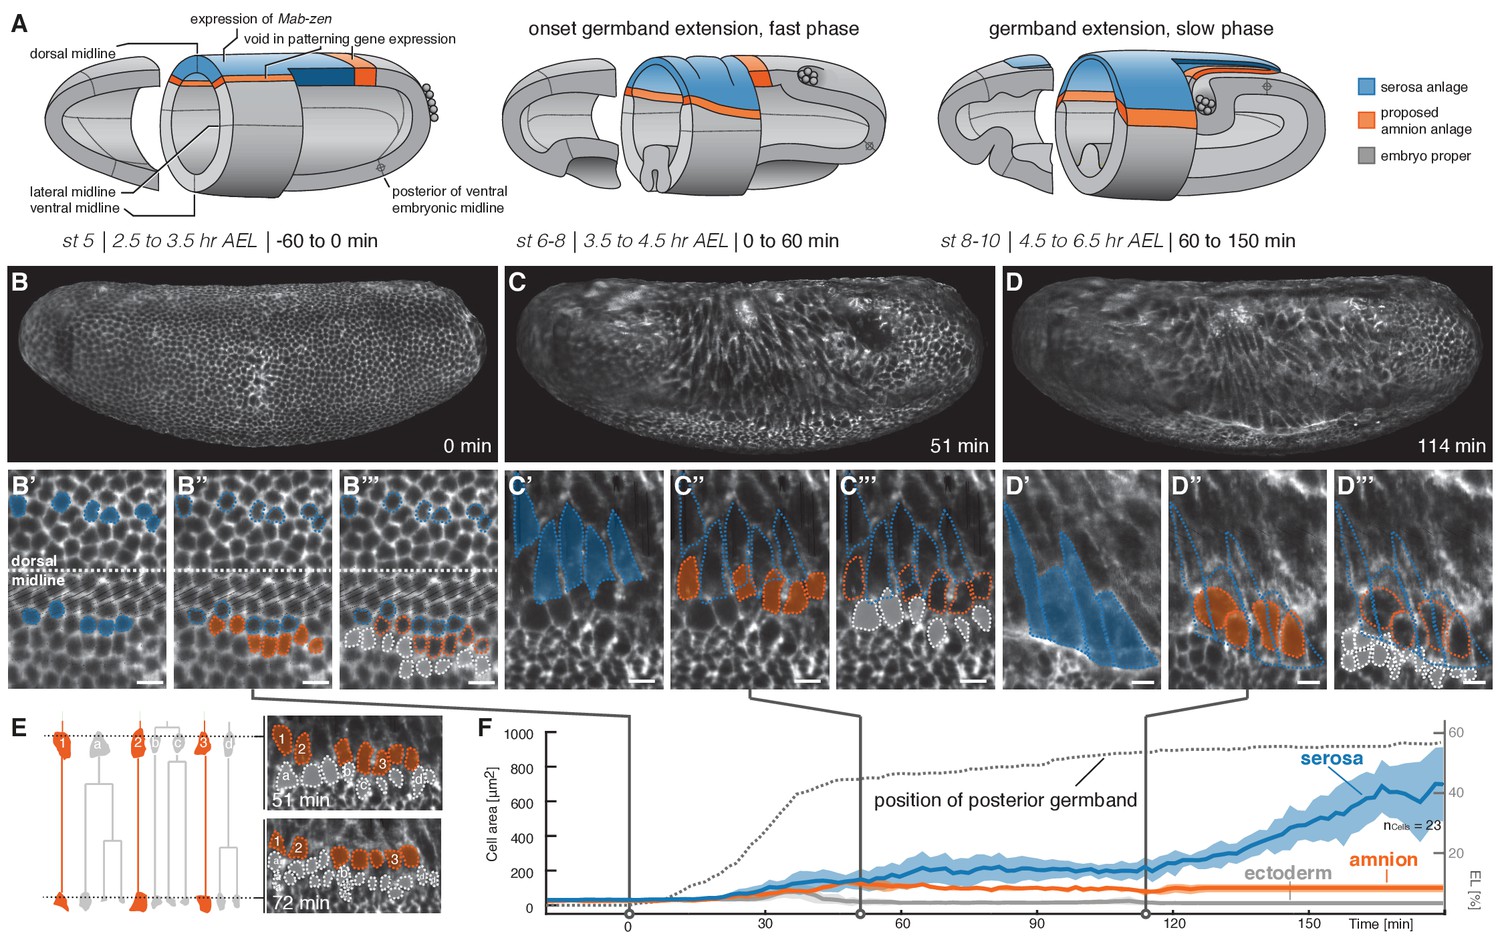
Tracking of blastoderm cells characterizes serosa and amnion differentiation.
(A) Model of early extraembryonic tissue development in M. abdita based on marker gene expression in fixed specimen. Stage (st) and time after egg lay (AEL) are defined as in (Wotton et al., 2014); absolute time given in minutes relative to the onset of germband extension (onset GBE = 0 min). (B–D’’’) Global embryonic views of SPIM recorded embryos at corresponding stages (B–D), with tracked and marked serosa (blue), amnion (orange), and ectoderm cells (grey) in 2D-projections of indicated surface areas in dorsal (B’–B’’’) and lateral views (C’–C’’’, D’–D’’’). Cells of serosa were identified based on their ability to spread over the embryo and then tracked back to the cellular blastoderm. (E) Cell lineage and divisions in putative amnion and ectoderm cells. Cells directly adjacent to the serosa never divided and could be back-tracked to a single row of cells next to the serosa anlage; these cells were classified as presumptive amnion. Cells further distal to the serosa divided, eventually decreased in cell size, and were classified as presumptive ectoderm. (F) Quantitative analysis of cell size of tracked serosa, amnion, and ectodermal cells relative to GBE as measure of developmental progression. The position of the posterior germband is indicated in % egg length (0% EL = posterior pole; dotted line); Standard error of mean shown as shades. Unless indicated otherwise, embryos and close-ups are shown with anterior left and dorsal up. Scale bars, 10 µm.
Figure 1—figure supplement 1
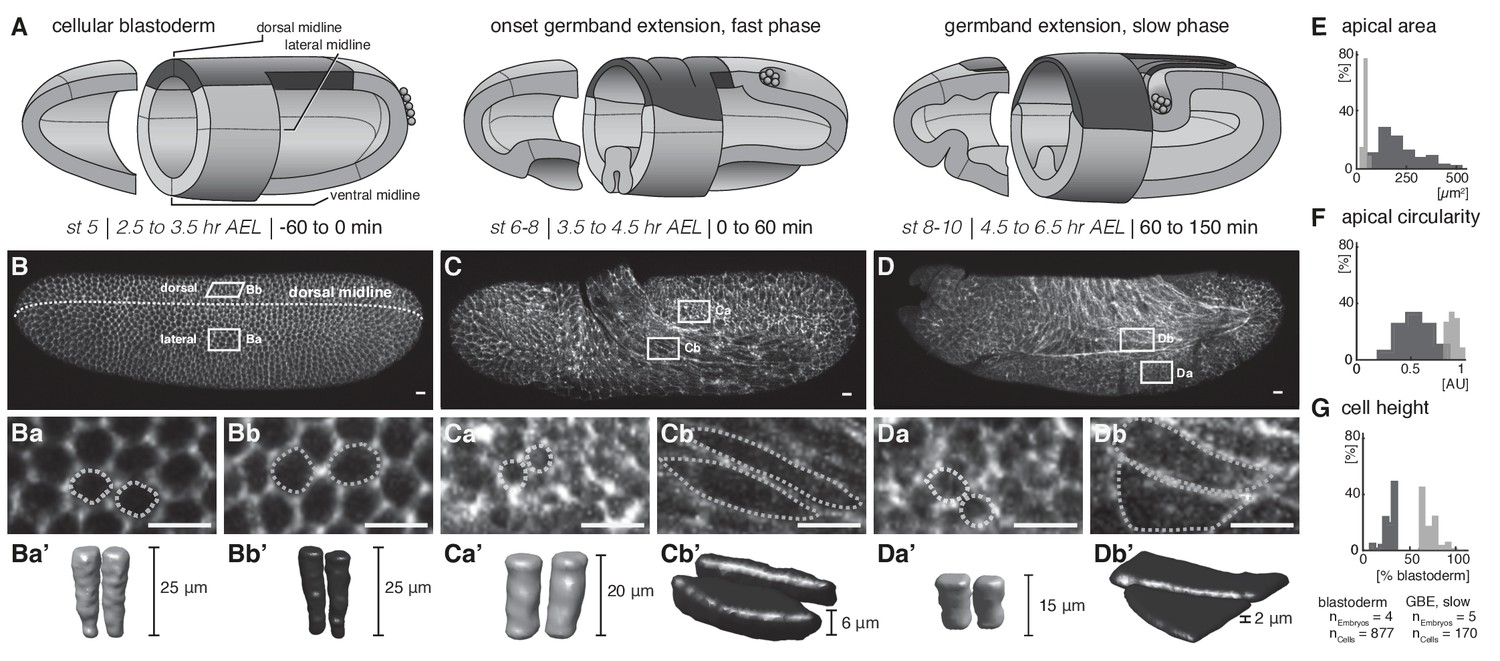
Quantitative analyses of cell measures in M.abdita embryos fixed at subsequent stages of development.
(A) Model of early extraembryonic development in M. abdita without distinction of amnion and serosa (extraembryonic tissue labeled in black). (B–Db’) Global embryonic view of fixed embryos stained for Phallacidin to outline actin cytoskeleton (B–D), with close-up views (Ba-Db) and three dimensional volume renderings (Ba’-Db’) of embryonic (Ba-a’, Ca-a’, Da-a’) and extraembryonic cells (Bb-b’, Cb-b’, Db-b’). (E–G) Collective quantitative analysis of apical cell area (E), apical cell circularity (F) and relative cell height (G). Apical circularity (c) was defined as c = 1 for a perfect circle and c < 1 for angular shapes with c = 4 π area/perimeter2 (Thomas and Wieschaus, 2004). Unless indicated otherwise, embryos and close-ups are shown with anterior left and dorsal up. Presumptive embryonic cells and corresponding quantifications are shaded grey, presumptive extraembryonic cells and corresponding quantification are in black. Scale bars, 10 µm.
Figure 2 with 3 supplements
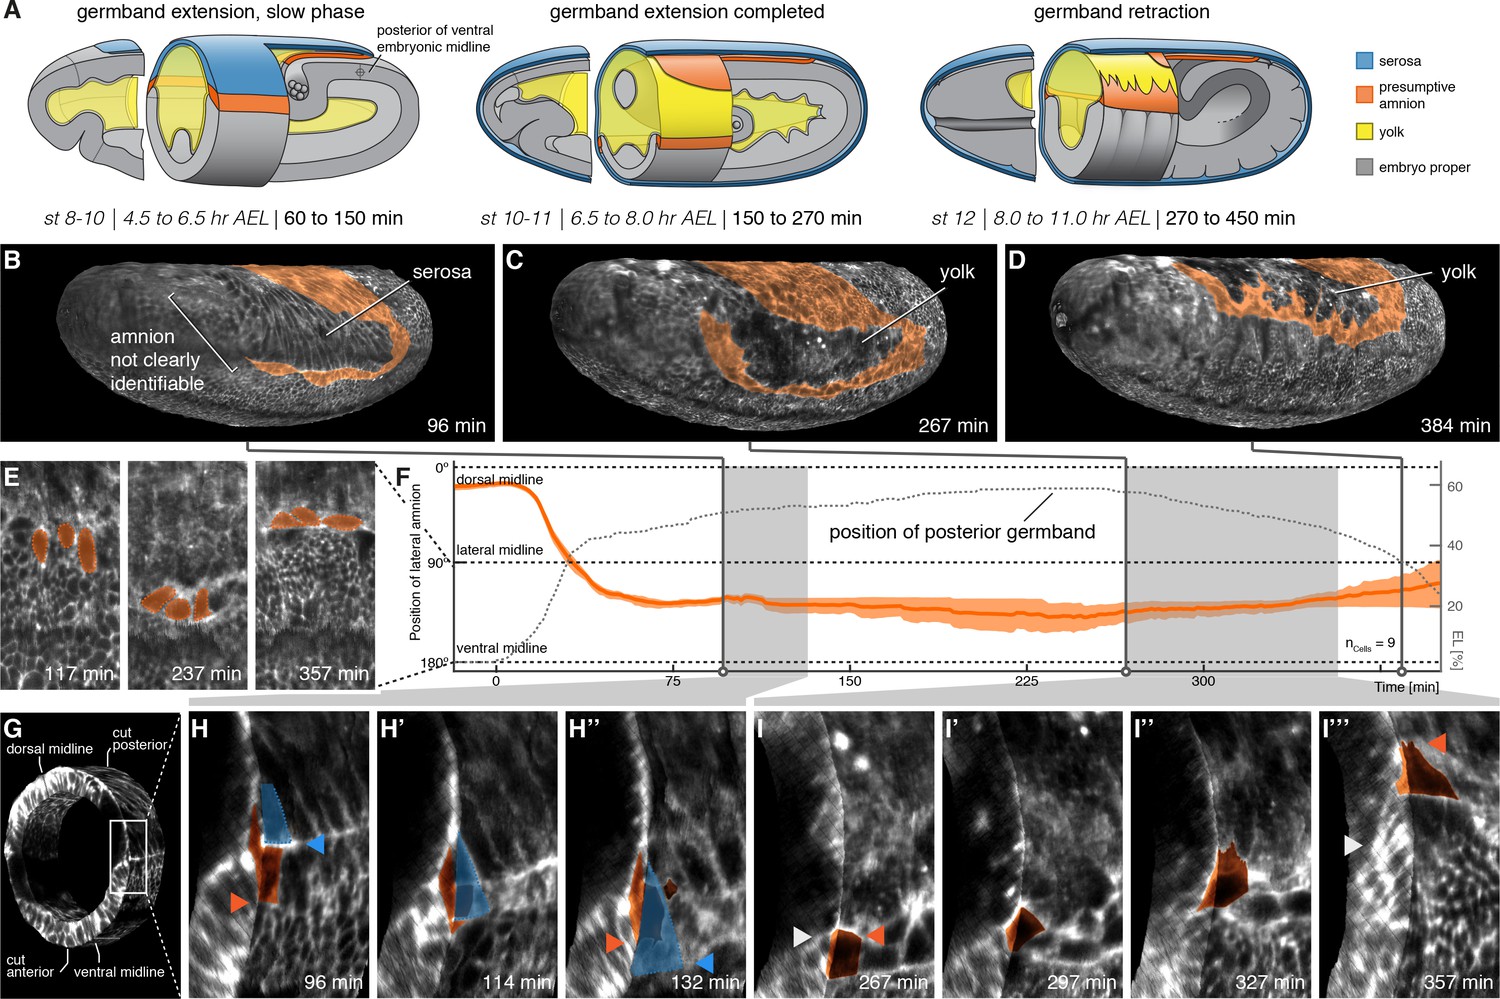
The lateral anlage of the M. abdita putative amnion differentiates into a one-to-two cell wide lateral epithelium.
(A) Model of extraembryonic tissue development in M. abdita based on SPIM time-lapse recordings; staging as in Figure 1. (B–D) Global embryonic views of SPIM recorded embryos at corresponding stages. To reveal and mark the putative amnion, the surface layer has been digitally removed (Figure 2—figure supplement 1). (E,F) Tracking (E) and plotting (F) of amnion cell position (orange) along the dorso-ventral circumference (0° corresponds to dorsal, 180° to ventral midline) relative to position of extending germband as measure of developmental progression (dotted line, 0% egg length (EL) at the posterior pole), standard error of mean shown as shades. (G–I’’’) Donut section of SPIM recorded image volume (G) to illustrate close-up views of amnion cell behavior as the serosa (blue) detaches during germband extension (H) and after onset of germband retraction (I). As the serosa spreads over the amnion (H–H’’), the amnion appears to bend underneath the serosa. The serosa then separates from the amnion and spreads over the embryo proper. During germband retraction (I–I’’’), the amnion starts to extend actin-rich protrusions and leads the ectoderm as the tissue progresses towards the dorsal midline. Triangles indicate relative positions of amnion, serosa, and ectoderm in first and last time points (amnion = orange, serosa = blue, and embryonic cells = grey). Embryos are shown with anterior left and dorsal up.
Figure 2—figure supplement 1
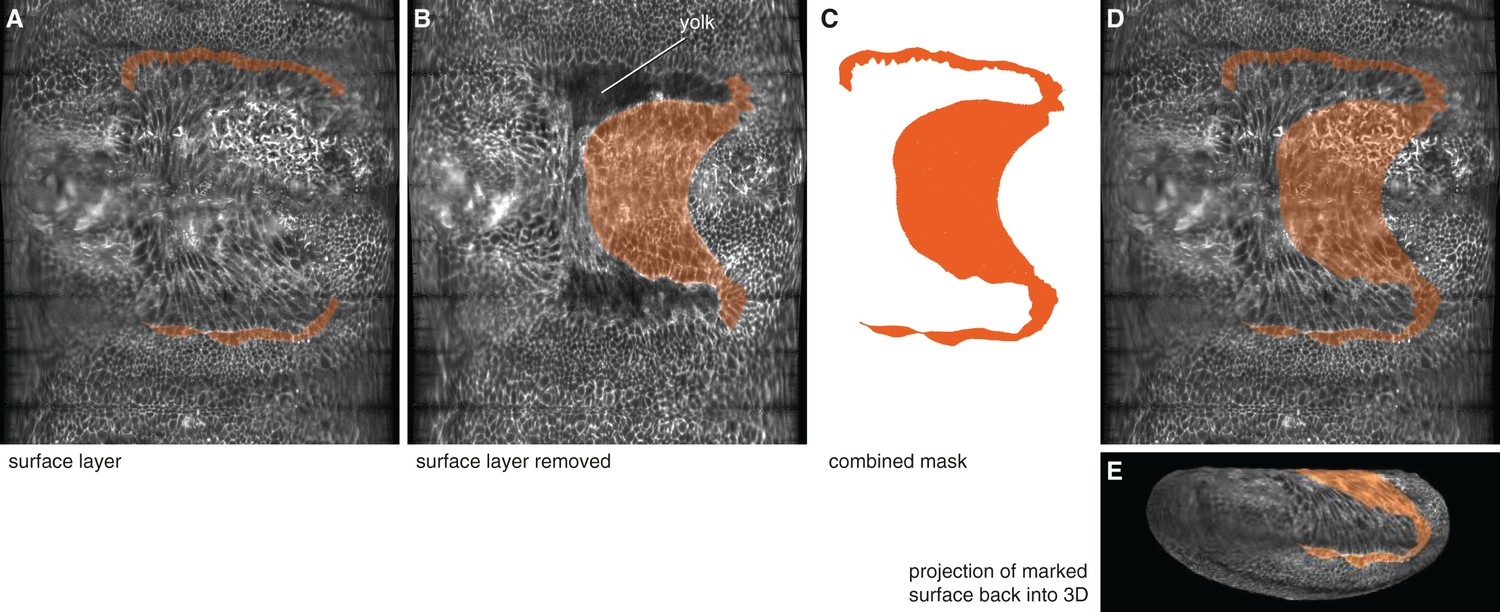
Computational removal of embryo surface layers was used to reveal and mark putative amnion cells underneath the serosa.
(A) Lateral amnion cells (one-to-two cells wide) were marked on the surface layer on an unrolled embryo (see Materials and methods). (B) The ventral amnion was marked on the underlying layer after computationally removing of the surface layer. (C) Both masks were subsequently combined. (D,E) The combined mask was then mapped back onto the surface layer of the unrolled embryo (D), and the projection of the marked surface was mapped back into 3D (E).
Figure 2—video 1
The video corresponds to panels H-H’’ of Figure 2.
M. abdita serosa folds over the putative adjacent amnion and then separates from it, as visualized in a SPIM time-lapse recording using Lifeact-mCherry as fluorescent actin reporter. Upper panel: ‘3D donut’ cut (as indicated in Figure 2G); lower panel: corresponding 2D projection of surface view. Optical section (white line) and enrichment of actin reporter at serosa leading edge (in between yellow line) are indicated in the first frame. As the serosa is expanding over the putative amnion (117–135 min), the amnion appears to bend underneath the serosa. Starting from this local fold-over, the serosa then separates from the adjacent tissue in a bi-directional manner and continues to spread over the embryo proper. Time is relative to onset of gastrulation (0 min).
Figure 2—video 2
The video corresponds to panels I-I’’’ of Figure 2.
The M. abdita amnion remains lateral throughout germband extension and starts to progress towards the dorsal midline after onset of germband retraction, as visualized in a SPIM time-lapse recording using Lifeact-mCherry as fluorescent actin reporter. Upper panel: ‘3D donut’ cut (as indicated in Figure 2G); lower panel: corresponding 2D projection of surface view. Optical section (white line) and putative amnion (in between orange line) are indicated in the first frame. As the germband retracts, actin protrusions are formed by the putative amnion cells (339–355 min). Time is relative to onset of gastrulation (0 min).
Figure 3 with 3 supplements
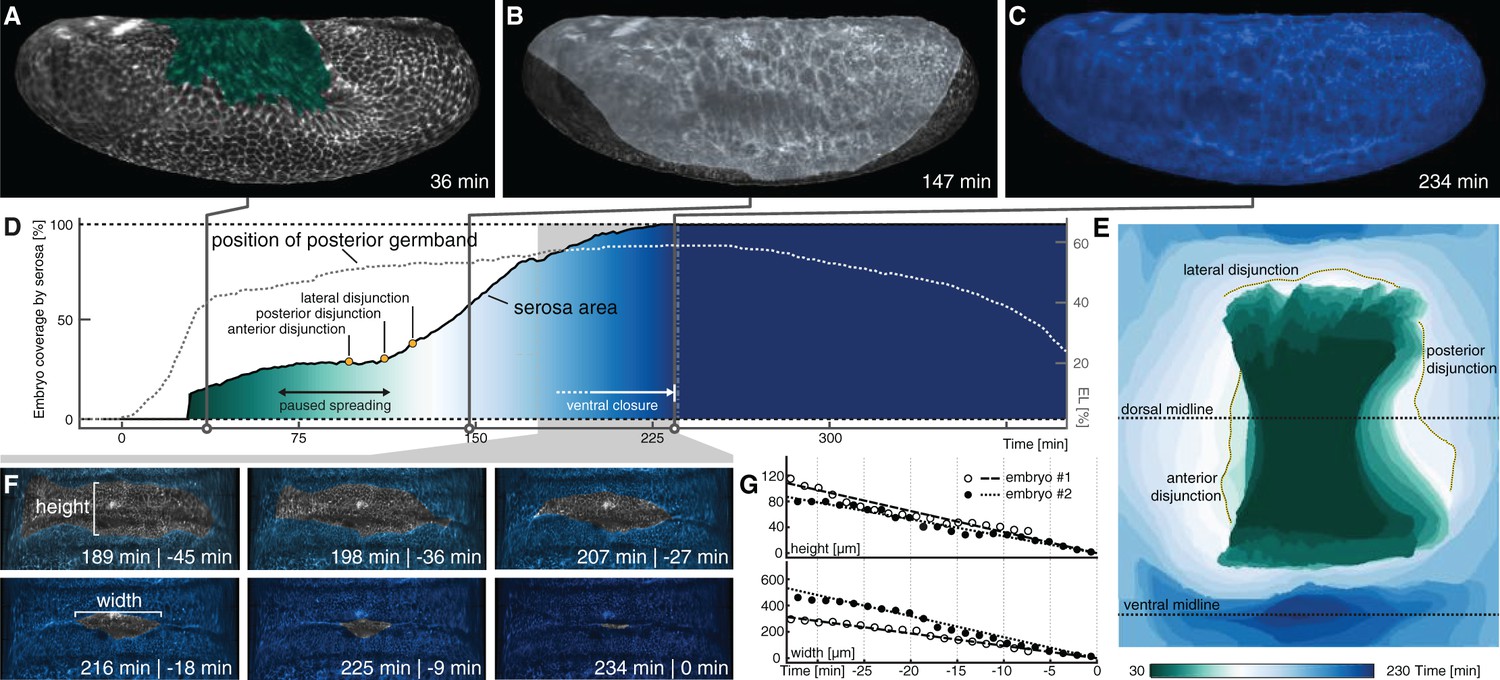
Serosa expansion in M. abdita is characterized by two distinct phases that are separated by a pause in tissue spreading.
(A–C) Onset (A), passing of poles (B), and ventral closure (C) of marked serosa illustrate previously described stages of expansion (Wotton et al., 2014). (D,E) Plotting of serosa area over time and relative to position of extending germband (D) indicates two additional stages of serosa expansion, that is a pause in spreading and the subsequent disjunction, first at the anterior, then posterior, and finally lateral circumference (E). Time is indicated in colormap. (F,G) Progression of ventral closure indicated in projections of ventral embryo surfaces (0 = ventral closure) (F) and quantified as linear decrease in height and width of serosal window (G).
Figure 3—figure supplement 1
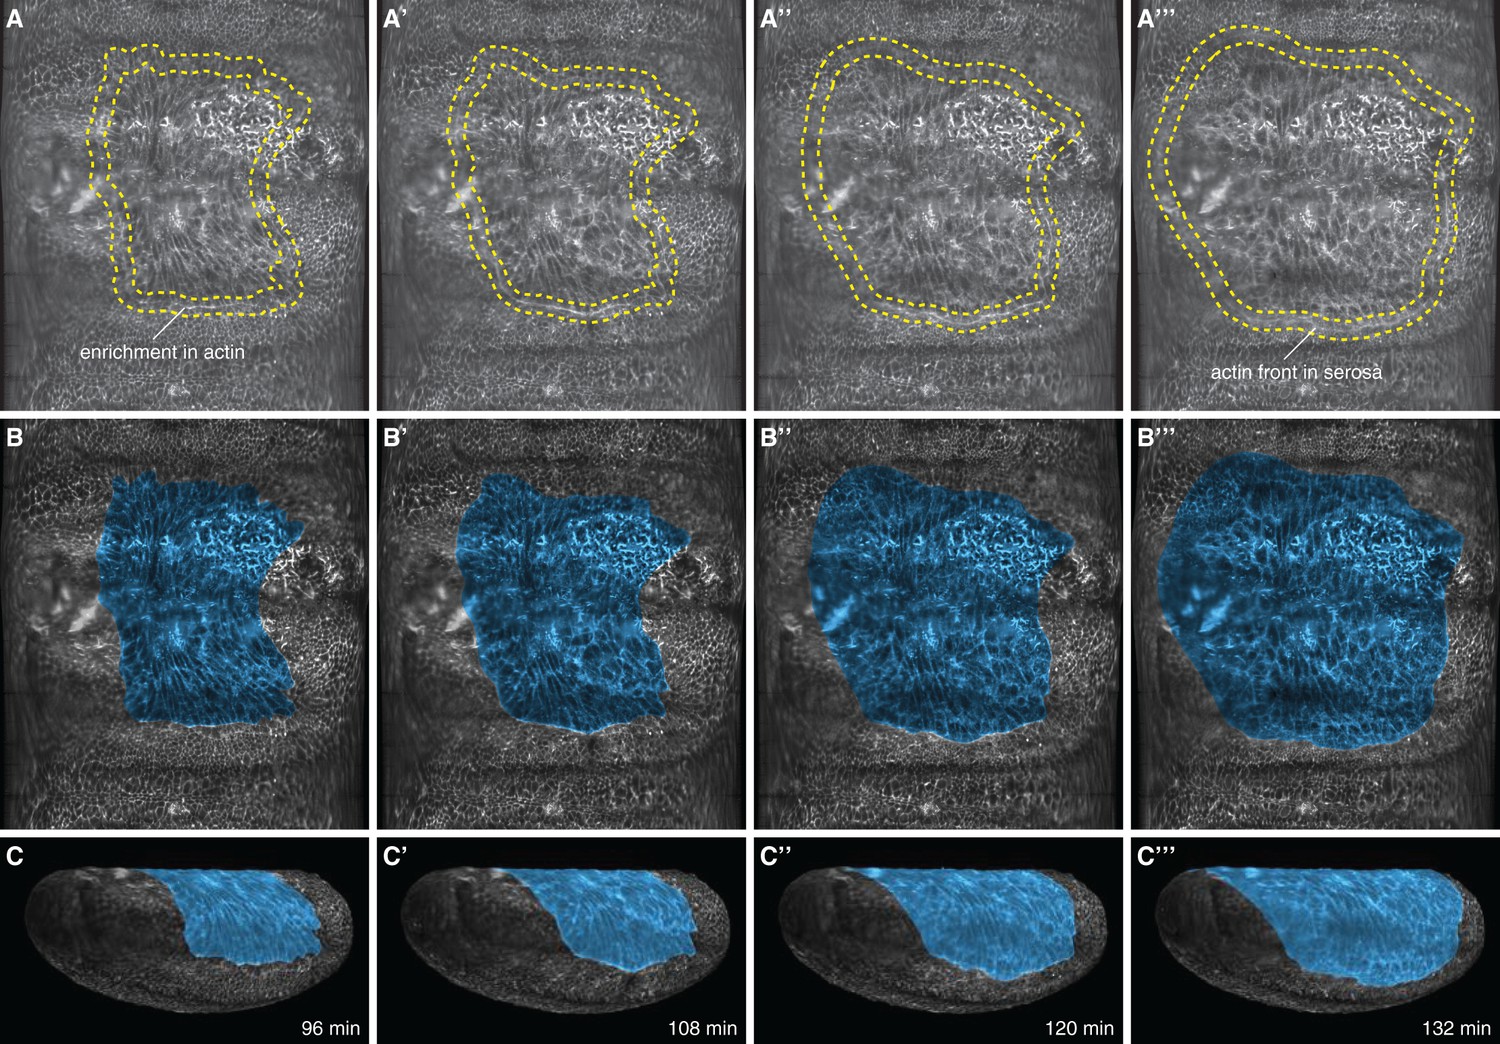
Cell tracks, cell shape, and enrichment of the Lifeact reporter at the serosa periphery were used as landmarks to mark the amnion.
(A,B) Marked outline (A–A’’’) and tinted area (B–B’’’) of serosa in 2D projected embryo surfaces. (C–C’’’) Projection of the marked surfaces into 3D renderings. Serosa disjunction was determined kinematically by visually following F-actin enrichment between serosa and amnion. As the actin cable moved towards the ventral side of the egg and continued migrating in front of the large serosa cells, the smaller cells of the presumptive amnion stopped moving. This process was best resolved by repeatedly playing recordings forward and backwards in time.
Figure 3—video 1
The video corresponds to panels A-C of Figure 3.
M. abdita serosa spreading is a discontinuous process that is interrupted by a pause in tissue expansion, as visualized in SPIM time-lapse recording using Lifeact-mCherry as fluorescent actin reporter. Following manual marking of the serosa in 2D projections of the embryo surface (blue), surface and markings were projected back as 3D point cloud in lateral view (Figure 3—figure supplement 1). Serosa area was defined based on cell shape, cell tracking, and enrichment of the actin reporter in the periphery of the serosa. After onset of serosa spreading (30 min), a pause in area expansion becomes notable (60–110 min), while ventral closure is barely visible in the lateral view (190–236 min). Time is relative to onset of gastrulation (0 min).
Figure 3—video 2
The video corresponds to a ventral view of panels A-C of Figure 3.
Ventral view of time-lapse recording and 3D projection as in movie #3. After passing of the poles (147 min), ventral closure can be clearly followed in the lateral view (190–236 min). Time is relative to onset of gastrulation (0 min).
Figure 4 with 3 supplements
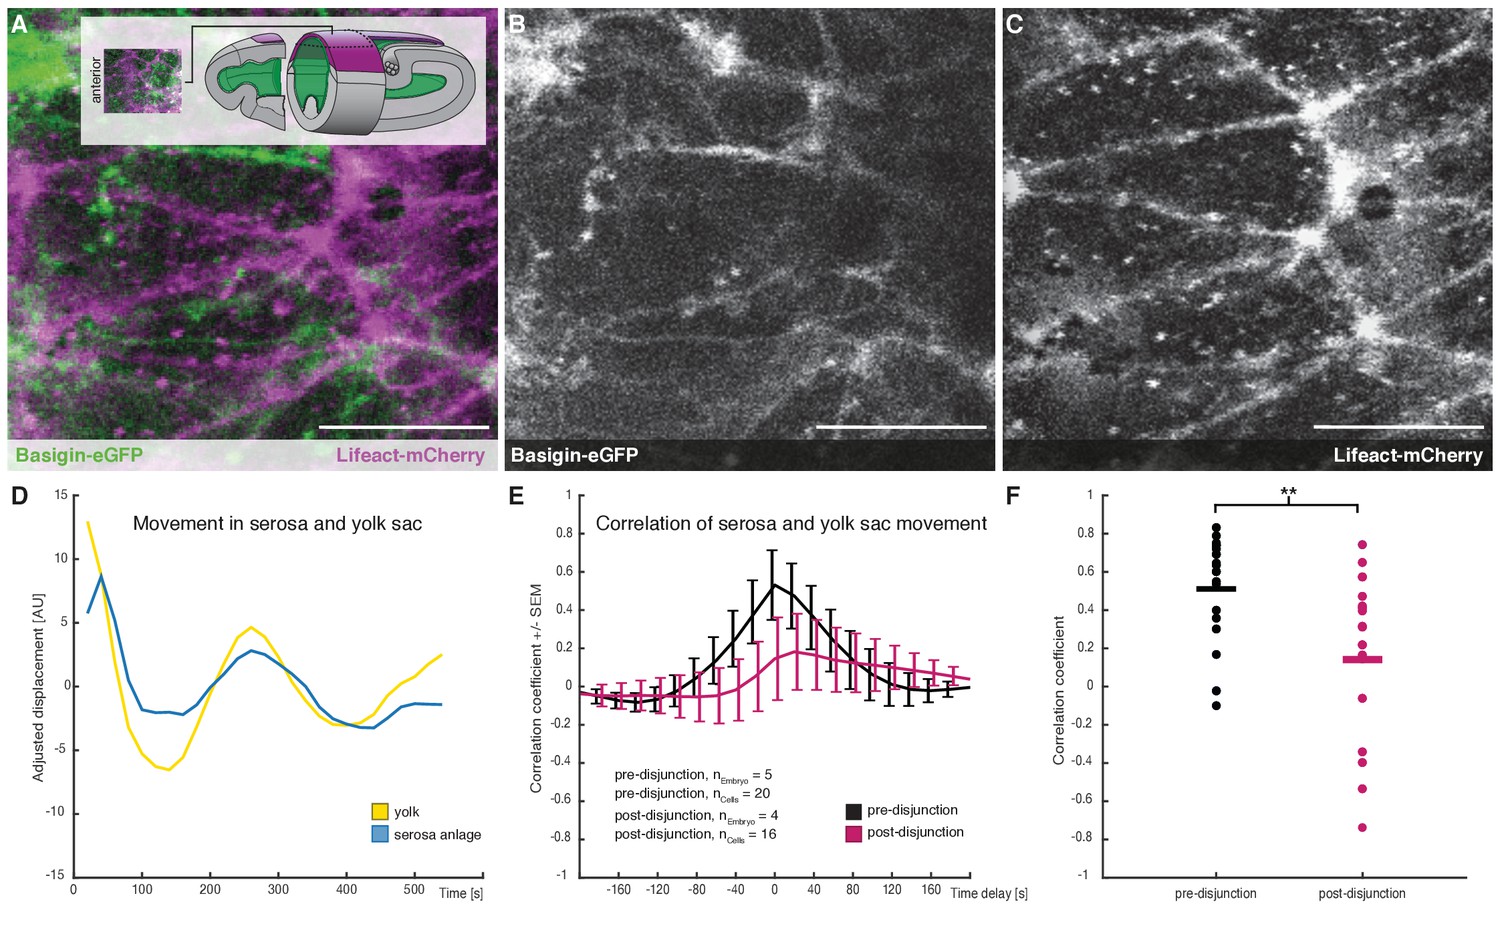
Cross-correlation of serosa cells and yolk sac movements suggest a decoupling of serosa prior to free spreading.
(A–C) Representative sample images of serosa (visualized with Lifeact-mCherry) and underlying yolk sac (expressing Basigin-eGFP) are shown in average-intensity projections. Images are stills from time lapse-recordings taken along the dorsal midline and anterior of the extending germband, where serosa and yolk sac were in direct contact (schematic illustration provided in inset). (D) Adjusted serosa (blue) and yolk sac (yellow) displacement measured by optical flow analysis exemplary for one serosa cell and corresponding substrate area underneath. (E) Average cross-correlation function of cells and substrate movements indicate coupling before (black) and decoupling after (magenta) serosa disjunction of the serosa from the embryo proper. Standard error of mean shown as bars. (F) Collective comparison of correlation coefficients for individual cells before and after serosa disjunction, bar indicates the mean. **p=0.00686 based on Student's t-test. Anterior is to the left. Scale bars, 20 µm.
Figure 4—figure supplement 1
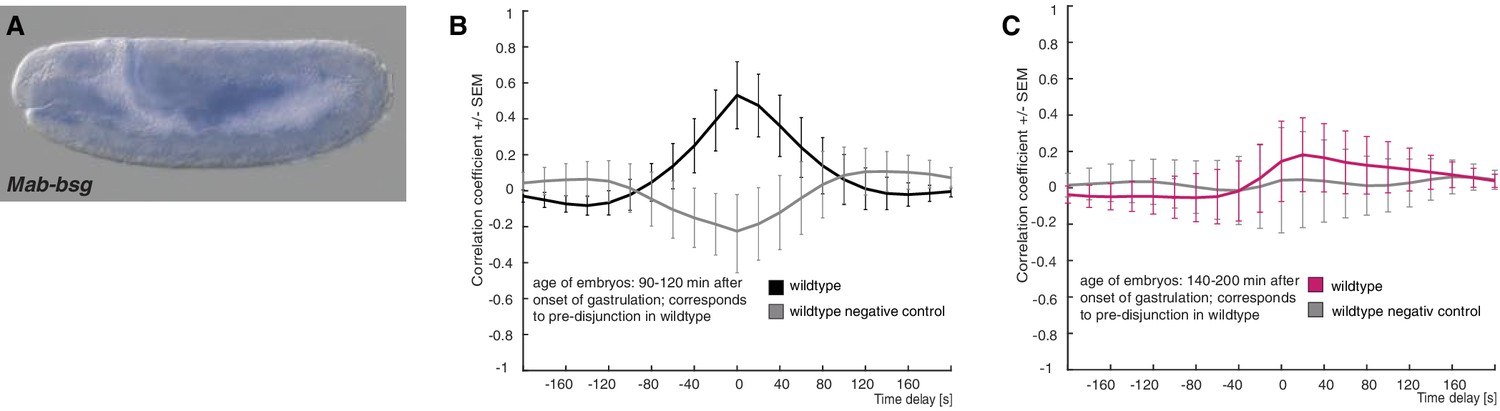
Expression of M. abdita basigin (Mab-bsg) and controls for cross correlation analysis in wildtype embryos.
(A) During germband extension stage, staining of a Mab-bsg probe was detected in the yolk sac. Yolk sac staining of the Mab-bsg probe has been observed consistently in all of over 40 embryos analyzed at this stage. (B,C) Average cross-correlation function of corresponding cells and substrate movements in wildtype embryos as shown in Figure 4 for pre-disjunction (B), black) and post-disjunction (C), magenta); negative controls obtained by random pairings of cell and substrate movements from the same embryo revealed no detectable correlation (grey). Standard error of mean shown as bars.
Figure 4—figure supplement 2
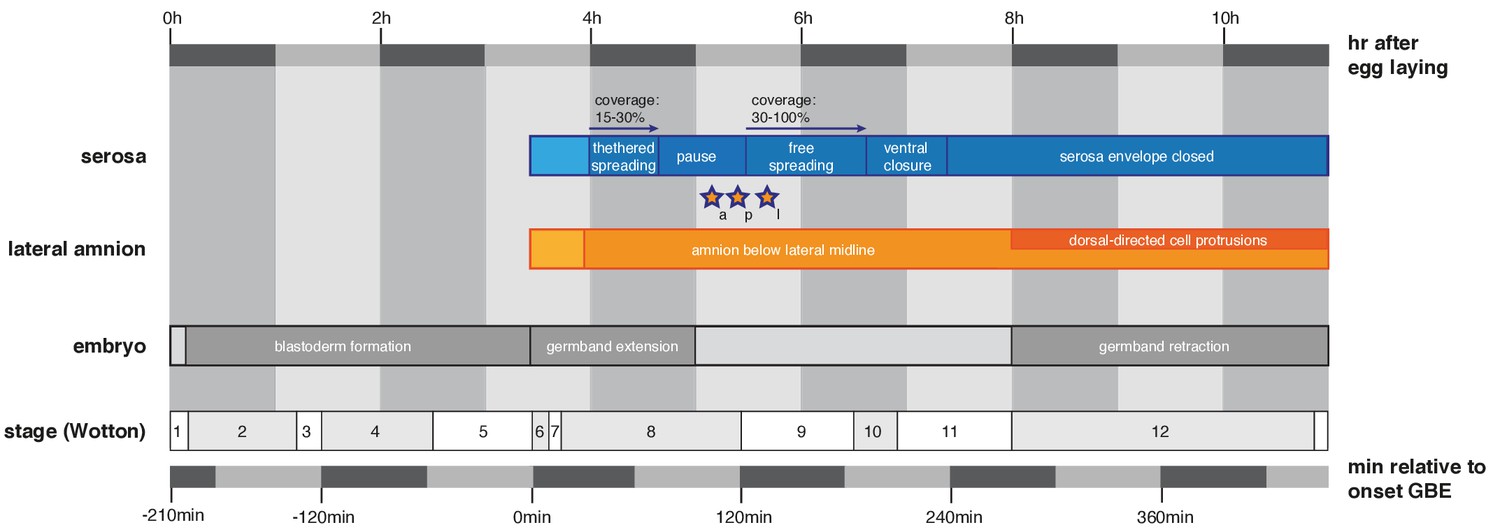
Timeline to outline reported features of extraembryonic development in the context of M. abdita embryonic staging.
Definition and duration of developmental stages are as previously reported (Wotton et al., 2014). Universal landmarks of fly development (onset of germband extension, onset of germband retraction and end of germband retraction) are shown as observed in vivo and in quantified SPIM recordings. Hallmarks of amnion and serosa development are shown in this context as reported in main text Figures 1–3, stars indicate time points of amnion/serosa disjunction (a, anterior; l, lateral; p, posterior).
Figure 4—video 1
The video corresponds to panel A and quantifications presented in panels E and F of Figure 4.
Serosa cell and yolk sac movements prior to and after serosa disjunction. Dynamics of serosa cells (Lifeact-mCherry, magenta) and yolk sac (Mab-Bsg-eGFP, green) in wildtype embryos are shown before (left) and after (right) serosa disjunction. Each frame is an average z-projection of 4–7 confocal planes, which span the apical part of a serosa cell and presumptive surface of the yolk sac membrane. Time lapse recording was performed with three frames/min for a total of 10 min; scale bar is 10 µm. Videos were cropped to reflect the size that has been used as input for single cell cross correlation analyses. Shown is a dorsal view with anterior to the left.
Figure 5 with 2 supplements
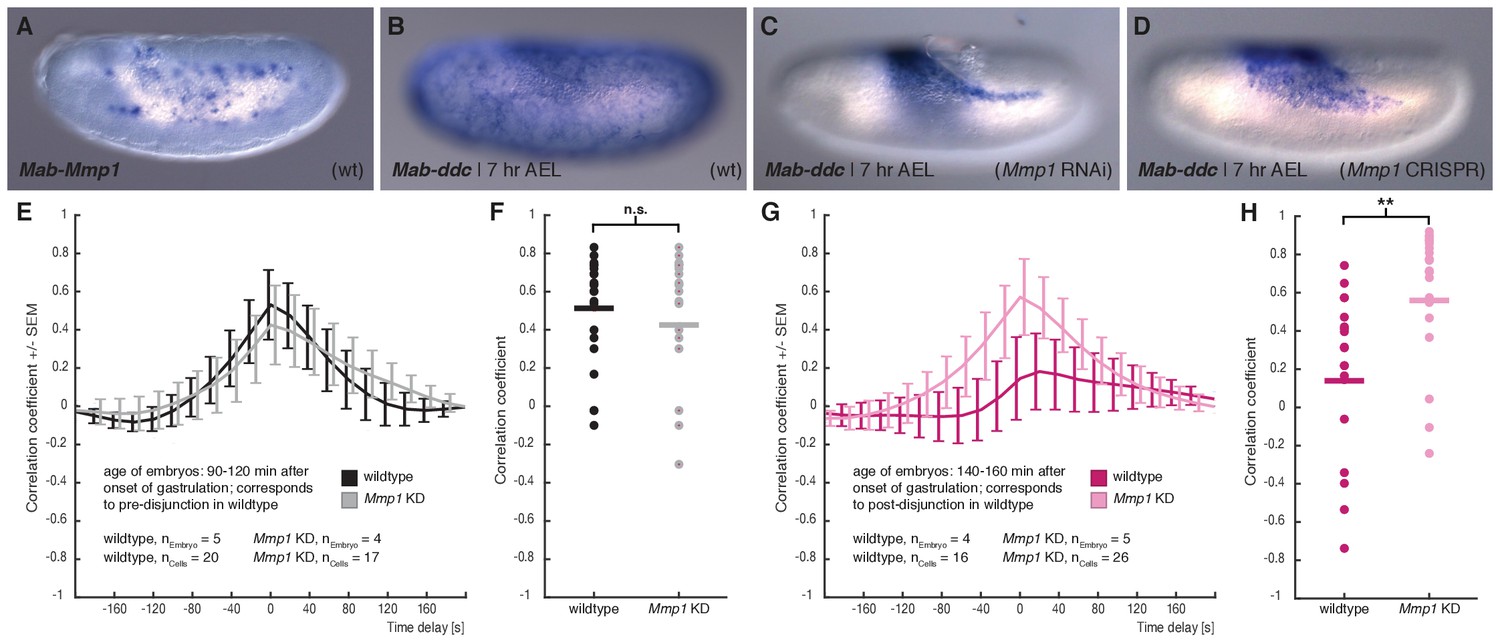
M. abdita Matrix metalloprotease 1 (Mab-Mmp1) regulates serosa decoupling.
(A) Expression of Mab-Mmp1 during germband extension stage. (B–D) Expression of M. abdita dopa decarboxylase (Mab-ddc) as serosa marker during germband extension stage in wildtype (B), in Mab-Mmp1 RNAi (C), and Mab-Mmp1 CRISPR/Cas9 embryos (D). (E,F) Average cross-correlation function of corresponding cell and substrate movements indicate similar level of mechanical coupling in wildtype (black) and Mab-Mmp1 RNAi embryos (grey) at the end of serosa expansion pause in wildtype embryos (E), with statistical support from correlation coefficients of individual cells (F). (G,H) Average cross-correlation function of corresponding cells and substrate movements indicate low mechanical coupling in wildtype (dark magenta) and high mechanical coupling in Mab-Mmp1 RNAi embryos (light magenta) after onset of free serosa expansion in wildtype embryos (G), with statistical support from correlation coefficients for individual cells (H). Bars indicate mean. **p=0.00279; n.s. p=0.48746, based on Student’s t-test.
Figure 5—figure supplement 1
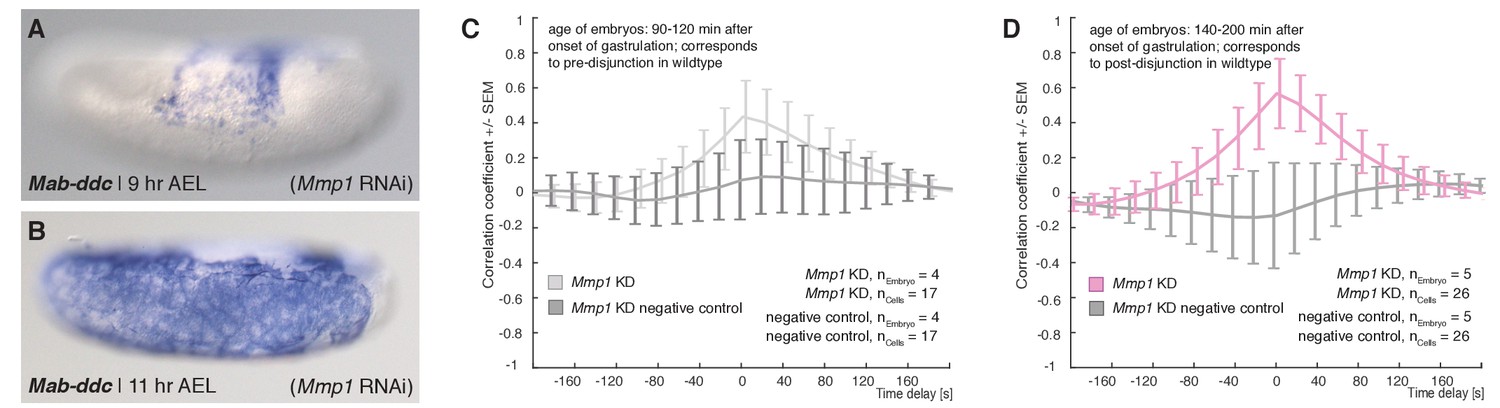
Expression of Mab-ddc as serosa marker and controls for cross correlation analyses in Mab-Mmp1 RNAi embryos.
(A–B) Expression of Mab-ddc as serosa marker in embryos fixed 9 hr AEL and 11 hr AEL. (C,D) Average cross-correlation function of corresponding cells and substrate movements in Mab-Mmp1 RNAi embryos as shown in Figure 5 for equivalents of pre-disjunction (C), light grey) and post-disjunction stages (D), light magenta); negative controls obtained by random pairings of cells and substrate movements from the same embryo revealed no detectable correlation (dark grey). Standard error of mean shown as bars.
Figure 5—video 1
The video corresponds to quantifications presented in Panels E-H in Figure 5.
Serosa cell and yolk sac movements in Mab-Mmp1 RNAi embryos. Dynamics of serosa cells (Lifeact-mCherry, magenta) and yolk sac (Mab-Bsg-eGFP, green) in Mab-Mmp1 RNAi embryos are shown at stages corresponding to times before (left) and after (right) serosa disjunction in wildtype embryos. Each frame is an average z-projection of 4–7 confocal planes, which spans the apical part of a serosa cell and presumptive surface of the yolk sac membrane. Time lapse recording was performed with three frames/min for a total of 10 min; scale bar is 10 µm. Videos were cropped to reflect the size that has been used as input for single cell cross correlation analyses. Shown is a dorsal view with anterior to the left.
Additional files
-
Transparent reporting form
- https://doi.org/10.7554/eLife.34616.019
Download links
A two-part list of links to download the article, or parts of the article, in various formats.
Downloads (link to download the article as PDF)
Open citations (links to open the citations from this article in various online reference manager services)
Cite this article (links to download the citations from this article in formats compatible with various reference manager tools)
Decoupling from yolk sac is required for extraembryonic tissue spreading in the scuttle fly Megaselia abdita
eLife 7:e34616.
https://doi.org/10.7554/eLife.34616


