Shearing in flow environment promotes evolution of social behavior in microbial populations
- University of Notre Dame, United States
Figures
Figure 1
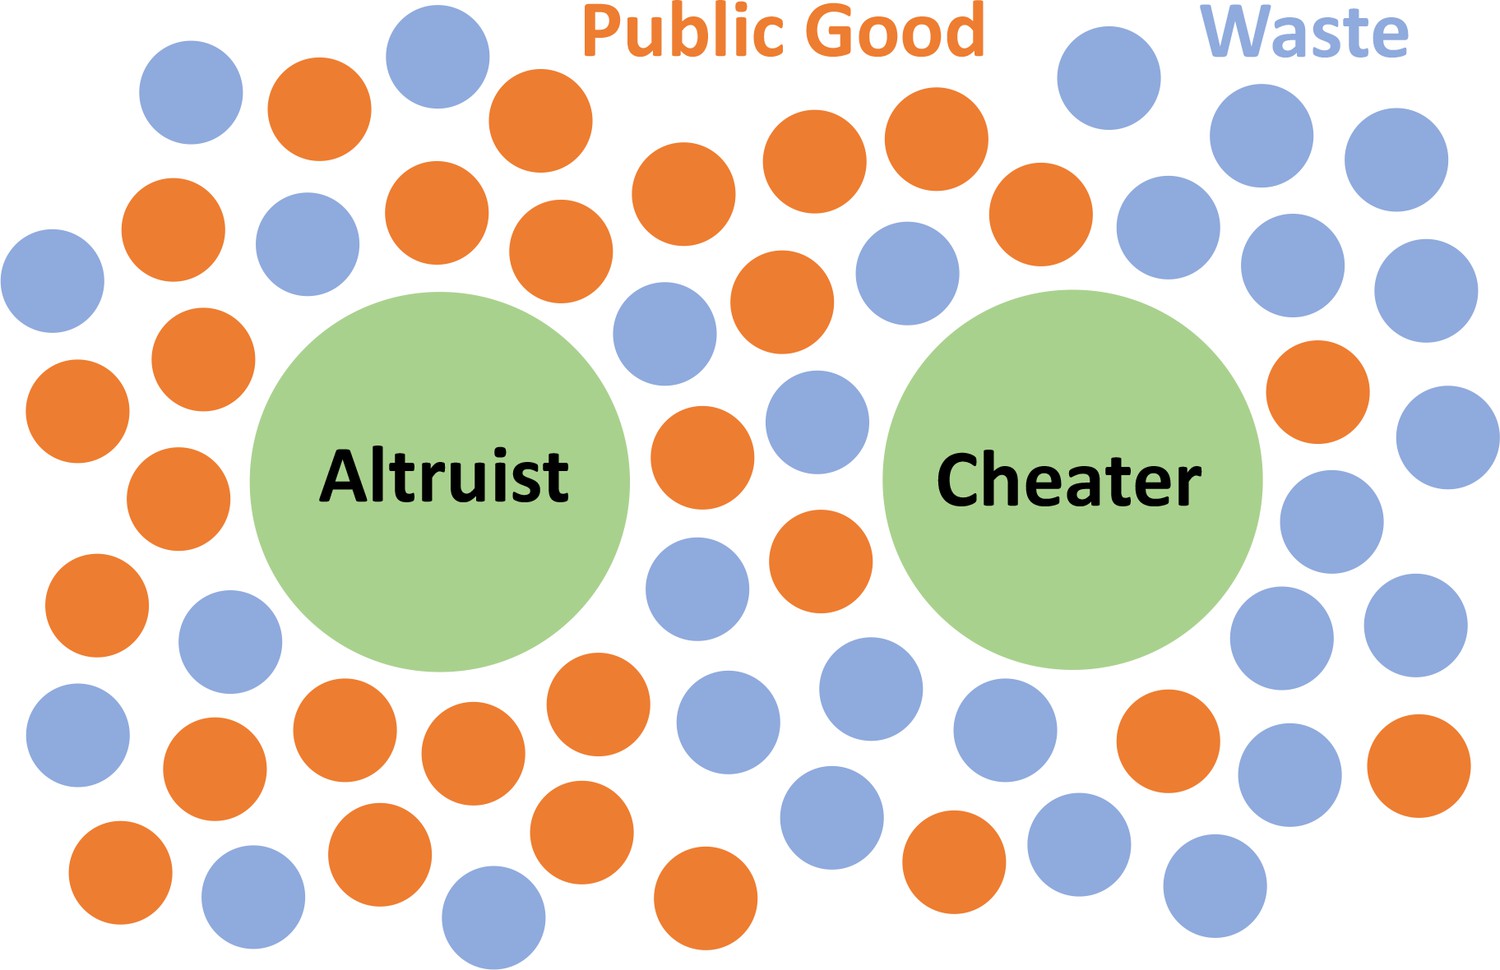
Schematics of our Model.
The microbes secrete two types of molecules into the environment. The first, a beneficial public good that promotes growth, and the second, a waste or harmful substance hinders growth. Cheating microbes produce lessor none of the former, while benefiting from public goods secreted by the altruistic population.
Figure 2
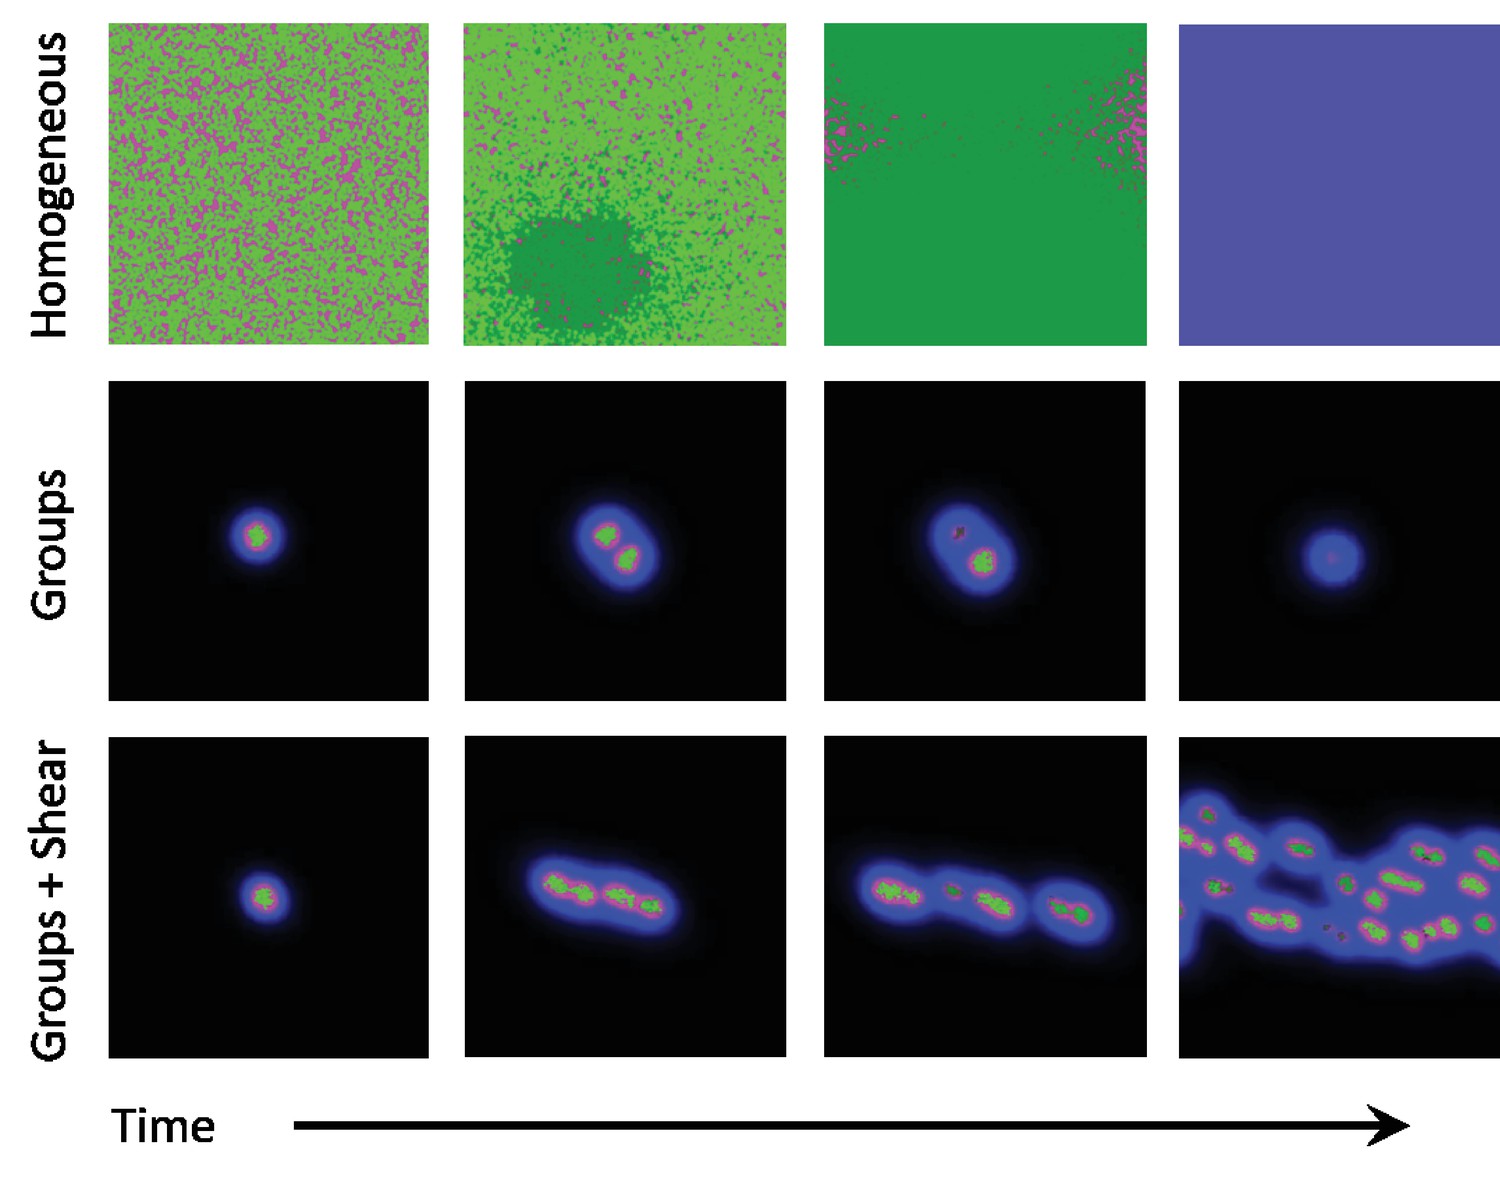
Snapshots of homogeneous and group phases without and with shear.
Microbes interact by secreting diffusive chemicals into their environment. Cooperators are seen as bright green dots, and cheaters are seen as dark green dots. The waste compound is shown as blue and the public good as red, the two combined is seen as magenta. Top row: In the homogeneous phase the microbes spread to fill the domain. Cheaters quickly begin to take over, and eventually take over the whole domain. With no cooperators left, the public good decays away and the system goes extinct. Middle row: In the group phase, when the diffusion length of the waste compound is larger than the diffusion length of public good, microbes form stable groups. As the microbes increase in number, the groups split apart and form new groups. As mutations occur within groups, the cheaters take over and the group goes extinct. Cooperation can only be stable here if groups reproduce quicker than mutants take over. Bottom row: By adding a shearing flow to the group system, we can cause the groups to split apart quicker. Mutations still take over groups, but the groups are able to reproduce quicker than mutants take over, thus allowing cooperative groups to prevail at steady state. The simulation videos corresponding to this figure are provided in the Videos 1–3.
Figure 3
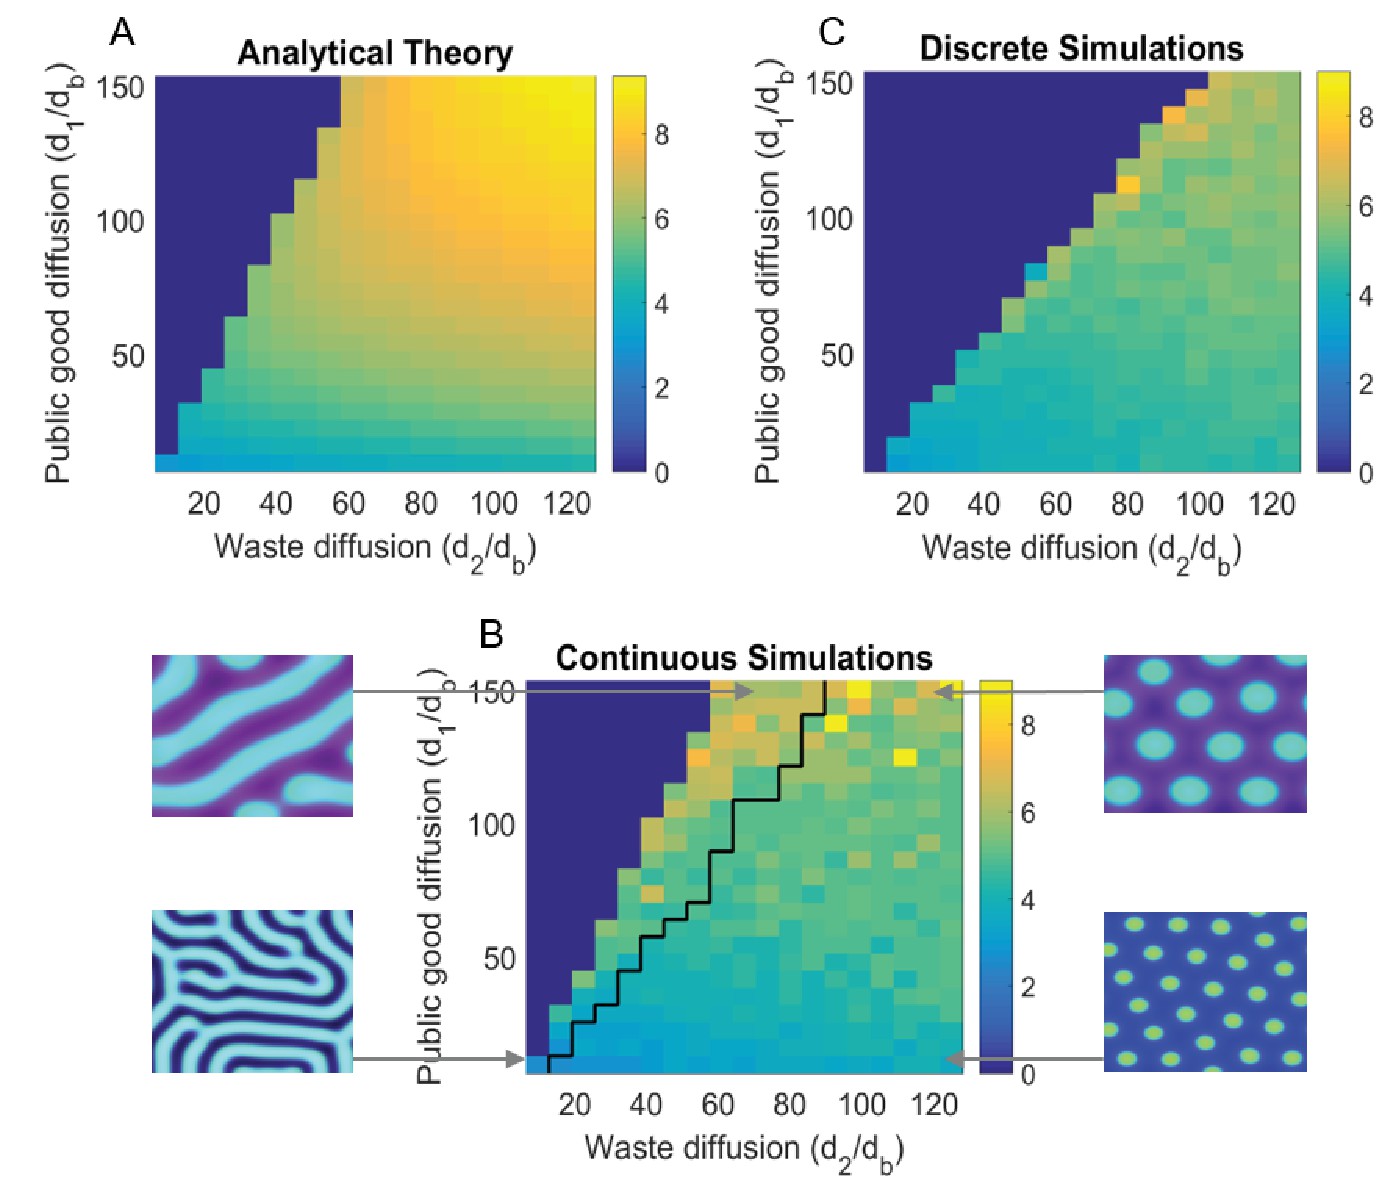
Turing analysis results.
The top-left figure, (A) shows the group size as obtained by our theoretical analysis (appendix); whereas the bottom figure, (B) shows the same for continuous simulations, and the top-right figure, (C) is for agent based simulations. The black line in (B) divides parameters that give rise to striped patterns, and those that give rise to spots, corresponding images are shown to the left and right of (B). Due to the discreteness of the agent based simulations, Turing patterns are not always stable where they might be in the continuous analogue. We see that the discrete simulations cut off around where we would see stripes in the continuous case, and do not see striped patterns in the discrete case. For different sets of parameters, we can also see Turing patterns in the discrete-stochastic case where they might not occur in the continuous case. For the region where Turing patterns are stable, the continuous theory gives a good prediction of group size and group reproduction rate. The Matlab code and data for this figure is provided in Figure 3—source data 1.
-
Figure 3—source data 1
Matlab data and code files for Figure 3.
- https://doi.org/10.7554/eLife.34862.009
Figure 4
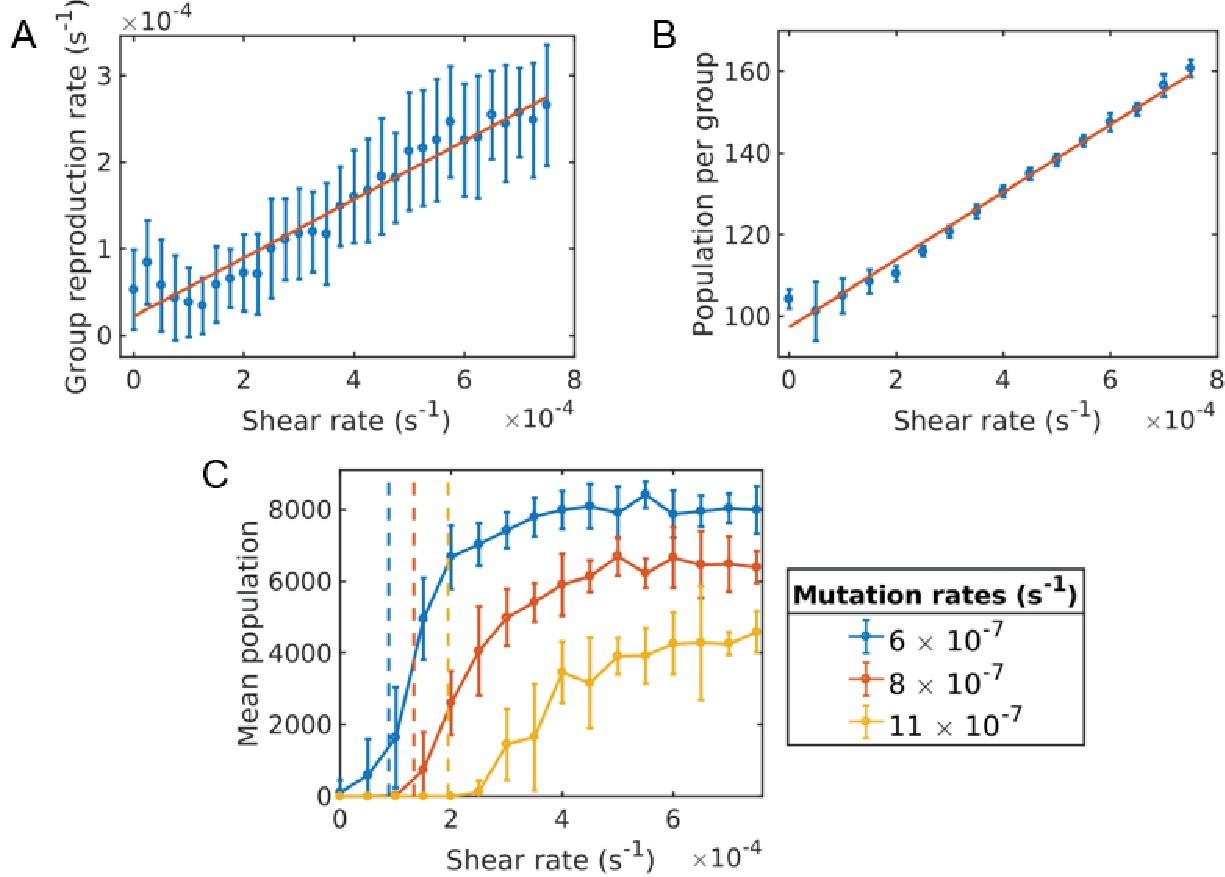
Critical shear for cooperativity for cheater-altruist system.
(A) Group fragmentation rate versus shear rate. We see that the group fragmentation rate increases linearly with the shear rate. (B) Group population versus shear rate. As the shear distorts and elongates the group, the average group population also increases linearly with shear. (C) Average population versus shear rate for different mutation rates. Simulations were run for a time of s and averaged over 10 runs for each shear rate and mutation rate. Error bars correspond to one standard deviation. Here, a mutation corresponds to a full cheater, with no public good secretion. The population goes extinct under larger mutation rates unless the shear rate is above the critical value. The critical shear values for different mutation rates are roughly obtained by 10 and are shown by the vertical dashed lines corresponding to curves of the same color. The Matlab code and data for this figure is provided in Figure 4—source data 1.
-
Figure 4—source data 1
Matlab data and code files for Figure 4.
- https://doi.org/10.7554/eLife.34862.011
Figure 5

Evolution of sociality in constant shear (continuum of secretion rates).
Individual groups are essentially homogeneous in secretion space, whereas the meta-population contains a distribution of groups with different secretion rates (Appendix 1—figure 1). (A) Groups that have a higher secretion rate reproduce quicker than those of lower secretion rate. Shear works to increase the reproduction rate of groups. (B) Just as in the two phenotype case, the population of the system increases with shear, since groups are able to split apart quicker than novel cheating mutations occur. (C) The average secretion rate of the entire population generally increases with shear and saturates around where the group reproduction rate is sufficient to maintain the population. Simulations were run for a time of s and averaged over 80 runs for each shear rate and under a mutation rate of . Error bars correspond to one standard deviation. The Matlab code and data for this figure is provided in Figure 5—source data 1.
-
Figure 5—source data 1
Matlab data and code files for Figure 5.
- https://doi.org/10.7554/eLife.34862.013
Figure 6
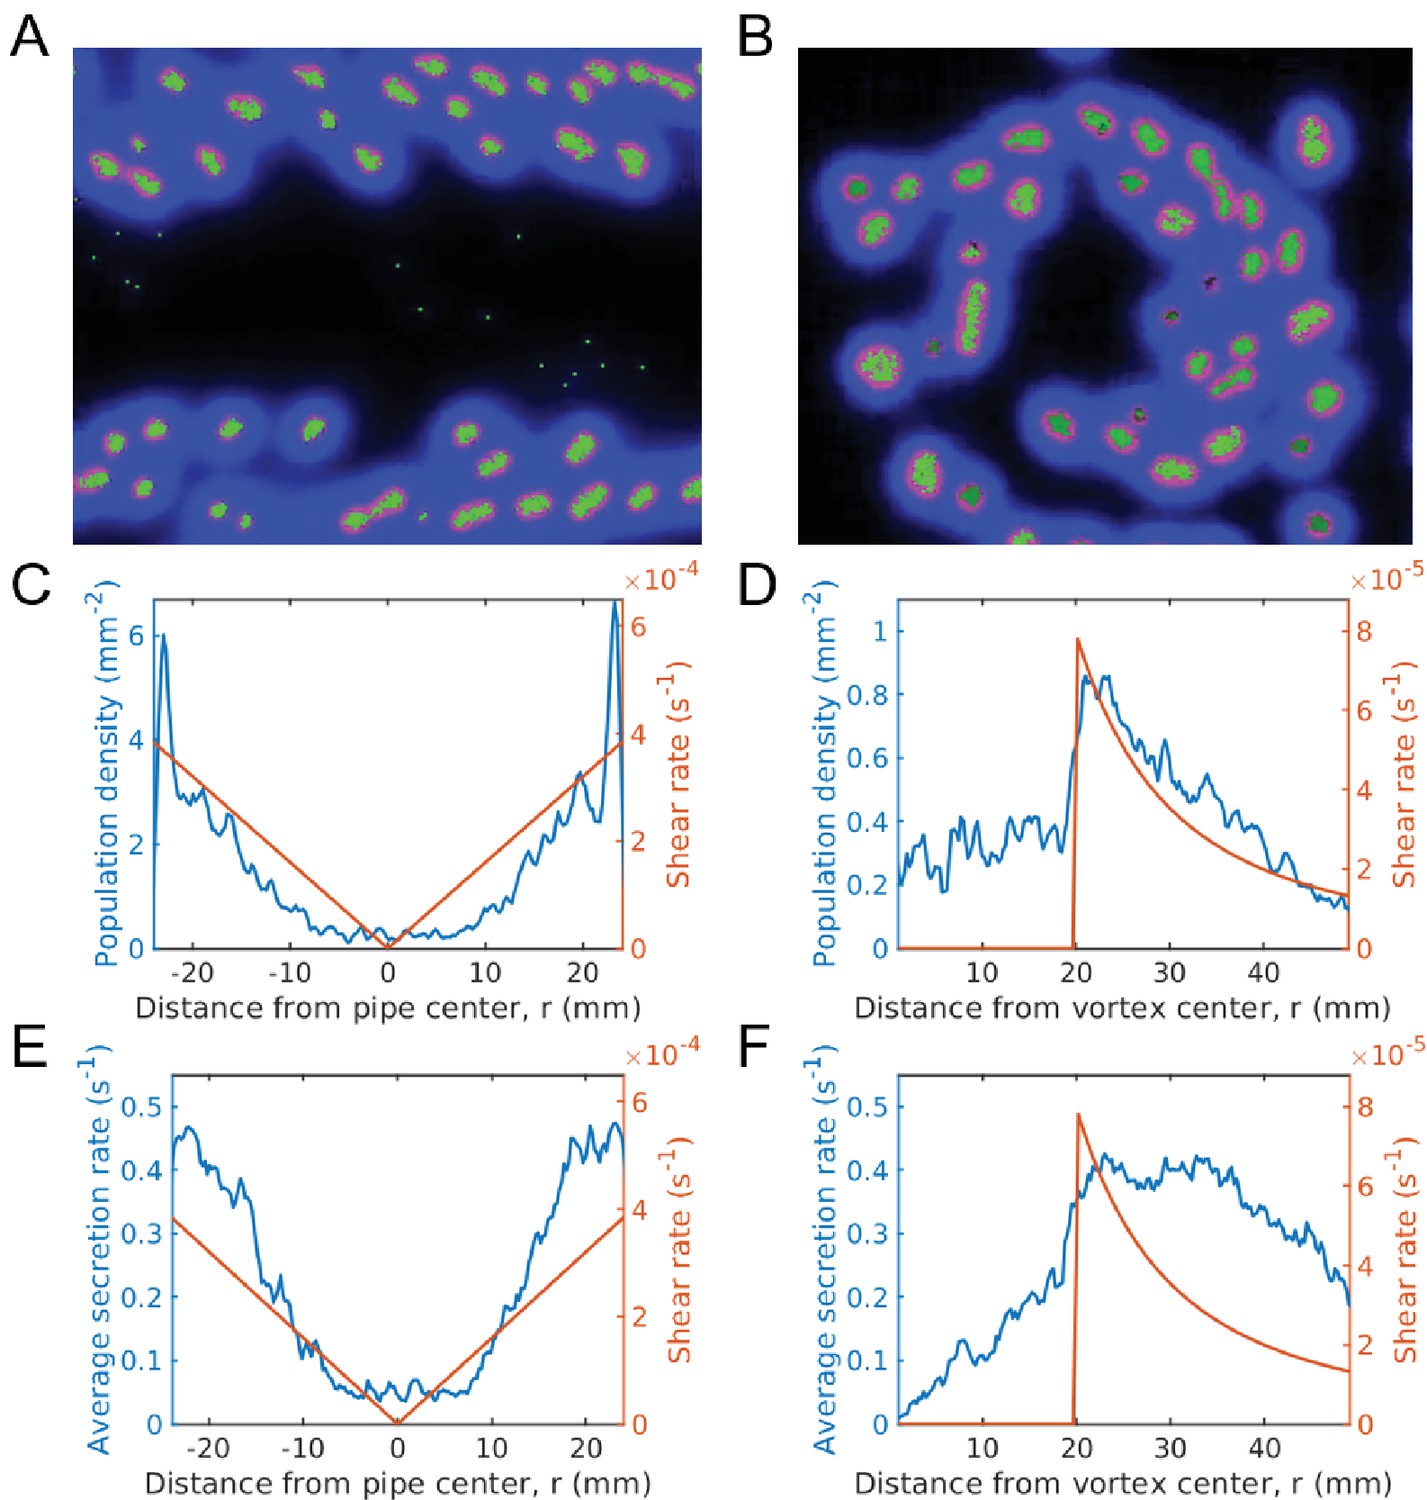
Evolution of sociality in pipe and vortex geometries (continuum of secretion rates).
The top row gives simulation snapshots of the system in a Hagen-Poiseuille flow in a pipe (A) and of the system in a Rankine vortex (B). The middle row gives the average microbial population and the shear rate magnitude versus distance from the center of the pipe (C) and the center of the Rankine vortex (D). Since shear is spatially dependent, the population is localized in regions of large shear. For Hagen-Poiseuille flow, we see that the population is larger at the boundaries, where the shear is also larger (C). This is because groups fragment quicker at the boundaries and are able to overcome take-over by mutation, whereas near the center they cannot. For the Rankine vortex we also see that the population follows very closely to the shear (D), which suggests that the growth is proportional to shear. We caution that this holds in the low density limit. At higher densities the population saturates and is no longer proportional to shear. The bottom row gives the average public good secretion rates of the entire population for Hagen-Poiseuille flow (E) and for Rankine vortex flow (F). Again, regions of larger shear admit more cooperative populations with larger public good secretion rates. Simulations were run for a duration of s under a mutation rate of and data was averaged over 200 runs. The undulations observed in the population plots are due to the finite size of the groups. Groups form layers of width equal to the group diameter. The population curve therefore shows undulations of width equal to the group width. Simulation videos of Hagen-Poiseuille flow and Rankine vortex flow are provided in Videos 4, 5 and Matlab code and data for (C)-(F) is given in Figure 6—source data 1.
-
Figure 6—source data 1
Matlab data and code files for Figure 6.
- https://doi.org/10.7554/eLife.34862.015
Appendix 1—figure 1
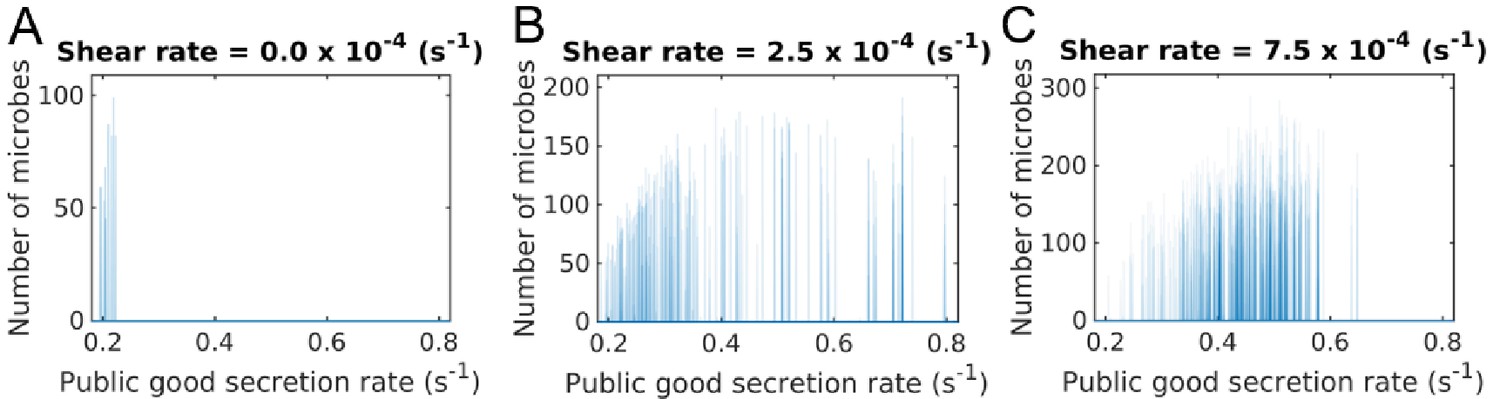
Secretion rate distributions of groups under different shear rates.
Microbes are grouped by their position in space and the distribution of their secretion rates is plotted. Simulations were started with a secretion rate of 100 and random mutations were allowed to change the secretion rate of individual microbes. Distributions are given by looking at 10 simulations for each shear rate after a duration of s. (A) With no shear, there are very few groups left at the chosen time and these will eventually go extinct. Cheaters have taken over these groups and individual groups are homogeneous in secretion rate. (B) With some added shear, groups are better able to beat cheating mutations, but the bulk of the distribution is still at lower secretion rates. (C) At higher shear rates there are more groups centered at a higher secretion rate due to shear augmented group fragmentation. In all cases, groups that initially start off with a heterogeneous population quickly become homogeneous, as seen by the delta peaks in the distributions. Each peak corresponds to a group. In the larger population however, groups of different secretion rates can and do coexist, as seen by the distribution of the peaks. In this case we can still analyze individual groups by looking at their secretion rate. The Matlab code and data for this figure is provided in Appendix 1—figure 1—source data 1.
-
Appendix 1—figure 1—source data 1
Matlab data and code files for figure in appendix.
- https://doi.org/10.7554/eLife.34862.024
Videos
Video 1
This is a video file of a simulation of the homogeneous phase.
https://doi.org/10.7554/eLife.34862.003
Video 2
This is a video file of a simulation of the group phase.
https://doi.org/10.7554/eLife.34862.004
Video 3
This is a video file of a simulation of the group phase under Couette flow.
https://doi.org/10.7554/eLife.34862.005
Video 4
This is a video file of a simulation of the group phase under a Hagen-Poiseuille flow.
https://doi.org/10.7554/eLife.34862.016
Video 5
This is a video file of a simulation of the group phase under a Rankine vortex flow.
https://doi.org/10.7554/eLife.34862.017Tables
Table 1
Summary of system parameters.
https://doi.org/10.7554/eLife.34862.018| Parameter | Definition | Values |
|---|---|---|
| Microbial diffusion constant | ||
| Public good diffusion constant | ||
| Waste diffusion constant | ||
| Flow velocity | ||
| Public good decay constant | ||
| Waste decay constant | ||
| Public good saturation | ||
| Waste saturation | ||
| Public good secretion rate | ||
| Waste secretion rate | ||
| Benefit of public good | ||
| Harm of waste compound | ||
| Cost of secretion | ||
| Mutation rate |
Additional files
-
Source code 1
Matlab code for discrete stochastic simulations.
Main file is main_discrete.m. See README file for more information.
- https://doi.org/10.7554/eLife.34862.019
-
Source code 2
Matlab code for continuous simulations used in Figure 3B.
Main file is main_continuous.m. See README file for more information.
- https://doi.org/10.7554/eLife.34862.020
-
Transparent reporting form
- https://doi.org/10.7554/eLife.34862.021
-
Appendix 1—figure 1—source data 1
Matlab data and code files for figure in appendix.
- https://doi.org/10.7554/eLife.34862.024
Download links
A two-part list of links to download the article, or parts of the article, in various formats.
Downloads (link to download the article as PDF)
Open citations (links to open the citations from this article in various online reference manager services)
Cite this article (links to download the citations from this article in formats compatible with various reference manager tools)
Shearing in flow environment promotes evolution of social behavior in microbial populations
eLife 7:e34862.
https://doi.org/10.7554/eLife.34862


