Co-translational protein targeting facilitates centrosomal recruitment of PCNT during centrosome maturation in vertebrates
- University of California, Davis School of Medicine, United States
- University of California, Davis School of Veterinary Medicine, United States
- University of California, San Francisco, United States
- Chan Zuckerberg Biohub, United States
Figures
Figure 1 with 1 supplement

Pericentrin (pcnt) mRNA is localized to centrosomes in early zebrafish embryos.
(A) RNA in situ hybridization of transcripts of different PCM components in four-cell stage zebrafish embryos. Note that while the mRNA of cep152, cep192, and cep215 displayed a pan-cellular distribution, pcnt mRNA was concentrated at two distinct foci in each cell. (B) RNA in situ hybridization showed similar dot-like patterns of pcnt transcripts with two non-overlapping antisense probes. The signals were lost in two maternal-zygotic (MZ) pcnt mutants. (C) Fluorescent RNA in situ hybridization and anti-γ-tubulin co-staining demonstrated the centrosomal localization of pcnt mRNA. n > 300 (pcnt-001 probe), n > 100 (pcnt-002 probe), n > 50 (cep152, cep192, or cep215 probe); all the embryos showed the same RNA distribution patterns as shown in the representative images. More than 100 MZpcnttup2 or MZpcnttup5 embryos were examined; none of them showed visible pcnt RNA in situ signals. Embryos were examined between 2- and 16-cell stages with representative four-cell stage embryos shown. Dashed lines delineate the cell boundaries. Scale bars: 200 µm or 25 µm (inset in C).
Figure 1—figure supplement 1
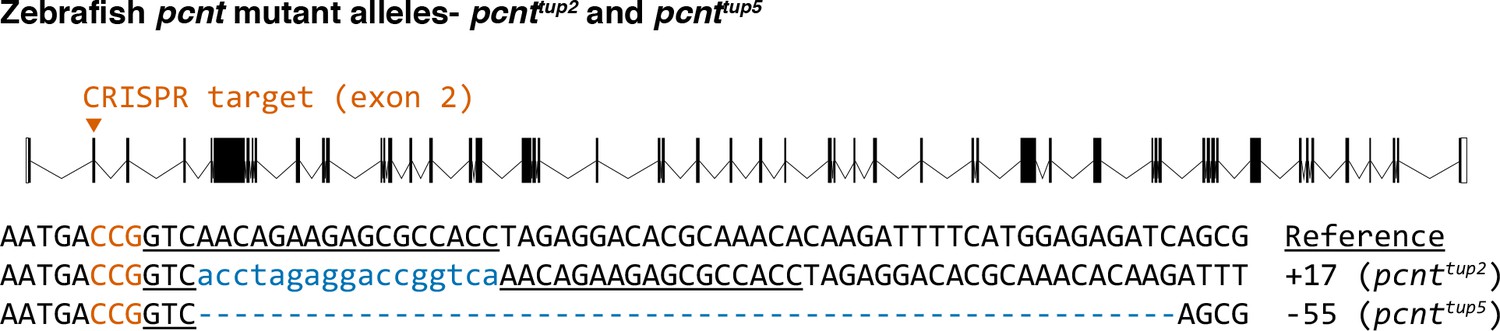
Sequences of two Cas9-induced frameshift mutations (alleles pcnttup2 and pcnttup5) in the zebrafish pcnt gene.
The wild-type reference sequence is on the top. The guide RNA targets the exon 2 of the pcnt transcript (encoded by ENSDARG00000033012). The target site is underlined and the protospacer-adjacent motif (PAM) is in orange (on the reverse strand). Insertions and deletions (indels) are indicated by blue lowercase letters and dashes, respectively. The net change of each indel mutation is noted at the right of each sequence (+, insertion; −, deletion).
Figure 2 with 2 supplements
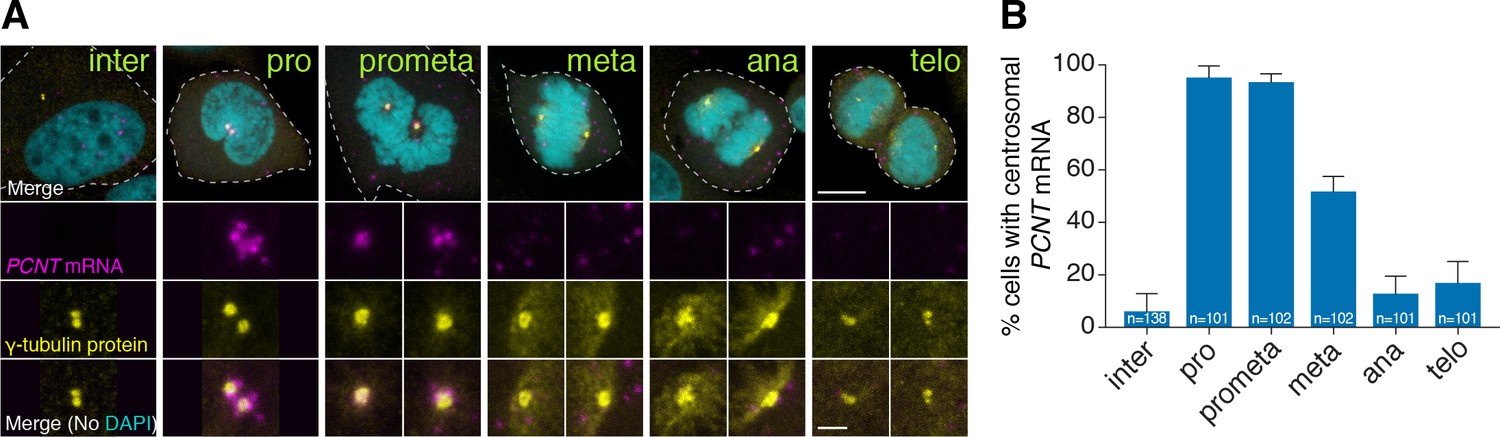
Human PCNT mRNA is localized to centrosomes during early mitosis.
(A) Synchronized HeLa cells were subjected to fluorescent in situ hybridization with tyramide signal amplification against PCNT mRNA and anti-γ-tubulin immunostaining. Note that PCNT mRNA was localized to centrosomes predominantly during prophase (pro) and prometaphase (prometa). (B) Quantification of PCNT mRNA localization at centrosomes during different cell cycle stages. Data are represented as mean with standard deviation (SD) from three biological replicates, with the total number of cells analyzed indicated. Dashed lines delineate the cell boundaries. Scale bars: 10 µm and 2 µm (inset).
-
Figure 2—source data 1
The source data to plot the bar chart in Figure 2B.
- https://doi.org/10.7554/eLife.34959.008
Figure 2—figure supplement 1
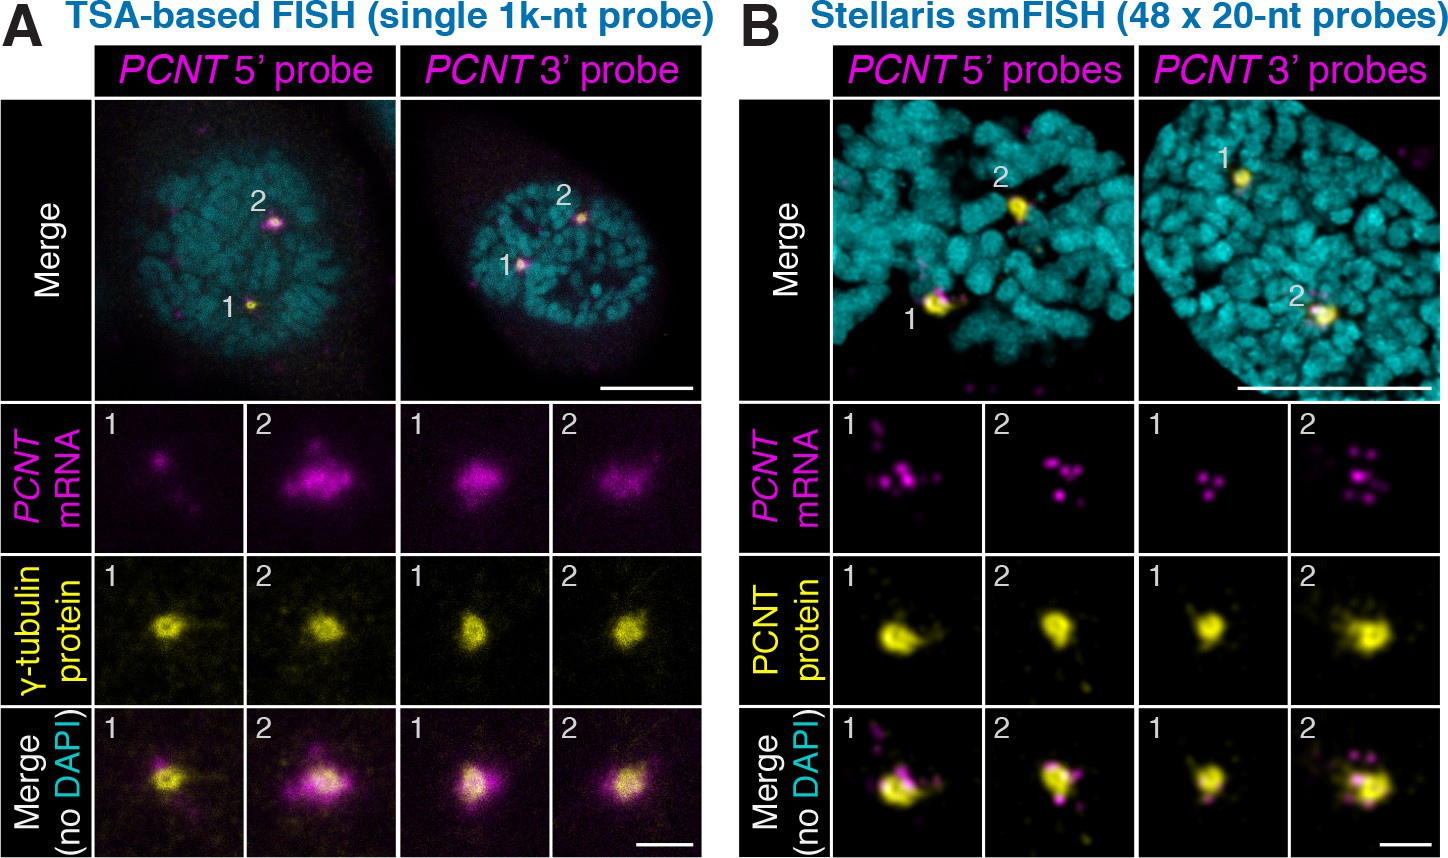
Non-overlapping antisense probes and two independent in situ methods confirm centrosomal localization of PCNT mRNA during early mitosis.
HeLa cells were subjected to fluorescent in situ hybridization (FISH) with tyramide signal amplification (TSA) against PCNT mRNA with a 1000-nt probe (A) or the Stellaris single-molecule FISH (smFISH) with a set of 48 20-nt fluorescent probes (B). Note that both methods (probing two distinct regions in each method) showed similar distributions of PCNT mRNA at centrosomes during early mitosis, with the Stellaris smFISH showing mRNA at near single-molecule resolution. Scale bars: 10 µm and 2 µm (inset).
Figure 2—figure supplement 2
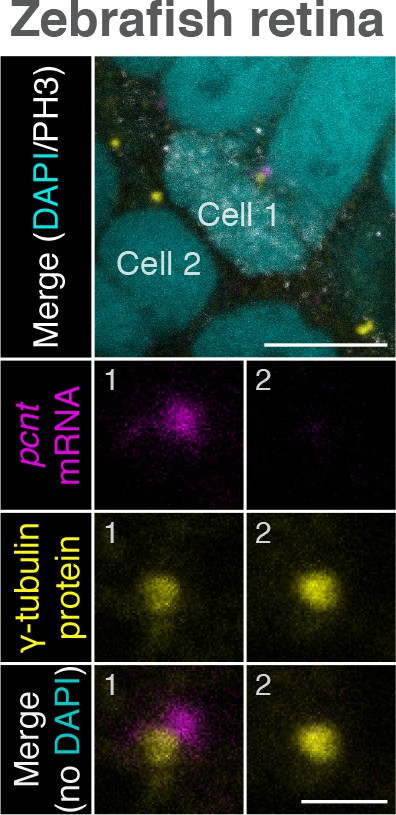
Zebrafish pcnt mRNA is localized to centrosomes of mitotic retinal neuroepithelial cells in vivo.
Retinal neuroepithelial cells of 1-day-old zebrafish were subjected to pcnt FISH, anti-γ-tubulin, and anti-phospho-Histone H3 (PH3) immunostaining. Note that pcnt mRNA was localized to the centrosome of the mitotic (Cell 1, PH3+), but not of the non-mitotic cell (Cell 2). Retinas from >40 embryos were examined. Scale bars: 10 µm and 2 µm (inset).
Figure 3 with 3 supplements
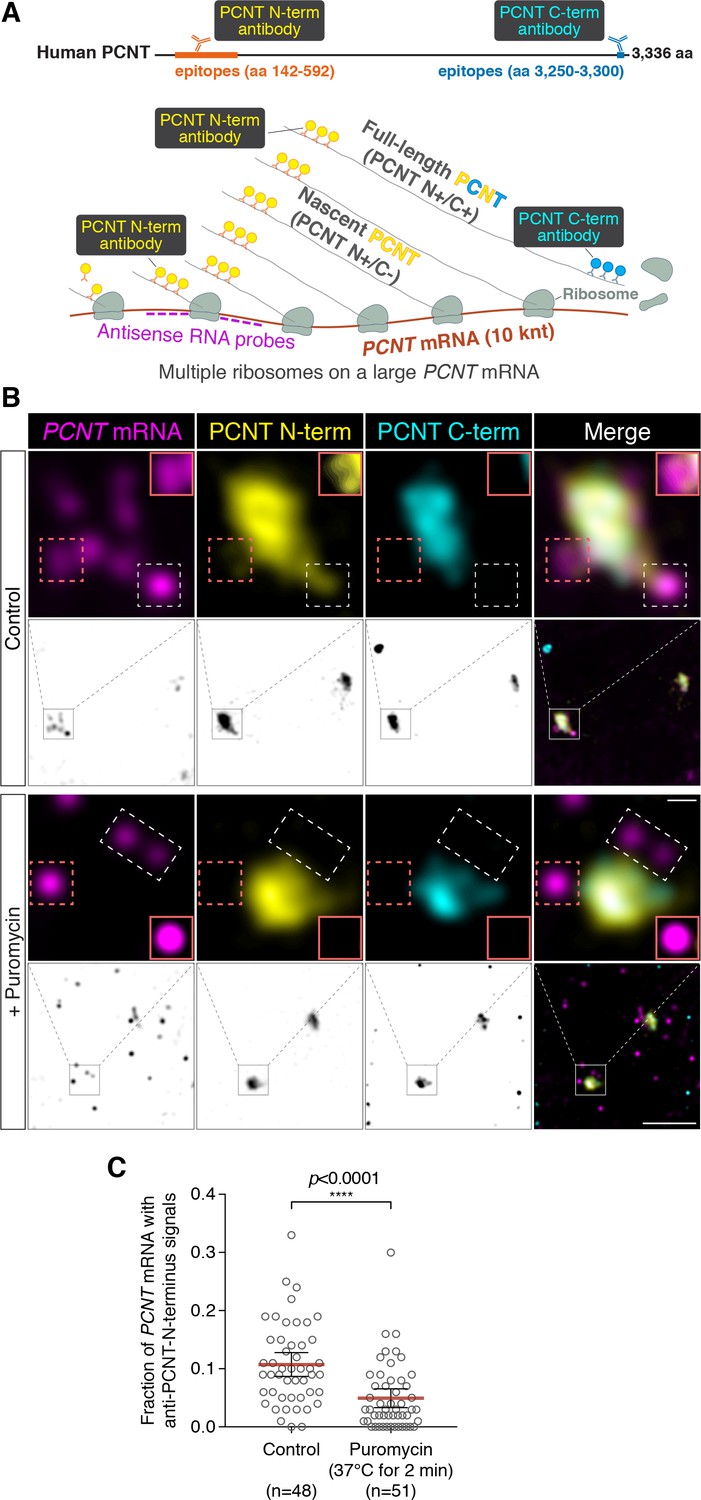
Centrosomally localized PCNT mRNA undergoes active translation.
(A) A strategy of using smFISH and double immunofluorescence (IF) to distinguish between newly synthesized and full-length PCNT proteins (see text for details). The location and size of the epitopes for anti-PCNT N- and C-terminus antibodies, proportionally scaled to the full-length human PCNT protein, are indicated. (B) Prometaphase HeLa cells were subjected to PCNT smFISH and anti-PCNT immunostaining against the N- and C-terminus of PCNT protein (PCNT N-term and PCNT C-term). Note that the putative active translation sites were labeled by PCNT N-term IF and PCNT smFISH, but not by PCNT C-term IF (top panel). However, upon the puromycin treatment (300 µM for 2 min at 37°C, bottom panel), PCNT N-term IF signals were no longer colocalized with PCNT smFISH signals, indicating that those PCNT N-term IF signals on RNA represent nascent PCNT polypeptides. Orange boxes show higher contrast of selected areas (dashed orange boxes) for better visualization. The low-magnification images corresponding to the magnified insets are shown in monochrome (individual channels) and color (merged channels). (C) PCNT smFISH signals between 1 and 3 µm radius from the centrosome center were quantified for the presence of anti-PCNT N-term IF signals with or without a short puromycin treatment. Data are represented as mean ±95% CI (confidence intervals) from three biological replicates, with the total number of cells analyzed indicated. p-value was obtained with Student’s t-test (two-tailed). Scale bars: 5 µm and 0.5 µm (inset).
-
Figure 3—source data 1
The source data to plot the dot plot in Figure 3C.
- https://doi.org/10.7554/eLife.34959.014
Figure 3—figure supplement 1
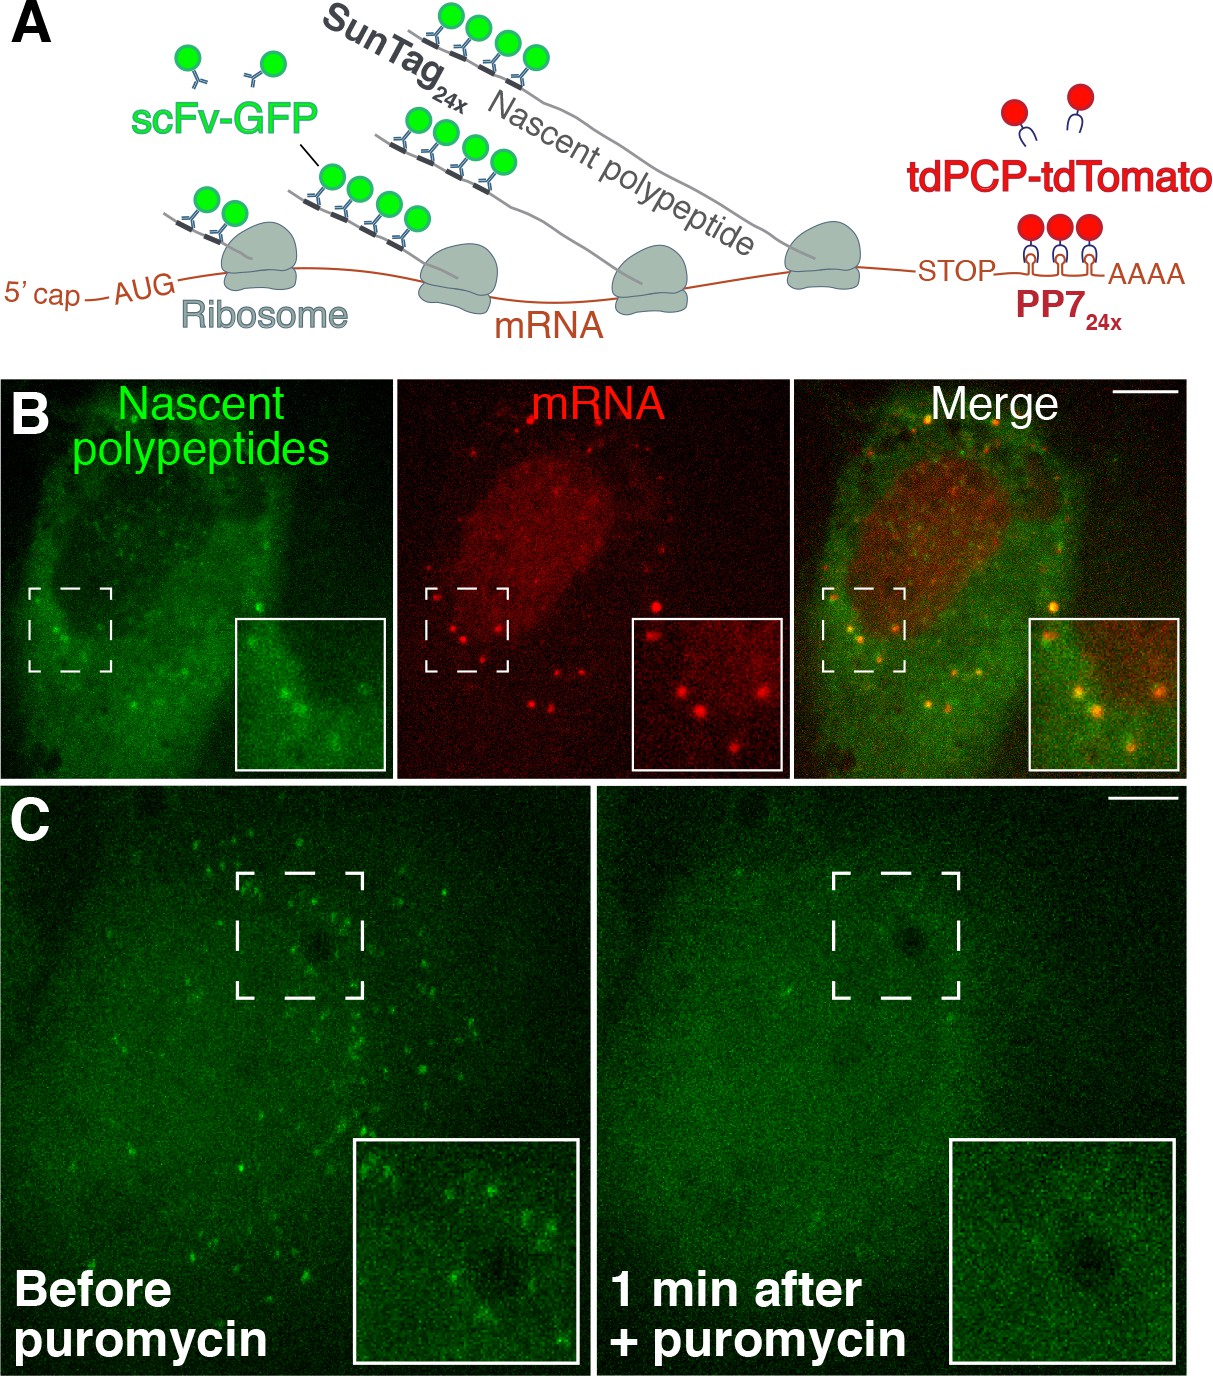
Visualization of active translation in live cells using the SunTag/PP7 system.
(A) SunTag/PP7 system overview, adapted from Wang et al. (2016). (B) HeLa cells stably expressing scFv-GFP and tdPCP-tdTomato transfected with SunTag-ODC-PP7 reporter. Individual polysomes (GFP+) and mRNA (tdTomato+) were shown. (C) Translation foci in the same field before and after adding 300 µM puromycin for 1 min. Scale bars: 10 µm.
Figure 3—figure supplement 2
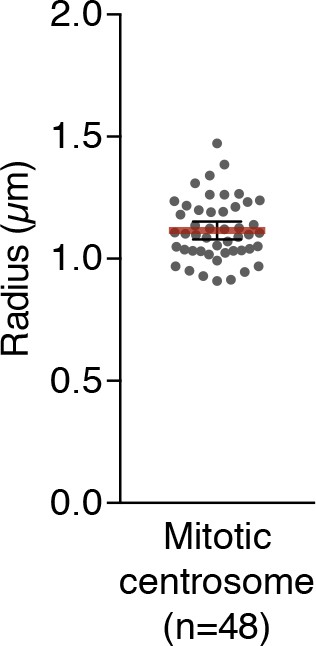
Mean radius of mitotic centrosomes of HeLa cells.
Data are represented as mean ±95% CI from three biological replicates.
-
Figure 3—figure supplement 2—source data 1
The source data to plot the dot plot in Figure 3—figure supplement 2.
- https://doi.org/10.7554/eLife.34959.012
Figure 3—figure supplement 3
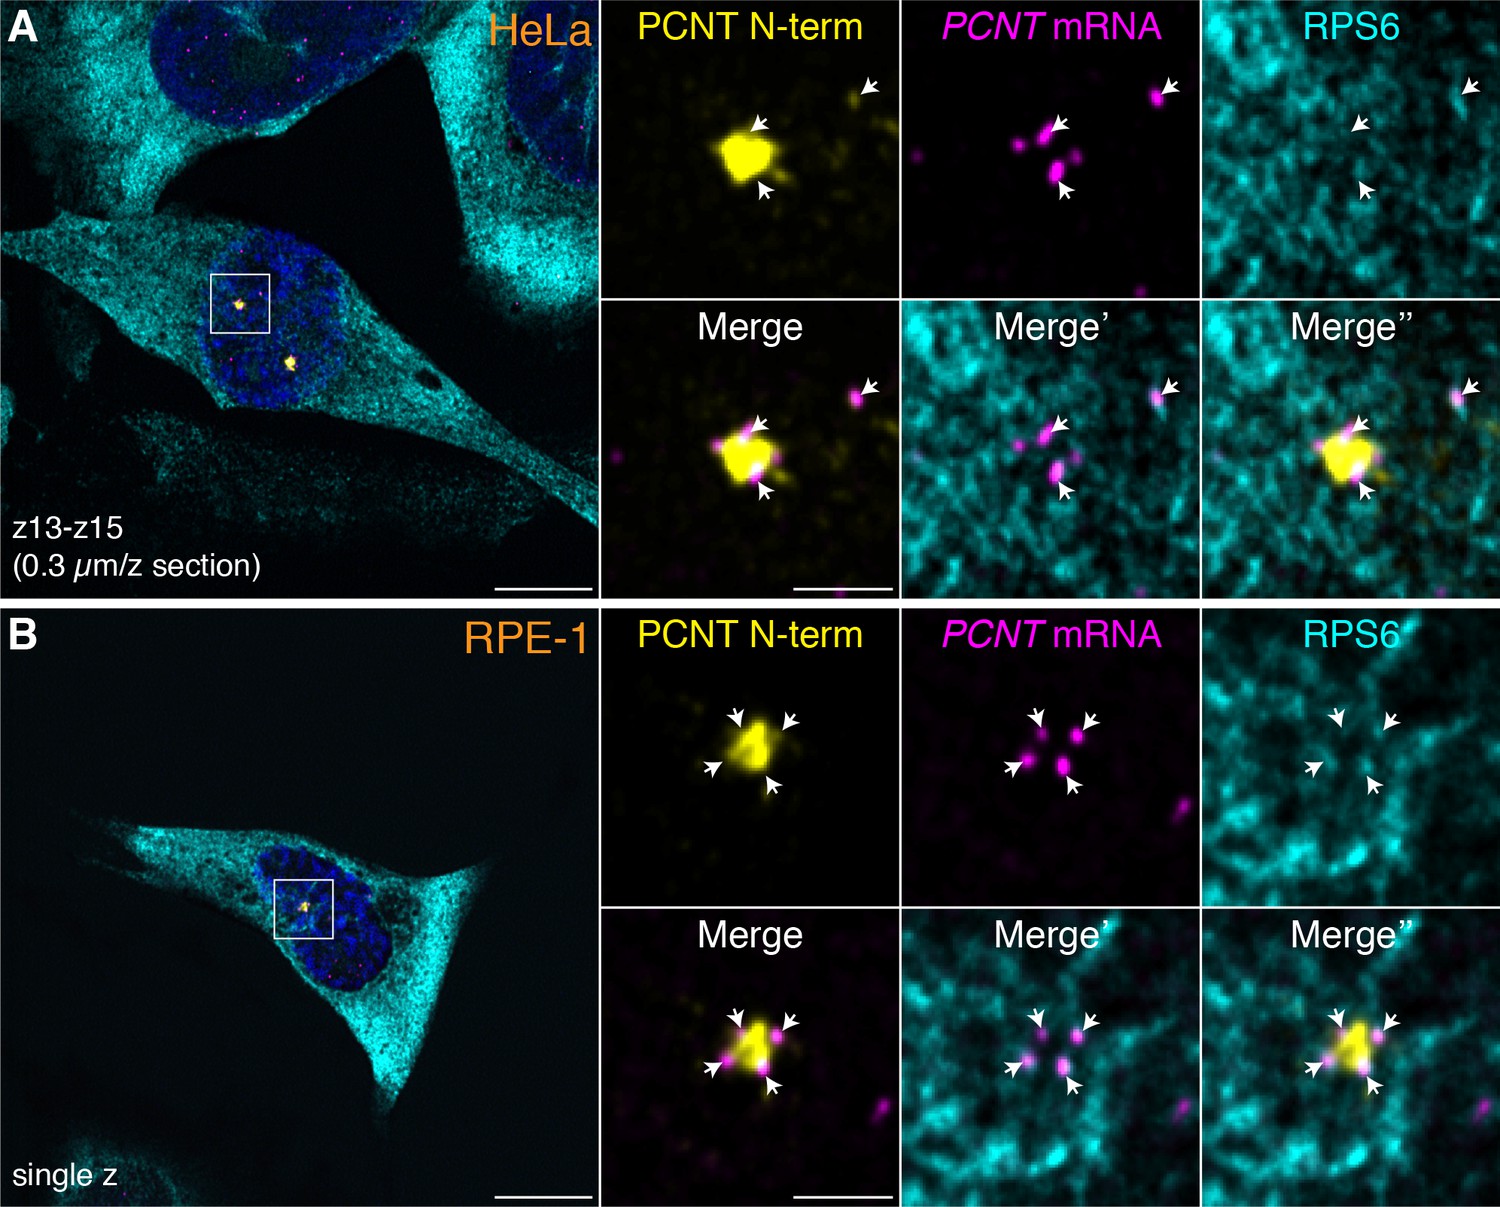
Colocalization of anti-PCNT N-terminus, anti-ribosomal protein S6, and PCNT smFISH signals near the centrosome during early mitosis.
HeLa (A) or RPE-1 (B) cells at prophase were subjected to anti-PCNT N-terminus, anti-ribosomal protein S6 double immunostaining, and PCNT smFISH. Note that when colocalization of these three signals was assessed within thin optical sections (e.g. 1 to 3 confocal z-sections, 0.3 µm per z section), many PCNT mRNA molecules positive for anti-PCNT N-terminus signals near the centrosome were also positive for anti-ribosomal protein S6 (RPS6) signals (arrows), suggesting that these PCNT mRNA molecules were undergoing active translation. Scale bars: 10 µm and 2 µm (inset).
Figure 4 with 3 supplements
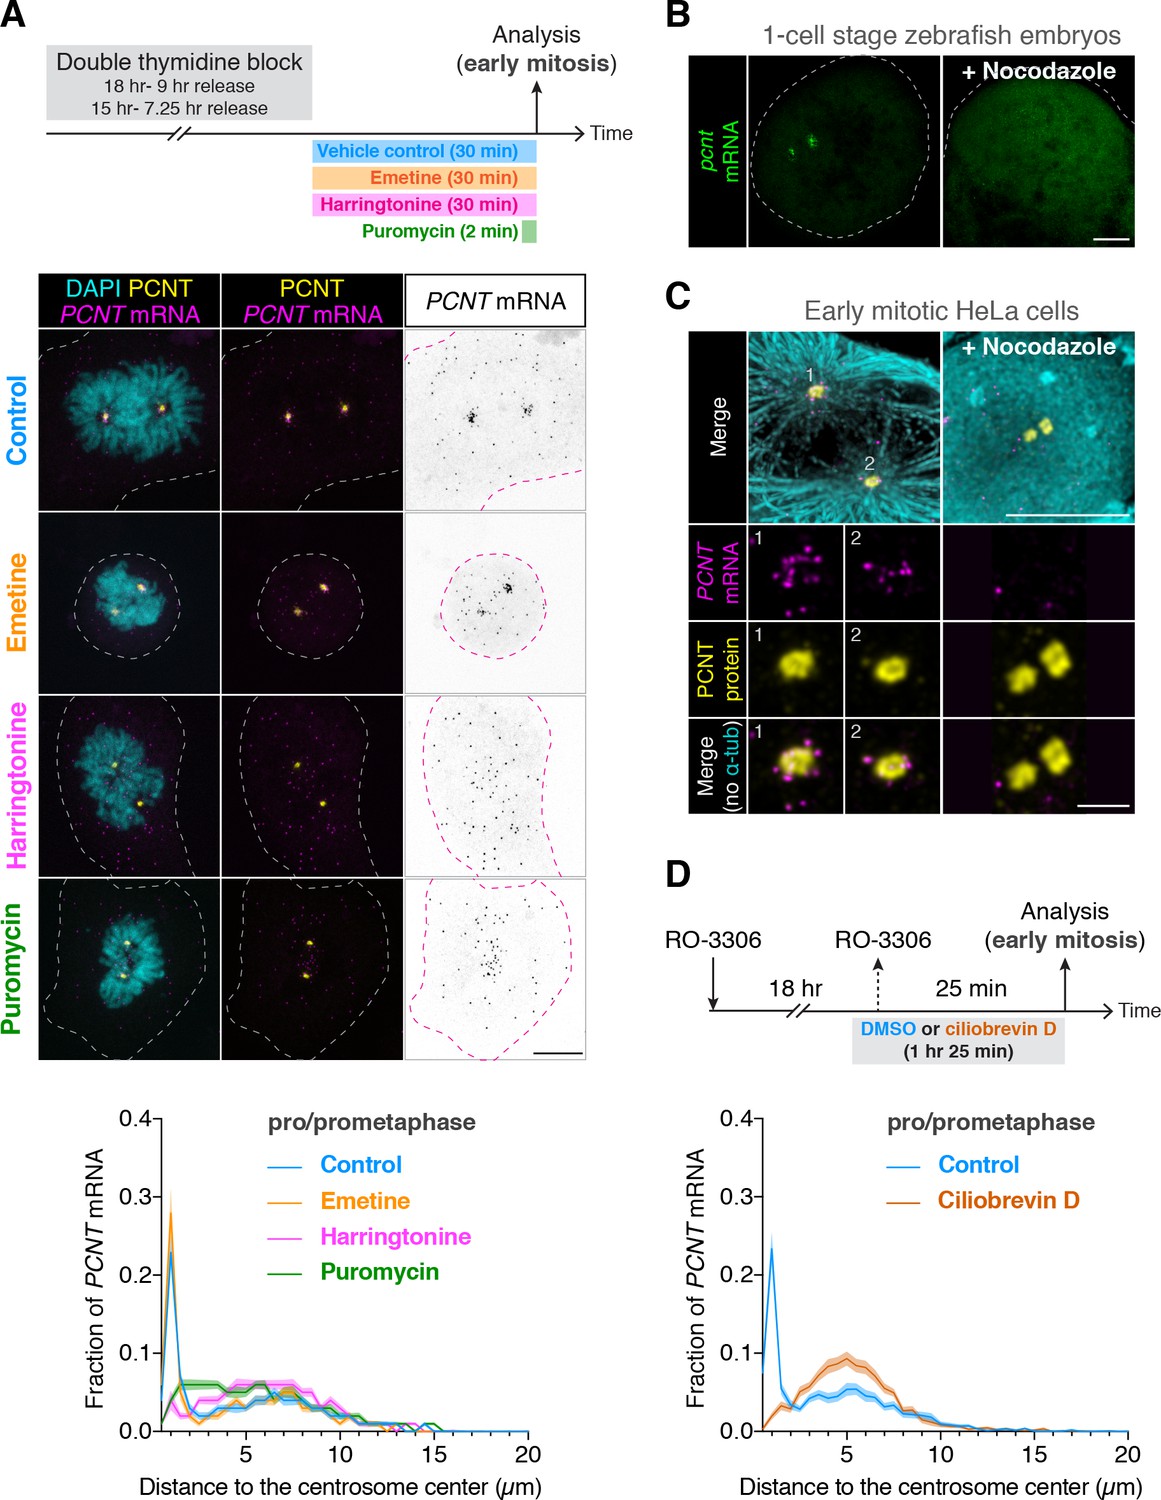
Centrosomal localization of pcnt/PCNT mRNA requires intact polysomes, microtubules, and dynein activity.
(A) HeLa cells were synchronized by a double thymidine block and treated with DMSO vehicle (Control), 208 µM emetine, 3.76 µM harringtonine for 30 min, or 300 µM puromycin for 2 min before anti-PCNT immunostaining and PCNT smFISH. Representative confocal images and quantification of the PCNT mRNA distribution are shown for each condition. The distribution of PCNT mRNA in cells was quantified by measuring the distance between 3D rendered PCNT smFISH signals and the center of the nearest centrosome (labeled by anti-PCNT immunostaining). The fractions of mRNA as a function of distance to the nearest centrosome (binned in 0.5 µm intervals) were then plotted as mean (solid lines) ±95% CI (shading) from three biological replicates. n = 48, 45, 57, and 51 cells for control, emetine, harringtonine, and puromycin conditions, respectively. Note that PCNT mRNA moved away from the centrosome upon the harringtonine or puromycin treatment, but stayed close to the centrosome upon the emetine treatment, similar to the control. (B) Zebrafish embryos were injected with DMSO vehicle or 100 µg/ml nocodazole at the one-cell stage followed by pcnt FISH. (C) HeLa cells were treated with DMSO vehicle or 3 µg/ml nocodazole for 2 hr at 37°C before anti-α-tubulin, anti-PCNT immunostaining, and PCNT smFISH. Note that pcnt/PCNT mRNA in early embryos (B) and in early mitotic cells (C) was no longer enriched at the centrosome after microtubules were depolymerized. (D) HeLa cells were synchronized by RO-3306 and treated with DMSO vehicle or 50 µM ciliobrevin D for 1 hr 25 min before anti-PCNT immunostaining and PCNT smFISH. The distribution of PCNT mRNA in cells was quantified as in (A). n = 63 and 70 cells for control and ciliobrevin D conditions, respectively, from a representative experiment (two technical duplicates per condition). Note that PCNT mRNA was no longer enriched at the centrosome upon the ciliobrevin D treatment. Dashed lines delineate the cell boundaries. Scale bars, 10 µm (A), 100 µm (C), 10 µm (D), and 2 µm (inset in D).
-
Figure 4—source data 1
The source data to plot the dot plots in Figure 4A and 4D.
- https://doi.org/10.7554/eLife.34959.021
Figure 4—figure supplement 1
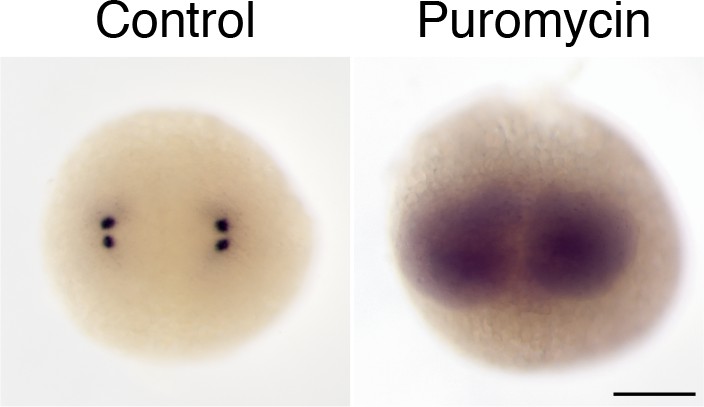
Centrosomal localization of zebrafish pcnt mRNA depends on intact polysomes.
RNA in situ hybridization showed that pcnt transcripts were localized to the centrosomes in the buffer-injected embryo (Control) but were diffused throughout the cell in the embryo injected with ~1 nl of 300 µM puromycin at the one-cell stage (Puromycin). Embryos shown are at the two-cell stage. >100 embryos were examined for each condition. Scale bar: 200 µm.
Figure 4—figure supplement 2
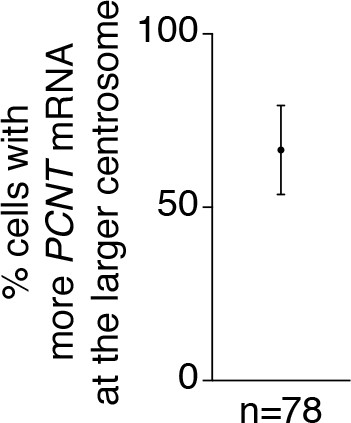
More PCNT mRNA was often enriched near the larger centrosome in early mitosis.
In the majority of prophase and prometaphase HeLa cells (~67%), more PCNT mRNA was enriched around the larger centrosome. Data are represented as mean ± SD, ‘n’ indicates the total number of cells analyzed from four biological replicates.
-
Figure 4—figure supplement 2—source data 1
The source data to plot Figure 4—figure supplement 2.
- https://doi.org/10.7554/eLife.34959.018
Figure 4—figure supplement 3
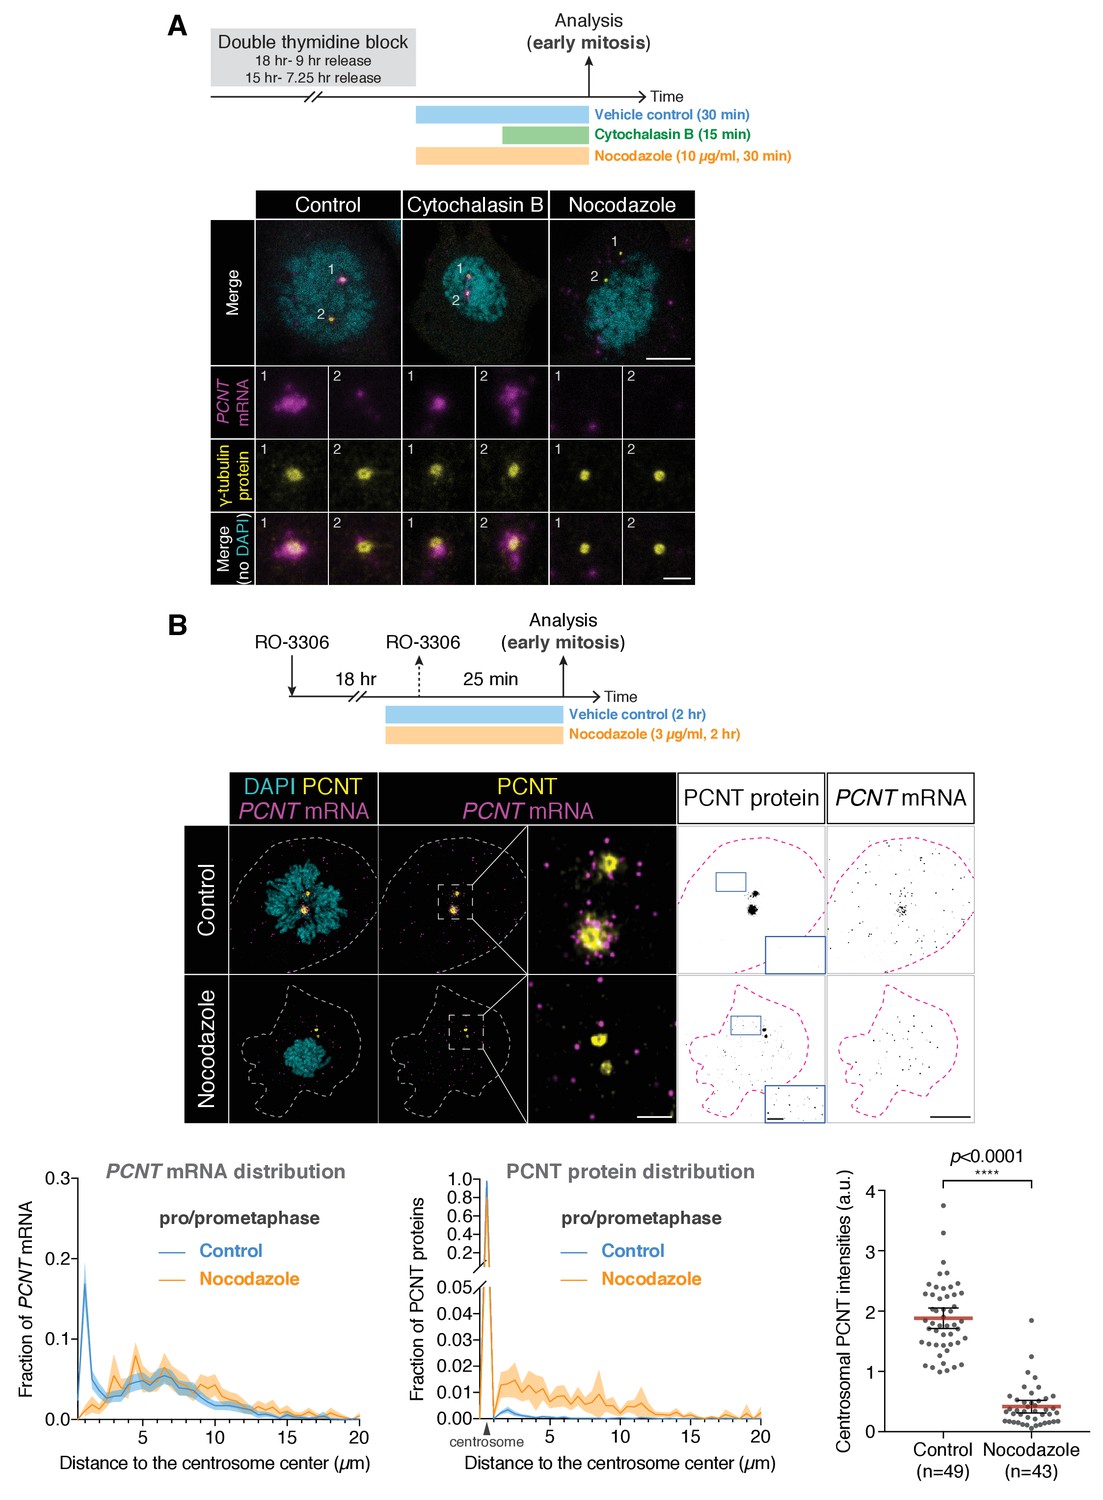
Centrosomal localization of human PCNT mRNA during early mitosis is microtubule-dependent.
(A) HeLa cells synchronized to prophase by double thymidine block were treated with 5 µg/ml cytochalasin B for 15 min or 10 µg/ml nocodazole for 30 min at 37°C before fluorescent in situ hybridization with tyramide signal amplification against PCNT mRNA and anti-γ-tubulin immunostaining. Note that nocodazole, but not cytochalasin B, disrupted the centrosomal enrichment of PCNT mRNA. (B) HeLa cells were synchronized to late G2 phase by RO-3306, treated with 3 µg/ml nocodazole for 1 hr 35 min, and then released into mitosis (25 min after RO-3306 washout) in the presence of 3 µg/ml nocodazole. After fixation, anti-PCNT N-terminus immunostaining and PCNT smFISH were performed, followed by quantifications of PCNT mRNA distribution, PCNT protein distribution, and centrosomal PCNT intensities. Representative images of vehicle- and nocodazole-treated cells were shown. Insets are two-fold magnifications of the box regions. Note that upon the nocodazole treatment, PCNT mRNA was no longer enriched at the centrosome and the centrosomal PCNT levels were reduced. Furthermore, in contrast to the vehicle-treated cells in which close to 100% of PCNT proteins was localized to centrosomes, in the nocodazole-treated cells, only ~80% of PCNT proteins was localized to centrosomes, while the rest ~20% of PCNT proteins was dispersed throughout the cytoplasm as small PCNT puncta (see the monochromic ‘PCNT protein’ images and quantification shown as a histogram). n = 49 and 43 cells for control and nocodazole-treated conditions, respectively, from a representative experiment (two technical duplicates per condition). Dashed lines delineate the cell boundaries. a.u., arbitrary unit. Scale bars, 10 µm and 2 µm (insets).
-
Figure 4—figure supplement 3—source data 1
The source data to plot the PCNT mRNA distribution, PCNT protein distribution, and PCNT protein intensities in Figure 4—figure supplement 3B
- https://doi.org/10.7554/eLife.34959.020
Figure 5

Centrosomal localization of PCNT mRNA/polysomes contributes to PCNT incorporation into mitotic centrosomes.
(A) Centrin-GFP RPE-1 cells—at either late G2 or early M phase—were subjected to anti-PCNT immunostaining. Representative confocal images are shown for each condition. A ‘fire’ lookup table (LUT) was used to show PCNT signal intensities. The sum intensity of anti-PCNT signals from both centrosomes of each cell was measured and plotted. (B) Numbers of PCNT mRNA at different cell cycle stages of Centrin-GFP RPE-1 cells were determined by PCNT smFISH. S phase/early G2 cells were identified by EdU labeling for 30 min. (C) HeLa cells were treated with vehicle control or 300 µM puromycin for 2 min before anti-PCNT immunostaining. The sum intensity of anti-PCNT signals from both centrosomes of each prophase or prometaphase cell was measured and plotted. Data are represented as mean ±95% CI. ‘n’ indicates the total number of cells analyzed from two (A), three (B), and two (C) biological replicates. p-values were obtained with Student’s t-test (two-tailed). a.u., arbitrary unit. Scale bar: 10 µm.
-
Figure 5—source data 1
The source data to plot the dot plots in Figure 5A–C.
- https://doi.org/10.7554/eLife.34959.023
Figure 6 with 1 supplement
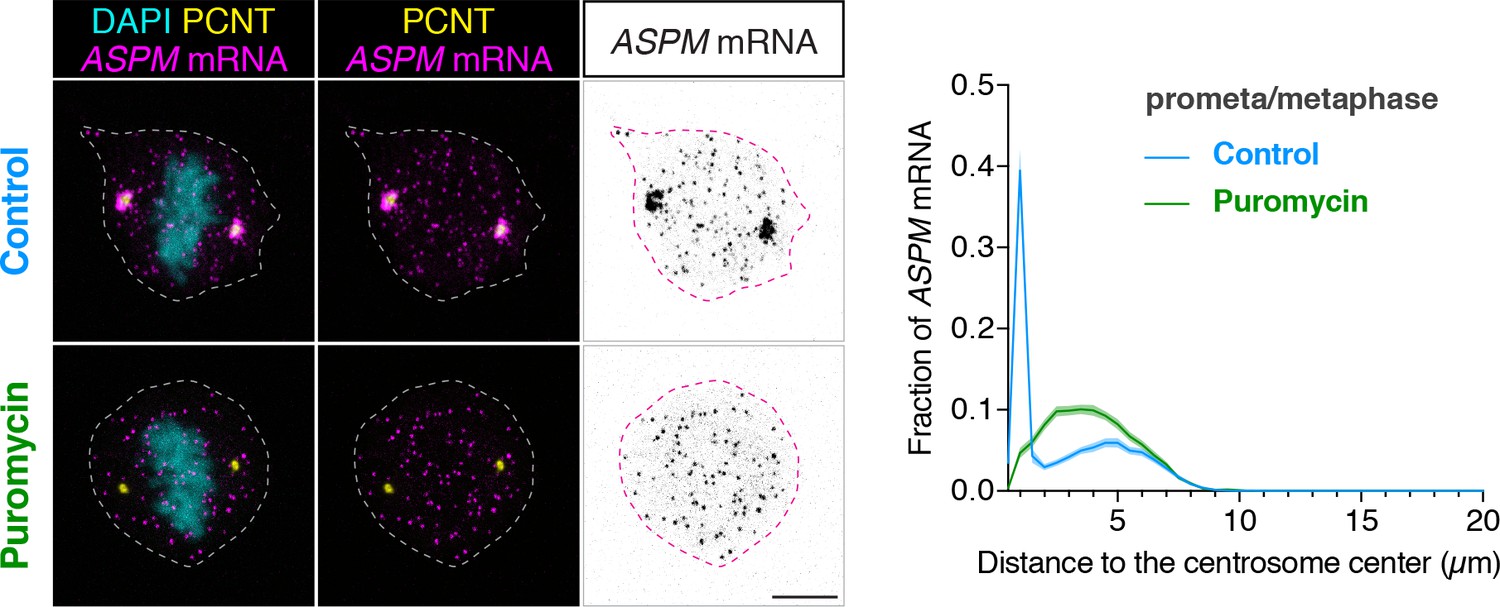
ASPM mRNA is enriched at centrosomes in a translation-dependent manner during mitosis.
Prometaphase/metaphase RPE-1 cells were treated with vehicle (Control) or 300 µM puromycin for 2 min at 37°C (Puromycin) before fixation, followed by anti-PCNT immunostaining and ASPM smFISH. Representative confocal images and quantification of the ASPM mRNA distribution are shown for each condition. The distribution of ASPM mRNA in cells was quantified by measuring the distance between 3D rendered ASPM smFISH signals and the center of the nearest centrosome (labeled by anti-PCNT immunostaining). The fractions of mRNA as a function of distance to the nearest centrosome (binned in 0.5 µm intervals) were then plotted as mean (solid lines)±95% CI (shading) from two biological replicates. n = 76 and 81 cells for control and puromycin conditions, respectively. Note that ASPM mRNA was enriched at the centrosomes/spindle poles of the metaphase cell, but became dispersed throughout the cell upon a short puromycin treatment. Scale bars: 10 µm.
-
Figure 6—source data 1
The source data to plot the histogram in Figure 6.
- https://doi.org/10.7554/eLife.34959.027
Figure 6—figure supplement 1
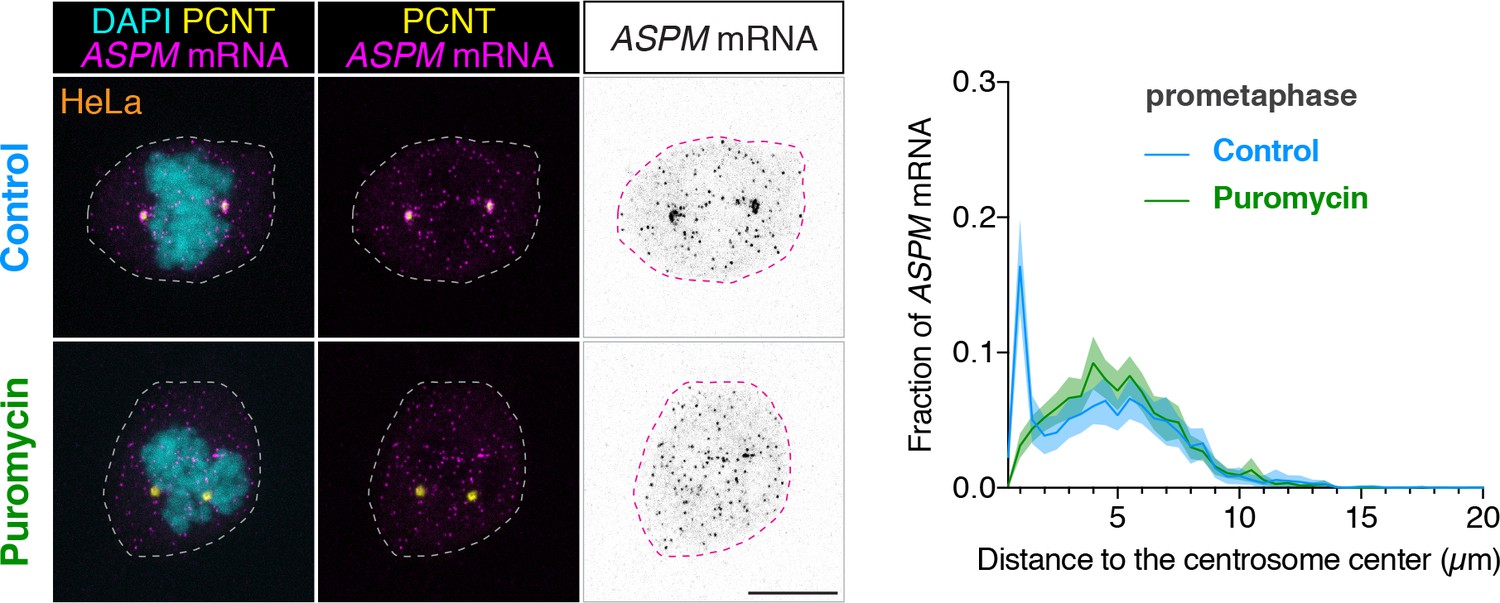
ASPM mRNA is enriched at centrosomes in a translation-dependent manner during mitosis.
Prometaphase HeLa cells were treated with vehicle (Control) or 300 µM puromycin for 2 min at 37°C (Puromycin) before fixation, followed by anti-PCNT immunostaining and ASPM smFISH. Representative confocal images and quantification of the ASPM mRNA distribution are shown for each condition. The distribution of ASPM mRNA in cells was quantified as in Figure 6. Data are from a representative experiment (two technical duplicates per condition). n = 17 and 27 cells for control and puromycin conditions, respectively. Note that ASPM mRNA was enriched at the centrosomes/spindle poles of the prometaphase cell, but became dispersed throughout the cell upon a short puromycin treatment. Scale bars: 10 µm.
-
Figure 6—figure supplement 1—source data 1
The source data to plot the histogram in Figure 6—figure supplement 1.
- https://doi.org/10.7554/eLife.34959.026
Figure 7
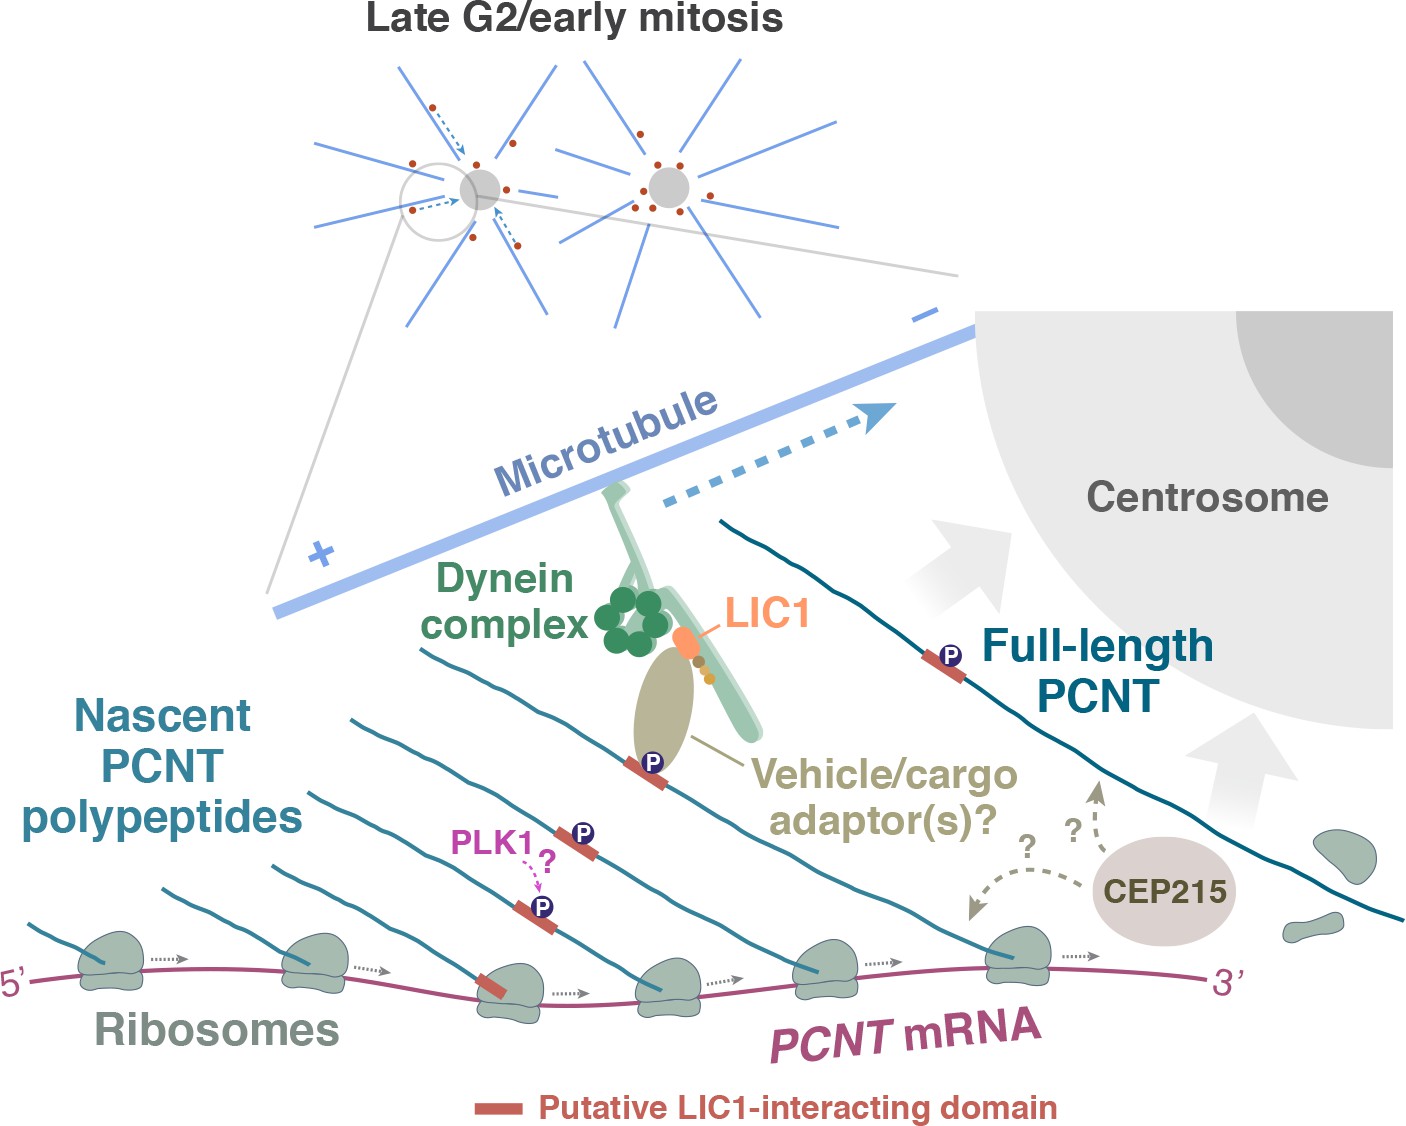
A model of co-translational targeting of PCNT polysomes toward the centrosome during centrosome maturation.
During the late G2/M transition, translation of PCNT mRNA is upregulated by an as yet unknown mechanism. The partially translated PCNT nascent polypeptide starts to interact with the dynein motor complex once the dynein light intermediate chain 1 (LIC1)-interacting domain in the N-terminal half of PCNT is synthesized and folded. It will be interesting to test if PLK1 phosphorylation of S1235 and S1241 within the LIC1-interacting domain initiates this PCNT-dynein interaction. Subsequently, this nascent polypeptide-dynein interaction allows the entire polysome, which is still actively translating PCNT mRNA, to be transported along the microtubule toward the centrosome. This co-translational targeting mechanism may maximize efficiency of PCNT production and delivery to the centrosome, prevent ectopic accumulation of PCNT outside of centrosomes, and/or facilitate integration of PCNT into the expanding PCM during early mitosis. It remains to be determined if other PCM components (e.g. CEP215) interact with PCNT co- and/or post-translationally.
Tables
Key resources table
| Reagent type | Reagent | Source | Cat. no. | Additional information |
|---|---|---|---|---|
| Chemical compound, drug | RO-3306 | R and D Systems, Minneapolis, MN | 4181 | |
| Chemical compound, drug | Ciliobrevin D | MilliporeSigma, Burlington, MA | 250401 | |
| Chemical compound, drug | Nocodazole | Sigma-Aldrich, St. Louis, MO | M1404 | |
| Chemical compound, drug | Cytochalasin B | ACROS Organics, Geel, Belgium | 228090250 | |
| Chemical compound, drug | Cycloheximide | Alfa Aesar, Tewksbury, MA | J66901 | |
| Chemical compound, drug | Emetine | MilliporeSigma, Burlington, MA | 324693 | |
| Chemical compound, drug | Puromycin | MilliporeSigma, Burlington, MA | 540222 | |
| Chemical compound, drug | Harringtonine | LKT Laboratories, St. Paul, MN | H0169 | |
| Antibody | Rabbit anti-PCNT N terminus | Abcam, Cambridge, MA | Abcam Cat# ab4448, RRID:AB_304461 | 1:500 or 1:1000 dilution |
| Antibody | Goat anti-PCNT C terminus | Santa Cruz Biotechnology Inc., Santa Cruz, CA | Santa Cruz Biotechnology Cat# sc-28145, RRID:AB_2160666 | 1:500 dilution |
| Antibody | Mouse anti-γ-tubulin | Sigma-Aldrich, St. Louis, MO | Sigma-Aldrich Cat# T6557, RRID:AB_477584 | 1:1000 dilution |
| Antibody | Rabbit anti-phospho-Histone H3(Ser10) | MilliporeSigma, Burlington, MA | MilliporeSigma Cat# 06–570, RRID:AB_310177 | 1:500 dilution |
| Antibody | Mouse anti-ribosomal protein S6 | Santa Cruz Biotechnology Inc., Santa Cruz, CA | Santa Cruz Biotechnology Cat# sc-28145, RRID:AB_1129205 | 1:500 dilution |
| Antibody | Sheep anti-digoxigenin-alkaline phosphatase | Roche Diagnostics, Mannheim, Germany | Roche Cat# 11093274910, RRID:AB_514497 | 1:5000 dilution |
| Antibody | Sheep anti-digoxigenin-peroxidase | Roche Diagnostics, Mannheim, Germany | Roche Cat# 11207733910, RRID:AB_514500 | 1:500 dilution |
| Commercial assay or kit | MEGAshortscript T7 kit | Thermo Fisher Scientific, Waltham, MA | AM1354 | |
| Commercial assay or kit | mMESSAGE mMACHINE T3 kit | Thermo Fisher Scientific, Waltham, MA | AM1348 | |
| Commercial assay or kit | Click-iT EdU Imaging Kit | Life Technologies, Carlsbad, CA | C10337 | |
| Model organism | Wild-type NHGRI-1 fish | A gift from Shawn Burgess, NHGRI/NIH, Bethesda, MA | ZIRC Cat# ZL12751, RRID:ZIRC_ZL12751 | |
| Model organism | pcnttup2 fish | This study | ||
| Model organism | pcnttup5 fish | This study | ||
| Cell line | HeLa cells | ATCC CCL-2. A gift from Susan Wente, Vanderbilt University, Nashville, TN | ATCC Cat# CCL-2, RRID:CVCL_0030 | |
| Cell line | RPE-1 cells | A gift from Irina Kaverina, Vanderbilt University, Nashville, TN | ATCC Cat# CRL-4000, RRID:CVCL_4388 | |
| Cell line | HeLa cells stably expressing scFv-sfGFP-GB1 and NLS-tdPCP-tdTomato | A gift from Xiaowei Zhuang, Howard Hughes Medical Institute, Harvard University, Cambridge, MA | ||
| Cell line | RPE-1 cells expressing Centrin-GFP | A gift from Alexey Khodjakov, Wadsworth Center, 485 New York State Department of Health, Rensselaer Polytechnic Institute, Albany, NY | ||
| Software | Huygens Professional | Scientific Volume Imaging b.v., Hilversum, Netherlands | Huygens Software, RRID:SCR_014237 | |
| Software | Imaris | Bitplane, Belfast, UK | Imaris, RRID:SCR_007370 | |
| Software | MATLAB | MathWorks, Natick, MA | MATLAB, RRID:SCR_001622 | |
| Software | Prism 7 | GraphPad, CA | Graphpad Prism, RRID:SCR_002798 |
Additional files
-
Supplementary file 1
Sequences of antisense probes used in RNA in situ hybridization in zebrafish and cultured cells.
- https://doi.org/10.7554/eLife.34959.029
-
Supplementary file 2
Sequence of the genomic target site of zebrafish pcnt and oligonucleotides for making the customized gRNA expression construct.
The sense strand of the target site is shown.
- https://doi.org/10.7554/eLife.34959.030
-
Supplementary file 3
PCR primer sequences for amplifying the zebrafish pcnt CRISPR target region and generating antisense probes for in situ hybridization.
- https://doi.org/10.7554/eLife.34959.031
-
Transparent reporting form
- https://doi.org/10.7554/eLife.34959.032
Download links
A two-part list of links to download the article, or parts of the article, in various formats.
Downloads (link to download the article as PDF)
Open citations (links to open the citations from this article in various online reference manager services)
Cite this article (links to download the citations from this article in formats compatible with various reference manager tools)
Co-translational protein targeting facilitates centrosomal recruitment of PCNT during centrosome maturation in vertebrates
eLife 7:e34959.
https://doi.org/10.7554/eLife.34959


