Reduced expression of C/EBPβ-LIP extends health and lifespan in mice
- University Medical Centre Groningen, University of Groningen, Netherlands
- Leibniz Institute on Aging - Fritz Lipmann Institute, Germany
- University of Ulm, Germany
- Utrecht University, Netherlands
- University Medical Center Groningen, University of Groningen, Netherlands
Figures
Figure 1 with 1 supplement
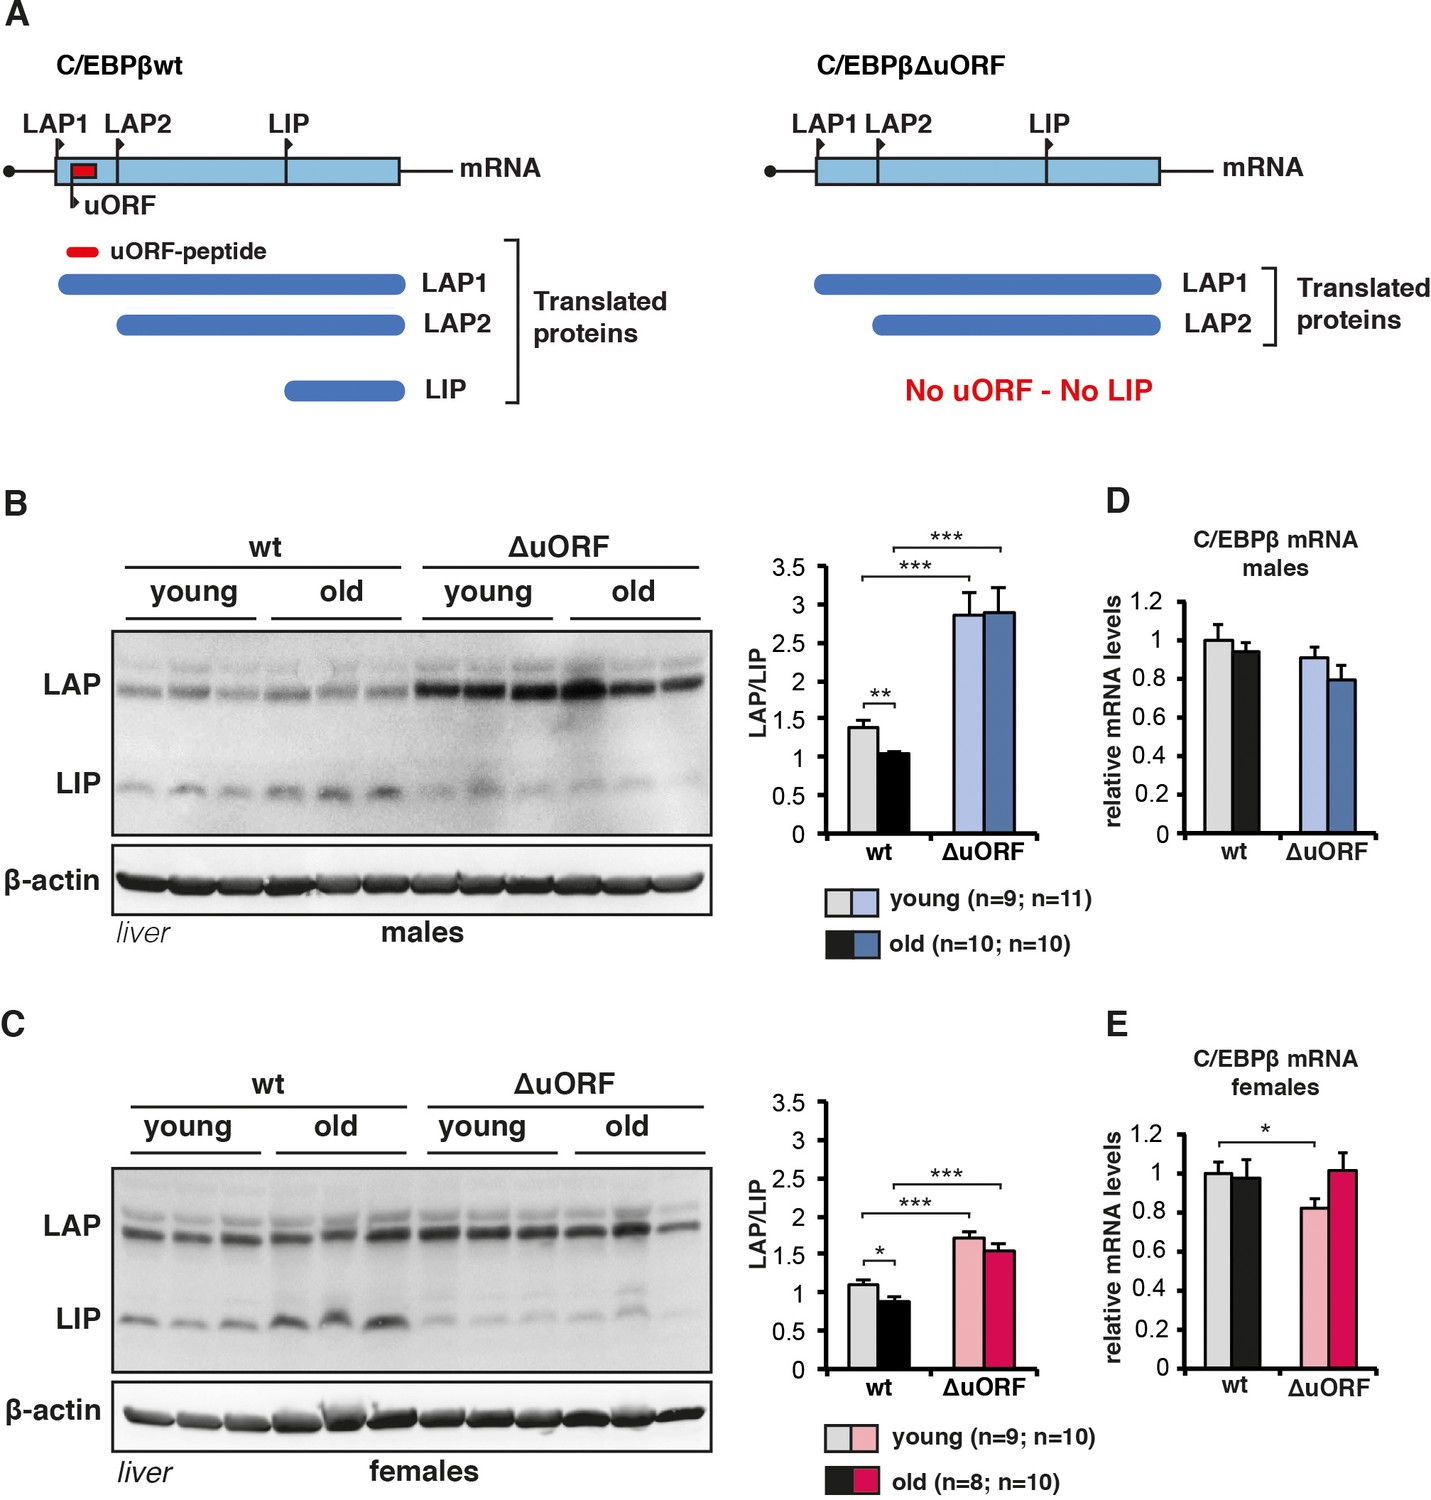
C/EBPβ LAP/LIP isoform ratio increases upon ageing.
(A) The graph at the left shows that wt C/EBPβ-mRNA is translated into LAP1 and LAP2 through regular translation initiation, while translation into LIP involves a primary translation of the uORF followed by translation re-initiation at the downstream LIP-AUG by post-uORF-translation ribosomes. The graph at the right shows that genetic ablation of the uORF abolishes translation into LIP, but leaves translation into LAP1 and LAP2 unaffected (for detailed description see [Calkhoven et al., 2000; Zidek et al., 2015]). (B and C) Immunoblots of liver samples from young (5 months) and old (female 20 months, male 22 months) wt and C/EBPβΔuORF (B) males and (C) females showing LAP and LIP isoform expression. β-actin expression served as loading control. The LAP/LIP isoform ratio as calculated from quantification by chemiluminescence digital imaging of immunoblots is shown at the right (wt males n = 9 young, n = 10 old; C/EBPβΔuORF males, n = 11 young, n = 10 old; wt females, n = 9 young, n = 8 old; C/EBPβΔuORF females, n = 10 young, n = 10 old). (D and E) C/EBPβ mRNA levels as determined by quantitative real-time PCR in (D) males (wt, n = 11 young, n = 11 old; C/EBPβΔuORF, n = 11 young, n = 9 old) and in (E) females (wt, n = 9 young, n = 11 old; C/EBPβΔuORF, n = 9 young, n = 11 old). P-values were determined by Student’s t-test, *p<0.05; **p<0.01; ***p<0.001.
Figure 1—figure supplement 1
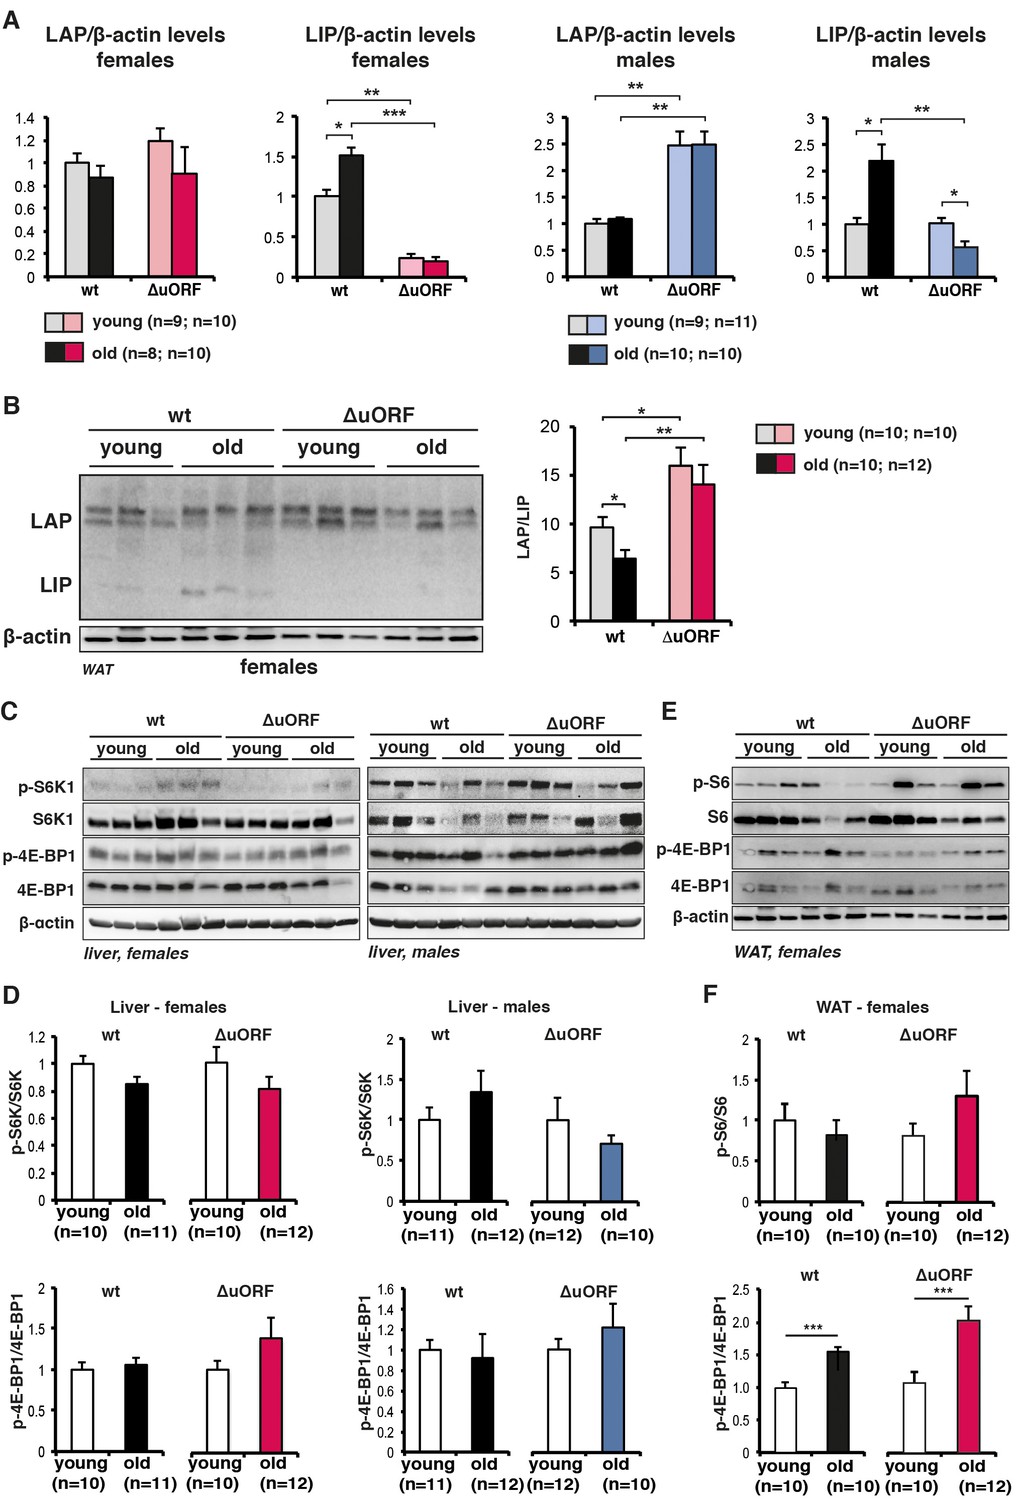
Analysis of C/EBPβ LAP/LIP isoform ratio and mTORC1 signalling upon ageing.
(A) Quantification chemiluminescence digital imaging of LAP or LIP signals in livers in respect to β-actin levels using immunoblots presented in Figure 1A and B and additional immunoblots from young (5 month) and old (female 20 months, male 22 months) mice (wt females, n=9 young and old; wt males, n=10 young, n=11 old; C/EBPβΔuORF females, n=10 young, n=11 old; C/EBPβΔuORF males, n=11 young, n=10 old). P-values were determined by Student’s t-test, *p<0.05; **p<0.01; ***p<0.001. (B) Immunoblots of WAT samples from young (5 months) and old (20 months) wt and C/EBPβΔuORF females showing LAP and LIP isoform expression. β-actin expression served as loading control. The LAP/LIP isoform ratio as calculated from quantification by chemiluminescence digital imaging of this and additional immunoblots is shown at the right (wt females, n=10 wt young, n=10 old; C/EBPβΔuORF females, n=10 young, n=12 old). (C) Immunoblots show pan-levels and phosphorylation of the mTORC1 downstream targets S6K1 and 4E-BP1 in liver extracts from young (5 month) and old (females 20 months, males 22 months) of female (left) and male (right) wt and C/EBPβΔuORF mice. The β-actin loading control blots are the same as for Figure 1B and C respectively. (D) Quantification by chemiluminescence digital imaging of phosphorylated proteins in respect to the respective pan levels from the blots presented in (C) and from additional immunoblots (wt females, n=10 young, n=11 old; wt males, n=11 young, n=12 old; C/EBPβΔuORF females, n=10 young, n=12 old; C/EBPβΔuORF males, n=12 young, n=10 old). (E) Immunoblots show pan-levels and phosphorylation of the mTORC1 downstream targets S6 and 4E-BP1 in WAT extracts from young (5 month) and old (20 months) female wt and C/EBPβΔuORF mice. The β-actin loading control blot is the same as in panel B. (F) Quantification by chemiluminescence digital imaging of phosphorylated proteins in respect to the respective pan levels from the blots presented in (E) and from additional immunoblots (wt females, n=10 young, n=10 old; C/EBPβΔuORF females, n=10 young, n=12 old). P-values were determined by Student’s t-test, *p<0.05; **p<0.01; ***p<0.001.
Figure 2 with 1 supplement
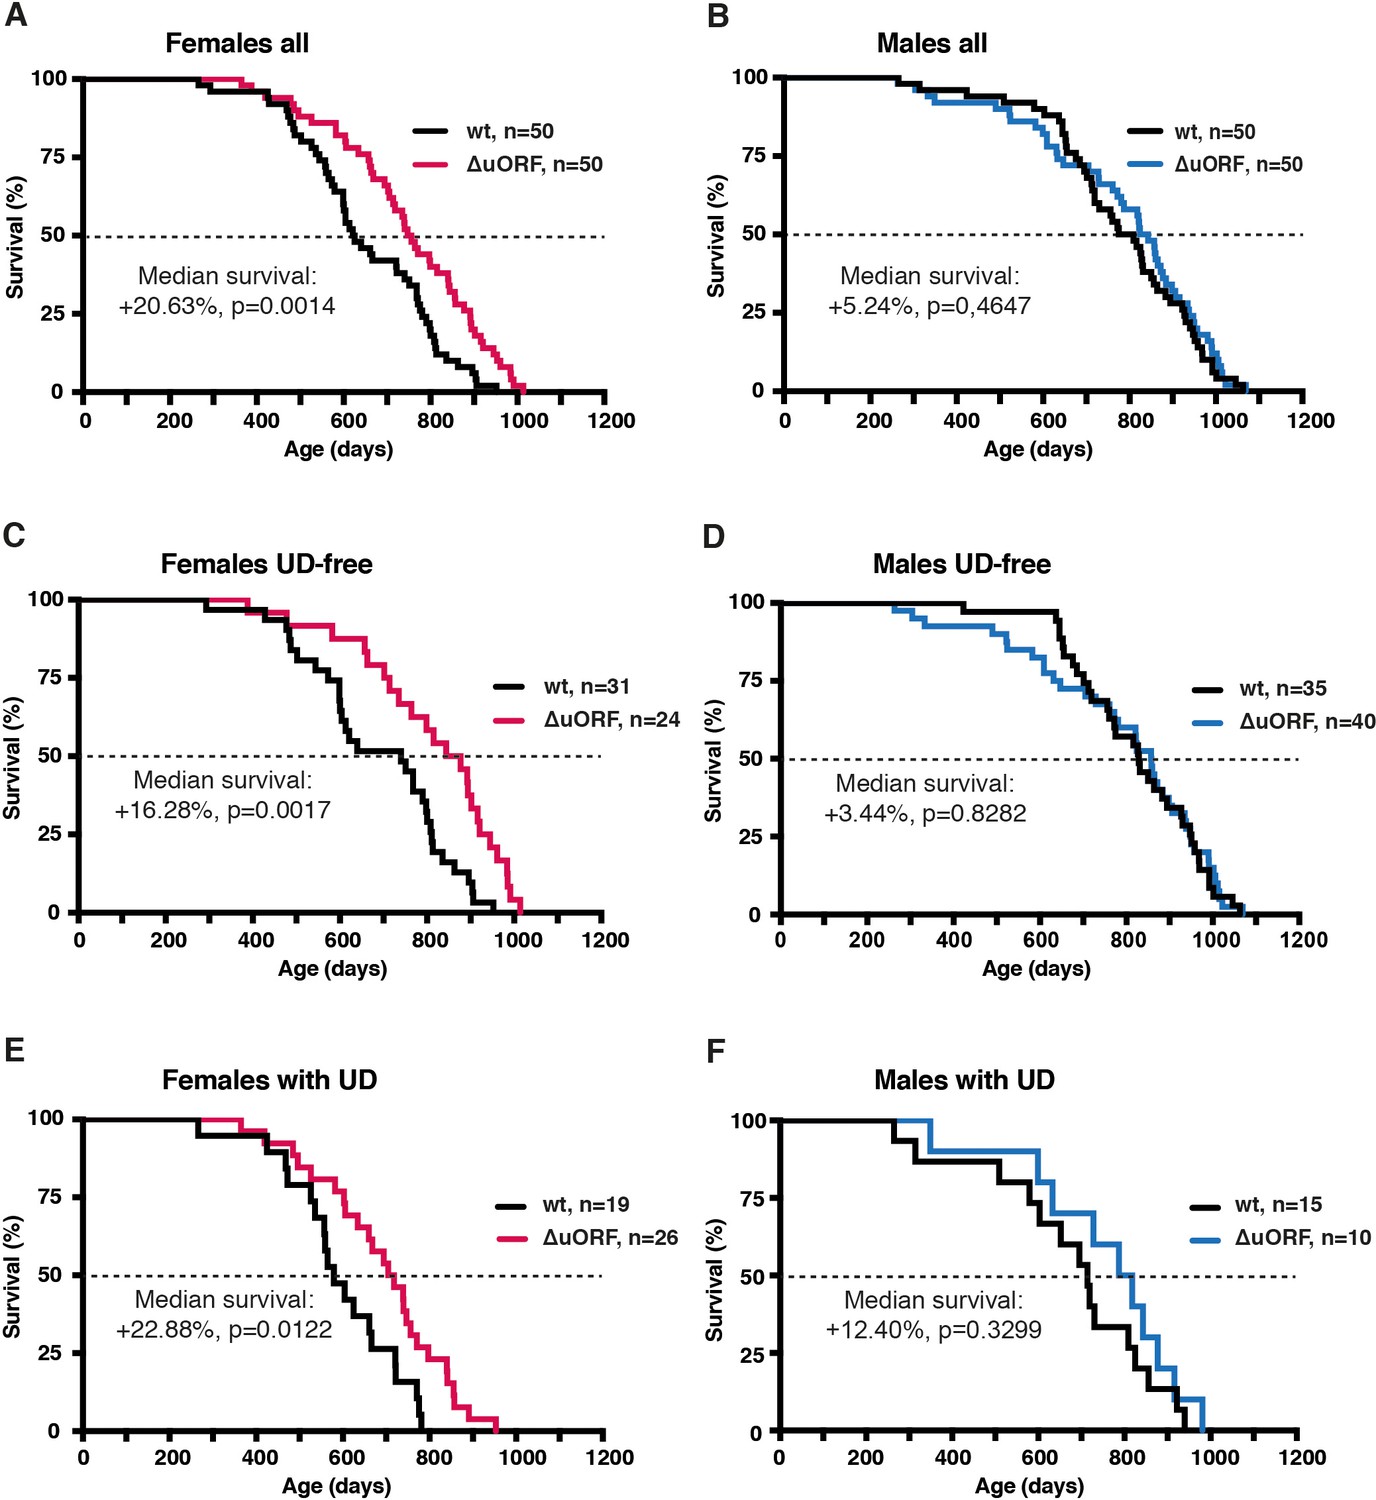
Increased survival of female C/EBPβΔuORF mice.
Survival curves of (A) the complete female cohorts, (B) complete male cohorts, (C) the UD-free female cohorts, (D) UD-free male cohorts, (E) female mice with UD and (F) male mice with UD with the survival curves of wt or C/EBPβΔuORF mice indicated. The increase in median survival (%) of C/EBPβΔuORF compared to wt littermates and statistical significance of the increase in the overall survival as determined by the log-rank test is indicated in the figure.
Figure 2—figure supplement 1
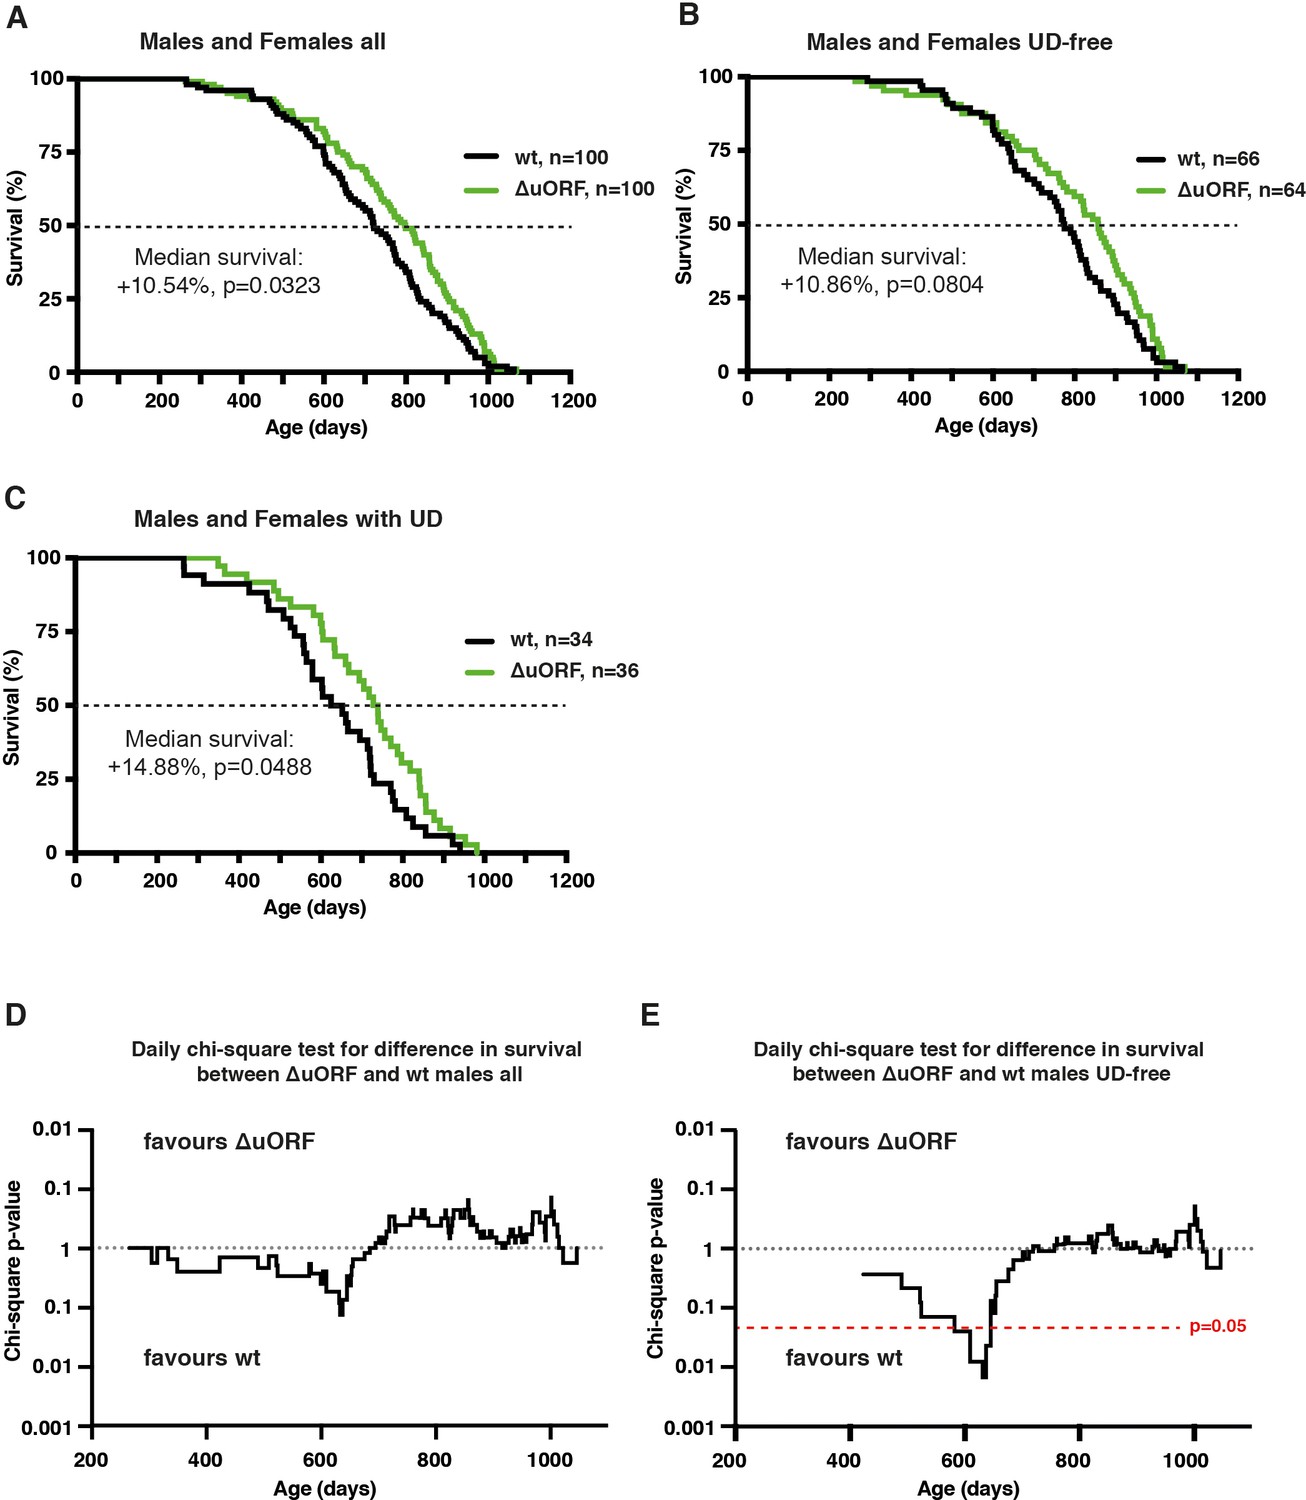
Survival curves of combined male and female cohorts and daily chi-square test for male cohorts.
Survival curves of wt and C/EBPβΔuORF mice with females and males combined of (A) the complete cohorts, (B) UD-free mice cohorts and (C) cohorts of mice with UD. For survival curves the increase in median survival (%) of the C/EBPβΔuORF compared to wt mice and statistical significance of the increase in the overall survival as determined by the log-rank test is indicated in the figure. (D,E) Daily chi-square test of differences in survival for C/EBPβΔuORF versus wt male mice of the complete cohort (D) and the UD-free cohort (E). The upper part of the diagrams reflects increased survival of C/EBPβΔuORF males while the lower part reflects increased survival of wt males. The red line indicates the significance threshold (p=0.05).
Figure 3 with 1 supplement
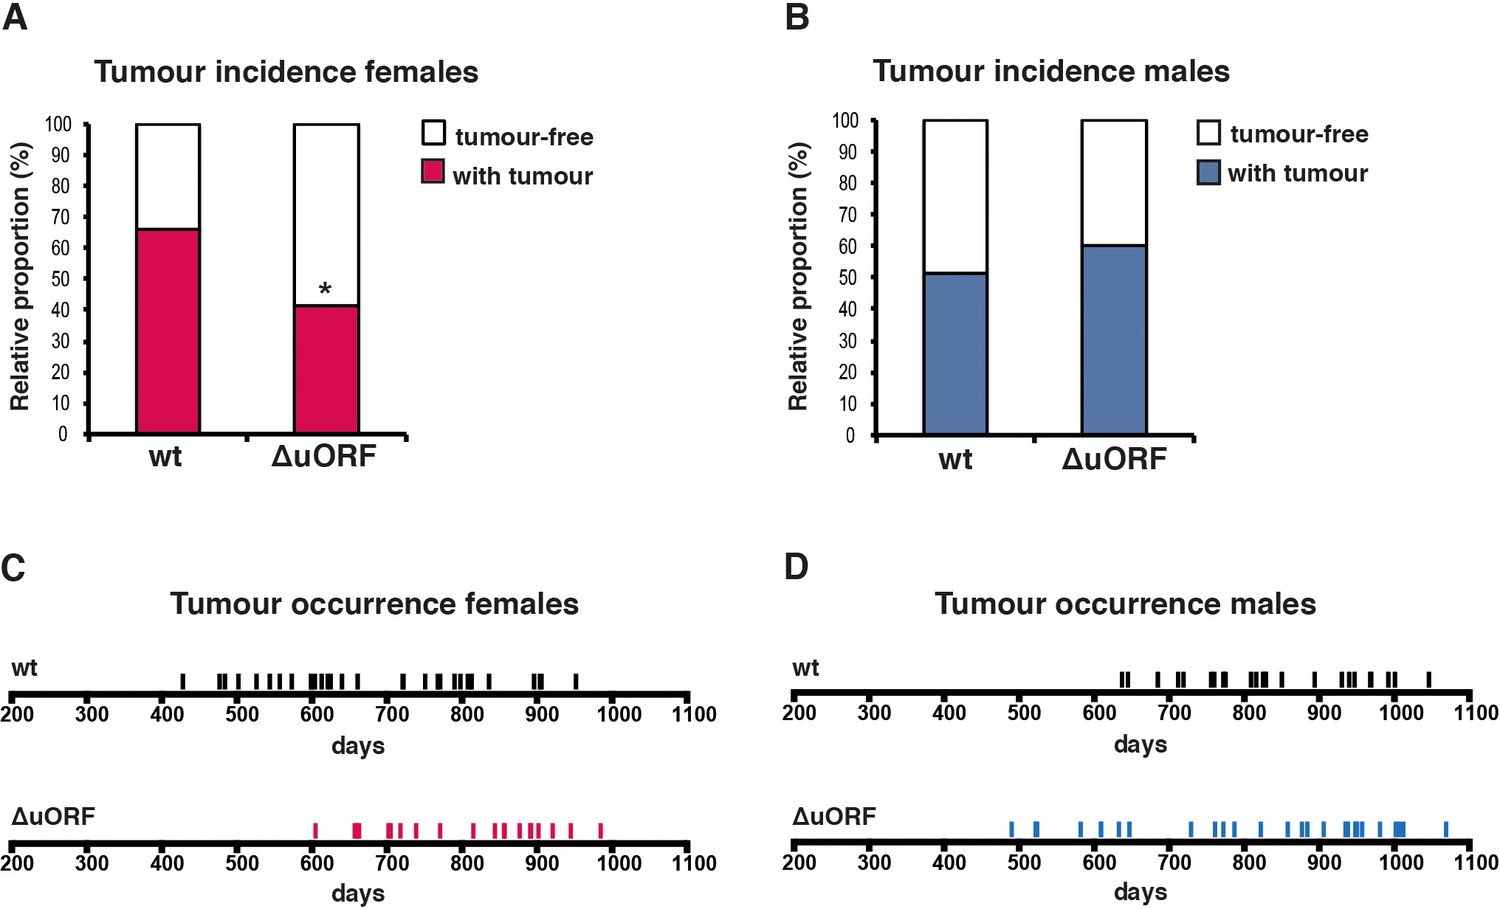
Reduced incidence and delayed occurrence of tumours in female C/EBPβΔuORF mice.
(A) Tumour incidence of females as determined by pathological examination of neoplasms found upon necropsy of mice from the lifespan cohorts (wt, n = 50; C/EBPβΔuORF, n = 48). Statistical significance was calculated using Fisher’s exact test with *p<0.05. (B) Tumour incidence of males as determined by pathological examination of neoplasms found upon necropsy (wt, n = 47; C/EBPβΔuORF, n = 45. (C) Tumour occurrence in the female lifespan cohorts upon necropsy is shown for wt (black lines) and C/EBPβΔuORF mice (red lines). (D) Tumour occurrence in the male lifespan cohorts upon necropsy is shown for wt (black lines) and C/EBPβΔuORF mice (blue lines).
Figure 3—figure supplement 1
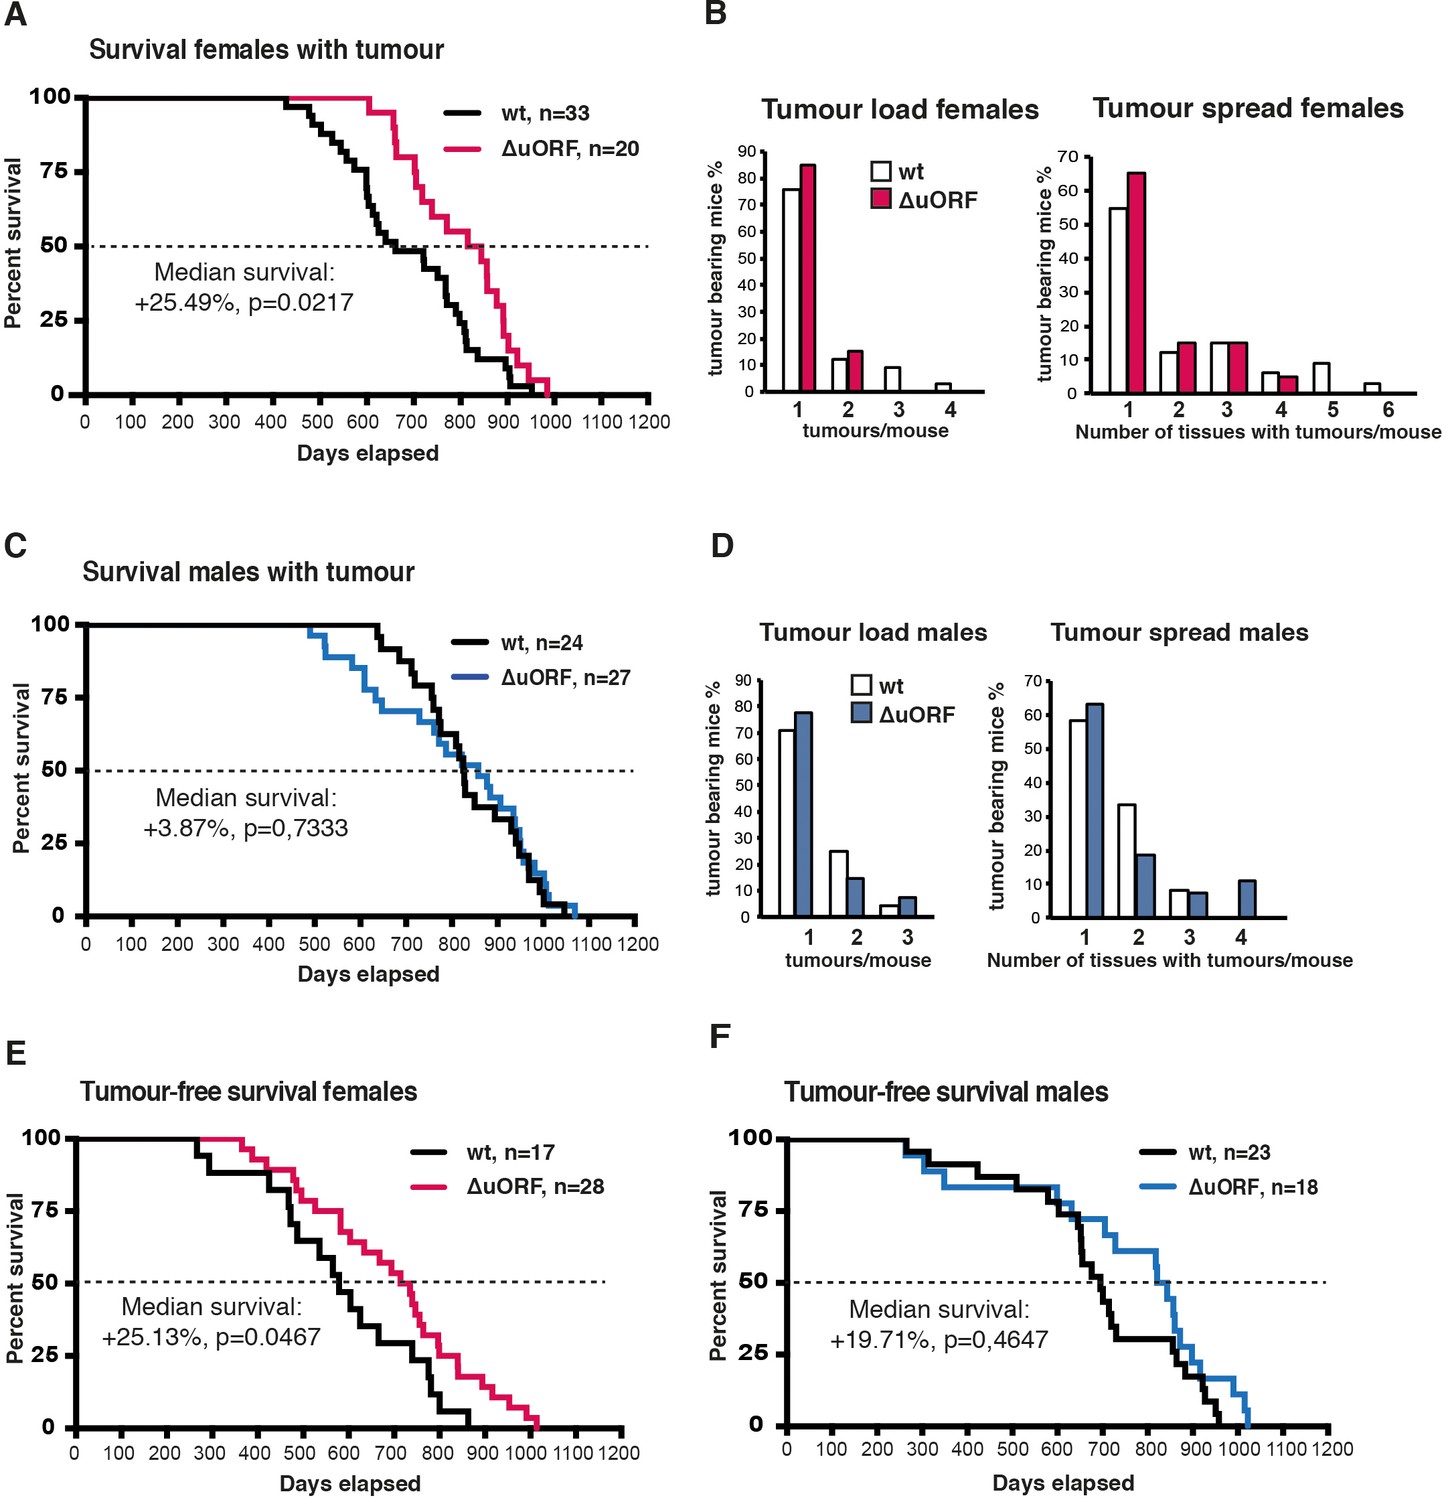
Analysis of tumour related survival, and tumour load and spread.
(A) Survival curves of wt and C/EBPβΔuORF tumour-bearing female mice. (B) At the left, tumour load in wt and C/EBPβΔuORF females as determined by the number of different tumour types found per tumour bearing mouse. At the right, tumour spread in wt and C/EBPβΔuORF females as determined by the number of tissues affected by tumours in tumour bearing mice irrespective of the tumour type (in case different tumour types were found in the same tissue it was counted as >1). (C) Survival curves of wt and C/EBPβΔuORF tumour-bearing male mice. (D) At the left tumour load and at the right tumour spread in wt and C/EBPβΔuORF males as described under (C). (E) Survival curves of wt and C/EBPβΔuORF tumour-free female mice. (F) Survival curves of wt and C/EBPβΔuORF tumour-free male mice. For survival curves the increase in median survival (%) of the C/EBPβΔuORF compared to wt mice and statistical significance of the increase in the overall survival as determined by the log-rank test is indicated in the figure.
Figure 4 with 1 supplement
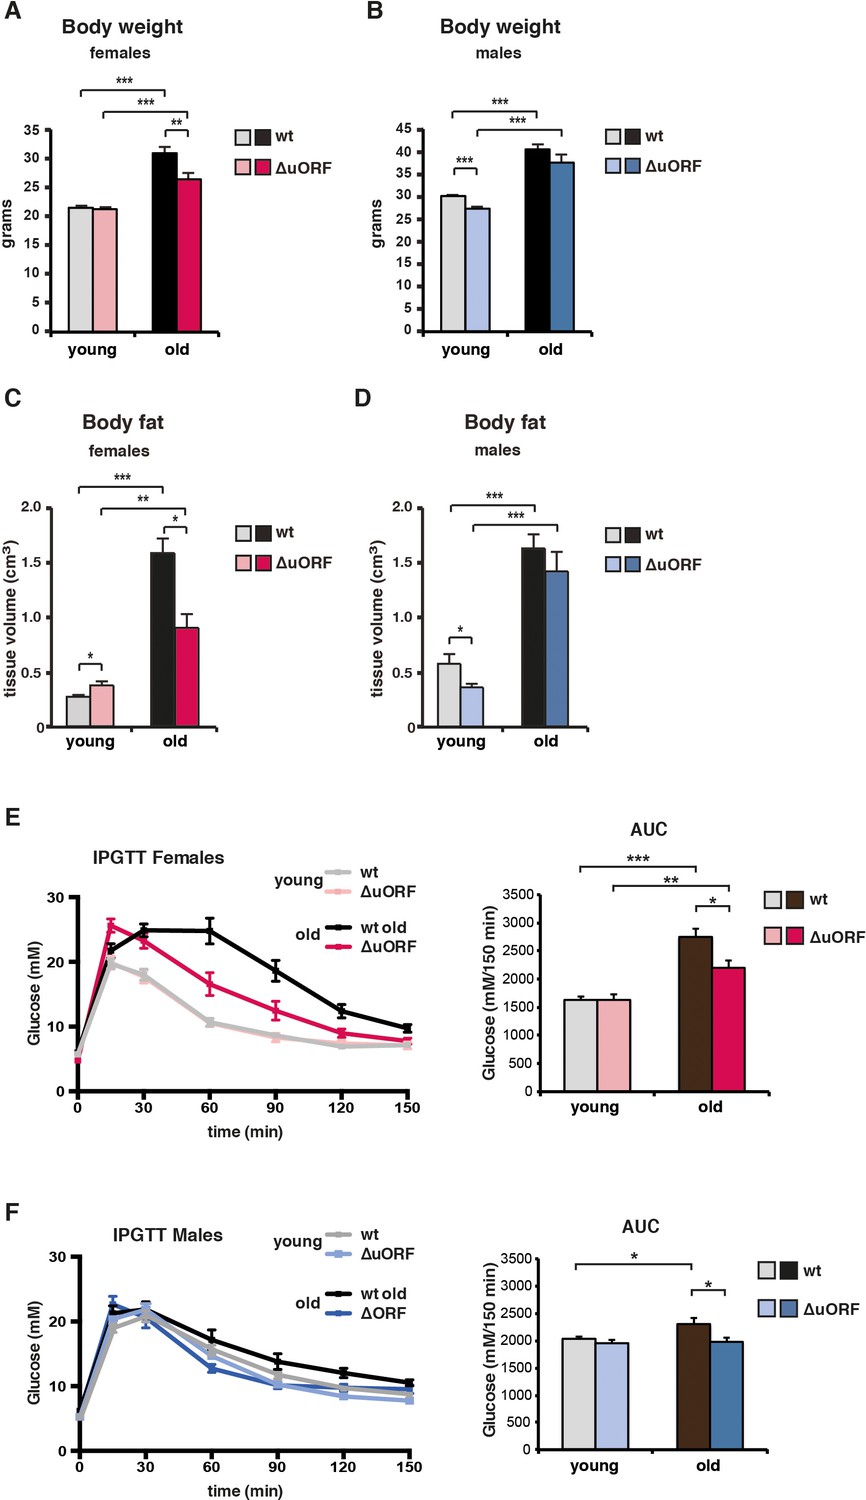
Ageing-associated increase in body weight, fat content and glucose tolerance is attenuated in female C/EBPβΔuORF mice.
(A) Body weight (g) of young (4 months) and old (19 months) female mice (wt, n = 11 young, n = 12 old; C/EBPβΔuORF, n = 11 young, n = 12 old). (B) Body weight of young (4 months) and old (21 months) male mice (wt, n = 12 young and old; C/EBPβΔuORF, n = 12 young, n = 11 old). (C) Body fat content (cm3) as determined by CT analysis of young (4 months) and old (19 months) female mice (wt, n = 11 young and old; C/EBPβΔuORF, n = 9 young, n = 11 old). (D) Body fat content of young (4 months) and old (21 months) male mice (wt, n = 12 young and old wt; C/EBPβΔuORF, n = 11 young, n = 9 old). (E and F) i.p.-Glucose Tolerance Test (IPGTT) was performed with young (4 months) and old (female 19 months, male 21 months) wt and C/EBPβΔuORF (E) females and (F) males. The area under the curve (AUC) at the right shows the quantification (wt females, n = 9 young, n = 10 old; C/EBPβΔuORF females, n = 10 young, n = 11 old; wt males, n = 12 young, n = 11 old; C/EBPβΔuORF males, n = 11 young, n = 10 old). P-values were determined by Student’s t-test, *p<0.05; **p<0.01; ***p<0.001.
Figure 4—figure supplement 1
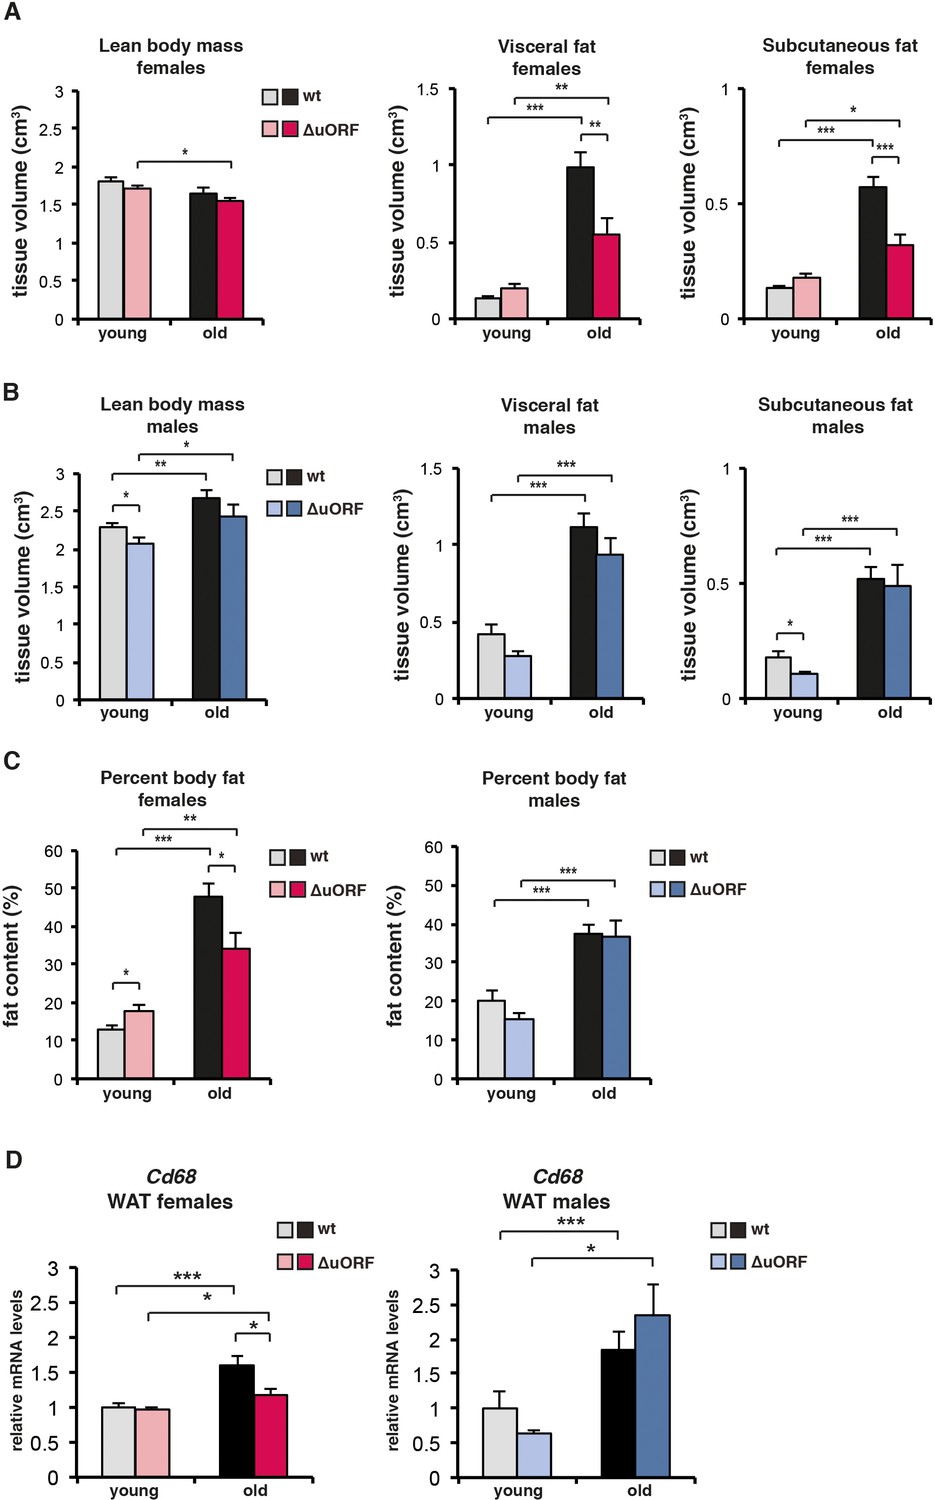
Analysis of lean body mass, fat volume, and expression of theCd68macrophage marker in young and old mice.
(A-C) Body composition of young (4 months) and old (females 19 months, males 21 months) wt and C/EBPβΔuORF mice was determined by computer tomography (CT) analysis. (A) The bar graphs show tissue volumes (cm3) of lean body mass, visceral fat and subcutaneous fat for females, and (B) for males. (C) Percentage of body fat for females (left) or males (right). (wt females, n=11 young and old; wt males, n=12 young and old; C/EBPβΔuORF females, n=9 young, n=11 old; C/EBPβΔuORF males, n=11 young, n=9 old). (D) RelativeCd68-mRNA levels as determined by quantitative real-time PCR in visceral fat of young (5 months) and old (females 20 months, males 22 months) wt and C/EBPβΔuORF females (left) and males (right) as a measure for macrophage infiltration (wt females, n=11 young and old; wt males, n=11 young, n=12 old; C/EBPβΔuORF females, n=11 young and old; C/EBPβΔuORF males, n=11 young, n=10 old). P-values were determined by Student’s t-test, *p<0.05; **p<0.01; ***p<0.001.
Figure 5 with 1 supplement
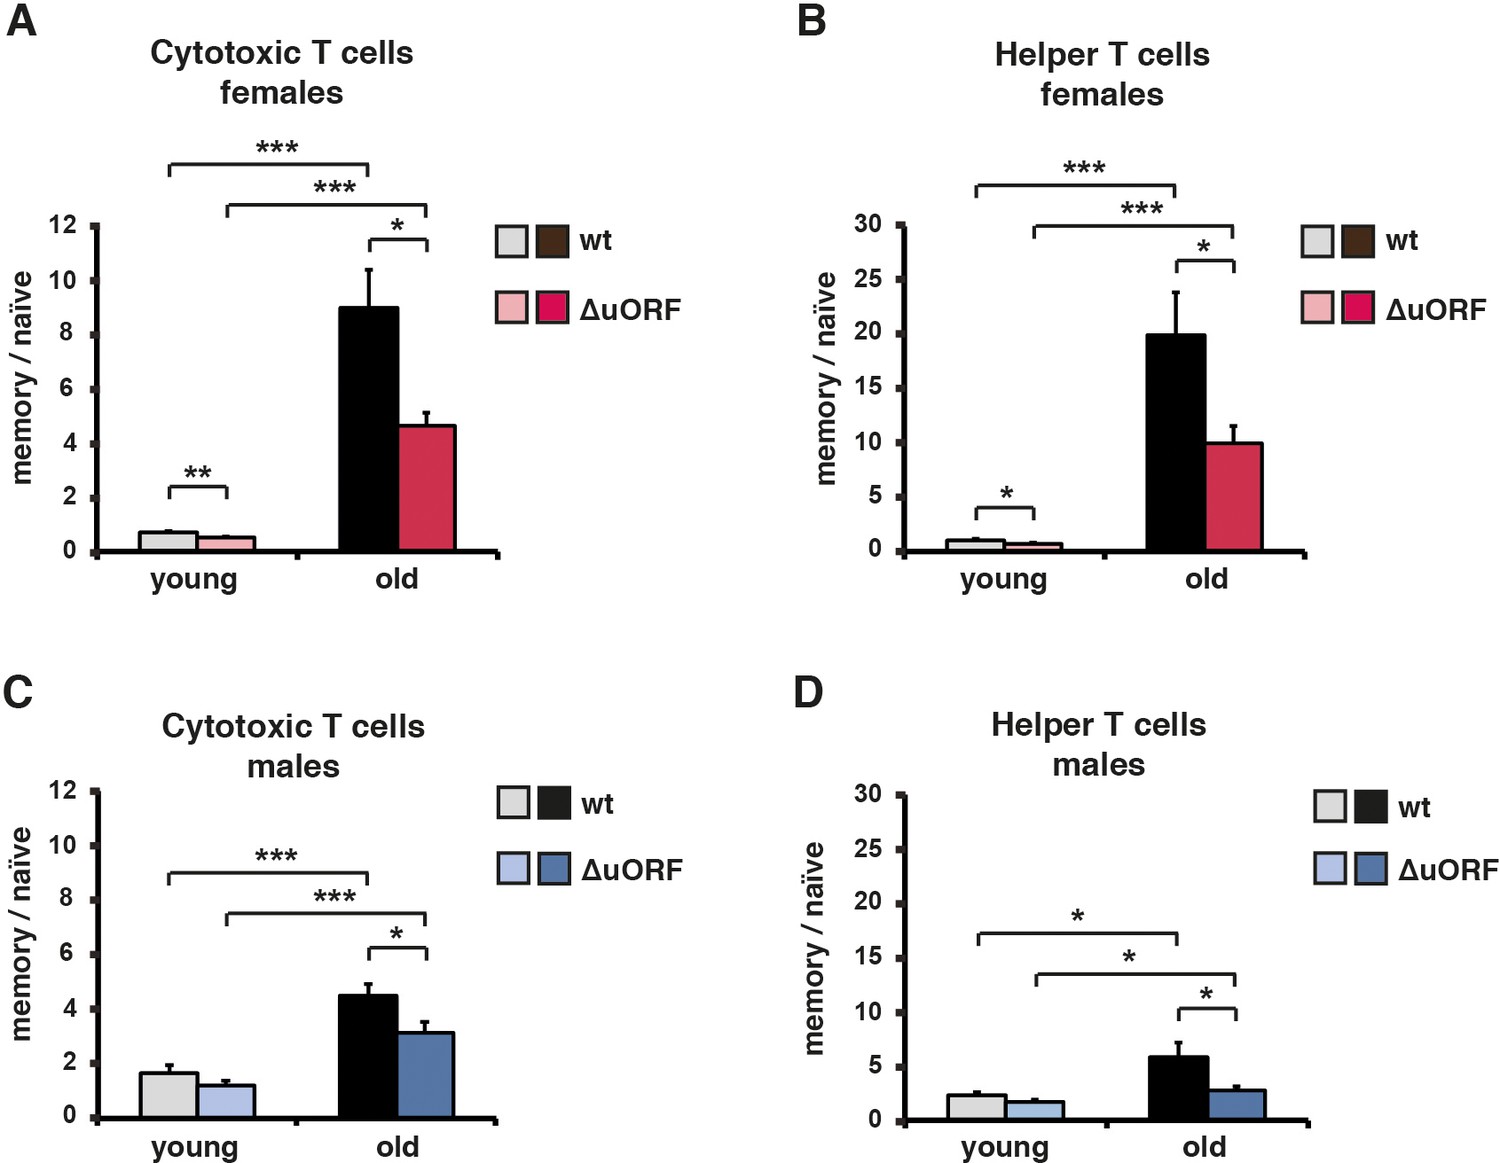
Ageing-associated increase of the memory/naïve T-cell ratio is attenuated in C/EBPβΔuORF mice.
The ratio between Cd44high memory T cells and Cd44low/Cd62Lhigh naïve T cells in blood is shown for young (5 months) and old (female 20 months, male 22 months) (A, B) females and (C, D) males for both (A, C) Cd8+ cytotoxic and (B, D) Cd4+ helper T cells as was determined by flow cytometry (wt females, n = 10 young, n = 12 old; wt males n = 12 young and old; C/EBPβΔuORF females, n = 10 young, n = 12 old; C/EBPβΔuORF males, n = 12 young and old). P-values were determined by Student’s t-test, *p<0.05; ***p<0.001.
Figure 5—figure supplement 1
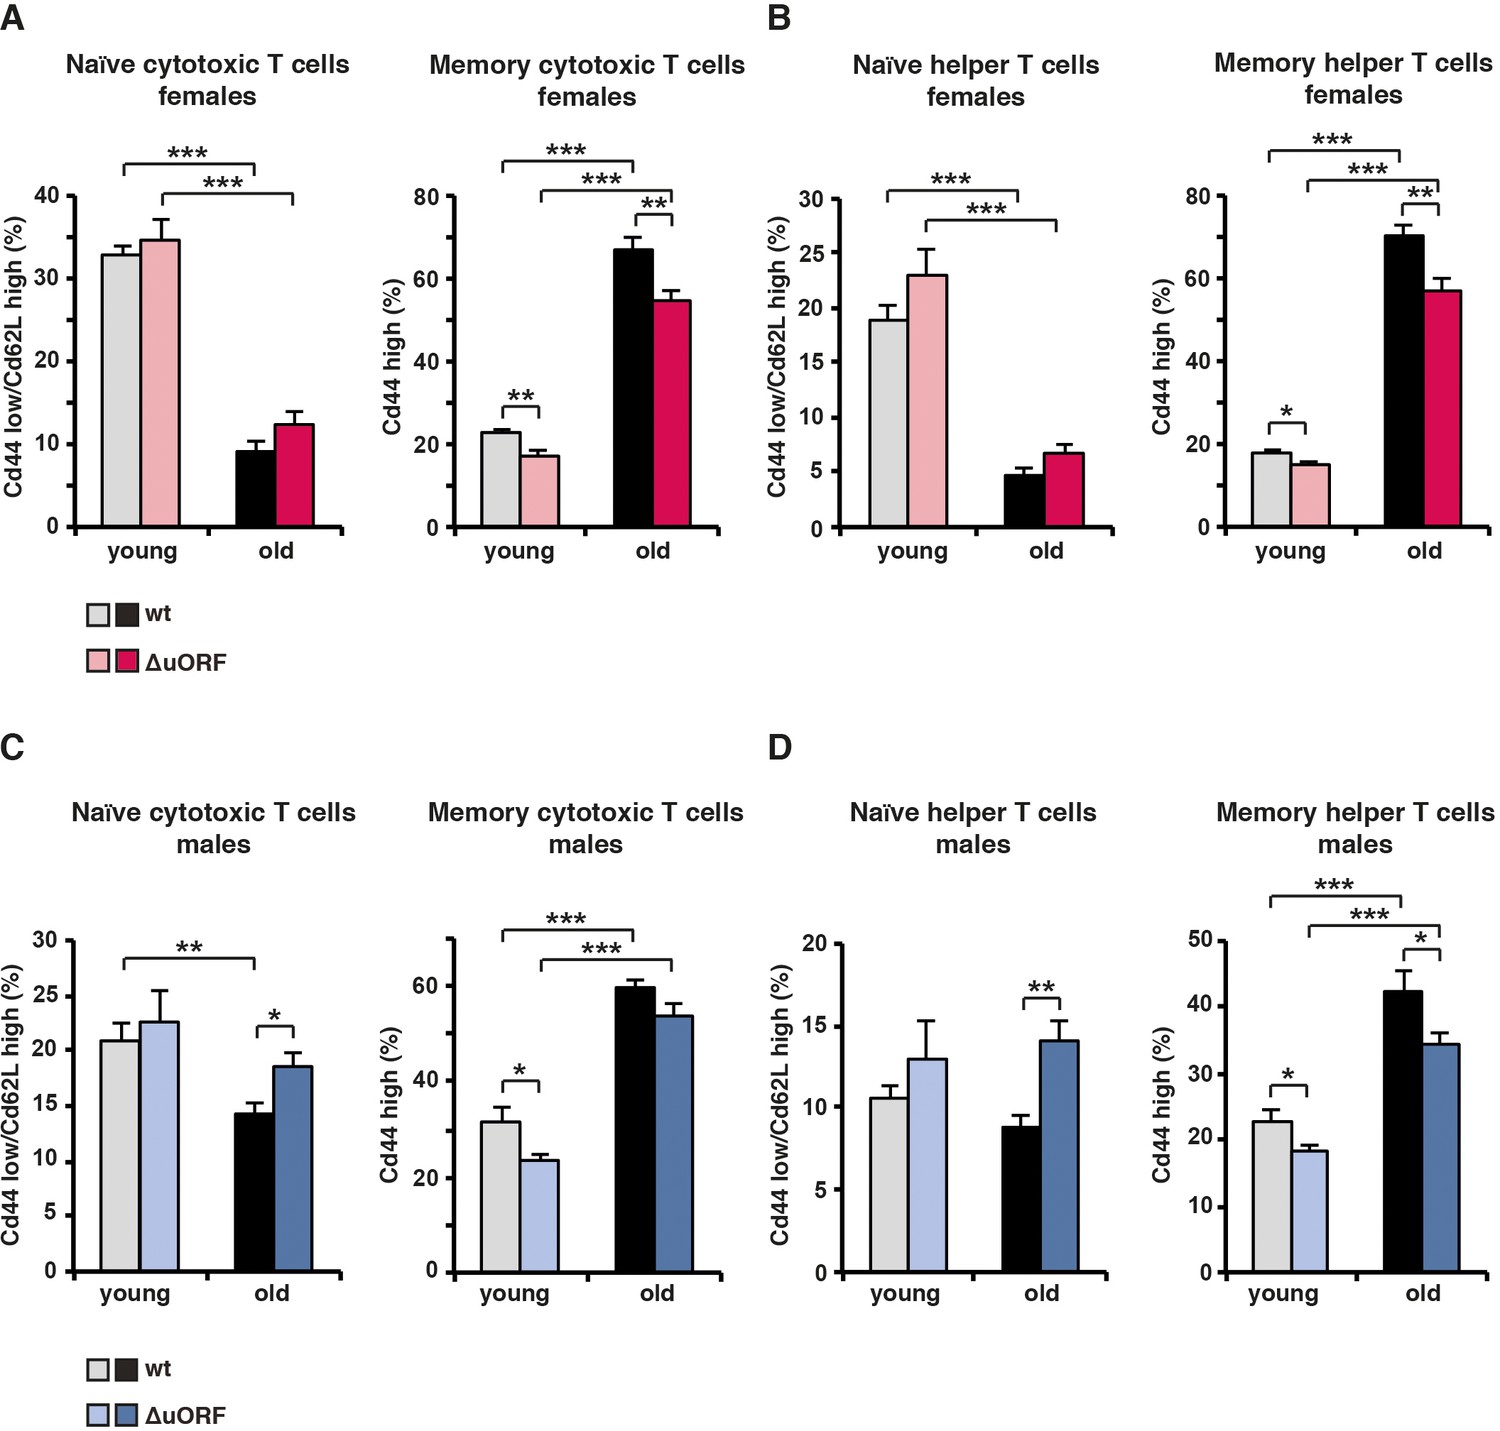
Analysis of memory / naïve T-cell ratios of cytotoxic and helper T-cells in young and old mice.
(A) At the left, for females the percentage naïve cytotoxic T cells (Cd44low/Cd62Lhigh) in respect to the total amount of cytotoxic T cells (Cd8+); at the right, percentage of memory (Cd44high) cytotoxic T cells in respect to the total amount of cytotoxic (Cd8+) T cells. (B) At the left, for females the percentage naïve helper T cells (Cd44low/Cd62Lhigh) in respect to the total amount of helper T cells (Cd4+); at the right percentage memory T cells (Cd44high) in respect to the total amount of helper T cells (Cd4+). (C) The same analysis as in (A) for males. (D) The same analysis as in (B) for males. (wt females, n=10 young, n=12 old; wt males, n=12 young and old; C/EBPβΔuORFfemales, n=10 young, n=12 old; C/EBPβΔuORFmales, n=12 young and old). P-values were determined by Student’s t-test, *p<0.05; **p<0.01; ***p<0.001.
Figure 6
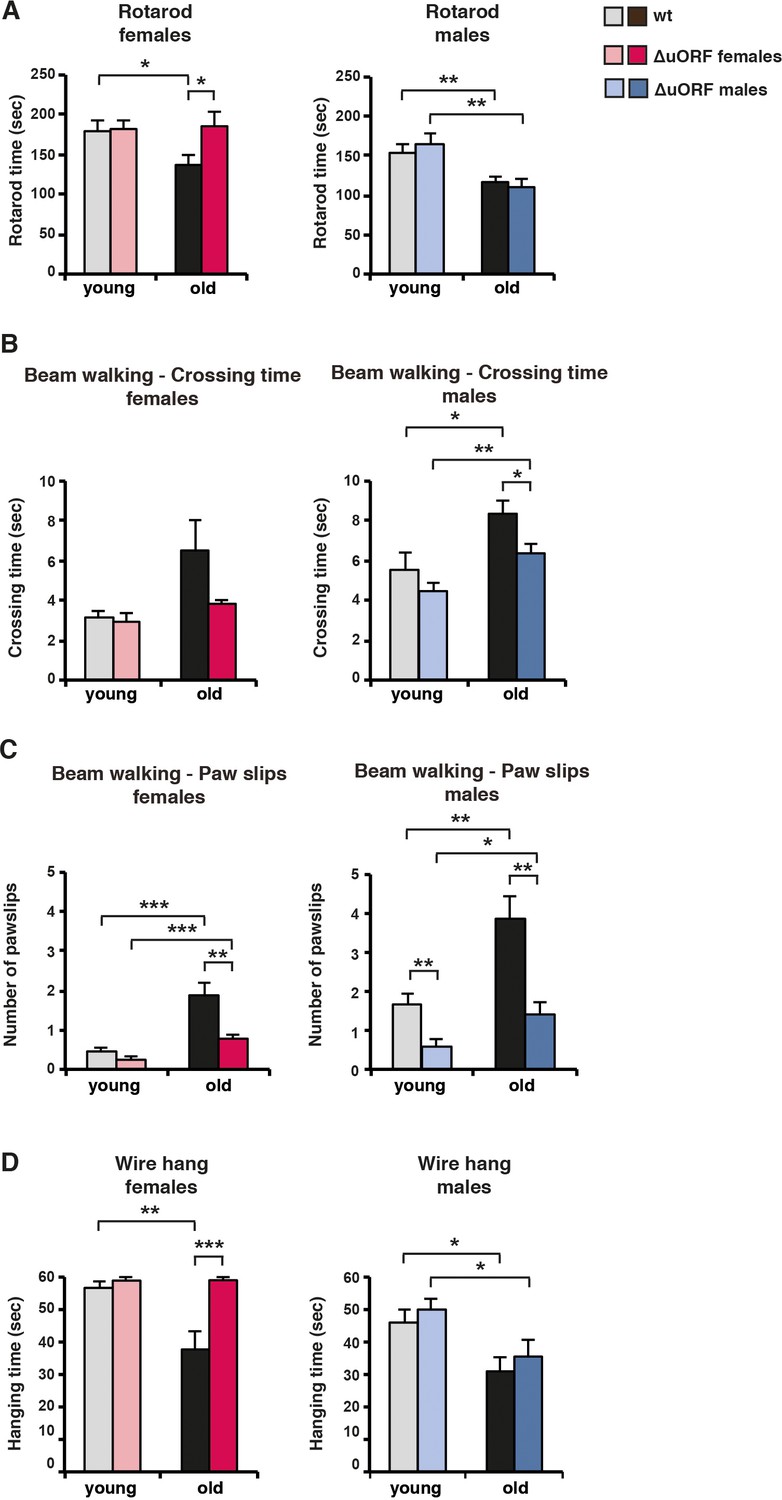
Ageing-associated loss of motor coordination and grip strength is attenuated in C/EBPβΔuORF mice.
(A) Rotarod performance (time in sec of stay on the rotarod) of young (4 months) and old (female 19 months, male 21 months) wt and C/EBPβΔuORF mice is shown separately for females (left) and males (right) (wt females, n = 11 young, n = 12 old; wt males, n = 12 young and old; C/EBPβΔuORF females, n = 11 young, n = 12 old; C/EBPβΔuORF males, n = 12 young, n = 11 old). (B) The crossing time (sec) of the beam walking test of young and old wt and C/EBPβΔuORF mice, and (C) the number of mistakes (paw slips) made while crossing the beam is shown separately for females and males (wt females, n = 11 young, n = 12 old; wt males, n = 12 young and old; C/EBPβΔuORF females, n = 11 young, n = 12 old; C/EBPβΔuORF males, n = 12 young, n = 10 old). (D) Grip strength as determined with the wire hang test as hanging time (sec) of young and old wt and C/EBPβΔuORF mice for females and males separately. N = 11 for young wt and C/EBPβΔuORF females and for old C/EBPβΔuORF females and n = 12 for old wt females; n = 11 for young and old wt males; n = 12 for young C/EBPβΔuORF males and n = 10 for old C/EBPβΔuORF males. P-values were determined by Student’s t-test, *p<0.05; **p<0.01; ***p<0.001.
Figure 7 with 1 supplement
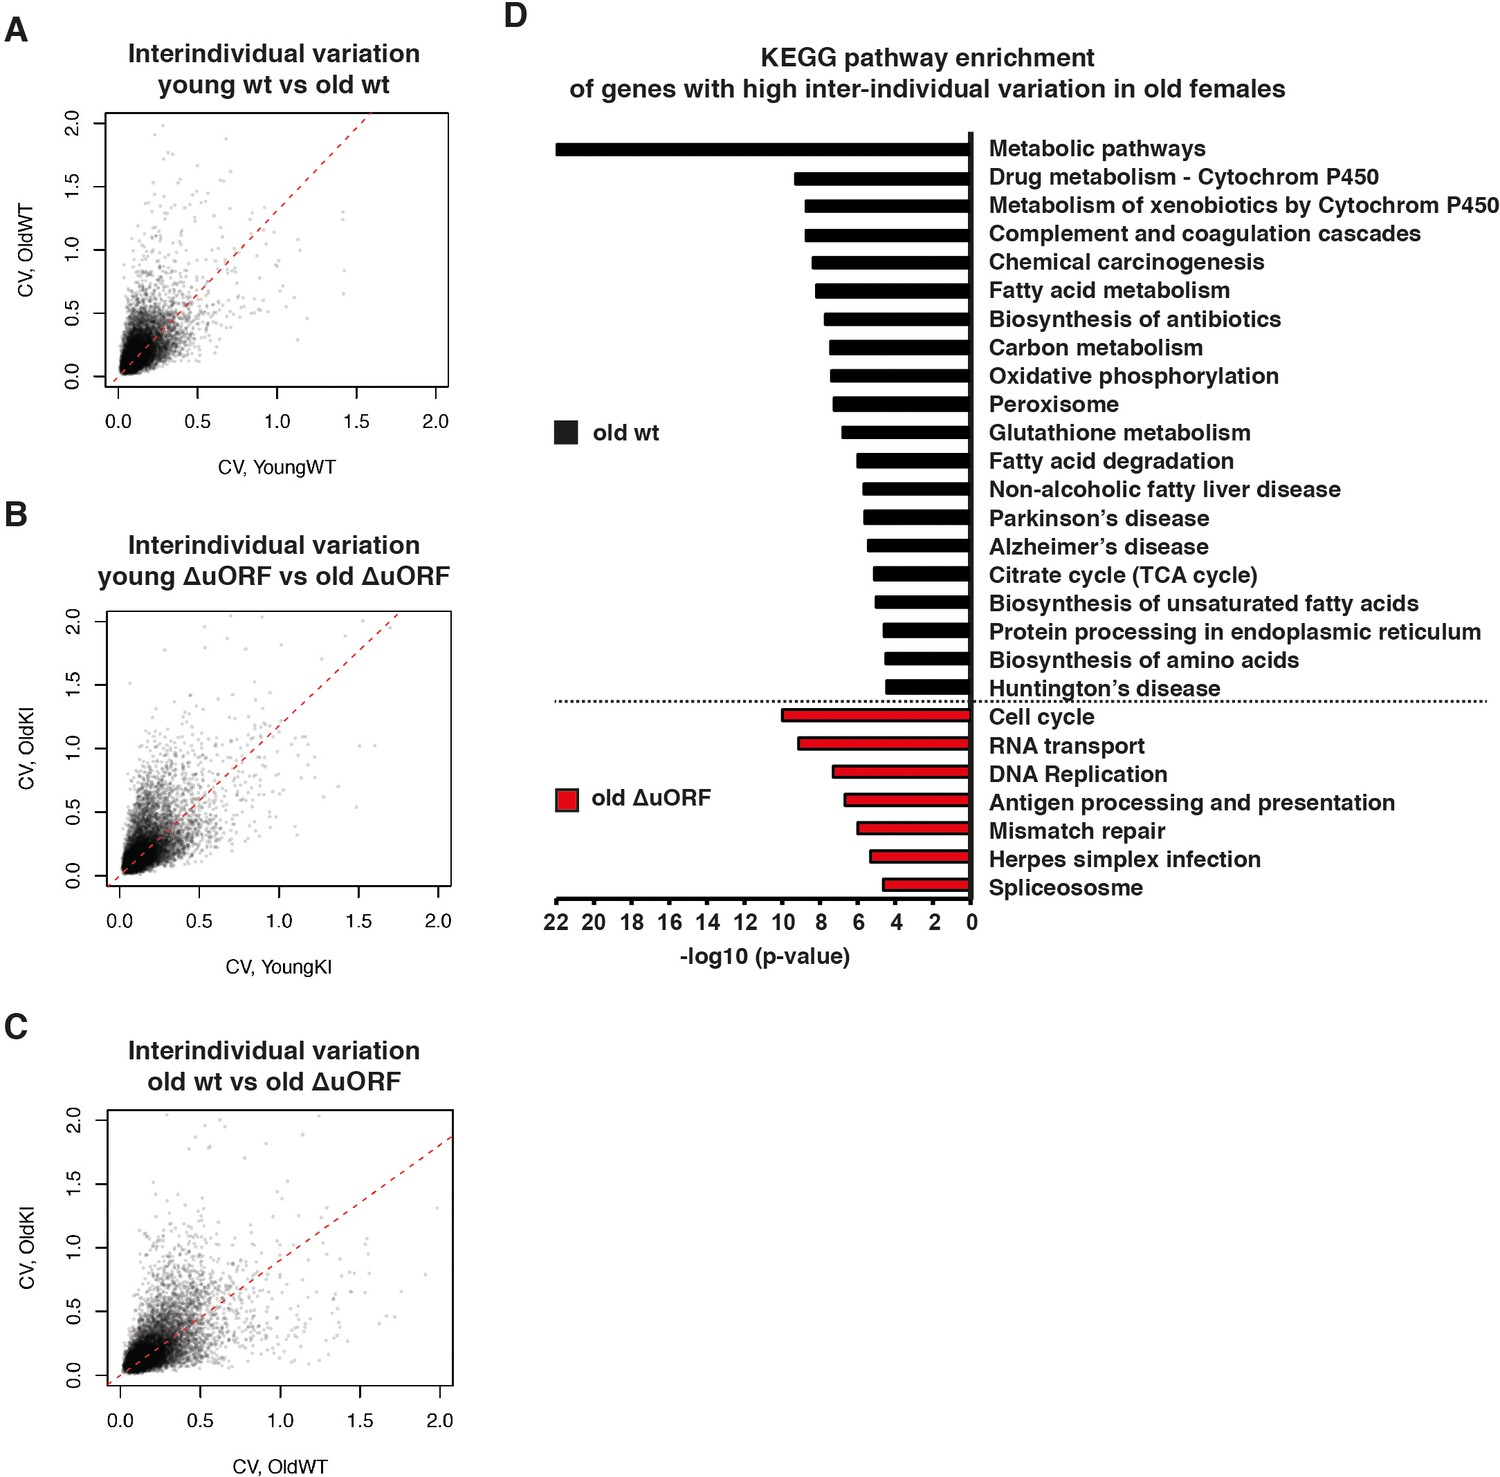
Ageing-associated increase of inter-individual variation of gene expression affects different genes in livers from wt and C/EBPβΔuORF mice.
(A–C) Inter-individual variability of liver transcripts compared between (A) young (5 months) versus old (20 months) female wt mice, (B) young (5 months) versus old (20 months) C/EBPβΔuORF female mice and (C) old wt (20 months) versus old C/EBPβΔuORF (20 months) female mice (n = 6 for young and old wt and C/EBPβΔuORF for A,B,C). Coefficient of variation of transcripts with mean expression >1 FPM is plotted against the coefficient of variation of the other group as indicated. Dashed red line represents linear regression and is shifted towards the side that shows higher inter-individual variability. (D) KEGG pathway enrichment analysis of genes that show increased inter-individual variability in livers from old wt females compared to old C/EBPβΔuORF females (Coefficient of variation of wt genes is more than twice as the coefficient of variation of the same gene in C/EBPβΔuORF females) as indicated by the black bars or of genes that show increased inter-individual variability in livers from old C/EBPβΔuORF females compared to old wt C/EBPβΔuORF females (Coefficient of variation of C/EBPβΔuORF genes is more than twice as the coefficient of variation of the same gene in wt females) as indicated by the red bars. The x-axis indicates the p-value. Only pathways that show significant enrichment (FDR < 0.05) are shown.
Figure 7—figure supplement 1

Principal component analysis (PCA) of transcriptome profiles.
PCA of transcriptome profiles obtained from livers of 5 and 20 months old wt and C/EBPβΔuORF female mice (n=6 for all groups). The main principal component PC1 (x axis, 23,91%) reflects expression changes due to ageing independent of the genotype and the second component PC2 (y axis, 18,39%) reflects expression changes due to the genotype.
Figure 8

Model explaining regulation of LIP under control of mTORC1.
(A) In wt mice C/EBPβ-mRNA translation into LIP is modulated by calorie/nutrient availability through mTORC1 signalling, while expression of LAP is not affected. Together with other mTORC1-controlled pathways (Pathway X and Y) LAP/LIP expression ratio determines healthspan and survival. The different pathways may either be, modulated (C/EBPβ), activated (Pathway X) or inhibited (Pathway Y) by mTORC1 and may have different sensitivities to mTORC1 modulators (e.g. rapamycin or nutrients), creating diversity in response (e.g. based on gender, genetic background or age). In addition LIP is upregulated by mechanisms during aging that are not well understood. (B) Genetic ablation of the C/EBPβ-uORF prevents the mTORC1-dependent and/or age-associated upregulation of LIP and results in C/EBPβ-dependent health- and lifespan extension. The C/EBPβΔuORF mutation mimics reduced mTORC1 signalling only at the level of LIP expression, leaving mTORC1 control of pathway X and Y unaffected.
Tables
Key resources table
| Reagent type (species) or resource | Designation | Source or reference | Identifiers | Additional information |
|---|---|---|---|---|
| Genetic reagent (mus musculus) | C/EBPβΔuORF | DOI:10.1101/gad.557910 DOI:10.15252/embr.201439837 | NA | mice were further back-crossed to 12 generations into C57BL/6 background |
| Antibody | CD4-PE-Cy7 conjugated | BD Pharmingen | Cat#: 552775 | dilution 1:200 |
| Antibody | CD62L-FITC conjugated | BD Pharmingen | Cat#: 561917 | dilution 1:200 |
| Antibody | CD3e-PE conjugated | eBioscience | Cat#: 12–0031 | dilution 1:200 |
| Antibody | CD8a-eFluor 450 conjugated | eBioscience | Cat#: 48–0081 | dilution 1:200 |
| Antibody | CD44-APC conjugated | eBioscience | Cat#: 17–0441 | dilution 1:200 |
| Antibody | C/EBPβ (E299) (rabbit monoclonal) | Abcam | Cat#: ab32358 | dilution 1:1000 |
| Antibody | β-actin (rabbit polyclonal) | Abcam | Cat#: ab16039 | dilution 1:1000 |
| Antibody | β-actin (clone C4) (mouse monoclonal) | MP Biomedicals | Cat#: 69100 | dilution 1:10000 |
| Antibody | 4E-BP1 (C19) (goat polyclonal) | Santa Cruz | Cat#: sc-6024 | dilution 1:400 |
| Antibody | phospho-4E-BP1 (Thr 37/46) (rabbit polyclonal) | Cell Signaling | Cat#: 9459 | dilution 1:1000 |
| Antibody | p70S6K | Cell Signaling | Cat#: 9202 | dilution 1:1000 |
| Antibody | phospho-p70S6K (Thr389) (108D2) (rabbit monoclonal) | Cell Signaling | Cat#: 9234 | dilution 1:1000 |
| Antibody | S6 ribosomal protein (54D2) (mouse monoclonal) | Cell Signaling | Cat#: 2317 | dilution 1:1000 |
| Antibody | phospho-S6 ribosomal protein (Ser235/236) (2F9) (rabbit monoclonal) | Cell Signaling | Cat#: 4856 | dilution 1:1000 |
| Antibody | HRP-linked anti rabbit IgG | GE Healthcare | Cat#: NA934 | dilution 1:5000 |
| Antibody | HRP-linked anti mouse IgG | GE Healthcare | Cat#: NA391 | dilution 1:5000 |
| Antibody | HRP-linked anti goat IgG | Santa Cruz | Cat#: sc-2056 | dilution 1:5000 |
| Sequence-based reagent | Actb (β-actin) (F) | DOI:10.15252/embr.201439837 | NA | 5’-AGAGGGAA ATCGTGCGTGAC-3' |
| Sequence-based reagent | Actb (β-actin) (R) | DOI:10.15252/embr.201439837 | NA | 5'-CAATAGTG ATGACCTGGCCGT-3’ |
| Sequence-based reagent | Cebpb (F) | DOI:10.15252/embr.201439837 | NA | 5’-CTGCGGG GTTGTTGAT GT-3’ |
| Sequence-based reagent | Cebpb (R) | DOI:10.15252/embr.201439837 | NA | 5’-ATGCTCGA AACGGAAAA GGT-3’ |
| Sequence-based reagent | Cd68 (F) | this paper | NA | 5’-GCCCACC ACCACCAGT CACG-3’ |
| Sequence-based reagent | Cd68 (R) | this paper | NA | 5’-GTGGTCC AGGGTGAGG GCCA-3’ |
| Commercial assay or kit | Mouse IGF specific AssayMax ELISA kit | BioCat/Assaypro LLC | Cat#: EMI1001-1-AS | |
| Commercial assay or kit | Lightning Plus ECL reagent | Perkin Elmer | Cat#: NEL103001EA | |
| Commercial assay or kit | Rneasy Plus Mini kit | QIAGEN | Cat#: ID:74134 | |
| Commercial assay or kit | Transcriptor First Strand cDNA Synthesis kit | Roche | Cat#: 4379012001 | |
| Commercial assay or kit | Light Cycler 480 SYBR Green I Master Mix | Roche | Cat#: 04707516001 | |
| Commercial assay or kit | TruSeq Sample Preparation V2 Kit | Illumina | Cat#: RS-122–2002 | |
| Commercial assay or kit | Restore Western Blot Stripping buffer | Thermo Fisher | Cat#: 21063 | |
| Commercial assay or kit | RBC-Lysis buffer | BioLegend | Cat#: 420301 | |
| Commercial assay or kit | QIAzol Lysis re-agent | QIAGEN | Cat#: ID:79306 | |
| Software, algorithm | GraphPad Prism 7.0 | Graphpad Software, La Jolla, CA | ||
| Software, algorithm | DAVID database 6.8 | doi:10.1038/nprot.2008.211 | ||
| Software, algorithm | STAR 2.5.2b | doi:10.1093/bioinformatics/bts635 | ||
| Software, algorithm | Ensembl gene build 86 | http://www.ensembl.org | ||
| Software, algorithm | EdgeR package | doi:10.1152/physiolgenomics.00106.2011 | ||
| Software, algorithm | gProfiler tool | doi:10.1093/nar/gkw199 | ||
| Software, algorithm | Image Quant LAS 4000 Mini Imager software | GE Healthcare |
Additional files
-
Supplementary file 1
Table 1 Lifespan experiment summary of results.
1 Number of animals in the cohort 2 Median survival of the cohort (days) 3 Increase of the median survival (percent) 4 P-value of the increased survival (log-rank test) 5 Mean lifespan of the cohort (days) 6 Standard error of the mean 7 Number of mice in the cohort in the longest-lived decile of the combined cohort (wt and C/EBPβΔuORF) 8 P-value of increased Nmax7 (Fisher’s exact test).
- https://doi.org/10.7554/eLife.34985.017
-
Supplementary file 2
Table 2 Tumour spectrum in wt and C/EBPβΔuORF mice.
*incl. lymphoid leukaemia **incl. malignant round cell neoplasms ***tumour type could not be unequivocally determined due to inadequate quality of the fixed tumour tissue Absolute numbers of mice with the indicated tumour type of tumours found during necropsy for wt and C/EBPβΔuORF males and females are shown. Note that the total number of tumours is higher than the number of tumour-bearing mice due to the eventual occurrence of different tumour types in the same mouse.
- https://doi.org/10.7554/eLife.34985.018
-
Supplementary file 3
Table 3 Occurrence of ageing-associated pathologies in wt and C/EBPβΔuORF mice.
Mice were part of the ageing cohort and the age at analysis was 20 months for females and 22 months for males. 1 Number of animals showing the pathology (out of the total number of animals analyzed). 2 mean grade of the pathology as calculated from the total number of animals analyzed with 0 = absent, 1 = mild, 2 = moderate and 3 = severe. 3 Statistical significance of difference found between wt and C/EBPβΔuORF mice from the same gender as calculated using the Student’s t-test (ns = not significant). 4 Mean number of regenerating muscle fibers found in five histological tissue slices per mouse. Note that a lower number is an indication for a more progressed ageing phenotype. 5 mean surface area of intramuscular adipose tissue in percent of the total area of analyzed skeletal muscle tissue as calculated from the total number of animals analyzed. 6 Trabecular bone parameters (percent bone volume/tissue volume; Trabecular number per mm; trabecular thickness and trabecular separation) measured by micro-CT analysis.
- https://doi.org/10.7554/eLife.34985.019
-
Supplementary file 4
Table 4 GO-term analysis of genes upregulated in livers of old C/EBPβΔuORF mice.
Functional annotation of genes upregulated in livers of old C/EBPβΔuORF female mice compared to livers of old wt female mice (FDR < 0.01; 103 from 127 genes; 24 unknown IDs) using the DAVID database (Huang et al., 2009).
- https://doi.org/10.7554/eLife.34985.020
-
Supplementary file 5
Table 5 GO-term analysis of genes downregulated in livers of old C/EBPβΔuORF mice.
Functional annotation of genes downregulated in livers of old C/EBPβΔuORF female mice compared to livers of old wt female mice (FDR < 0.01; 23 from 25 genes, two unknown IDs) using the DAVID database (Huang et al., 2009).
- https://doi.org/10.7554/eLife.34985.021
-
Supplementary file 6
Table 6 GO-term analysis of genes showing high inter-individual variation between livers of old wt female mice.
Functional annotation of genes showing a high inter-individual variation between livers from old wt female mice. Coefficient of variation of transcript levels of the corresponding gene in the livers of wt mice is at least twice as big as the coefficient of variation of the transcript levels of the same gene in the livers from C/EBPβΔuORF mice; 1386 from 1414 genes, 28 unknown IDs; using the DAVID database (Huang et al., 2009).
- https://doi.org/10.7554/eLife.34985.022
-
Supplementary file 7
Table 7 GO-term analysis of genes showing high inter-individual variation between livers of old C/EBPβΔuORF female mice.
Functional annotation of genes showing a high inter-individual variation between livers from old wt female mice. Coefficient of variation of transcript levels of the corresponding gene in the livers of C/EBPβΔuORF mice is at least twice as big as the coefficient of variation of the transcript levels of the same gene in the livers from wt mice; 1354 from 1375 genes, 21 unknown IDs; using the DAVID database (Huang et al., 2009).
- https://doi.org/10.7554/eLife.34985.023
-
Transparent reporting form
- https://doi.org/10.7554/eLife.34985.024
Download links
A two-part list of links to download the article, or parts of the article, in various formats.
Downloads (link to download the article as PDF)
Open citations (links to open the citations from this article in various online reference manager services)
Cite this article (links to download the citations from this article in formats compatible with various reference manager tools)
Reduced expression of C/EBPβ-LIP extends health and lifespan in mice
eLife 7:e34985.
https://doi.org/10.7554/eLife.34985


