The nucleosomal acidic patch relieves auto-inhibition by the ISWI remodeler SNF2h
- University of California, San Francisco, United States
Figures
Figure 1 with 3 supplements
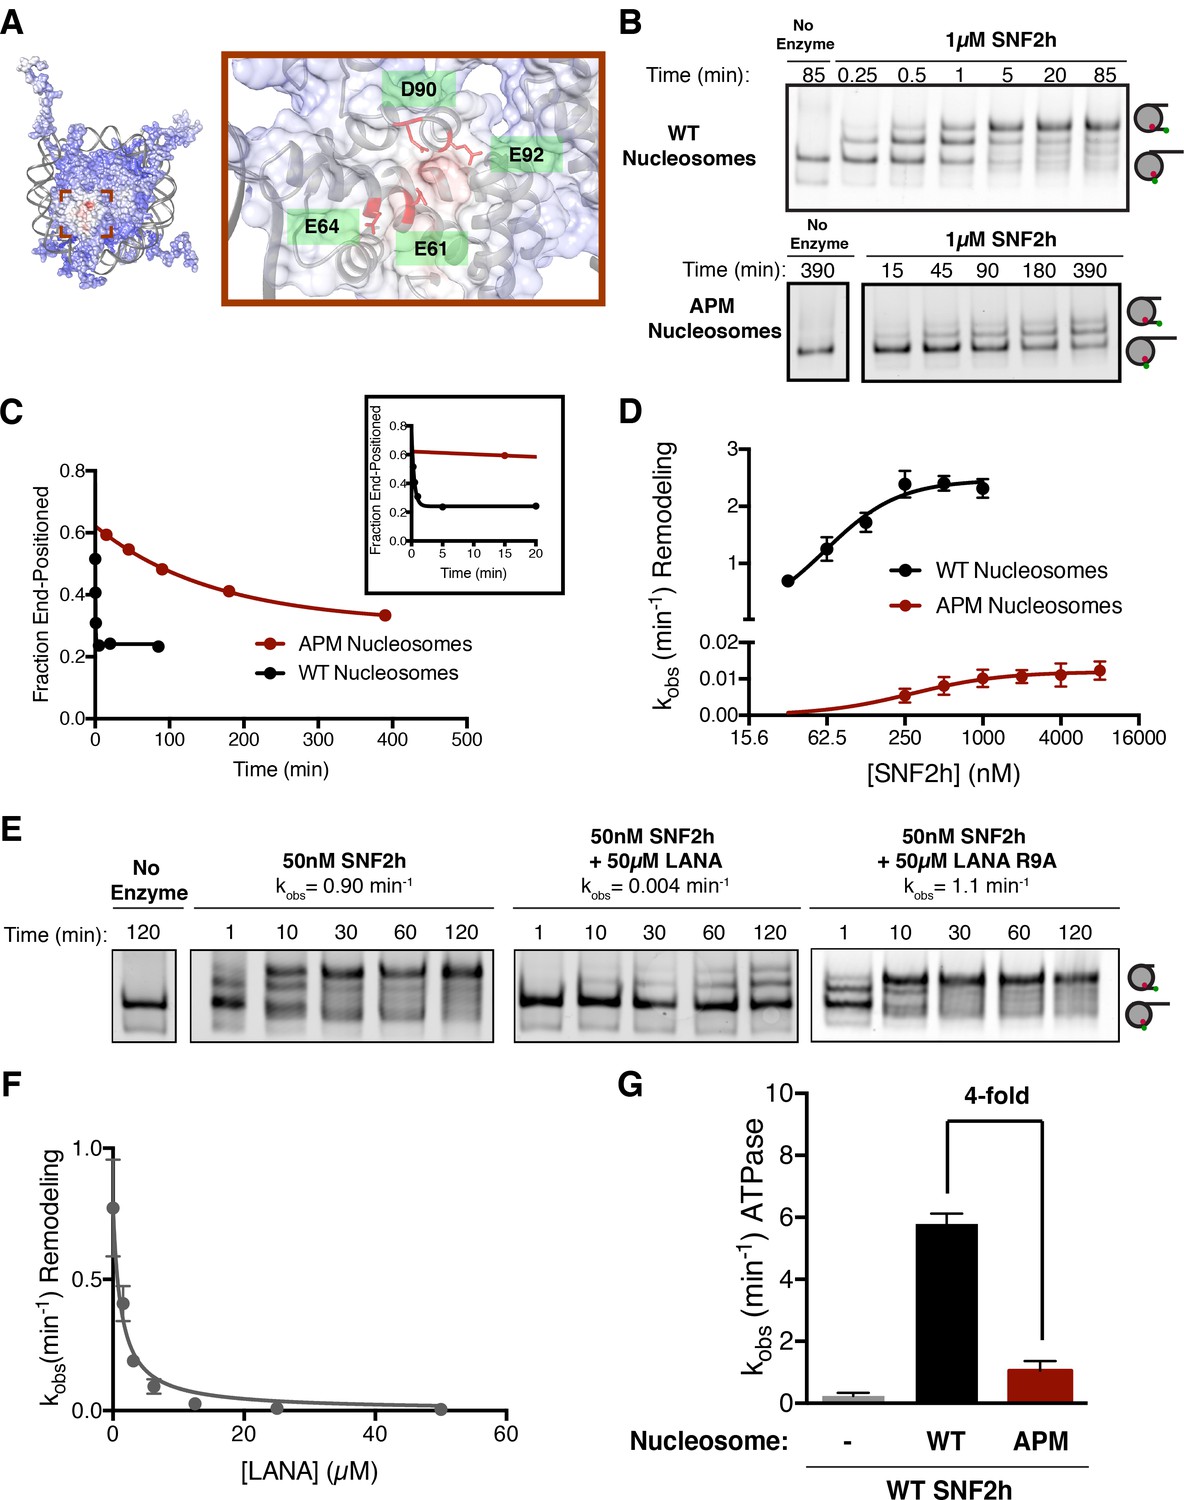
The acidic patch is an important epitope for remodeling post-binding.
(A) Charge profile of the nucleosome (left) and magnification of the acidic patch region (right) (PDBID: 1KX5, charge profile generated using ABPS and UCSF Chimera [Pettersen et al., 2004]). Residues of the acidic patch mutated in this study are shown in red. (B) Example of a Cy5-fluorescent scan of a gel-based remodeling assay with 0/60 WT and acidic patch mutant (APM) nucleosomes (1 µM SNF2h, 20 nM nucleosomes, saturating ATP). (C) Quantification of the gel in B and fits to a single exponential decay. Inset is zoomed to show faster time points with WT nucleosomes. (D) Gel remodeling rate as a function of enzyme concentration, plotted on a log(2) scale. APM nucleosomes are remodeled substantially slower even at saturating concentrations of enzyme. Data were fit to a cooperative binding model (WT nucleosomes: KMapp = 61 nM, kmax = 2.5 min−1, h = 1.5; APM nucleosomes: KMapp = 280 nM, kmax = 0.012 min−1, h = 1.2). (E) Remodeling is inhibited by competition for the acidic patch. WT nucleosomes were remodeled with sub-saturating SNF2h and in the presence of KSHV LANA peptide. Remodeling is inhibited by the peptide but not when the arginine anchor is mutated to alanine. (F) Inhibition curve with the LANA peptide (KI = 1.21 µM). Error bars represent standard errors on the mean for three replicates, except for the no-peptide condition in F, which had two replicates. (G) ATPase activity of WT SNF2h. Nucleosomes were in excess of SNF2h and at saturating concentrations. APM nucleosomes stimulated ATPase activity 4-fold weaker than WT.
-
Figure 1—source data 1
Values used to obtain plots.
- https://doi.org/10.7554/eLife.35322.009
Figure 1—figure supplement 1

Sequences of DNA constructs used in this work.
601 nucleosome positioning sequence is underlined; Pst18 restriction site (where present) is in blue. The sequence of the 3/78 construct is the same as the ‘n = 3’ construct in Blosser et al., and the 3/78 construct in Zhou et al., 2018 (Blosser et al., 2009; Zhou et al., 2018).
Figure 1—figure supplement 2
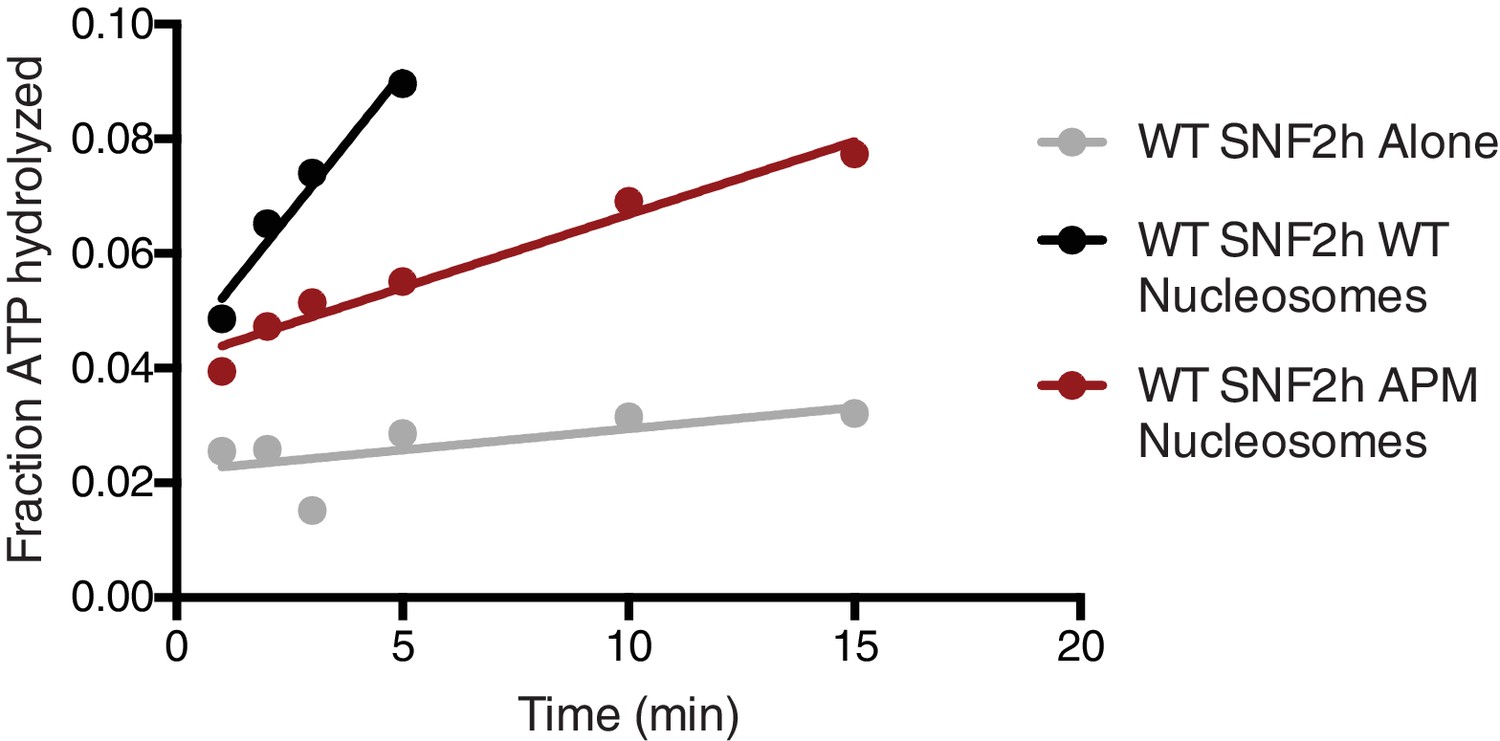
Representative ATPase assay fits.
Saturating concentrations of nucleosomes (200 nM WT nucleosomes, 187 nM APM nucleosomes) were incubated with 12.5 nM enzyme and 7.5 µM ATP•Mg, and trace amounts of γ-P32 ATP. Reactions were analyzed by thin layer chromatography followed by radiography. Initial rates were determined by a linear fit to the first 10% of ATP hydrolyzed in the reaction.
-
Figure 1—figure supplement 2—source data 1
Values used to obtain plots.
- https://doi.org/10.7554/eLife.35322.006
Figure 1—figure supplement 3
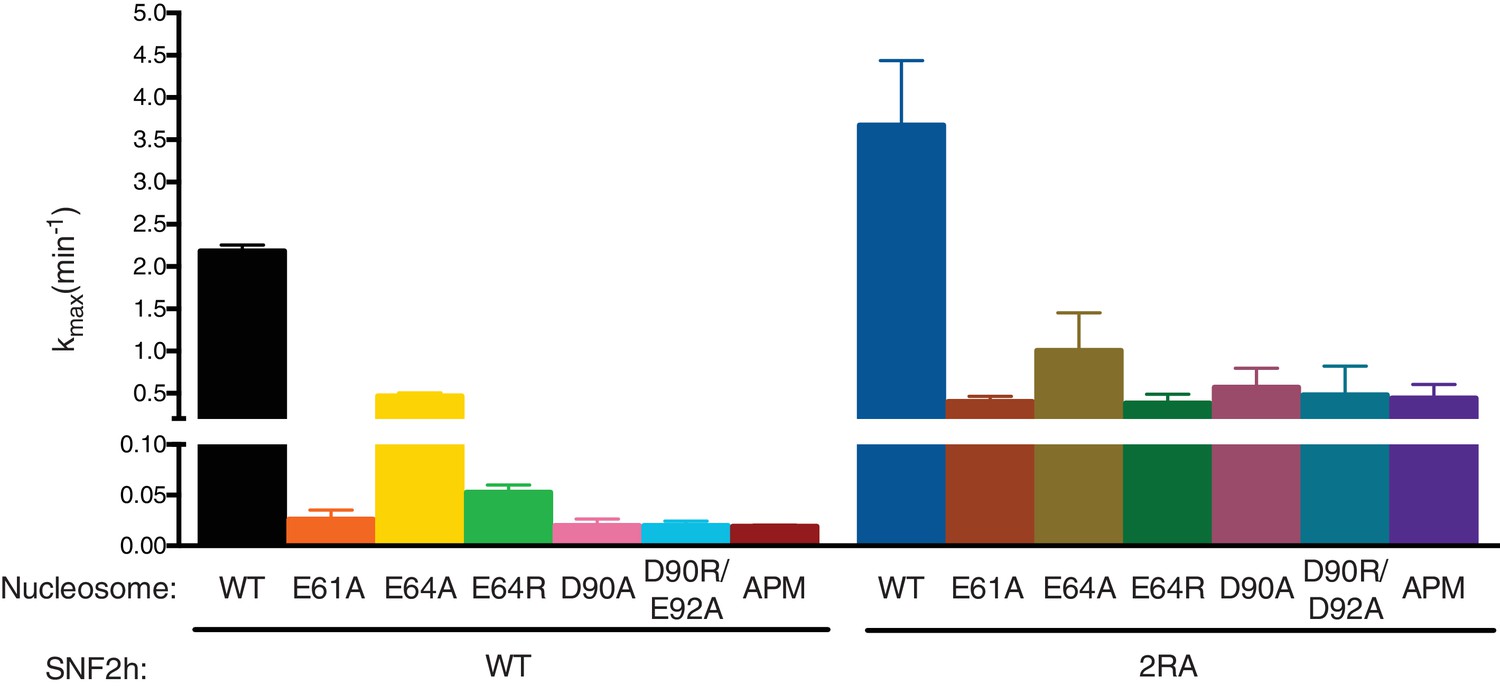
Maximal remodeling rates for various acidic patch mutations.
0/60 Cy3-DNA labeled nucleosome constructs were remodeled with saturating concentrations of either WT or 2RA SNF2h (N = 3). The mean and standard error are shown for the maximal remodeling rates. Residues in the ‘arginine anchor’ binding site of the nucleosome (E61, D90, E92) produce the same defect when mutated individually or in combination, suggesting a cooperative role for these residues in SNF2h remodeling. Mutating residues in the acidic patch but outside the arginine anchor site (E64) has a weaker effect than mutating the arginine anchor residues. However, all acidic patch mutations have a weaker defect in the context of 2RA mutant SNF2h.
-
Figure 1—figure supplement 3—source data 1
Values used to obtain plots.
- https://doi.org/10.7554/eLife.35322.008
Figure 2 with 5 supplements
Dependence on the nucleosome acidic patch is linked to relief of autoinhibition.
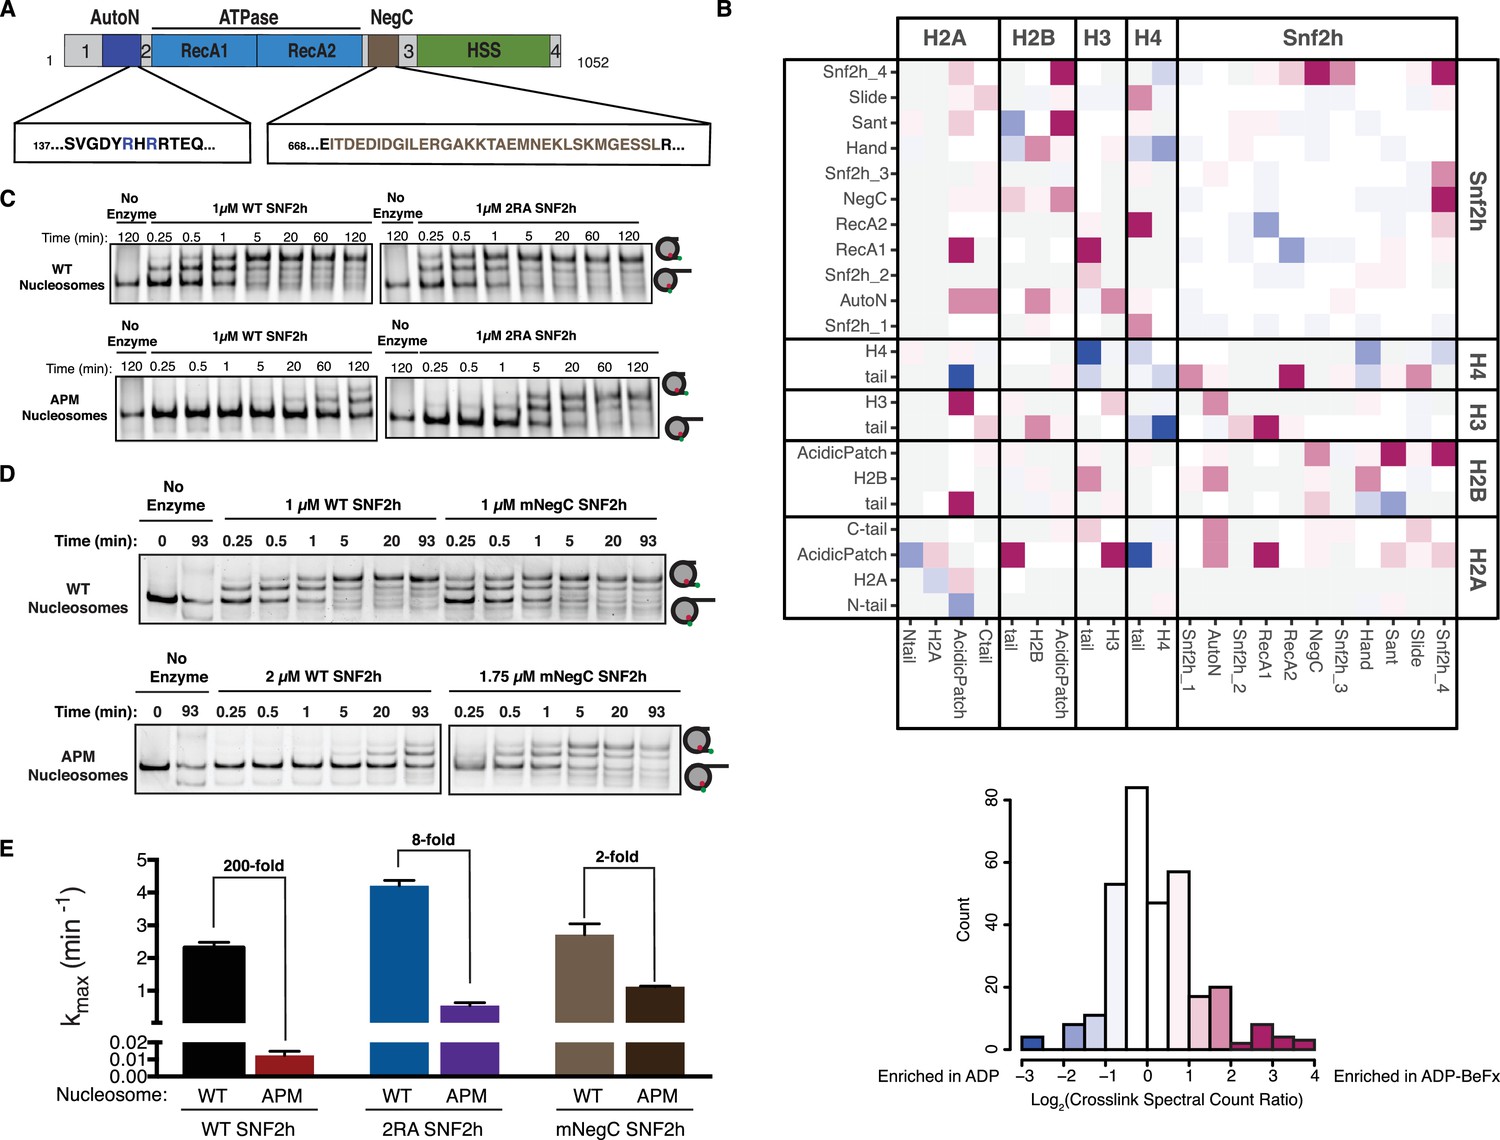
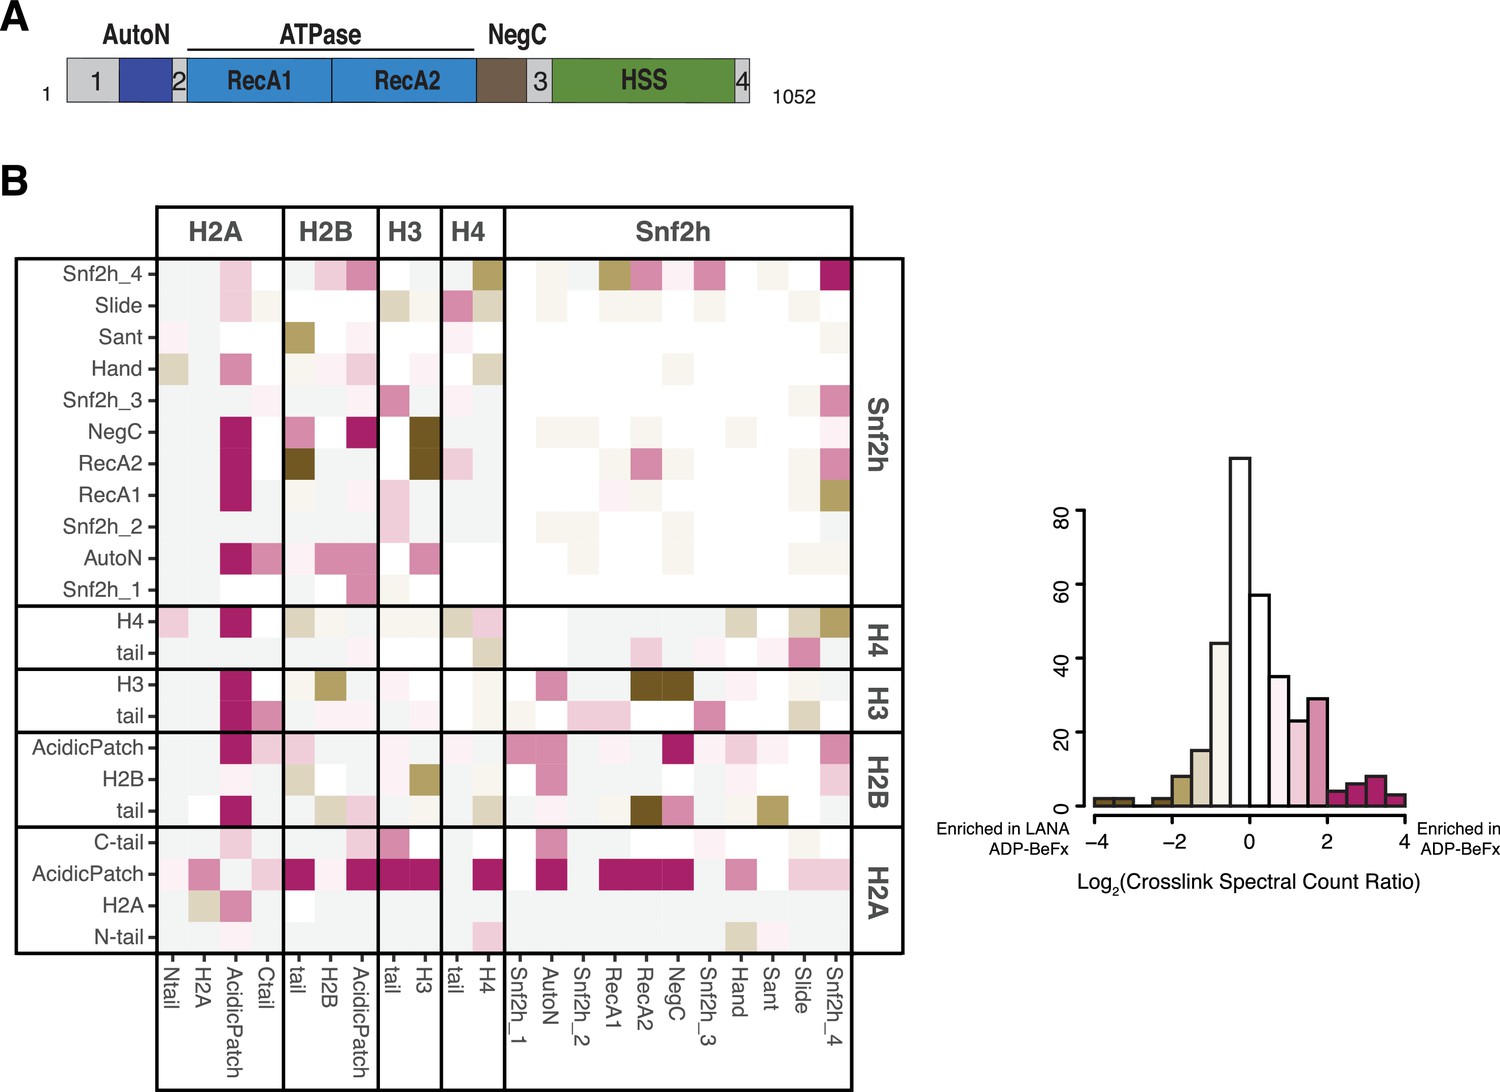
(A) Domain architecture of SNF2h. The two critical arginines (R142, R144) of AutoN are highlighted in blue, while the NegC region replaced with a flexible GGS linker (Leonard and Narlikar, 2015) is highlighted in brown. Intervening sequences with no known domain annotations are numbered as in B. (B) Direct domain-domain interactions of SNF2h nucleosomes probed by crosslinking mass spectrometry. SNF2h mononucleosomes were crosslinked with the zero-length reagent EDC in the presence of either the ATP transition state analog ADP•BeFx or ADP. Residue-residue crosslink data were aggregated into domain-domain level spectral counts. The fold change between ADP•BeFx and ADP conditions is displayed as the log2 of the spectral count ratio. The data were centered to the median value and the color scale depicts the interactions most enriched in ADP•BeFx in magenta, and ADP in blue. Light grey tiles indicate no crosslinks observed in either condition. Domains are listed from N- to C- term within each protein. The distribution of fold changes in domain-domain spectral counts is plotted as a histogram below. It should also be noted that due to the structure of the histone octamer and the 2:1 stoichiometry of the SNF2h-Nucleosome complex, we cannot distinguish between intramolecular and intermolecular SNF2h-SNF2h or Histone-Histone crosslinks. (C and D). Mutation of AutoN or NegC increases remodeling rate with WT and APM nucleosomes. Cy5 fluorescent scans of native gel remodeling assays. (E) Saturating remodeling rates (kmax) for WT and APM nucleosomes with WT, 2RA, and mNegC SNF2h. Mutation of the acidic patch has a substantially lower effect on the kmax for 2RA and mNegC SNF2h than for WT SNF2h (8-fold and 2-fold respectively vs. 200-fold). Error bars represent standard errors on the mean for N = 3 replicates.
-
Figure 2—source data 1
Values used to obtain plots.
- https://doi.org/10.7554/eLife.35322.019
Figure 2—figure supplement 1
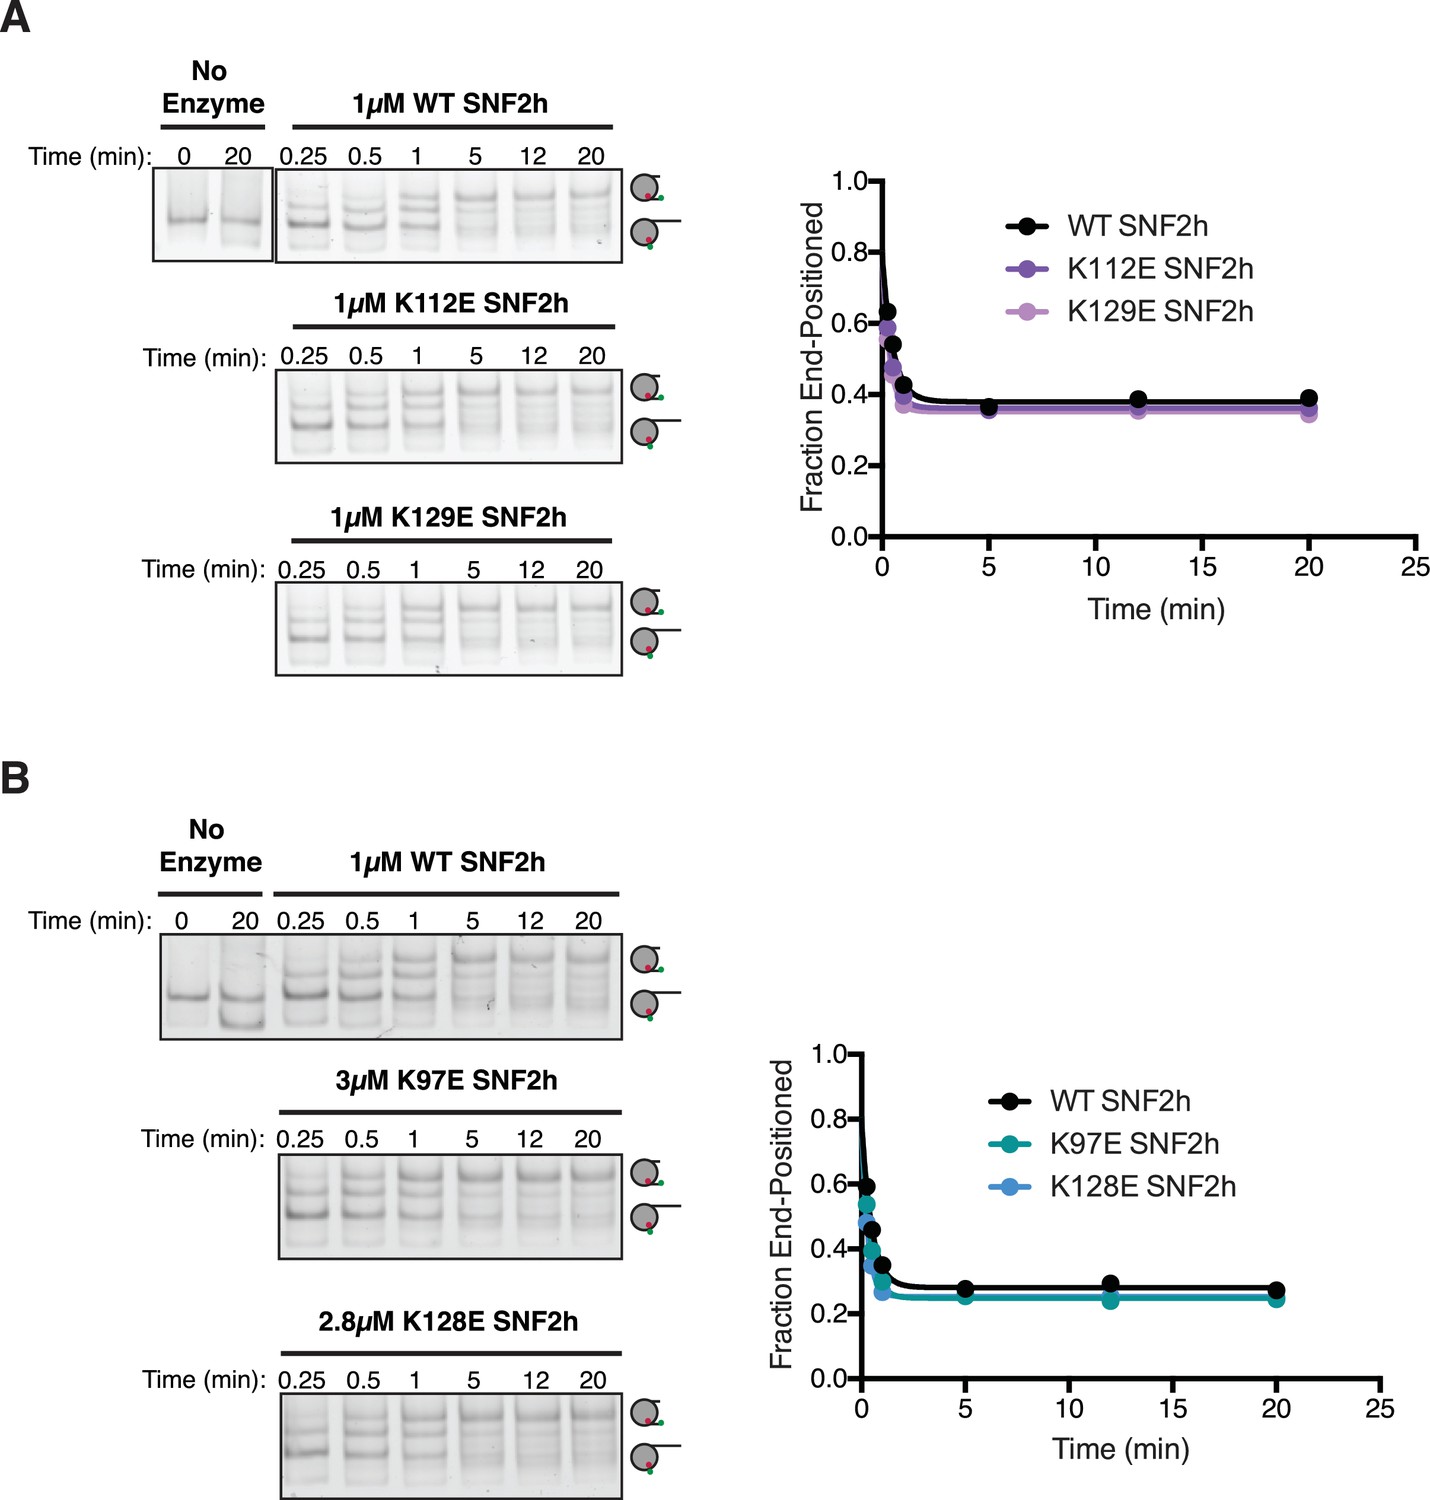
Mutations to the N-terminus have minimal effects on remodeling.
(A and B) Left. Cy3-fluorscence scan of native gel remodeling assays with WT nucleosomes and either WT or mutant SNF2h. Saturating concentrations of SNF2h were used for all constructs. Right. Quantifications of the gel images shown at the left. The residues chosen are lysines in AutoN that crosslinked to the acidic patch in only the ADP•BeFx state. In all cases, the mutations showed no appreciable effect on remodeling (<2 fold difference).
-
Figure 2—figure supplement 1—source data 1
Values used to obtain plots.
- https://doi.org/10.7554/eLife.35322.012
Figure 2—figure supplement 2
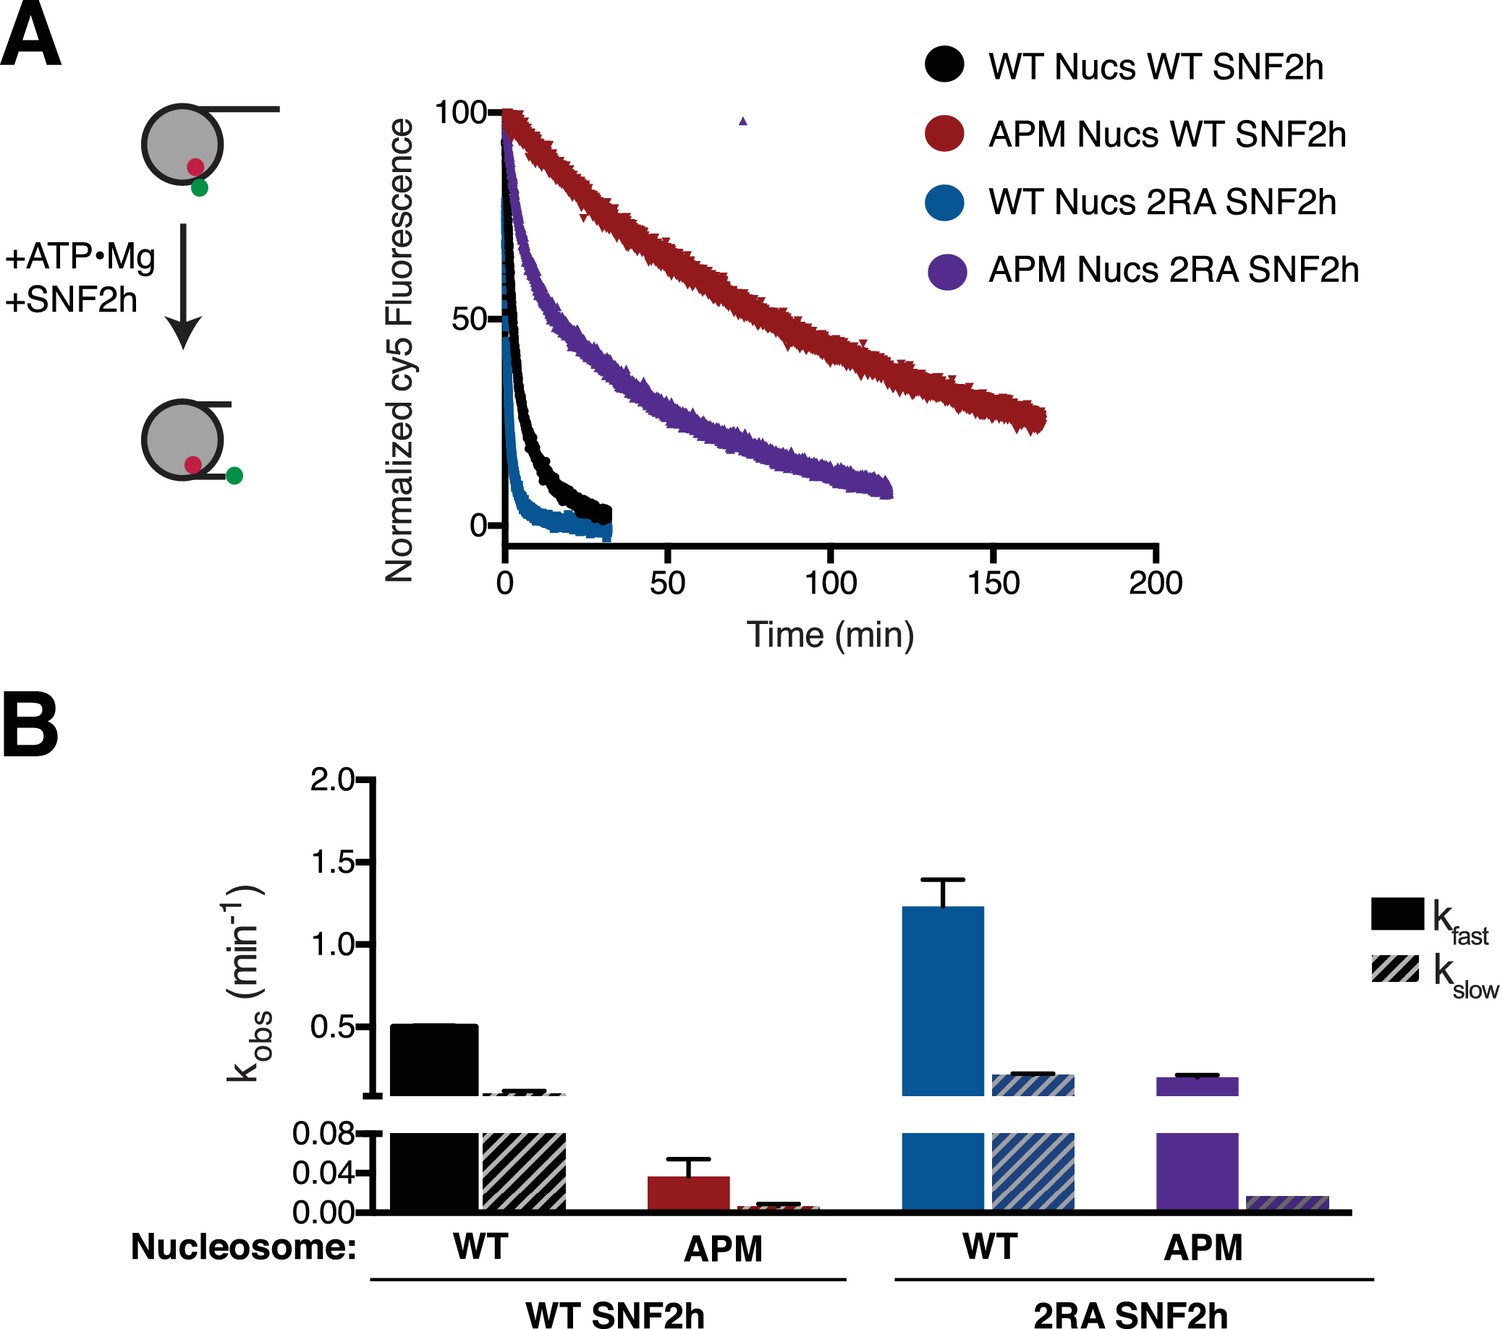
Ensemble FRET remodeling shows similar effects as the gel-based assay.
(A) FRET remodeling assay. Saturating concentrations of enzyme were added to 8 nM FRET-labeled nucleosomes. Cy5 fluorescence was monitored over time and fit to a two-phase exponential decay. Reactions were normalized to the initial (maximal) and plateau (minimal) fluorescence from the fit. (B) Remodeling rates of the two phases. Error bars represent standard error of the mean for N = 3 replicates.
-
Figure 2—figure supplement 2—source data 1
Values used to obtain plots.
- https://doi.org/10.7554/eLife.35322.014
Figure 2—figure supplement 3
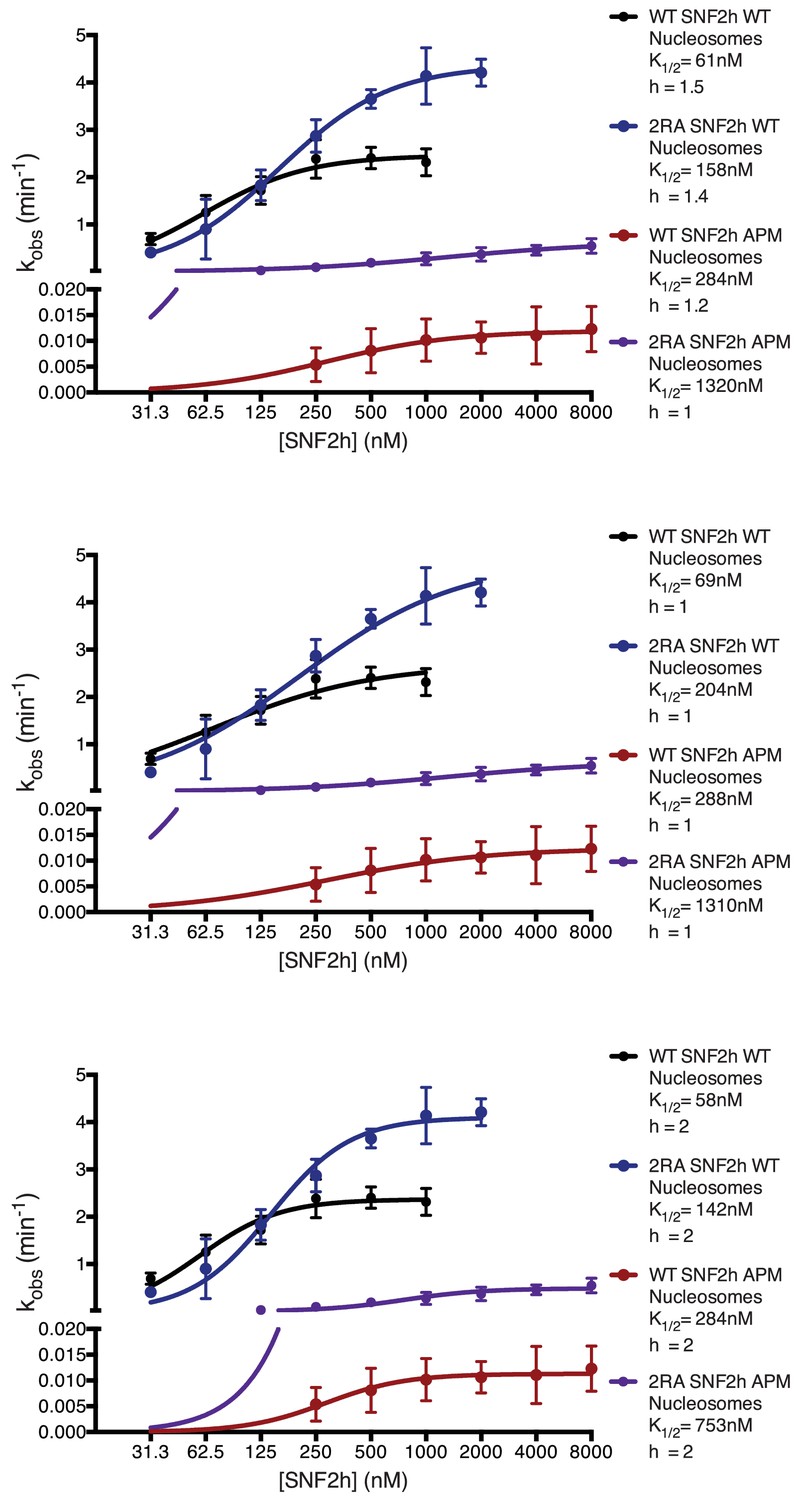
Saturation Kinetics Experiments.
Fits of the dependence of remodeling rates on enzyme concentration for each enzyme-substrate pair. Previous work indicates that SNF2h cooperatively remodels nucleosomes as a dimer, suggesting the data should fit to a hill coefficient greater than 1 (Racki et al., 2009). However, we cannot rule out that mutations may affect the cooperative association of SNF2h. To address this, reactions were fit with either a floating hill coefficient (top) or constrained to hill coefficient of 1 (middle) or 2 (bottom). Both Kmapp and kmax change less than 2-fold regardless of whether the data are fit to a fixed hill coefficient or fit to a floating coefficient.
-
Figure 2—figure supplement 3—source data 1
Values used to obtain plots.
- https://doi.org/10.7554/eLife.35322.016
Figure 2—figure supplement 4

Acidic Patch-SNF2h Crosslinks Unique to the ADP•BeFx condition.
Residue level cross-links between SNF2h and the H2A/H2B acidic patch. Each dot represents a pair of amino acid residues that were identified in either the ADP-BeFx experiment or the ADP experiment (right two panels, black). The left panel displays only the cross-links uniquely identified in the presence of ADP-BeFx (magenta). The area of each dot is scaled to the number of spectral counts identified. Domain boundaries are indicated by bold grey lines and labeled for SNF2h. Only cross-links to the H2A and H2B acidic patches (defined as H2A:44–100 and H2B:100–122) are plotted here for clarity. Crosslinks between H2A acidic patch and SNF2h AutoN domain are only observed with ADP-BeFx. Likewise crosslinks between the H2B acidic patch and the SNF2h NegC domain are only observed with ADP-BeFx. Positions of the 2RA mutants (R142, R144) are marked by horizontal red lines.
Figure 2—figure supplement 5
Comparison of crosslinks in the ADP•BeFx state with and without LANA peptide.
(A) Domain diagram of SNF2h (B) Direct domain-domain interactions of SNF2h and Nucleosomes with ADP•BeFx in the presence or absence of the LANA peptide. The LANA peptide is expected to compete with domains on SNF2h that bind the acidic patch resulting in reduced crosslinking to this region of the nucleosome. Residue-residue crosslink data were aggregated into domain-domain level spectral counts and plotted as in Figure 2B. The fold change between ADP•BeFx with and without LANA peptide is displayed as the log2 of the spectral count ratio with the data centered to the median fold change. The domain interactions most enriched in the presence of the LANA peptide are colored in brown, while the interactions promoted in the absence of the peptide are colored in magenta. Light grey tiles indicate no crosslinks observed in either condition. Crosslinks between the H2A acidic patch and both the RecA lobes and the autoinhibitory domains are strongly reduced, while crosslinks to the HSS domain are less affected. The distribution of fold changes in domain-domain spectral counts is plotted as a histogram to the right.
Figure 3 with 3 supplements
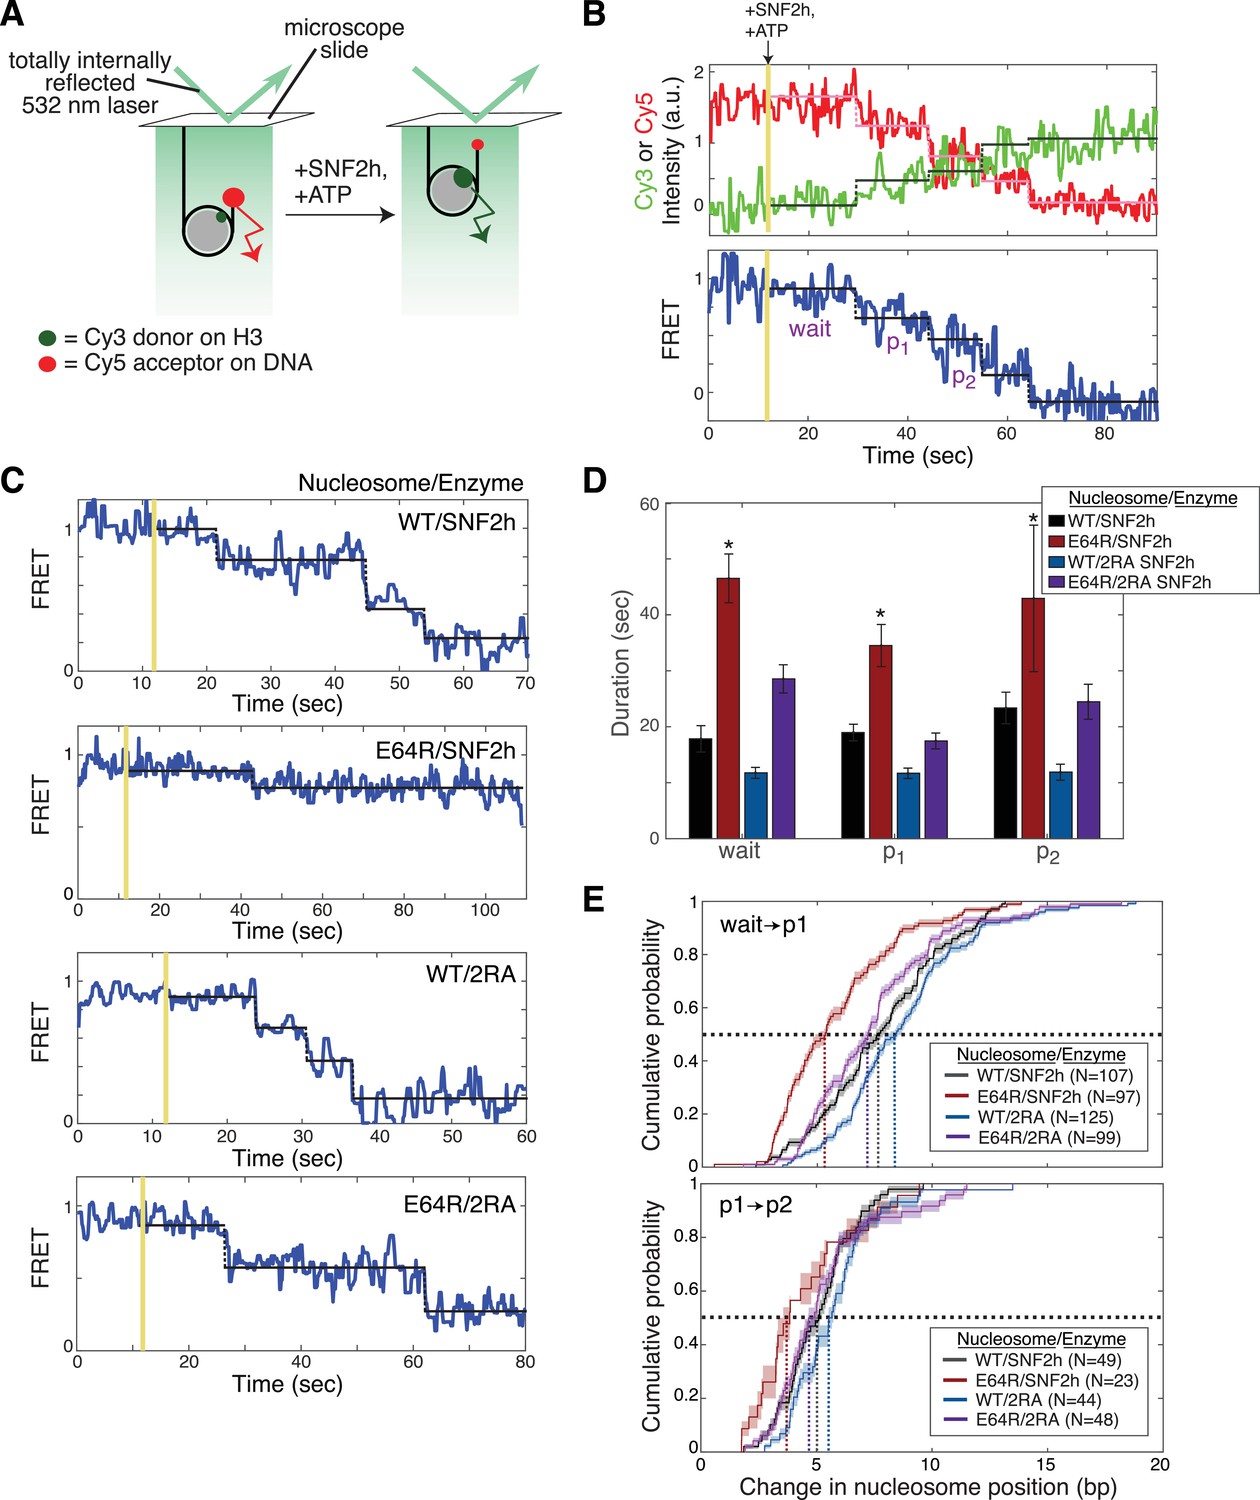
The acidic patch interacts antagonistically with AutoN to promote pause exit and persistent translocation.
(A) Schematic of the smFRET setup. Nucleosomes labeled on histone H3 with a Cy3 donor dye and on one end of the DNA with a Cy5 acceptor dye are immobilized on the surface of a slide and imaged with a prism-based TIRF microscope. The end-positioned nucleosomes used here have an initial high FRET efficiency (see also Figure 3—figure supplement 2). As remodeling proceeds and the nucleosome is moved away from the DNA end, the FRET efficiency is reduced. (B) Example time-course of remodeling of a single surface-attached, WT nucleosome in the presence of saturating SNF2h and ATP (400 nM and 1 mM, respectively). Vertical yellow line indicates addition of enzyme and ATP; horizontal pink, green, and black lines are the output of an HMM fit used to quantify pause durations and locations (see Methods). Note the alternating ‘pause’ and ‘translocation’ phases of the remodeling reaction; in keeping with the ISWI literature, we call the first pause the ‘wait’ pause, the second pause ‘p1’, the third ‘p2’, etc. Intensity and FRET data here and in C have been smoothed with a 0.95 s median filter for visualization only. (C) Example time-courses of remodeling of, from top to bottom, WT nucleosomes by SNF2h, E64R nucleosomes by SNF2h, WT nucleosomes by 2RA SNF2h, and E64R nucleosomes by 2RA SNF2h. Saturating enzyme (400 nM enzyme with WT nucleosomes; 2 μM enzyme with E64R nucleosomes) and ATP (1 mM) were used in all cases. Additional examples are shown in Figure 3—figure supplement 2. (D) Quantification of the first three pause durations. *Indicates a lower limit; as shown in Figure 3—figure supplement 2B, remodeling of E64R nucleosomes by SNF2h is too slow to capture by smFRET, due to the competition between photobleaching of the dyes and remodeling by SNF2h. Errors were bootstrapped (see Materials and methods). (E) Empirical cumulative distribution functions (cdfs) of the change in nucleosome position during the first translocation event (top panel) and the second translocation event (bottom panel) for different combinations of nucleosome constructs and enzymes. Roughly 50% of the initial translocation events by SNF2h on WT nucleosomes move the nucleosome 7 bp or fewer (black dashed lines); in contrast, nearly 80% of initial translocation events by SNF2h on E64R nucleosomes move the nucleosome 7 bp or fewer. Similarly, during the second translocation event, SNF2h moves WT nucleosomes roughly 5 bp or fewer 50% of the time, whereas again nearly 80% of second translocation events for SNF2h with E64R nucleosomes result in step sizes 5 bp or fewer. Shaded areas represent bootstrapped error estimates (see Materials and methods). See also Figure 3—figure supplement 6 for additional representations of these data and a further discussion of step sizes.
-
Figure 3—source data 1
Values used to obtain plots.
- https://doi.org/10.7554/eLife.35322.024
Figure 3—figure supplement 1
smFRET controls.
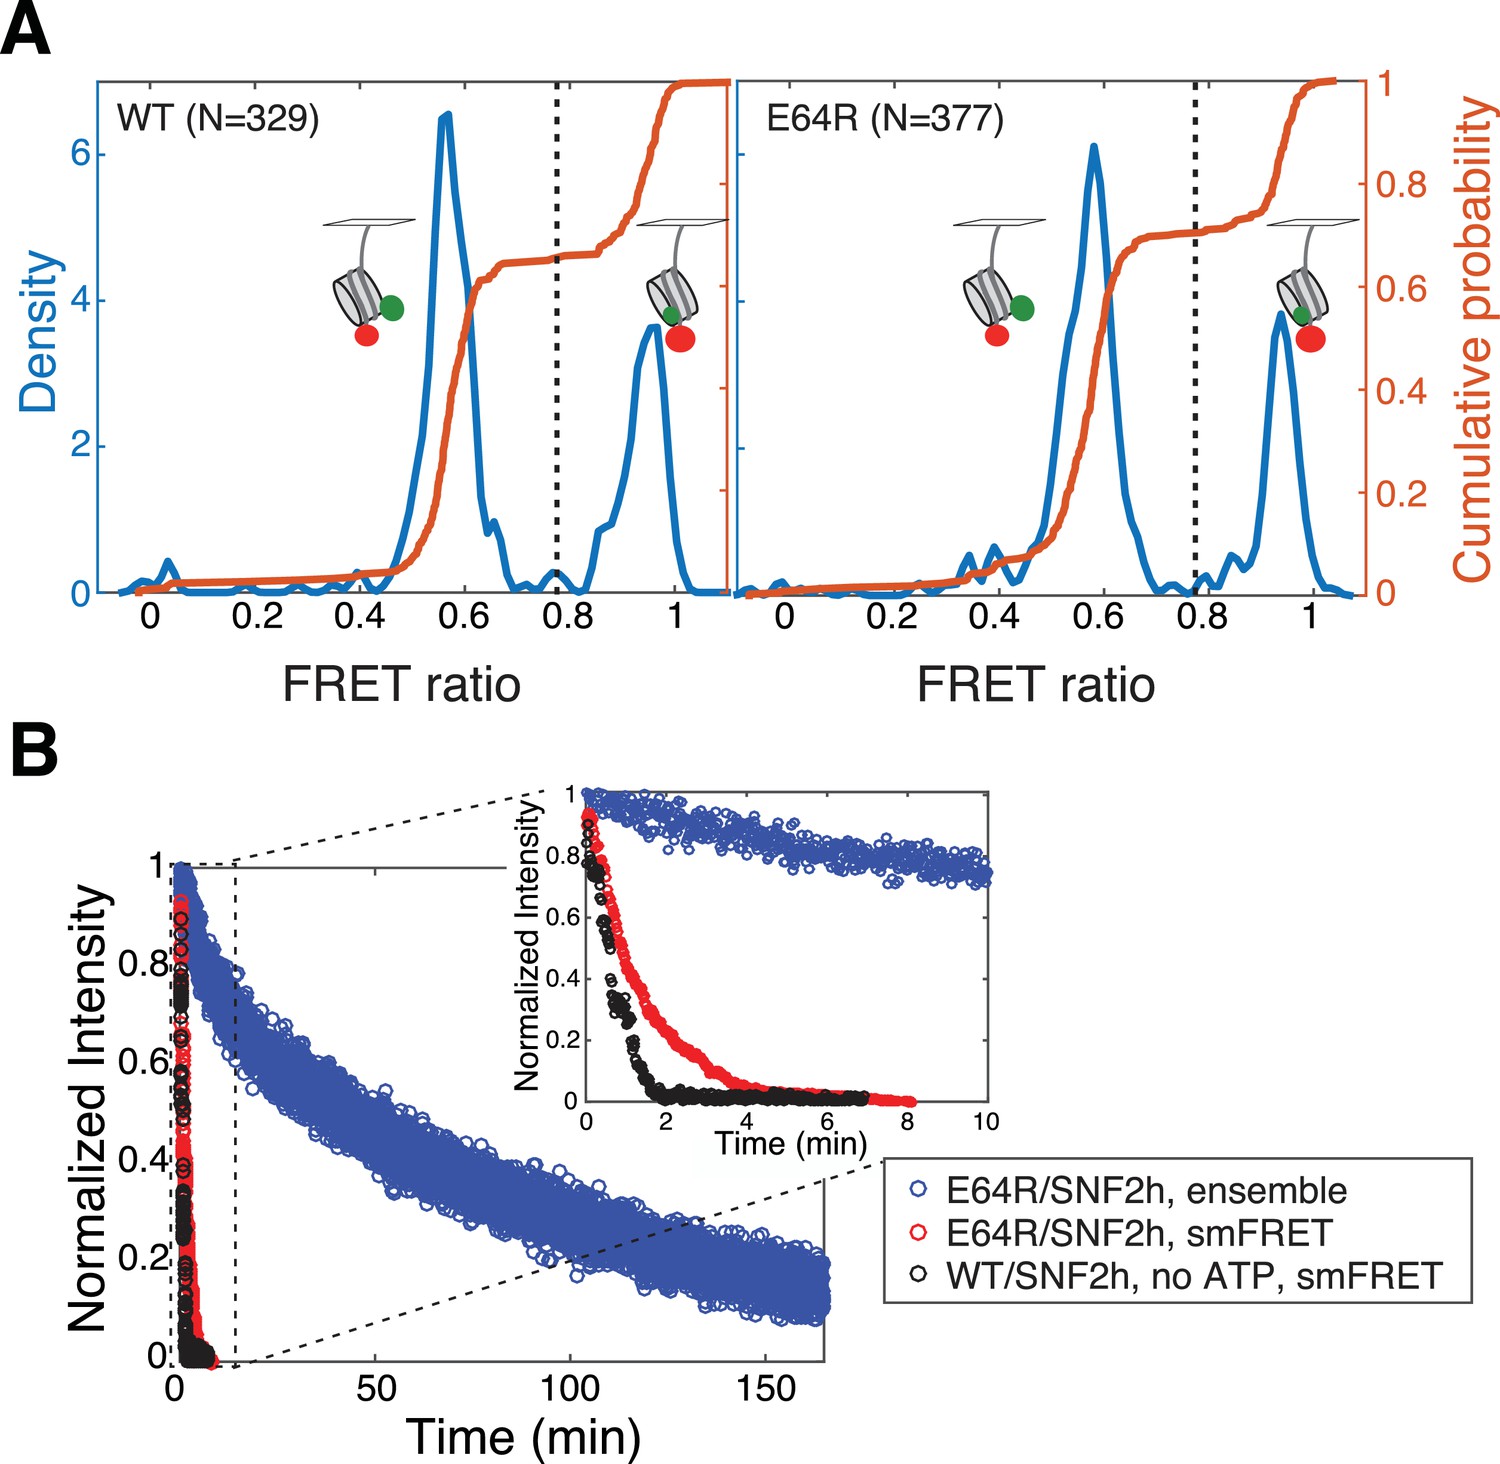
(A) Kernel density estimation plots (KDE, blue) and empirical cumulative density functions (cdfs, orange) of initial FRET values for 3/78 nucleosomes alone (in the presence of 1 mM ATP, but in the absence of remodeler; previous work with ISWI family remodelers has shown the addition of remodeler does not affect these initial FRET [Blosser et al., 2009; Deindl et al., 2013]). Left panel, wild-type H2A-containing nucleosomes; right panel, H2A/E64R-containing nucleosomes. N indicates the number of nucleosomes included in the cdf. KDEs are more intuitive—the y-axis is analogous to the frequency axis of a histogram—but cdfs have the advantage of not requiring any smoothing or binning. Note that here nucleosomes were imaged at a significantly higher laser power (20 mW) than for measuring remodeling (11.5 mW), to ensure that the majority of both donor and acceptor dyes photobleached within the 5 min imaging interval, so that dyes with two-step photobleaching events could be excluded. Only nucleosomes with an initial FRET value greater than 0.775 (black dashed lines) were included for further analysis. KDEs have Gaussian kernels with bandwidths ~ 0.01. (B) Our ability to measure remodeling of E64R nucleosomes by SNF2h is limited by the photobleaching rate. Previous work has shown remodeling in ensemble FRET assays to be comparable to remodeling in surface-immobilized smFRET assays (Blosser et al., 2009; Hwang et al., 2014), as well as to that of surface-attached dinucleosome constructs (Hwang et al., 2014). However, as shown here, remodeling of surface-attached E64R nucleosomes (red data) appears to go to completion in about 4 min (inset), whereas remodeling of these same nucleosomes in ensemble FRET assays (blue data) takes over two hours to go to completion. This discrepancy is not due to an effect of the surface immobilization, but rather to the competition between remodeling and photobleaching. In the presence of SNF2h alone, without ATP (black data), nucleosomes photobleach on roughly the same timescale as the apparent remodeling of surface-attached E64R nucleosomes. Thus we are able to put only a lower bound on pause durations for remodeling of E64R nucleosomes, because slower remodeling events are undetected due to the relatively fast photobleaching of the dyes. The smFRET data shown here corresponds to the summed Cy5 intensities of all individual nucleosomes in the indicated data set, binned in 1 s intervals to simulate an ensemble measurement.
Figure 3—figure supplement 2
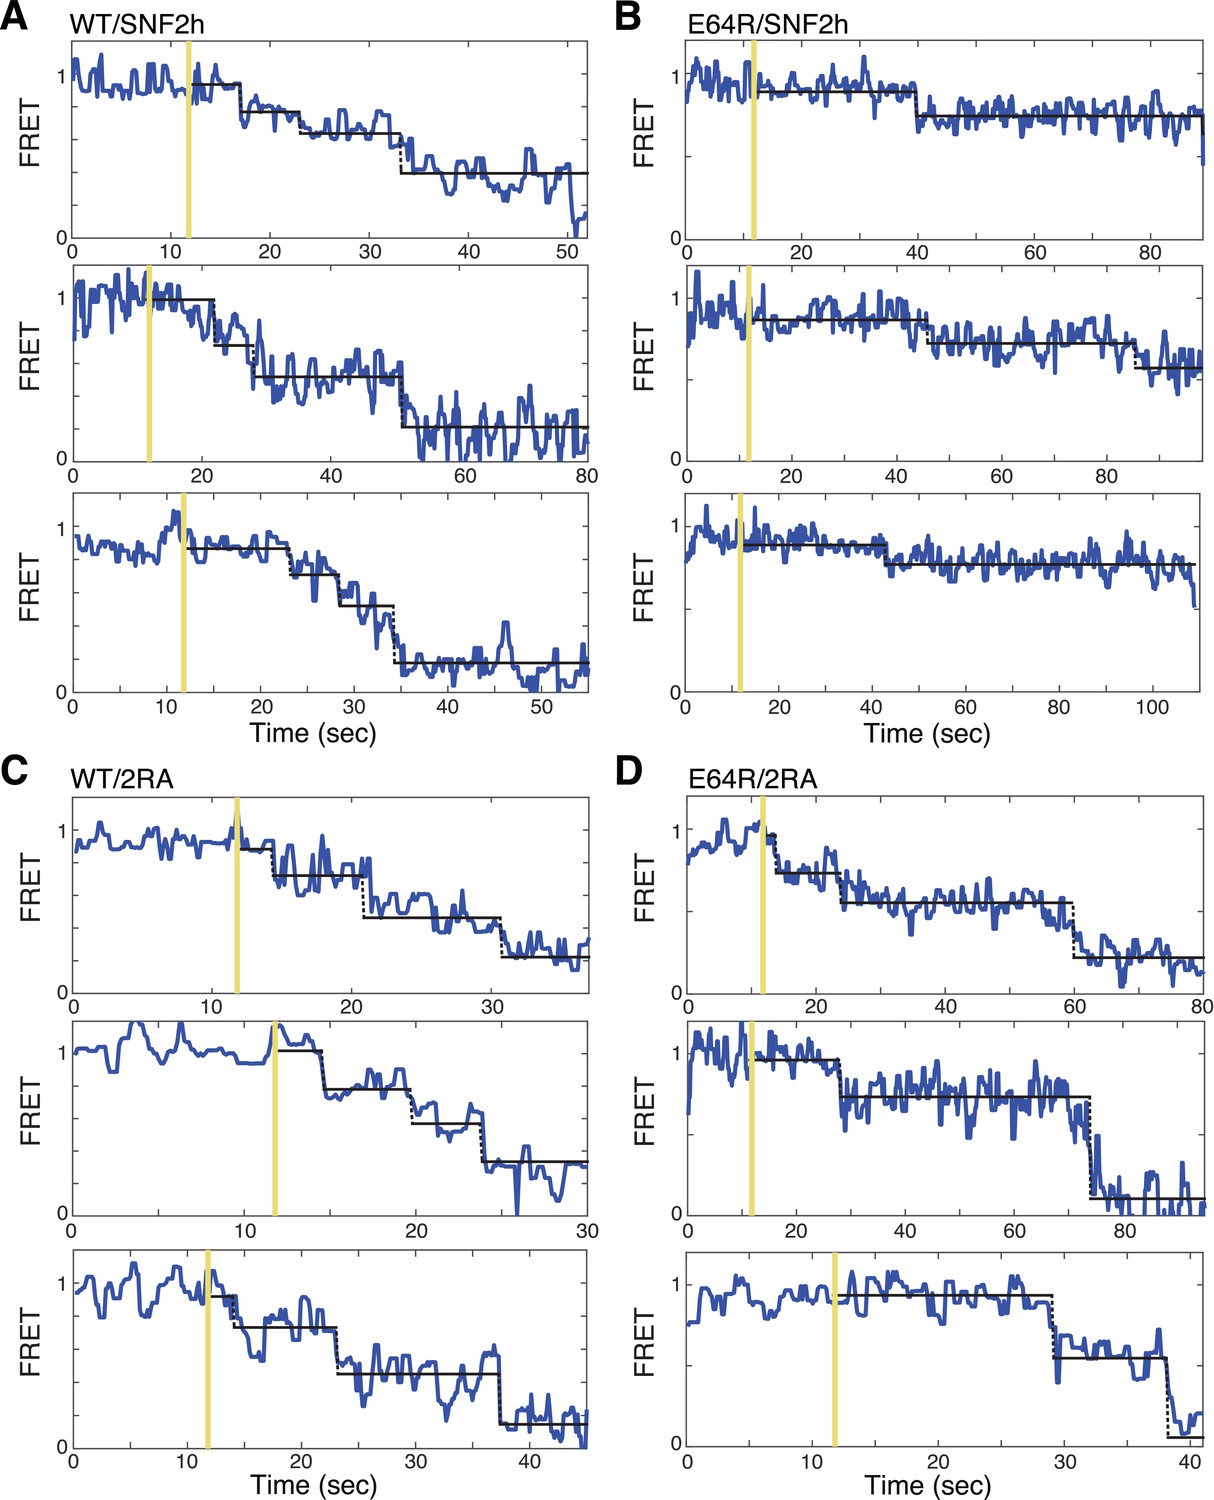
Additional example traces of SNF2h or SNF2h/2RA remodeling single nucleosomes, plotted as in Figure 3C.
https://doi.org/10.7554/eLife.35322.022
Figure 3—figure supplement 3
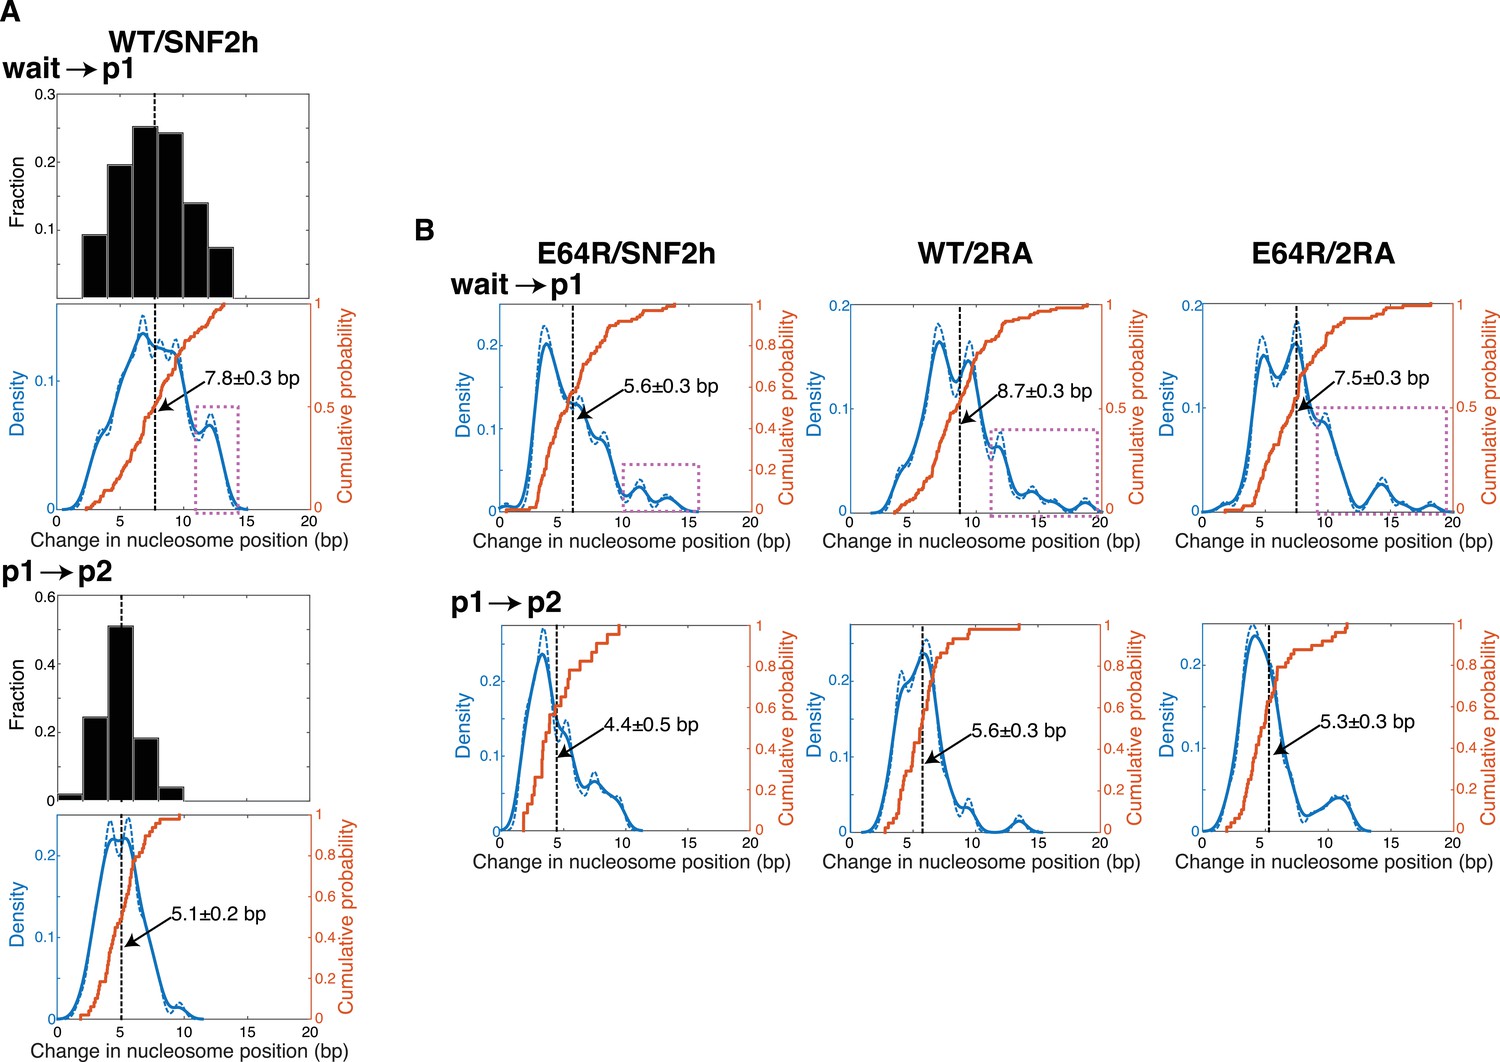
The step size of WT SNF2h with WT nucleosomes is comparable to step sizes previously described for ISWI family remodelers.
(A) Three different representations of the change in nucleosome position (that is, the step size) during the first (top) or second (bottom) translocation event observed by smFRET, for the ≥100 remodeling trajectories collected with WT nucleosomes and WT SNF2h. The three representations are: histograms in black; kernel density estimations (KDEs) with two different bandwidths (0.6, solid blue lines; 0.4, dashed blue lines) in blue; and cumulative distribution functions (cdfs) in orange. Vertical black dashed lines indicate the mean value, with the value of this mean step size ± SEM given on the KDE/cdf plot. The histograms in black illustrate how the step sizes for SNF2h generally form a cluster, consistent with previous reports for other ISWI-family remodelers (Blosser et al., 2009; Deindl et al., 2013; Hwang et al., 2014). However, the other two representations of the same data reveal additional structure that is difficult to discern from the histograms alone. For example, the purple box over the top KDE indicates steps that likely represent nucleosomes that skipped the p1 pause, or whose p1 pause was too short to detect, such that the nucleosome was moved ~(eight bp +5 bp)=13 bp during the first translocation. For WT ISWI-family remodelers remodeling WT nucleosomes, the initial step has been reported to range from 6.9 ± 0.1 bp to 7.4 ± 0.1 bp, and the second step from 3.0 ± 0.1 to 3.7 ± 0.2 (Blosser et al., 2009; Deindl et al., 2013; Hwang et al., 2014). The difference of ~1 bp in the size of the second step between our work and that in the literature likely results from the different approaches used to obtain the mean step size. B. KDE and cdf plots as in A, but for the other three combinations of nucleosomes and SNF2h constructs shown in Figure 3. Due to their lack of binning or smoothing parameters, cdfs represent the best quantitative comparison between data sets. However, for assessing the step size within a single data set, KDEs can provide a more intuitive picture. Cdfs here are the same as in Figure 3E (though shown here without the error estimate).
Figure 4
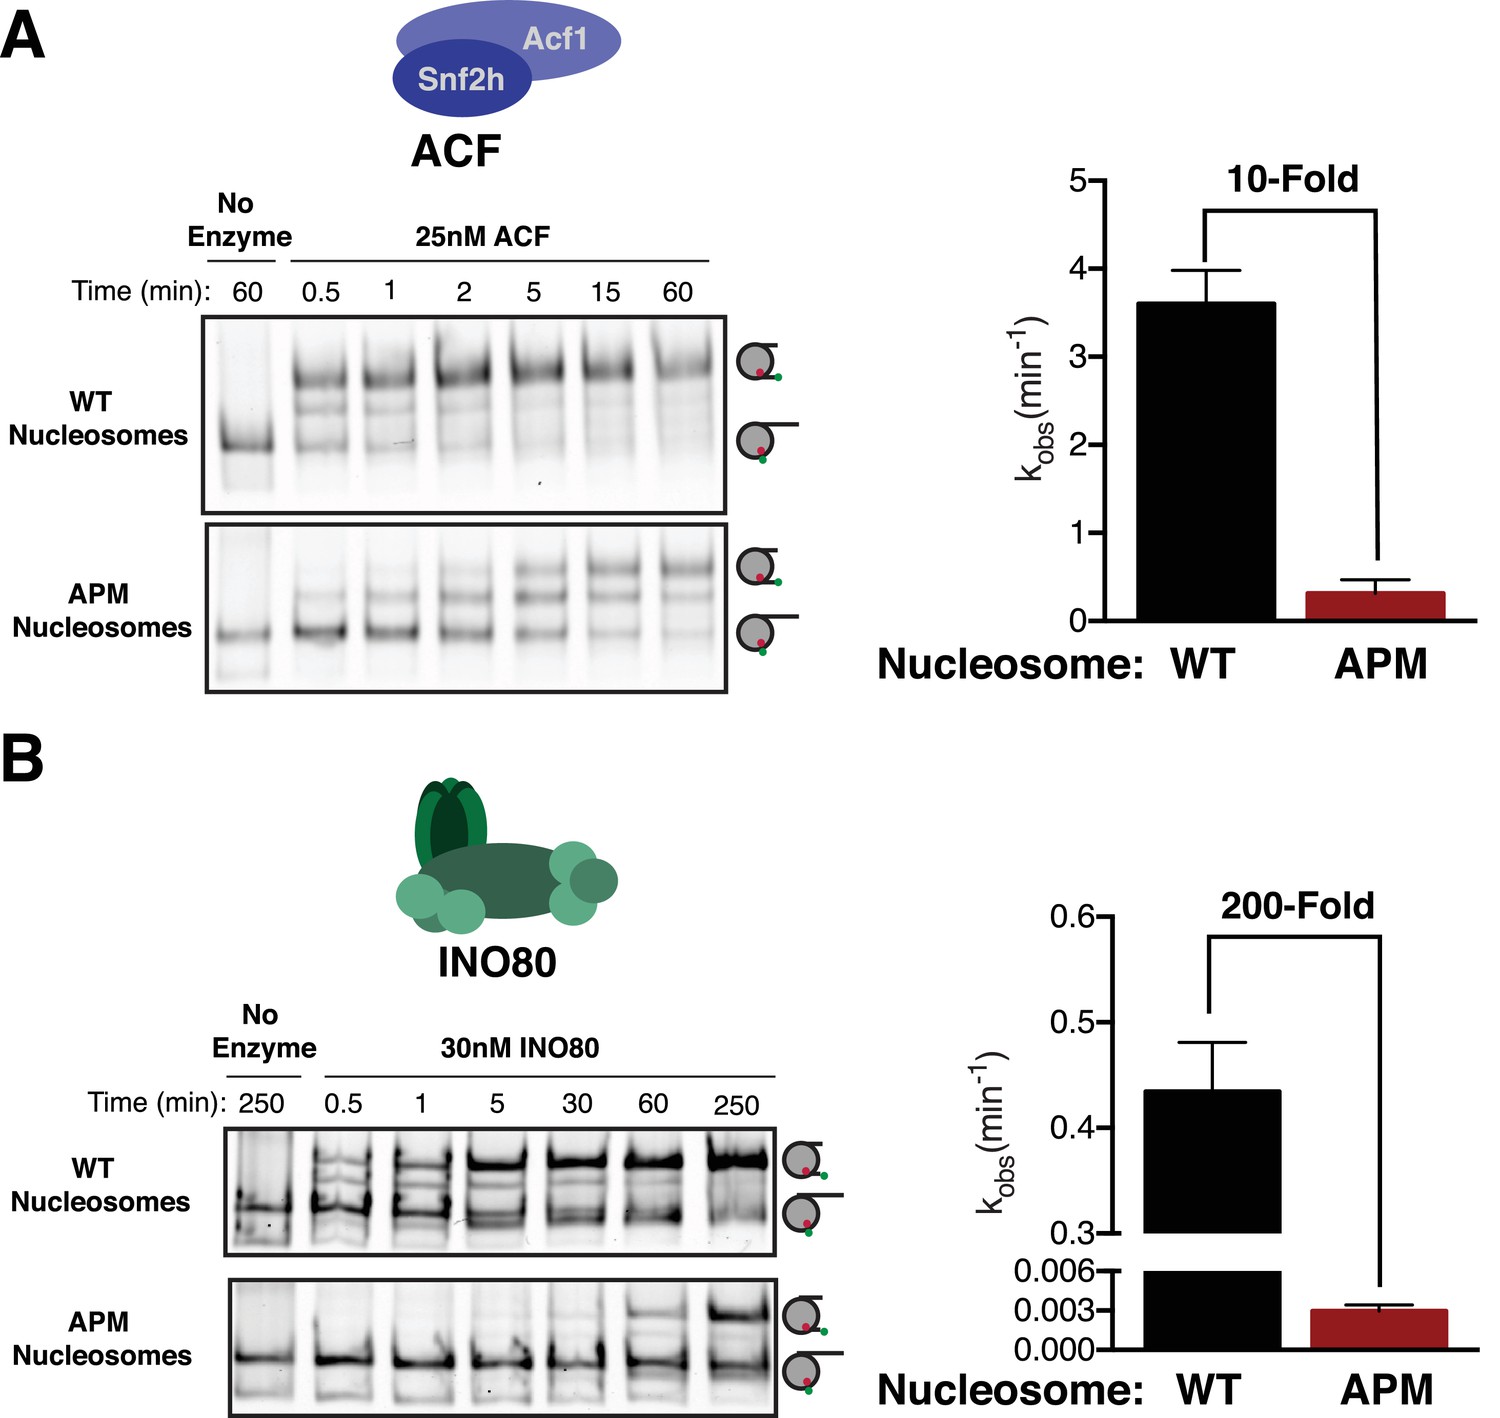
The acidic patch is used by ACF and INO80.
(A) Gel remodeling assay with human ACF and 0/60 nucleosomes. Saturating concentrations of enzyme and ATP were used. (B) Gel remodeling with the yeast INO80 complex and 0/60 nucleosomes. Reactions were performed with saturating enzyme and ATP. Error bars represent standard error of the mean for N = 3 replicates.
-
Figure 4—source data 1
Values used to obtain plots.
- https://doi.org/10.7554/eLife.35322.026
Figure 5
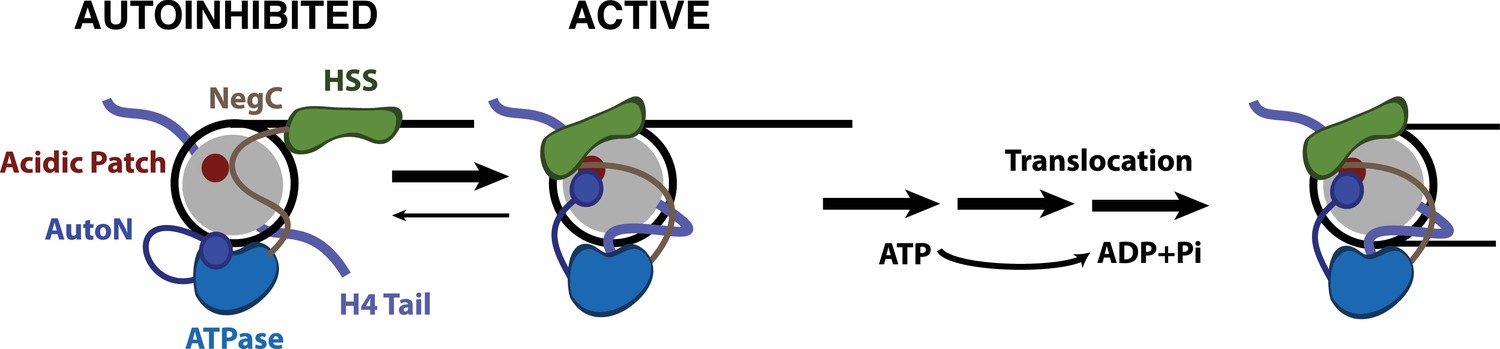
Model for nucleosome remodeling by SNF2h.
After binding the nucleosome, SNF2h is in equilibrium between an active and autoinhibited state. In the autoinhibited state AutoN and NegC hold the remodeler in an inactive state. The active state is promoted by AutoN and NegC binding near the acidic patch and by H4 tail binding the ATPase domain resulting in conformational changes that bring HSS in close proximity to the acidic patch. From this active state, SNF2h can translocate DNA around the octamer. Although SNF2h remodels nucleosomes as a dimer at saturating enzyme concentrations (Blosser et al., 2009; Racki et al., 2009), in this model we display only one of the protomers for simplicity.
Author response image 1
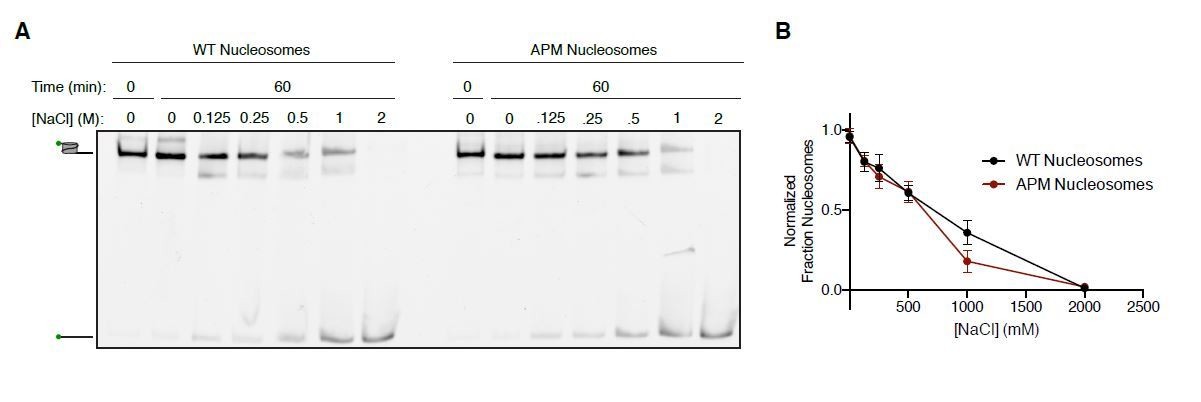
Salt-based nucleosome dissociation of WT and APM nucleosomes.
A. 15 nM 0/60 cy3-DNA labeled Nucleosomes were incubated in 25 mM HEPES pH 7.5 and varing concentrations of NaCl at 20ºC and resolved on a 6% native polyacrylamide gel. The gels were scanned for the cy3 label (green symbol on nucleosome and DNA cartoons on left of gel). B. Quantification of the fraction of nucleosomes remaining as a function of salt concentration. Fraction nucleosomes was determined by taking the ratio of the signal for the nucleosome bands to the signal for all the bands in each lane. Values were normalized to unincubated controls. The points and error bars plotted reflect the mean and standard error for n=3 experiments.
Author response image 2
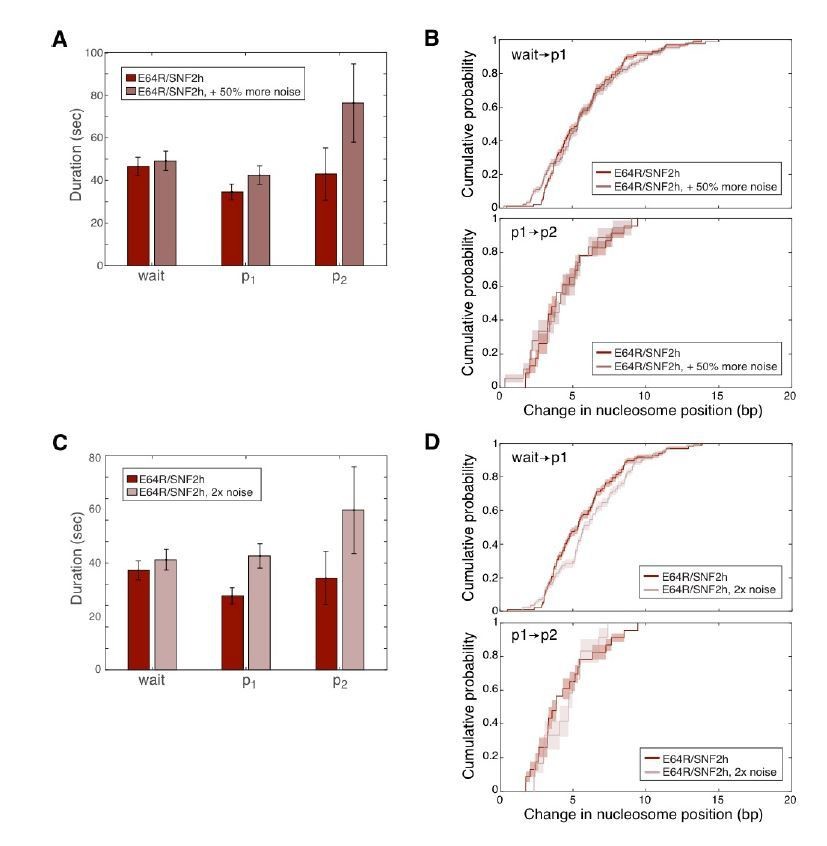
The addition of synthetic noise does not significantly change the outcome of our HMM fitting routine.
Synthetic, uncorrelated, Gaussian-distributed noise was added independently to the Cy3 and Cy5 intensities for each E64R/WT trace, and then the pyhsmm analysis was re-run on these noisier data. Pause durations and changes in nucleosome positions (step sizes) were then re-computed and are here plotted as in Figure 3 in the main text. In A and B, the standard deviation of the added Gaussian noise was 0.4; in C and D, the standard deviation of the added noise was 0.6. The standard deviations of the original Cy3 and Cy5 intensity data were on average 0.5 and 0.3 respectively, so the data in A and B have about 50% more noise than the original data, while the data in C and D have about double the noise of the original data.
Author response image 3

Comparison of the fit obtained by our HMM algorithm (pyhsmm) to that obtained by the Kerssemakers algorithm.
Cy5 intensities (red data), Cy3 intensities (green data), and FRET values (blue data) are shown for 4 of the example traces in Figure 3 and Figure 3—figure supplement 5. Data are plotted as in those figures (including a 0.95-second smoothing filter, for visualization only). Dashed red and green lines in top panels show fits generated by pyhsmm to the Cy3 and Cy5 intensity data; dashed gray lines in the bottom panels show pyhsmm results in terms of FRET. The Kerssemakers algorithm acts only on the FRET values, so the outcome of Kerssemakers is shown on the bottom FRET panels only, as solid black lines.
Author response image 4
Histograms of FRET values for the p1 and p2 pauses for WT SNF2h with WT nucleosomes.
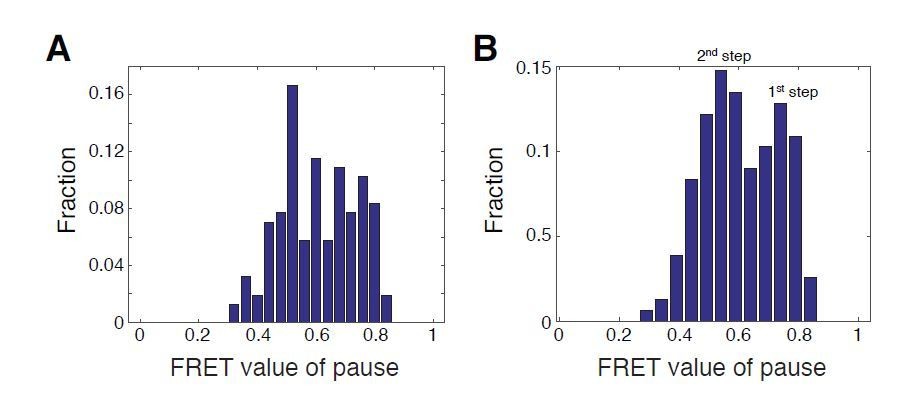
A. Bin positions as in Blosser et al., 2009 (every 0.04 FRET, starting at 0 FRET). B. Bin positions every 0.05 FRET, starting at 0.04 FRET. Due to the non-linearity of our calibration curve, FRET values of pauses are not representative of preferential step locations. We show histograms of FRET values here simply to illustrate the effect of bin choice on the way the data appear, which we chose to do with reference to previously published histograms of FRET values from Blosser et al.,2009.
Additional files
-
Supplementary file 1
Crosslinked residue pairs identified from EDC treatment of SNF2h-nucleosomes in the presence of: ADP, ADP-BeFx, or ADP-BeFx and LANA peptide.
- https://doi.org/10.7554/eLife.35322.028
-
Transparent reporting form
- https://doi.org/10.7554/eLife.35322.029
Download links
A two-part list of links to download the article, or parts of the article, in various formats.
Downloads (link to download the article as PDF)
Open citations (links to open the citations from this article in various online reference manager services)
Cite this article (links to download the citations from this article in formats compatible with various reference manager tools)
The nucleosomal acidic patch relieves auto-inhibition by the ISWI remodeler SNF2h
eLife 7:e35322.
https://doi.org/10.7554/eLife.35322


