Epigenetic drift of H3K27me3 in aging links glycolysis to healthy longevity in Drosophila
- Hui Wang

- Yuping Cai
- Kongyan Niu
- Xiaofen Wu
- Huanhuan Ma
- Yun Yang
- Wenhua Tong
- Feng Liu
- Zhandong Liu
- Yaoyang Zhang
- Rui Liu
- Zheng-Jiang Zhu
- Nan Liu
- Shanghai Institute of Organic Chemistry, China
- University of Chinese Academy of Sciences, China
- State Key Laboratory of Medical Genomics, Rui-Jin Hospital, Shanghai Jiao Tong University School of Medicine, China
- Texas Children’s Hospital, United States
- Baylor College of Medicine, United States
- Singlera Genomics, China
Figures
Figure 1 with 1 supplement
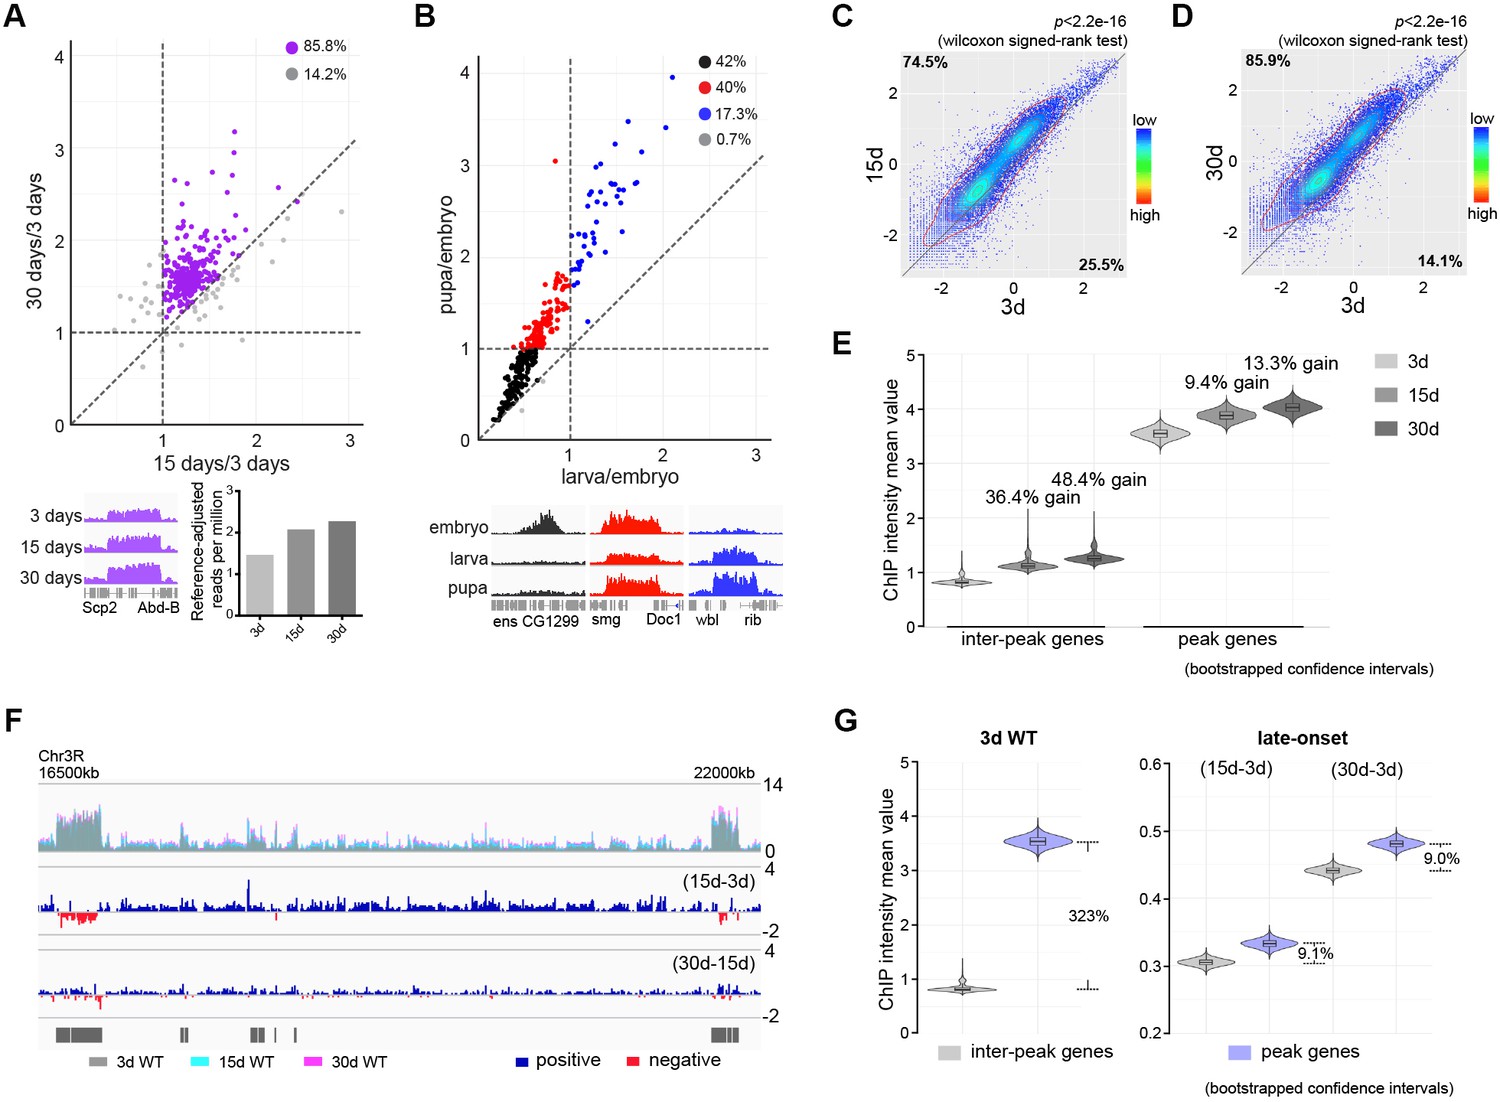
Adult-onset fidelity loss results in epigenetic drift of H3K27me3.
(A) H3K27me3 peak profiles are comparable between young and aged animals. A scatter plot (top panel) of 331 peaks and a genome browser mini-view (bottom, left panel) illustrated that H3K27me3 had comparable peak profiles between young and aged animals. Peaks were identified from four biological replicates of 3d and 30d male flies using Homer. Data plotted are mean values of peak region at 15d (X-axis) or 30d (Y-axis) as compared to 3d. Each dot on the plot represents a peak locus. For quantitative comparison, the dm6 mapped reads were normalized to a scale factor using deeptools function bamCoverage (see Materials and methods for further details). Majority of peak regions were well maintained during aging (purple). Bar chart (bottom, right panel) showed that the number of Reference-adjusted Reads Per Million (RRPM) using ChIP-Rx datasets, exhibiting a progressive increase of H3K27me3 level with age. ChIP-seq was from muscle tissues of 3-, 15-, and 30d-old male flies. Genotype: 5905. (B) H3K27me3 modification undergoes dramatic gain or loss during development. A scatter plot (top panel) of 300 peaks showed dynamic changes of H3K27me3 signals during embryo, larvae, and pupae. Peaks were identified from two biological replicates of three developmental stages. Data plotted are mean values of peak region at larva (X-axis) or pupa (Y-axis) as compared to embryo. Each dot on the plot represents a peak locus. A scale factor normalized dm6 mapped reads were used to generate the mean value of each peak. Method same as (A). As illustrated by the genome browser mini-view for select genes (bottom panel), H3K27me3 modification was either embryo-specific (black) or selectively decreased in larvae (red), or progressively increased from embryo, larvae to pupae (blue). ChIP-seq was from whole embryo, larvae, and pupae. Genotype as in (A). (C) and (D) H3K27me3 modification increases with age. Scatter plot showed H3K27me3 levels for protein-coding genes (transcriptional start site to transcriptional termination sites as annotated in dm6) of in 3d as compared to 15d (C) and 30d (D). (wilcoxon signed-rank test, p<2.2e-16). The dm6 mapped reads were normalized to a scale factor to compare the relative H3K27me3 level quantitatively. Each dot on the plot represents a single gene locus. X- and Y-axis represented log2 mean value of gene’s reference-adjusted reads. Contour lines indicated that H3K27me3 signals were higher in aged flies compared to 3d-old flies. ChIP-seq and genotype as in (A). (E) Inter-peak genes receive relatively more H3K27me3 modification during aging. We used bootstrapping to generate the mean reference-adjusted ChIP intensity of peak genes or inter-peak genes (10,000 draws with replacement of n = 500). Violin plots represent the bootstrapped mean H3K27me3 level of inter-peak genes (left) and peak genes (right) at 3d, 15d, and 30d. In aging flies, inter-peak genes gained relatively more signal (15d: 36.4%, 30d: 48.4%) than peak genes (15d: 9.4%, 30d: 13.3%). Net gain of H3K27me3 signals during aging was calculated by a subtraction of the mean signal intensity between aged and 3d. Bootstrapped 95% confidence intervals: 3d inter-peak genes: [0.758, 1.017]; 15d inter-peak genes: [1.023, 1.401]; 30d inter-peak genes: [1.149, 1.562]; 3d peak genes: [3.349, 3.739]; 15d peak genes: [3.681, 4.075]; 30d peak genes: [3.817, 4.230]. ChIP-seq and genotype as in (A). (F) H3K27me3 modification during aging has reduced selectivity. Genome browser view of a 5.5 Mb region in the chromosome 3R was shown. H3K27me3 occupancy overlaid between 3d (grey), 15d (cyan), and 30d (pink) (top panel). H3K27me3 modification during aging was shown by deducting 3d signals from those at 15d (middle panel) and by deducting 15d signals from those at 30d of age (bottom panel). The increased modifications had no direct correlation with pre-existing peaks. Black boxes and lines represented peak regions, corresponding to their chromosomal locations. ChIP-seq and genotype as in (A). (G) Violin plots indicate that signals are highly preferential at the peak regions at 3d (left, about 323% more signal compared to inter-peak), but for signals gained during aging, selectivity is dramatically reduced (right, only about 9% more signal acquired by peak than inter-peak). Method same as (E). The proportion of more signals in peak genes was computed by a subtraction of the mean signal intensity between peak genes and inter-peak genes. Bootstrapped 95% confidence intervals: 3d inter-peak genes: [0.758, 1.017]; 3d peak genes: [3.349, 3.739]; late-onset (15d-3d) inter-peak genes: [0.295, 0.315]; (15d-3d) peak genes: [0.320, 0.345]; (30d-3d) inter-peak genes: [0.430, 0.452]; (30d-3d) peak genes: [0.468, 0.493]. ChIP-seq and genotype as in (A).
Figure 1—figure supplement 1
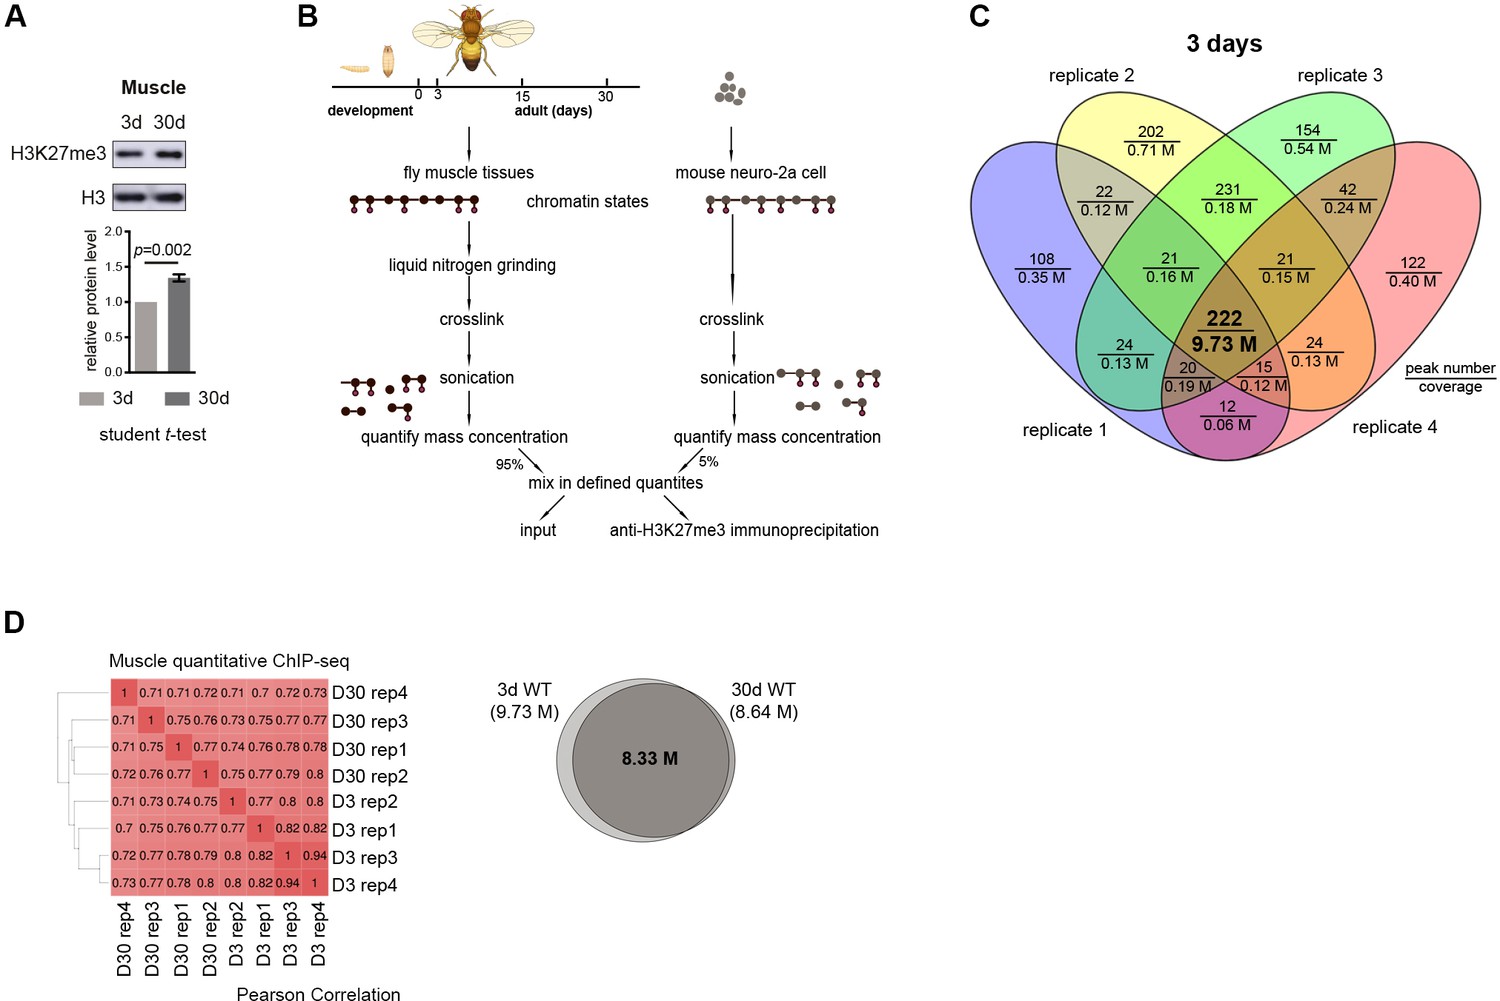
Global occupancy of H3K27me3 modification is preserved with age.
(A) Western blot (top) and quantification (bottom) show an increase of H3K27me3 with age in muscle tissues. (mean ±SD of three biological repeats; student t-test). Genotype: 5905. (B) Quantitative ChIP-Rx protocol. A fixed amount of the mouse epigenome was introduced as the spike-in reference, thereby allowing quantitative and comparative assessment of the fly epigenomes. (C) Venn diagram shows the number of overlapped H3K27me3 enriched peaks and shared bases in peak regions from four replicates. ChIP-seq was from muscle tissues of 3d-old male flies. Genotype as in (A). (D) The distribution of H3K27me3 in genome is preserved in muscle tissues with age. Cistrome correlation tools were used to generate the heatmap according to pair-wise correlation coefficients. Pair-wise Pearson correlations (left panel) of genome-wide H3K27me3 levels were calculated at windows of 1Kbps. Venn diagram (right panel) shows the number of shared regions in H3K27me3 enriched regions between 3d and 30d WT flies. Peak region reproducibly identified by four replicates were used to generate the Venn diagram. ChIP-seq was from muscle tissues of 3d- and 30d-old male flies. Genotype as in (A).
Figure 2 with 1 supplement
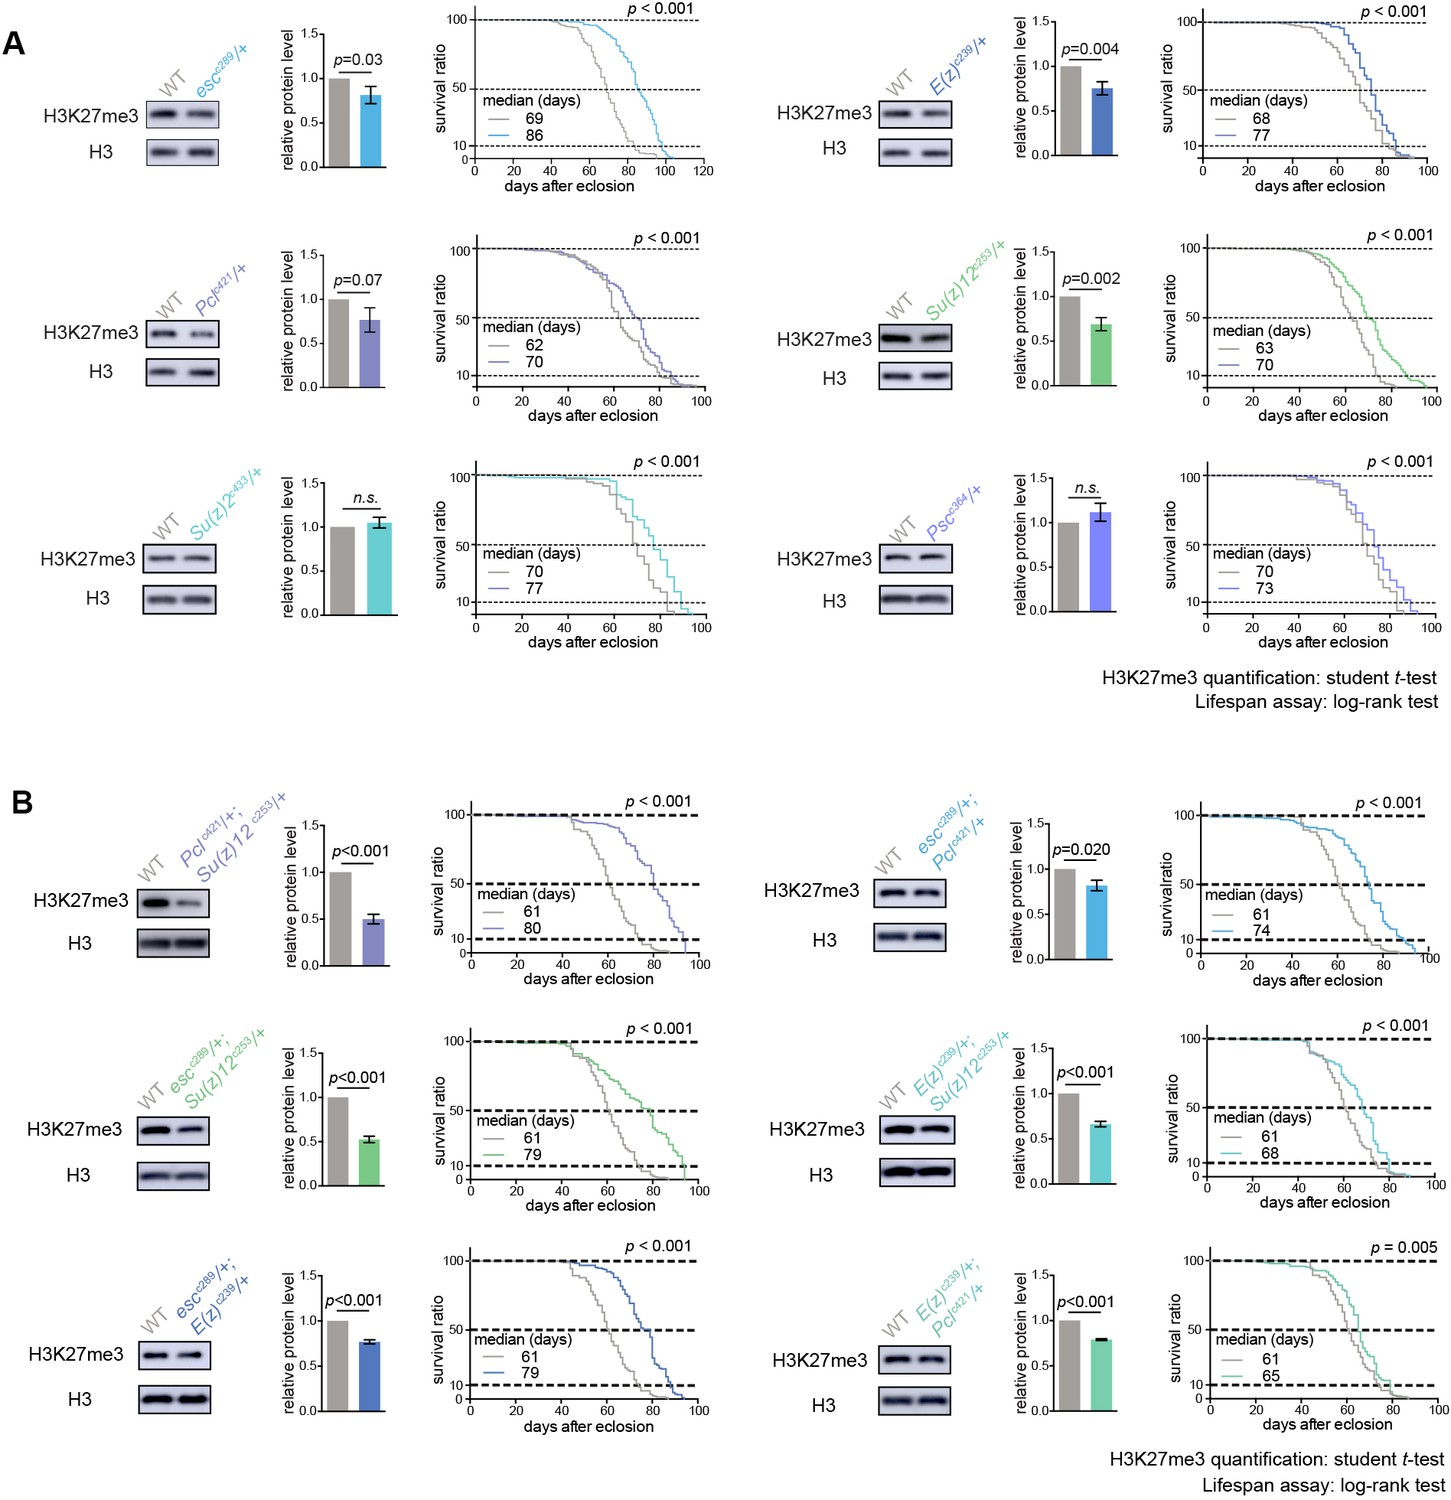
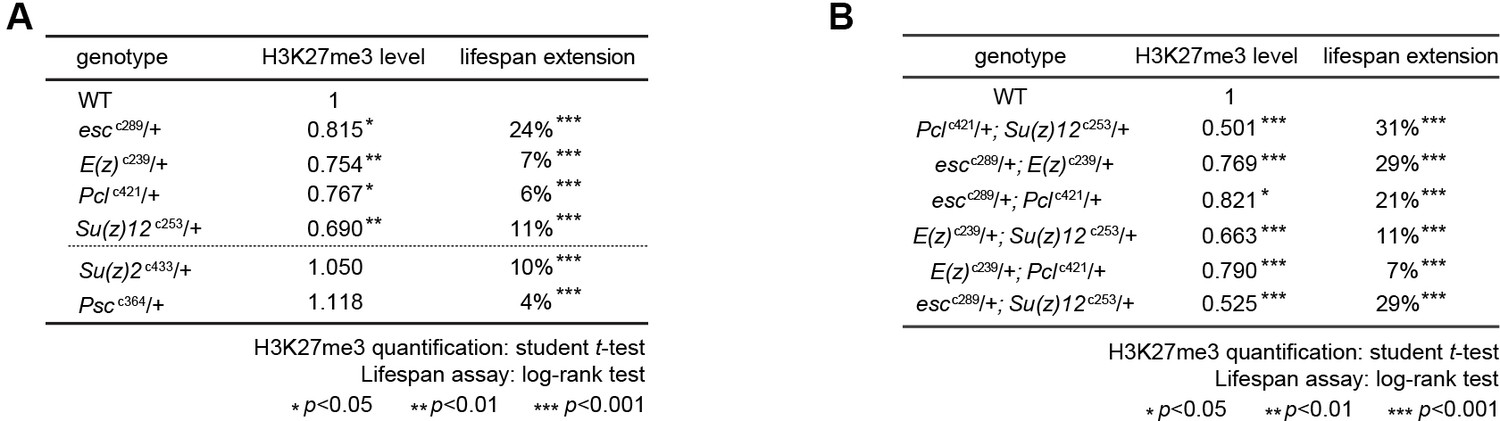
PRCs-deficient animals have extended lifespan.
(A) PRCs-deficient animals have extended lifespan. H3K27me3 western blot (left), H3K27me3 quantification (middle), and lifespan curve (right) for PRC single mutants. PRC2 heterozygous mutants of indicated genotype reduce H3K27me3 levels and extend lifespan; PRC1 heterozygous mutants of indicated genotype extend lifespan without changing H3K27me3 levels. To name new mutant, a superscript amended to the gene contained a letter c denoting CRISPR/Cas9 method followed by the size of genomic deletion. All mutants have been backcrossed with WT for five times to ensure a uniform genetic background. See also Figure 2—figure supplement 1A. Western blot was from head tissues of 3d-old male flies. (for H3K27me3 quantification: mean ±SD of three biological repeats; student t-test; for lifespan assay: 25°C; n ≥ 200 per genotype for curve; log-rank test). (B) Pair-wise combination of PRC2 trans-heterozygous double mutants of indicated genotype results in stronger effects in H3K27me3-reduction and life-extension. See also Figure 2—figure supplement 1B. Western blot was from head tissues of 3d-old male flies. (for H3K27me3 quantification: mean ±SD of three biological repeats; student t-test; for lifespan assay: 25°C; n ≥ 200 per genotype for curve; log-rank test).
Figure 2—figure supplement 1
PRCs-deficient animals have extended lifespan.
(A) PRCs-deficient animals have extended lifespan. PRC2 heterozygous mutants of indicated genotype reduce H3K27me3 levels and extend lifespan (top of the dashed line); PRC1 heterozygous mutants of indicated genotype extend lifespan without changing H3K27me3 levels (bottom of the dashed line). See also Figure 2A. Western blot was from head tissues of 3d-old male flies. (for H3K27me3 quantification: mean ±SD of three biological repeats; student t-test, *p<0.05, **p<0.01, ***p<0.001; for lifespan assay: 25°C; n ≥ 200 per genotype for curve; log-rank test, ***p<0.001). (B) Pair-wise combination of PRC2 trans-heterozygous double mutants of indicated genotype results in stronger effects in H3K27me3-reduction and life-extension. See also Figure 2B. Western blot was from head tissues of 3d-old male flies. (for H3K27me3 quantification: mean ±SD of three biological repeats; student t-test, *p<0.05, **p<0.01, ***p<0.001; for lifespan assay: 25°C; n ≥ 200 per genotype for curve; log-rank test, ***p<0.001).
Figure 3 with 1 supplement
Long-lived PRC2 mutants diminish the epigenetic drift of H3K27me3 during aging.
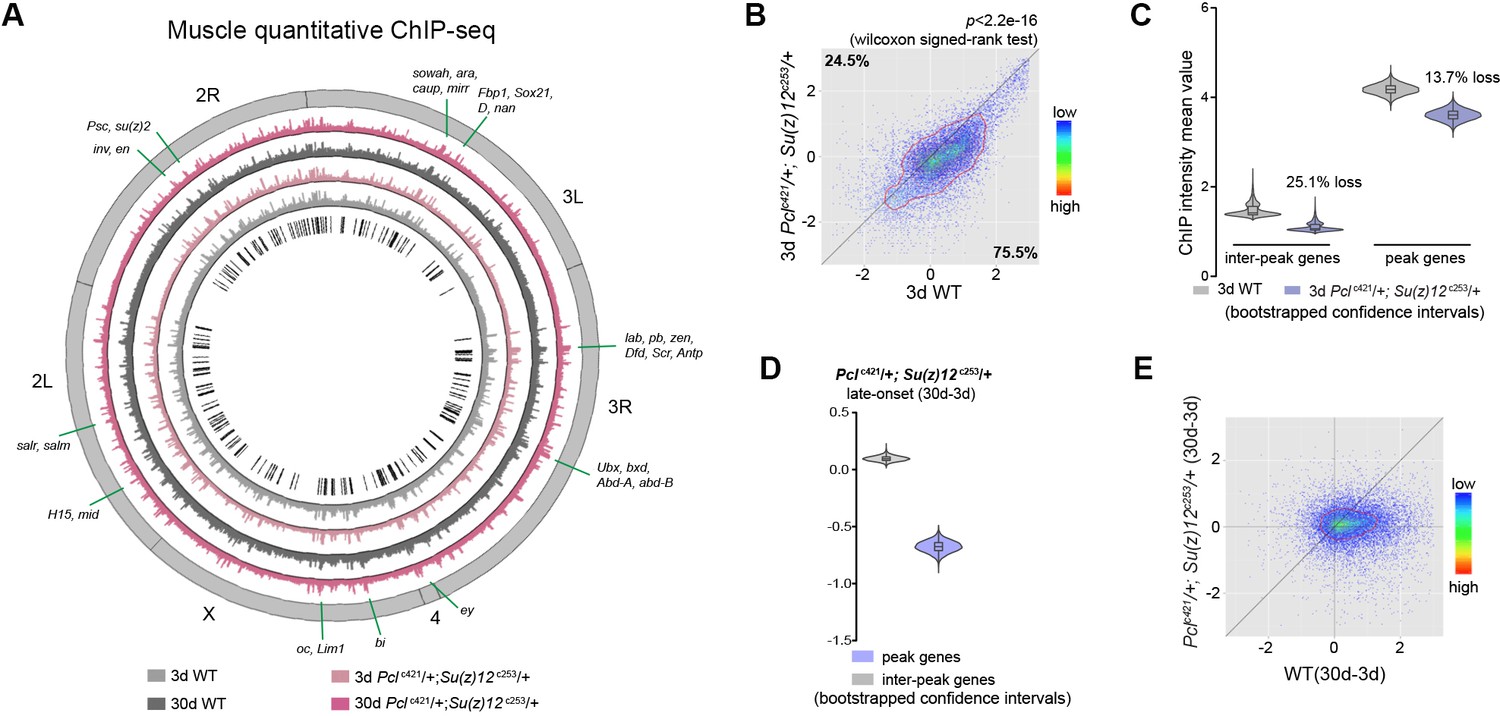
(A) Circos plot of the H3K27me3 epigenome illustrates peak profiles that are highly preserved with age and in PRC2 mutants. Black boxes and lines (innermost circle) represented common peak regions, corresponding to their chromosomal locations. Chromosome ideogram was in grey (outermost ring). PRC2 target genes previously found in cells and during development were shown next to their epigenomic loci. ChIP-seq was from muscle tissues of 3d- and 30d-old male flies. Genotypes: WT: 5905 and Pclc421/+; Su(z)12 c253/+. (B) H3K27me3 modification decreases in PRC2 mutants. Scatter plot showed H3K27me3 levels for gene bodies of all protein-coding genes in Pclc421; Su(z)12c253 as compared to WT. (wilcoxon signed-rank test, p<2.2e-16). Each dot on the plot represents a single gene locus. X- and Y-axis represented log2 mean value of genes’ reference-adjusted reads. Contour lines indicated that H3K27me3 signals were generally higher in WT compared to mutants. ChIP-seq was from muscle tissues of 3d-old male flies. Genotypes as in (A). (C) Inter-peak genes receive relatively less H3K27me3 modification in PRC2 mutants. In PRC2 mutant, inter-peak genes received relatively less signal (25.1%) than those of peak genes (13.7%). Reduction of signals was calculated by a subtraction of the mean signal intensity between WT and PRC2 mutants. Bootstrapped 95% confidence intervals: 3d inter-peak genes: [1.317, 1.861]; 3d Pclc421; Su(z)12c253 inter-peak genes: [0.944, 1.361]; 3d peak genes: [3.946, 4.414]; 3d Pcl421; Su(z)12253 peak genes: [3.364, 3.861]. ChIP-seq and genotypes as in (A). (D) Modification of H3K27me3 during aging has reduced selectivity in PRC2 mutants. Bootstrapped 95% confidence intervals: Pcl421; Su(z)12253 late-onset inter-peak genes: [0.053, 0.147]; Pcl421; Su(z)12253 late-onset peak genes: [−0.778,–0.578]. ChIP-seq was from muscle tissues of 3d and 30d old male flies. Genotypes: Pclc421/+; Su(z)12 c253/+. (E) Age-associated drifting of H3K27me3 is dampened in PRC2 mutants. Scatter plot showed gained H3K27me3 signal for all protein-coding genes in aged Pclc421; Su(z)12c253 and WT flies compared to young flies. Each dot on the plot represents a single gene locus. X- and Y-axis represented signal intensity transformed by Log2. Contour lines indicated that the majority of the gene signals displayed higher levels—thus more rapid changes—in aged WT compared to mutants. ChIP-seq and genotypes as in (A).
Figure 3—figure supplement 1
Long-lived PRC2 mutants diminish the epigenetic drift of H3K27me3 during aging.
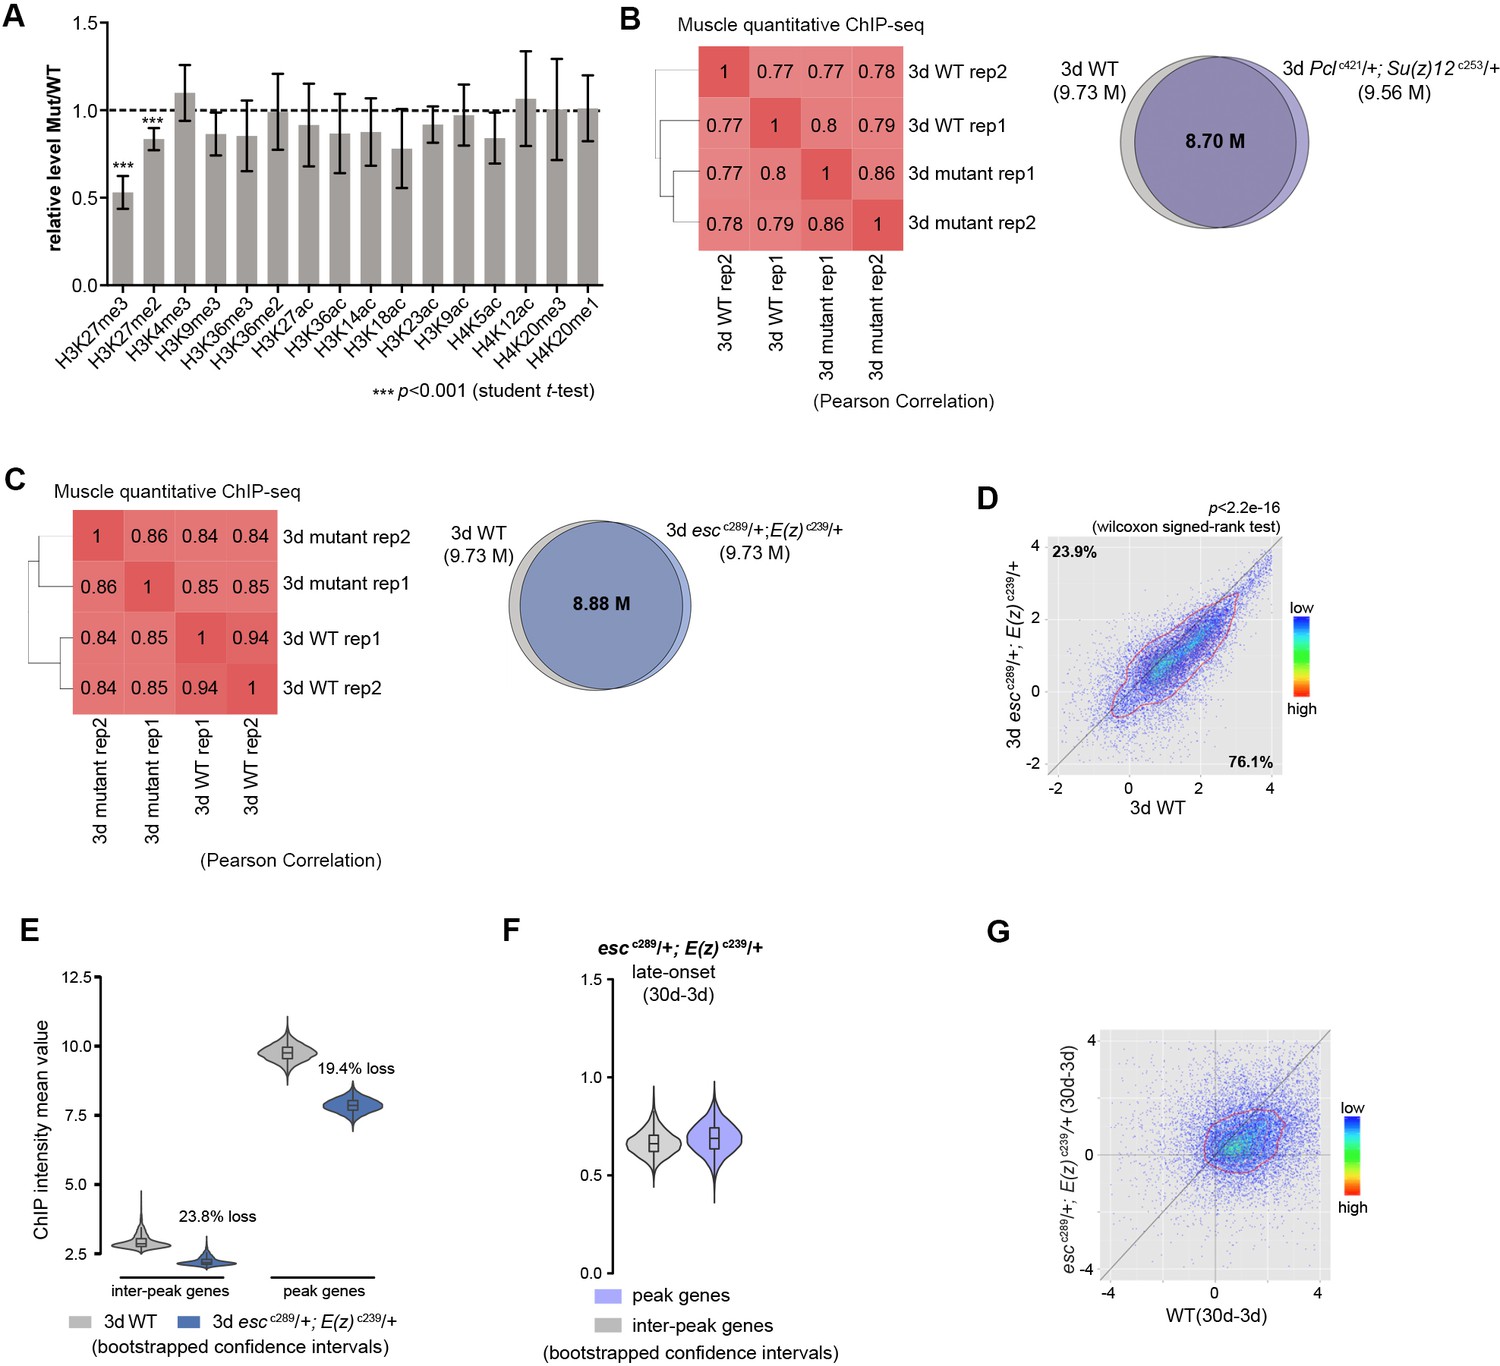
(A) Relative quantification of different histone marks between WT and PRC2 mutants. Only H3K27me2/3 were selectively reduced in PRC2 mutants. Western blot was from head tissues of 3d-old male flies. (for H3K27me3 quantification: mean ±SD of three biological repeats; student t-test, *p<0.05, **p<0.01, ***p<0.001). Genotypes: WT: 5905. Mut: Pclc421/+; Su(z)12 c253/+. (B) and (C) The modification of H3K27me3 is preserved in muscle tissue between WT and PRC2 mutant. Venn diagram shows the number of shared regions in H3K27me3 enriched regions between WT and PRC2 mutant. Peak region reproducibly identified by two replicates were used to generate the venn diagram. Method as in Figure 1—figure supplement 1D. ChIP-seq was from muscle tissues of 3d-old male flies. Genotypes: WT: 5905. Pclc421/+; Su(z)12 c253/+. escc289/+; E(z)c239/+. (D) H3K27me3 modification decreases in PRC2 mutants. Scatter plot showed H3K27me3 levels for all protein-coding genes in escc289; E(z)c239 as compared to WT. (wilcoxon signed-rank test, p<2.2e-16). Each dot on the plot represents a single gene locus. X- and Y-axis represented log2 mean value of genes’ reference-adjusted reads. Contour lines indicated that H3K27me3 signals were higher in WT compared to mutants. ChIP-seq was from muscle tissues of 3d-old male flies. Genotypes: WT: 5905. escc289/+; E(z)c239/+. (E) Inter-peak genes receive relatively less H3K27me3 modification in PRC2 mutants. In PRC2 mutant, inter-peak genes received relatively less signal (23.8%) than those of peak genes (19.4%). We used bootstrapping to generate the mean reference-adjusted ChIP intensity of peak genes or inter-peak genes (10,000 draws with replacement of n = 500). Bootstrapped 95% confidence intervals: WT inter-peak genes: [2.626, 3.601]; esc289; E(z)239 inter-peak genes: [2.029, 2.627]; WT peak genes: [9.161, 10.367]; esc289; E(z)239 inter-peak genes: [7.363, 8.355]. ChIP-seq and genotypes as in (D). (F) Modification of H3K27me3 during aging has reduced selectivity in PRC2 mutants. Bootstrapped 95% confidence intervals: esc289; E(z)239 late-onset inter-peak genes: [0.551, 0.804]; esc289; E(z)239 late-onset peak genes: [0.532, 0.845]. ChIP-seq was from muscle tissues of 3d and 30d old male flies. Genotypes as in (D). (G) Age-associated drifting of H3K27me3 is dampened in PRC2 mutants. Contour lines indicated that the majority of the gene signals displayed higher levels—thus more rapid changes—in aged WT compared to mutants. ChIP-seq and genotypes as in (C).
Figure 4 with 1 supplement
Epigenetic drifting of H3K27me3 occurs with age in head.
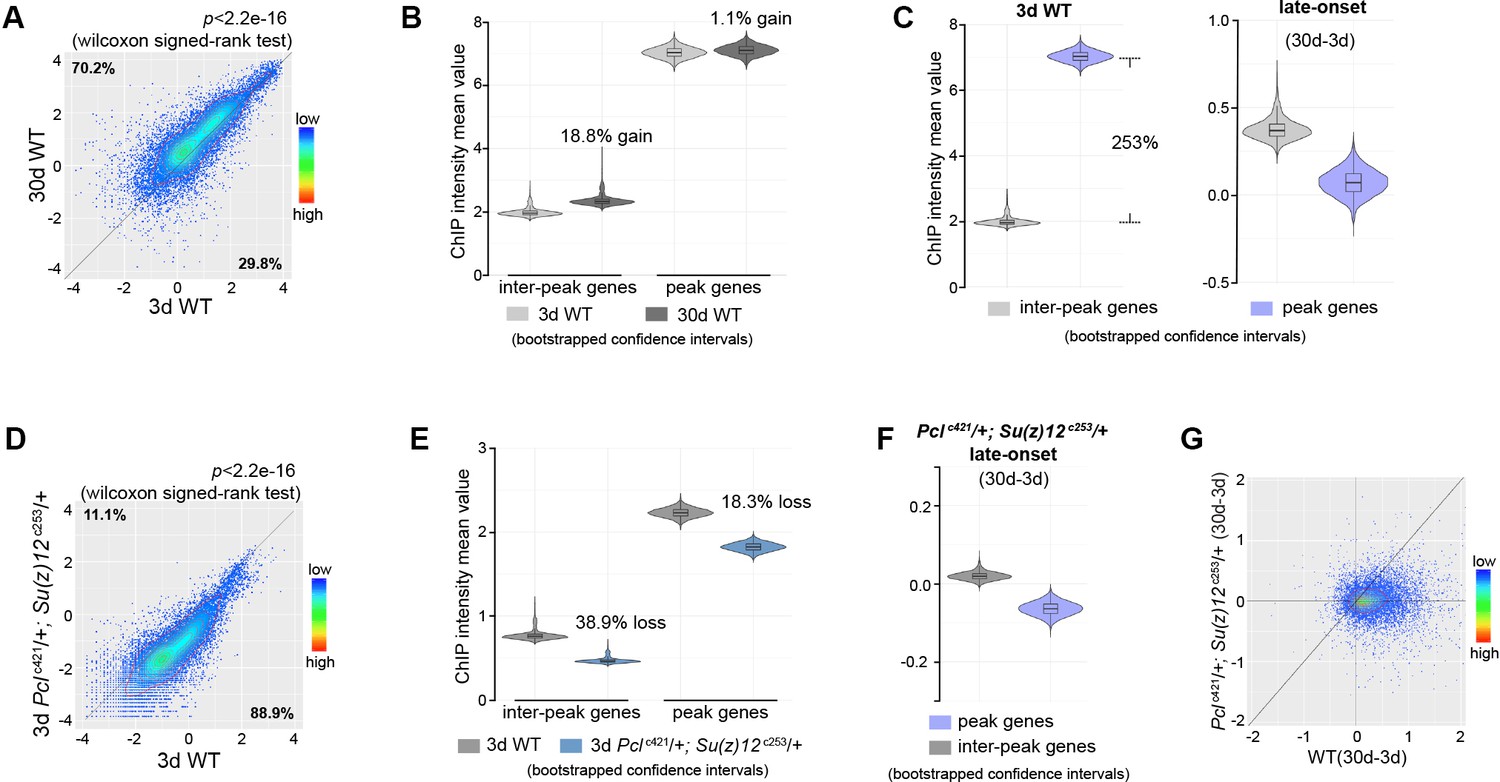
(A) H3K27me3 modification increases with age in head. Scatter plot showed H3K27me3 levels for protein-coding genes (transcriptional start site to transcriptional termination sites as annotated in dm6) of in 3d as compared to 30d. (wilcoxon signed-rank test, p<2.2e-16). The dm6 mapped reads were normalized to a scale factor to quantitatively compare the relative H3K27me3 level. Each dot on the plot represents a single gene locus. X- and Y-axis represented log2 mean value of gene’s reference-adjusted reads. Contour lines indicated that H3K27me3 signals were generally higher in aged compared to 3d-old flies. ChIP-seq was from head tissues of 3d- and 30d-old male flies. Genotype: 5905. (B) Inter-peak genes receive relatively more H3K27me3 modification during aging. We used bootstrapping to generate the mean reference-adjusted ChIP intensity of peak genes or inter-peak genes (10,000 draws with replacement of n = 500). Violin plots represent the bootstrapped mean H3K27me3 level of inter-peak genes (left) and peak genes (right) at 3d and 30d. In aging flies, inter-peak genes gained relatively more signal (30d: 18.8%) than peak genes (30d: 1.1%). Net gain of H3K27me3 signals during aging was calculated by a subtraction of the mean signal intensity between aged and 3d. Bootstrapped 95% confidence intervals: 3d inter-peak genes: [1.907, 2.027]; 30d inter-peak genes: [2.263, 2.402]; 3d peak genes: [6.912, 7.146]; 30d peak genes: [6.985, 7.217]. ChIP-seq and genotype as in (A). (C) Violin plots indicate that signals are highly preferential at the peak regions at 3d (left), but for signals gained during aging, selectivity is dramatically reduced (right). Statistics analysis as in (B). Bootstrapped 95% confidence intervals: 3d inter-peak genes: [1.907, 2.027]; 3d peak genes: [6.912, 7.146]; late-onset (30d-3d) inter-peak genes: [0.2756, 0.505]; (30d-3d) peak genes: [−0.136,0.248]. ChIP-seq and genotype as in (A). (D) H3K27me3 modification decreases in PRC2 mutants. Scatter plot showed H3K27me3 levels for gene bodies of all protein-coding genes in Pclc421; Su(z)12c253 as compared to WT. (wilcoxon signed-rank test, p<2.2e-16). Each dot on the plot represents a single gene locus. X- and Y-axis represented log2 mean value of gene’s reference-adjusted reads. Contour lines indicated that H3K27me3 signals were generally higher in WT compared to mutants. ChIP-seq was from head tissues of 3d-old male flies. Genotypes: WT: 5905 and Pclc421/+; Su(z)12 c253/+. (E) Inter-peak genes receive relatively less H3K27me3 modification in PRC2 mutants. In PRC2 mutant, inter-peak genes received relatively less signal (38.9%) than those of peak genes (18.3%). Statistics analysis as in (B). Bootstrapped 95% confidence intervals: 30d WT inter-peak genes: [0.737, 0.783]; 30d Pclc421; Su(z)12c253 inter-peak genes: [0.4498, 0.4787]; 30d WT peak genes: [2.193, 2.268]; 30d Pcl421; Su(z)12253 peak genes: [1.787, 1.858]. ChIP-seq and genotypes as in (D). (F) Modification of H3K27me3 during aging has reduced selectivity in PRC2 mutants. Statistics analysis as in (B). Bootstrapped 95% confidence intervals: Pcl421; Su(z)12253 late-onset inter-peak genes: [0.0126, 0.026]; Pcl421; Su(z)12253 late-onset peak genes: [−0.076,–0.052]. ChIP-seq was from head tissues of 3d and 30d old male flies. Genotypes: Pclc421/+; Su(z)12 c253/+. (G) Age-associated drifting of H3K27me3 is dampened in PRC2 mutants. Scatter plot showed gained H3K27me3 signal for all protein-coding genes in aged Pclc421; Su(z)12c253 and WT flies compared to young flies. Each dot on the plot represents a single gene locus. X- and Y-axis represented signal intensity. Contour lines indicated that the majority of the gene signals displayed higher levels—thus more rapid changes—in aged WT compared to mutants. ChIP-seq was from head tissues of 3d and 30d-old male flies. Genotypes: WT: 5905 and Pclc421/+; Su(z)12 c253/+.
Figure 4—figure supplement 1
Global occupancy of H3K27me3 modification in head tissues with age and in PRC2-deficiency.
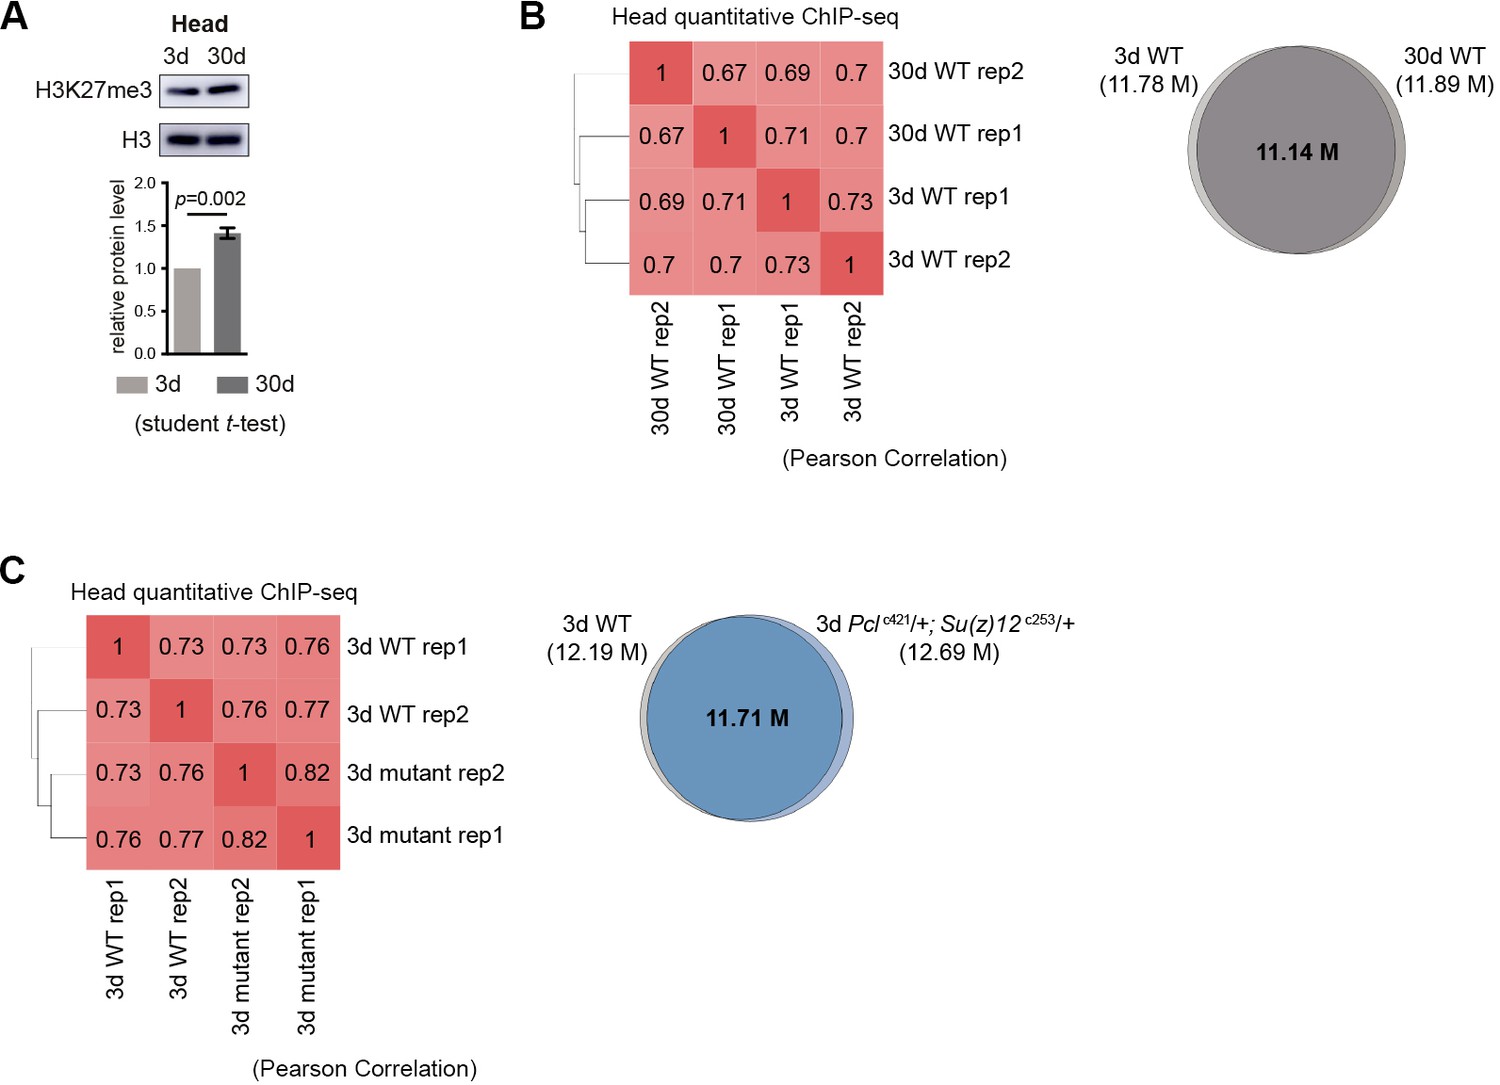
(A) Western blot (top) and quantification (bottom) show an increase of H3K27me3 with age in head tissues. (mean ±SD of three biological repeats; student t-test). Genotype: 5905. (B) The distribution of H3K27me3 in genome is preserved in head tissues with age. Cistrome correlation tools were used to generate the heatmap according to pair-wise correlation coefficients. Pair-wise Pearson correlations (left panel) of genome-wide H3K27me3 levels were calculated at windows of 1Kbps. Venn diagram (right panel) shows the number of shared regions in H3K27me3 enriched regions between 3d and 30d WT flies. Peak region reproducibly identified by two replicates were used to generate the Venn diagram. ChIP-seq was from head tissues of 3d- and 30d-old male flies. Genotypes: WT: 5905. (C) The distribution of H3K27me3 in genome is maintained in head tissue between WT and PRC2 mutant. Statistic analysis as in (B). ChIP-seq was from head tissues of 3d-old male flies. Genotypes: WT: 5905 and Pclc421/+; Su(z)12 c253/+.
Figure 5 with 1 supplement
Transcriptomics links H3K27me3 dynamics to the regulation of glycolytic genes.
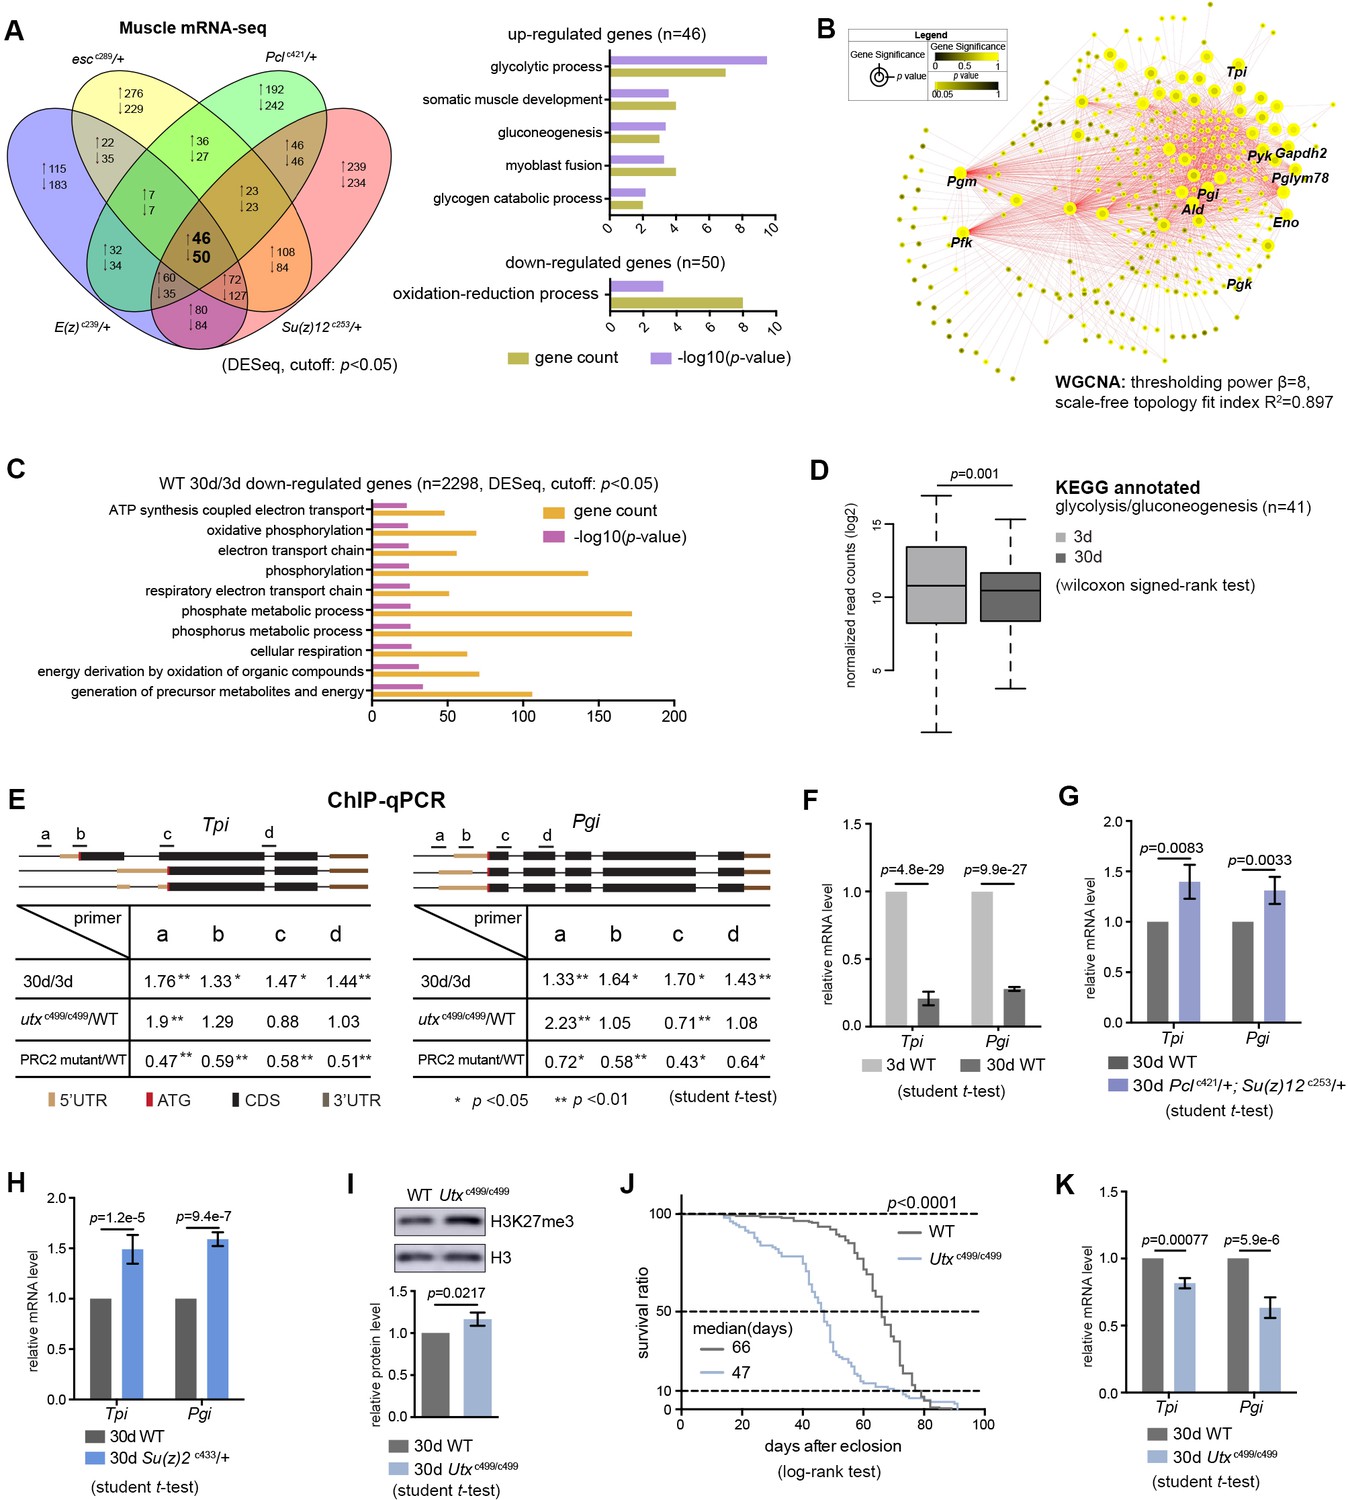
(A) Venn diagram shows genes commonly changed in PRC2 single mutants with indicated genotype (left panel). Differential expression genes were computed using DESeq based on normalized count from three biological replicates (p<0.05). Gene ontology (GO) analysis (performed by David) shows glycolysis being the biological processes significantly enriched for genes upregulated in PRC2 long-lived mutants, while oxidation-reduction process is the only pathway enriched for genes down-regulated. The bar graphs represent –log10 (p value) and gene counts in each pathway. RNA-seq was from muscle tissues of 30d-old male flies. (B) WGCNA network analysis reveals a co-regulated change of glycolytic genes. Glycolytic genes were highlighted. WGCNA was used for finding modules of highly correlated genes across mRNA-seq samples. For selected module, Cytoscape was used for visualizing interaction network. Glycolytic genes were highlighted as node, suggesting their expression was changed coordinately. (C) GO analysis shows biological processes related to energy metabolism being significantly decreased with age in WT. Age-dependent mRNA expression change was computed using DESeq based on mRNA-seq data from three biological replicates. GO analysis of 2298 down-regulated genes (cutoff: p<0.05) was performed by David. The top 10 most significantly affected biological processes were shown. The bar graphs represent –log10 (p value) and gene counts in each pathway. RNA-seq was from muscle tissues of 3d- and 30d-old male flies. Genotype: 5905. (D) Genes of glycolysis/gluconeogenesis as annotated in the Kyoto Encyclopedia of Genes and Genomes (KEGG) pathway database show age-associated transcriptional decrease. Y-axis represented normalized read counts transformed by Log2. (41 genes used; see Supplementary file 4; wilcoxon signed rank test, p=0.01). RNA-seq and genotype as in (C). (E) ChIP-qPCR validation. Genomic structures were shown according to the Flybase annotation (www.flybase.org). Along the gene of indicated genotype, a, b, c, and d were underlined, denoting the sites for PCR amplification. Color codes represented ATG (the translation start site), CDS (coding sequence), 5’UTR, and 3’UTR. Different primer sets confirmed that H3K27me3 modification was increased in aged WT and further increased in utx null mutants. H3K27me3 was reduced in PRC2 mutants as compared to WT, with the ratio between mutants and WT smaller than 1 (mean ±SD of three biological repeats; student t-test *p<0.05, **p<0.01; also see Figure 5—figure supplement 1D). ChIP-qPCR was from muscle tissues of 3d- and 30d-old male flies. Genotypes: WT: 5905. PRC2 mutant: Pclc421/+; Su(z)12 c253/+. utxc499/c499. (F–H) qRT-PCR analysis confirms that Tpi and Pgi of glycolytic genes have a decrease with age (F) but become increased in both PRC2 (G) and PRC1 mutants (H). (mean ±SD of three biological repeats; student t-test). qRT-PCR was from muscle tissues of 3d- and 30d-old male flies. Genotypes: WT: 5905. Pclc421/+; Su(z)12 c253/+. Su(z)2 c433/+. (I) H3K27me3 increases in utx deficiency. H3K27me3 western blot (top) and quantification (bottom). (for H3K27me3 quantification: mean ±SD of three biological repeats; student t-test). Western blot was from muscle tissues of 30d-old male flies. Genotypes: WT: 5905. utxc499/c499. (J) utx null animals are short-lived. (for lifespan assay: 25°C; n ≥ 200 per genotype for curve; log-rank test). Genotypes as in (I). (K) qRT-PCR analysis indicates a further decrease of glycolytic genes in utx-deficient animals. (mean ±SD of three biological repeats; student t-test). qRT-PCR was from muscle tissues of 30d-old male flies. Genotypes as in (I).
Figure 5—figure supplement 1
Transcriptomics links H3K27me3 dynamics to the regulation of glycolytic genes.
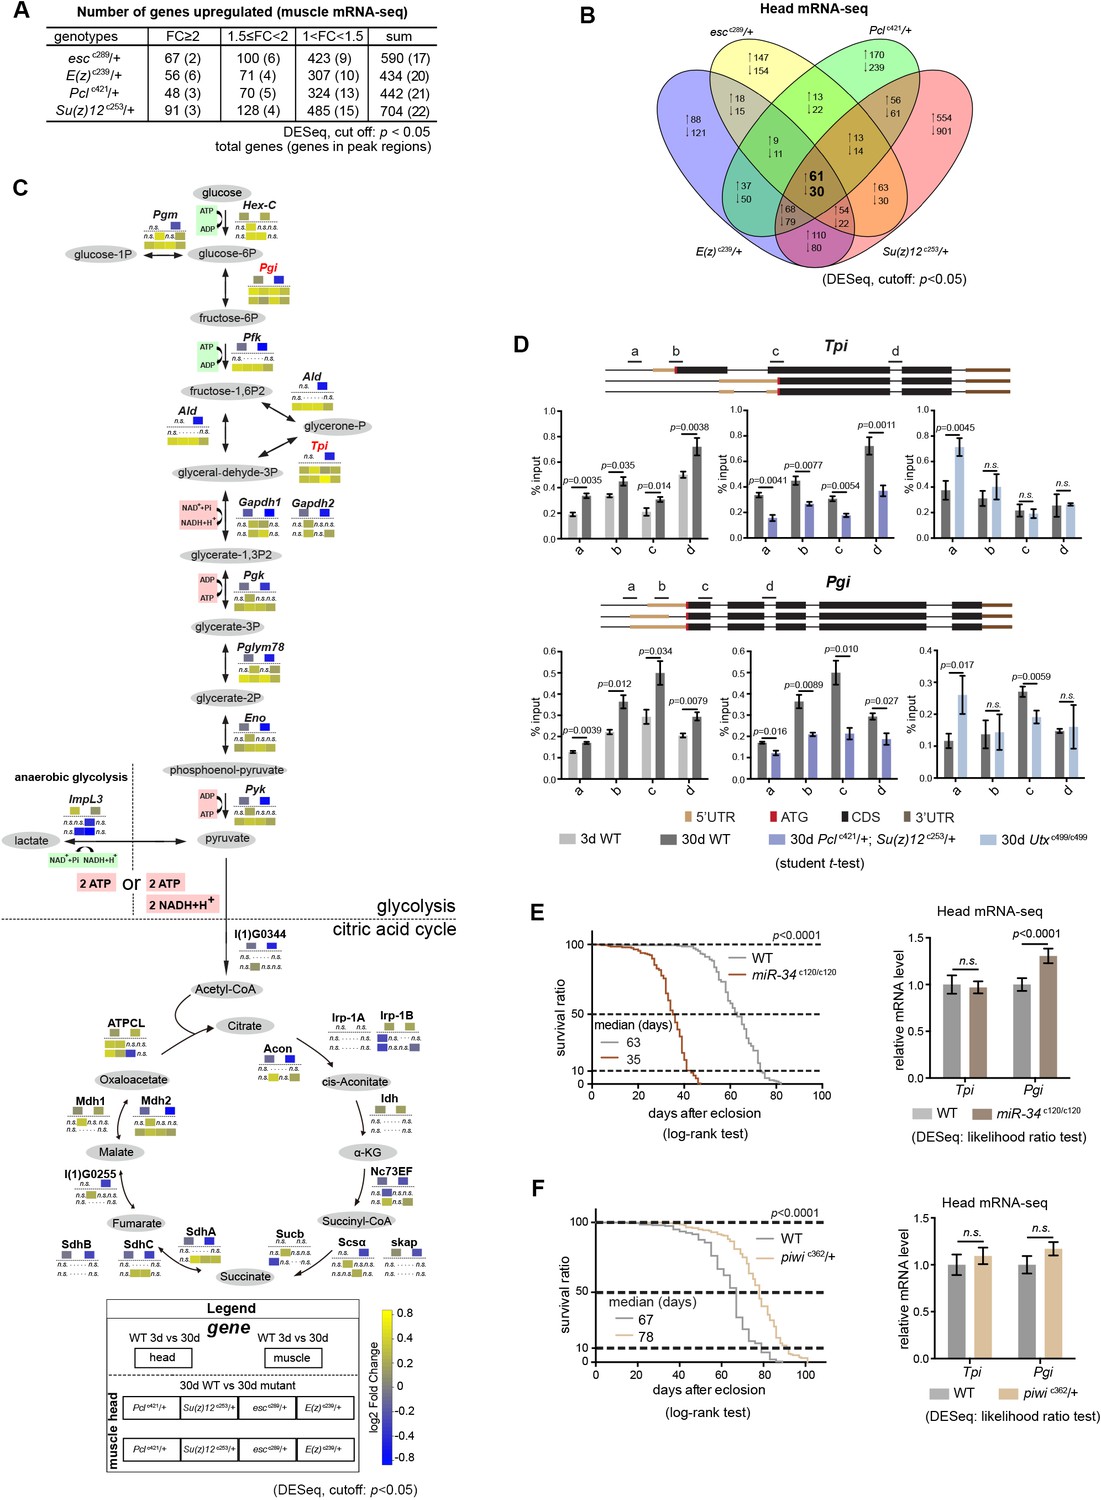
(A) Number of genes upregulated in PRC2 mutants with indicated genotype. Differential expression genes were computed using DESeq based on normalized count from three biological replicates (cutoff: p<0.05). Note that transcriptional changes were generally mild, and that the majority of changes were genes in the inter-peak regions. RNA-seq was from muscle tissues of 30d-old male flies. (B) Venn diagram shows genes commonly changed in PRC2 single mutants with indicated genotype. Differential expression genes were computed using DESeq based on normalized count from three biological replicates (p<0.05). RNA-seq was from head tissues of 30d-old male flies. (C) Diagram illustrates that the transcriptional changes of genes mediating glucose and the citric acid cycle. Genes and their relative transcriptional changes in 3d- and 30d-old WT and PRC2 long-lived mutants with indicated genotype (cutoff p<0.05; n.s.: not significant). Commonly changed genes, Tpi and Pgi, were highlighted in red. While anaerobic glycolysis yields ATP only, glycolysis at the step of pyruvate formation has a net outcome of both ATP and NADH. (D) ChIP-qPCR of glycolytic genes Tpi (top panel) and Pgi (bottom panel). Genomic structure and gene isoforms were shown according to the Flybase annotation. Along the gene of indicated genotype, a, b, c, and d were underlined, denoting the sites for PCR amplification. Color codes represented ATG (the translation start site), CDS (coding sequence), 5’UTR, and 3’UTR. (mean ±SD of three biological repeats; student t-test). ChIP-qPCR was from muscle tissues of 3d- and 30d-old male flies. Genotypes: WT: 5905. Pclc421/+; Su(z)12 c253/+. utxc499/c499. (E) and (F) Short-lived miR-34 mutants (E) and long-lived piwi mutants (F) demonstrated that changes of the glycolytic genes had no simple correlation with lifespan alterations. (for Differential expression analysis: DESeq, likelihood ratio test, three biological repeats; for lifespan assay: 25°C; n ≥ 200 per genotype for curve; log-rank test). RNA-seq was from head tissues of male flies. Genotypes: WT: 5905. miR-34c120/c120. piwic362/+.
Figure 6 with 2 supplements

Metabolomics shows the effect of PRC2 mutants in reversing glycolytic decline in aging.
(A) Untargeted metabolics identifies that metabolites of the glycolytic pathway (red) are decreased with age. For each metabolite, the median from 10 biological repeats was used to calculate the relative fold change between WT and mutants. Untargeted metabolics was from head tissues of 3d- and 30d-old male flies. Genotype: 5905. (B) Pathway enrichment analysis reveals glycolysis being the biological processes significantly enriched with age. Pathway enrichment analysis was executed using MetaboAnalyst. (Pathway enrichment criteria: wilcoxon rank-sum test, cutoff p<0.01; see Materials and methods for algorithm). Genotype as in (A). (C) Untargeted metabolics identifies that metabolites of the glycolytic pathway (red) are increased in PRC2 mutants. Untargeted metabolics and analysis as in (A). Genotypes: WT: 5905. Mut: Pclc421/+; Su(z)12 c253/+. (D) Pathway enrichment analysis reveals glycolysis being the biological processes significantly enriched. (Pathway enrichment criteria: wilcoxon rank-sum test, cutoff p<0.01; see method for algorithm). Genotype as in (C). (E) Lactate is decreased with age (left panel) but increased in PRC2 mutants (right panel). (mean ±SD of 10 biological repeats; wilcoxon rank-sum test). Genotypes: WT: 5905. Pclc421/+; Su(z)12 c253/+. (F) Schematic representation of the glucose flux via glycolysis (left) and citric acid cycle (right). 13C and 12C were indicated for specific metabolites. Dashed rectangles encircled isotopologues pertaining to specific metabolites that contained different number of 13C. (G) Decline of glycolytic metabolites during aging is partially rescued by PRC2 deficiency. For specific metabolite, the median from eight biological repeats was used to calculate the ratio between 8d and 30d of age. (mean ±SD of eight biological repeats; wilcoxon rank-sum test). Metabolomics was from head tissues of 8d- and 30d-old male flies. Genotypes: WT: 5905. Pclc421/+; Su(z)12 c253/+. (H) Age-associated decline of glycolysis is diminished by PRC2 deficiency. 13C-traced glycolytic metabolites were used to determine the level of glycolytic pathway as a whole. In 30d WT, 50.1% of glycolysis remained as relative to its level at 8d of age; in contrast, in PRC2 mutants at 30d of age, 78% of glycolysis remained. (mean ±SD of eight biological repeat; see method for calculation). Metabolomics and genotypes as in (G).
Figure 6—figure supplement 1
Untargeted metabolomics.
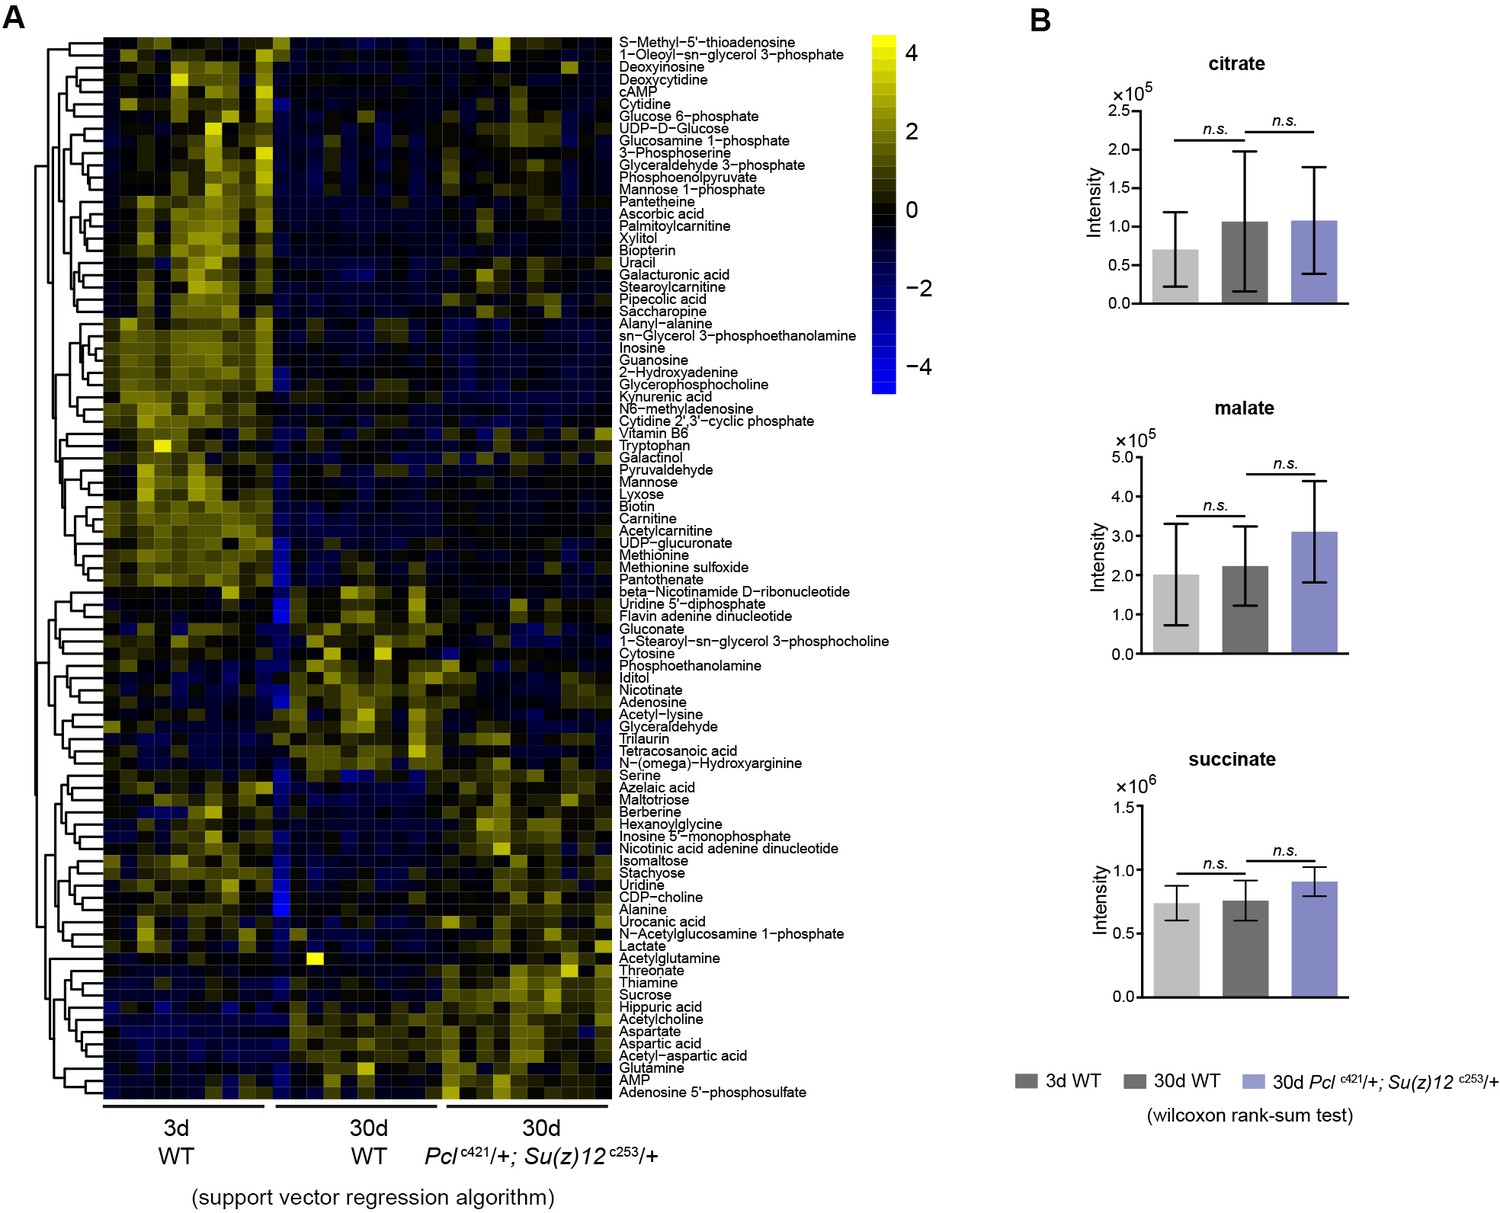
(A) Heatmap of metabolites exhibiting differential levels of 3d, 30d WT and 30d PRC2 mutants. Data normalization using support vector regression algorithm. Metabolomics was from head tissues of 3d- and 30d-old male flies. Genotypes: WT: 5905. Pclc421/+; Su(z)12 c253/+. (B) Metabolomic analysis reveals that metabolites of the citric acid cycle show comparable levels between young and aged WT, and between WT and PRC2 mutants. (wilcoxon rank-sum test, n.s.: not significant). Metabolomics and genotypes as in (A).
Figure 6—figure supplement 2
Metabolic glucose flux experiment.
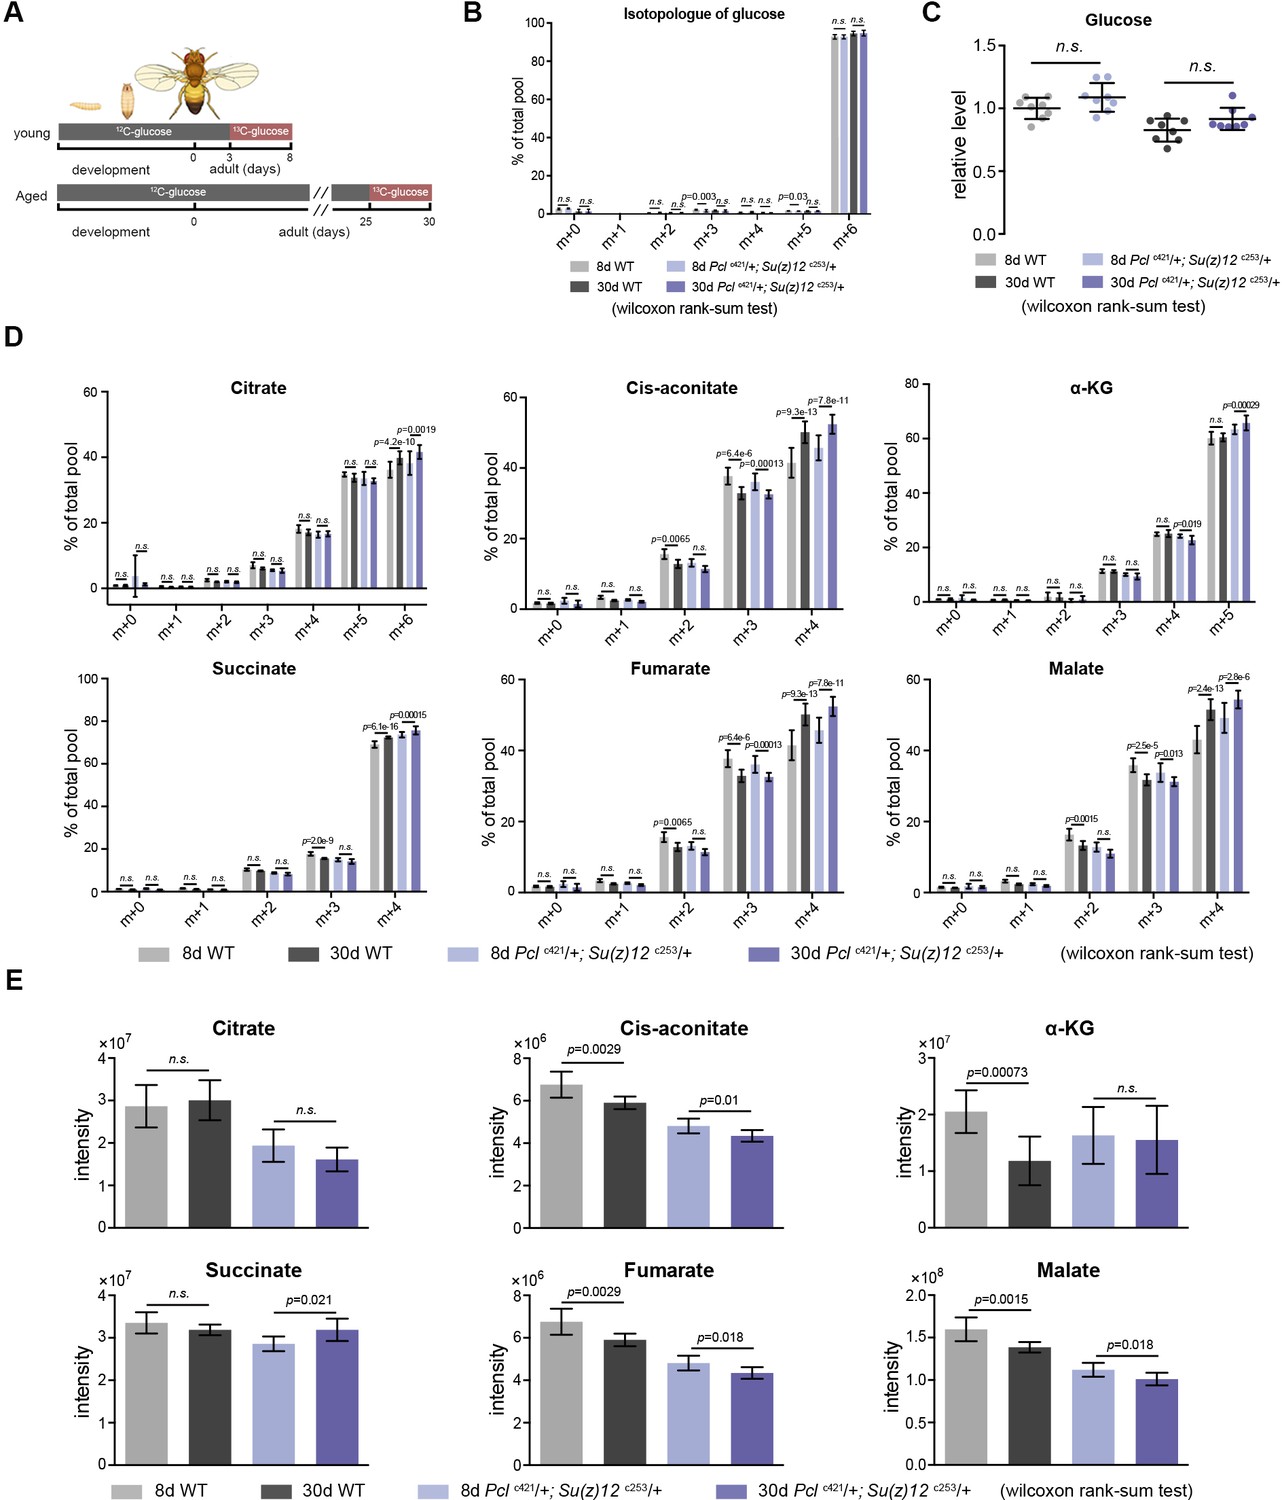
(A) Schematic representation of the glucose flux experiment in adult aging flies. Briefly, flies at 3d (young) and 25d (aged) were switched from 12C-glucose to 13C-glucose food for a fixed 5days, such that the glucose metabolism can be traced by measuring the 13C-labeled metabolites. (B) Relative to the total glucose pool, 13C-glucose accounts for more than 93% and 95% in 8d- and 30d-old animals, respectively, suggesting a near-complete replacement. (mean ±SD of eight biological repeats; wilcoxon rank-sum test, n.s.: not significant). Metabolomics was from head tissues of 8d- and 30d-old male flies. Genotypes: WT: 5905. Pclc421/+; Su(z)12 c253/+. (C) Metabolic flux analysis reveals that the levels of 13C6-labeled glucose are comparable between WT and mutants. (mean ±SD of eight biological repeats; wilcoxon rank-sum test). Metabolomics and genotypes as in (B). (D) and (E) Quantification of isotopologues pertaining to each metabolites of citric acid cycle (D) and their summed intensity (E) indicate no consistent change of the pathway with age and in PRC2-deficiecny. (mean ±SD of eight biological repeats; wilcoxon rank-sum test). Metabolomics and genotypes as in (B).
Figure 7
PRC2 mutants couple enhanced glycolysis with improved adult fitness.
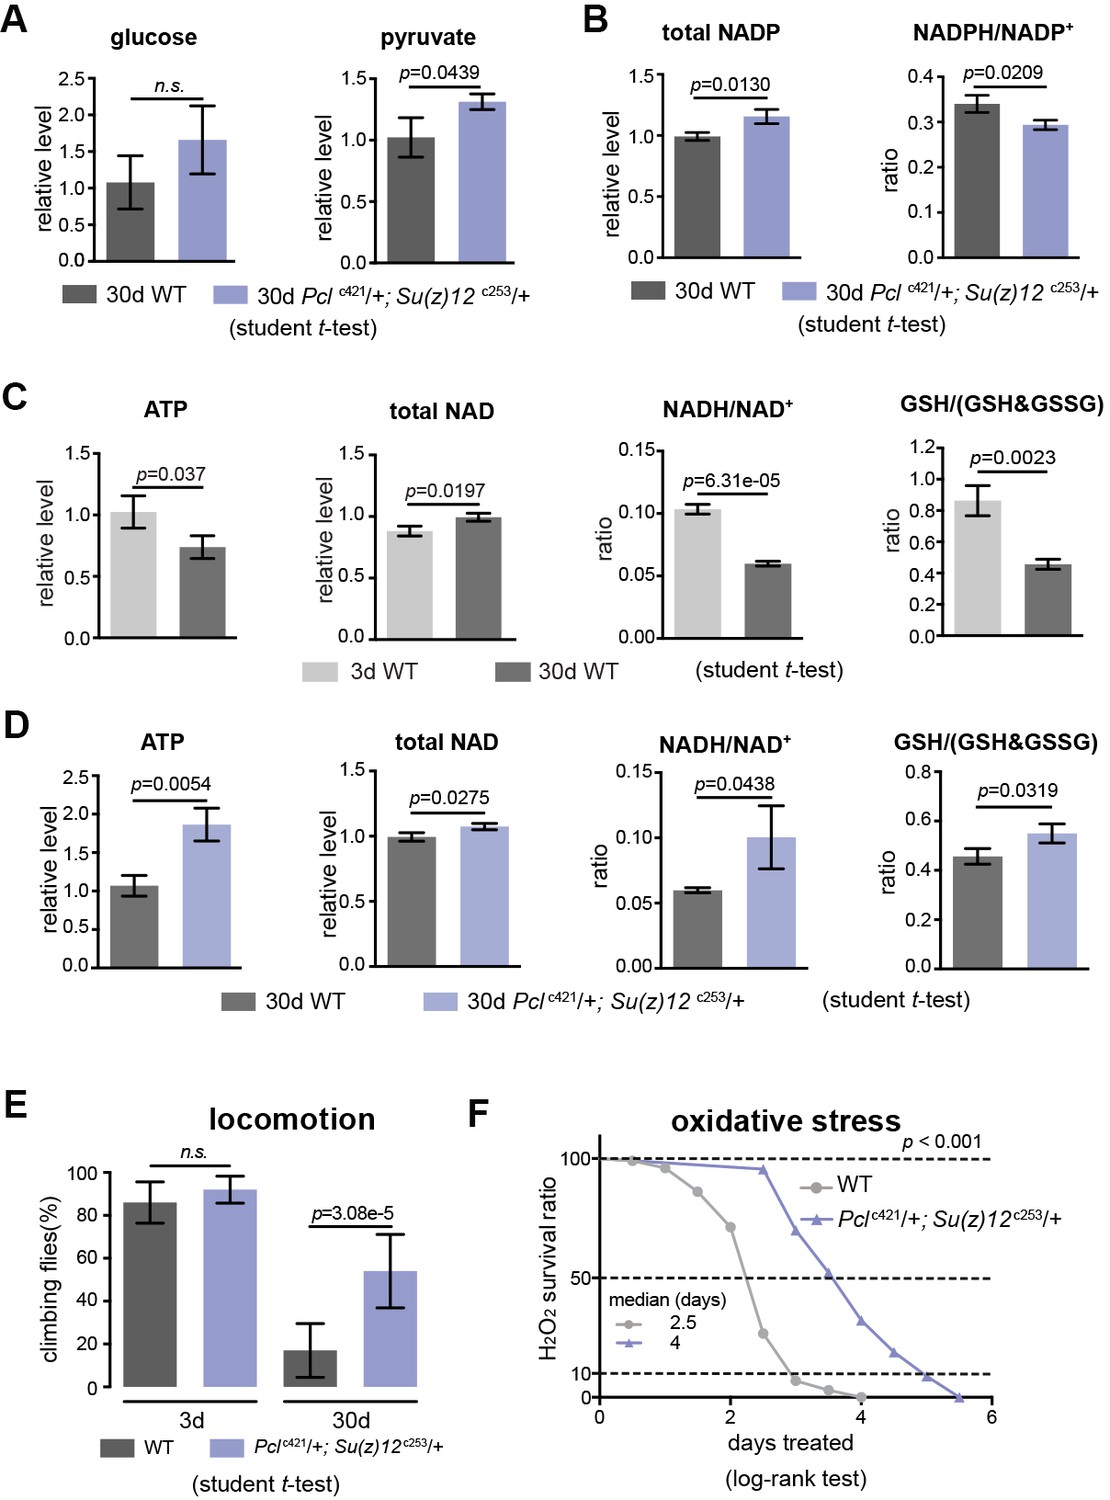
(A) Glucose content shows a slight increase in PRC2 mutants, but this increase is not statistically significant (left panel). Pyruvate, one key end product of glycolysis, is increased (right panel). (mean ±SD of three biological repeats with 10 flies for each measurements; student t-test; n.s.: not significant). Test was from muscle tissues of 30d-old male flies. Genotypes: WT: 5905. Mut: Pclc421/+; Su(z)12 c253/+. (B) The ratio of NADPH/NADP+, indicator of the PPP, foliate metabolism, and malic enzyme is decreased in mutants. Test, statistics, and genotype as in (A). (C) ATP and cellular redox levels are decreased with age. (mean ±SD of three biological repeats with 10 flies for each measurements; student t-test). Test was from muscle tissues of 3d- and 30d-old male flies. Genotype: 5905. (D) ATP and cellular redox levels are increased in PRC2 deficient animals. Test, statistics, and genotype as in (A). (E) and (F) Analysis of adult phenotypes reveals that PRC2 mutants have a healthy lifespan. Climbing assay exhibited that, whereas WT and mutants behaved similarly at 3d, with age, mutants had better climbing, reflective of improved mobility (E). Mutants had enhanced resistance to oxidation (F). (for climbing assay: mean ±SD of 10 biological repeats with 10 flies for each repeats; student t-test; for oxidation tests: 25°C; n = 100 per genotype for curve; log-rank test). Genotypes as in (A).
Figure 8 with 1 supplement
Perturbing glycolysis diminishes longevity benefits in PRC2 mutants.
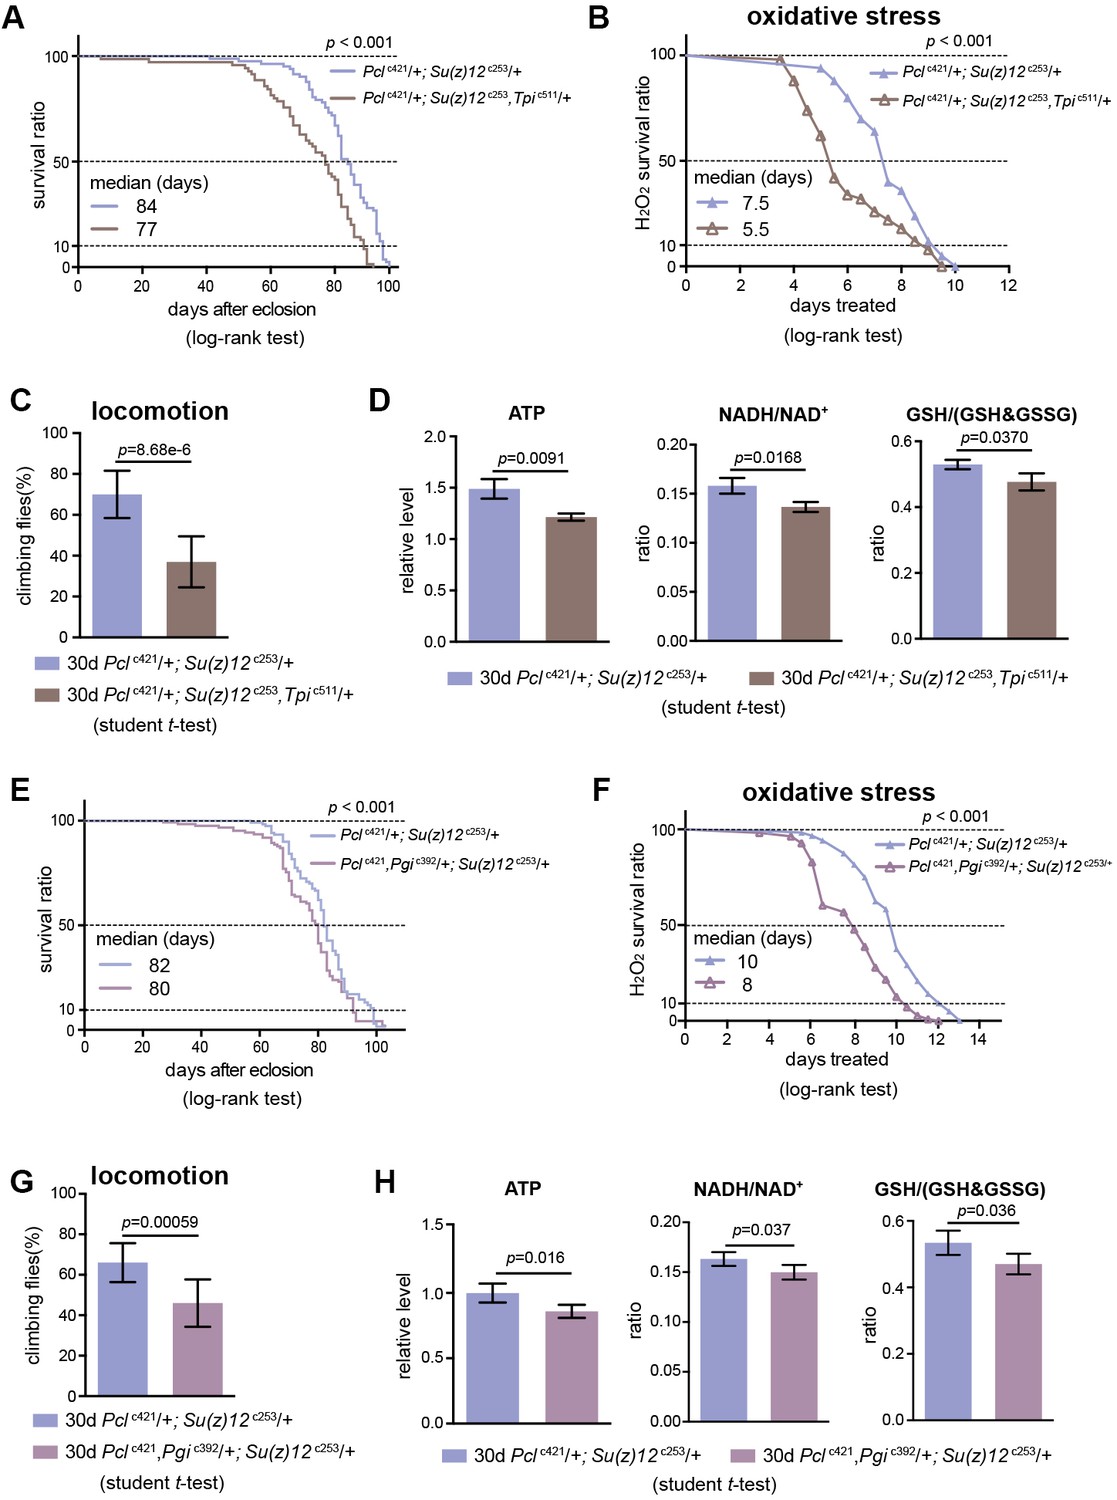
(A) Tpi deficiency significantly diminishes the longevity phenotype of PRC2 trans-heterozygous double mutants. (for lifespan assay: 25°C; n > 200 per genotype; log-rank test). Genotypes: Pclc421/+; Su(z)12 c253/+. Pclc421/+; Su(z)12c253, Tpic511/+. (B) and (C) Oxidation stress test (B) and climbing (C) show that Tpi deficiency partially diminishes the lifespan-benefits of PRC2 mutants. (for oxidation assay: 25°C; n = 100 per genotype for curve; log-rank test; for climbing assay: mean ±SD of 10 biological repeats with 10 flies for each repeat; student t-test). Genotypes as in (A). (D) Tpi deficiency reduces glycolysis of PRC2 mutants. Analysis of specific metabolites revealed a decrease of ATP (left panel), ratio of NADH/NAD+ (middle panel), and ratio of GSH/(GSH +GSSG) (right panel). (mean ±SD of three biological repeats; student t-test). Metabolite analysis was from muscle tissues of 30d-old male flies. Genotypes as in (A). (E–H) Pgi deficiency diminishes the aging benefits mediated by PRC2 mutants, including lifespan (E), oxidative stress (F), locomotion (G), and glycolysis (H). Genotypes: Pclc421/+; Su(z)12 c253/+. Pclc421, Pgic392/+; Su(z)12 c253/+.
Figure 8—figure supplement 1
Tpi- and Pgi-deficient flies have normal adult phenotypes.
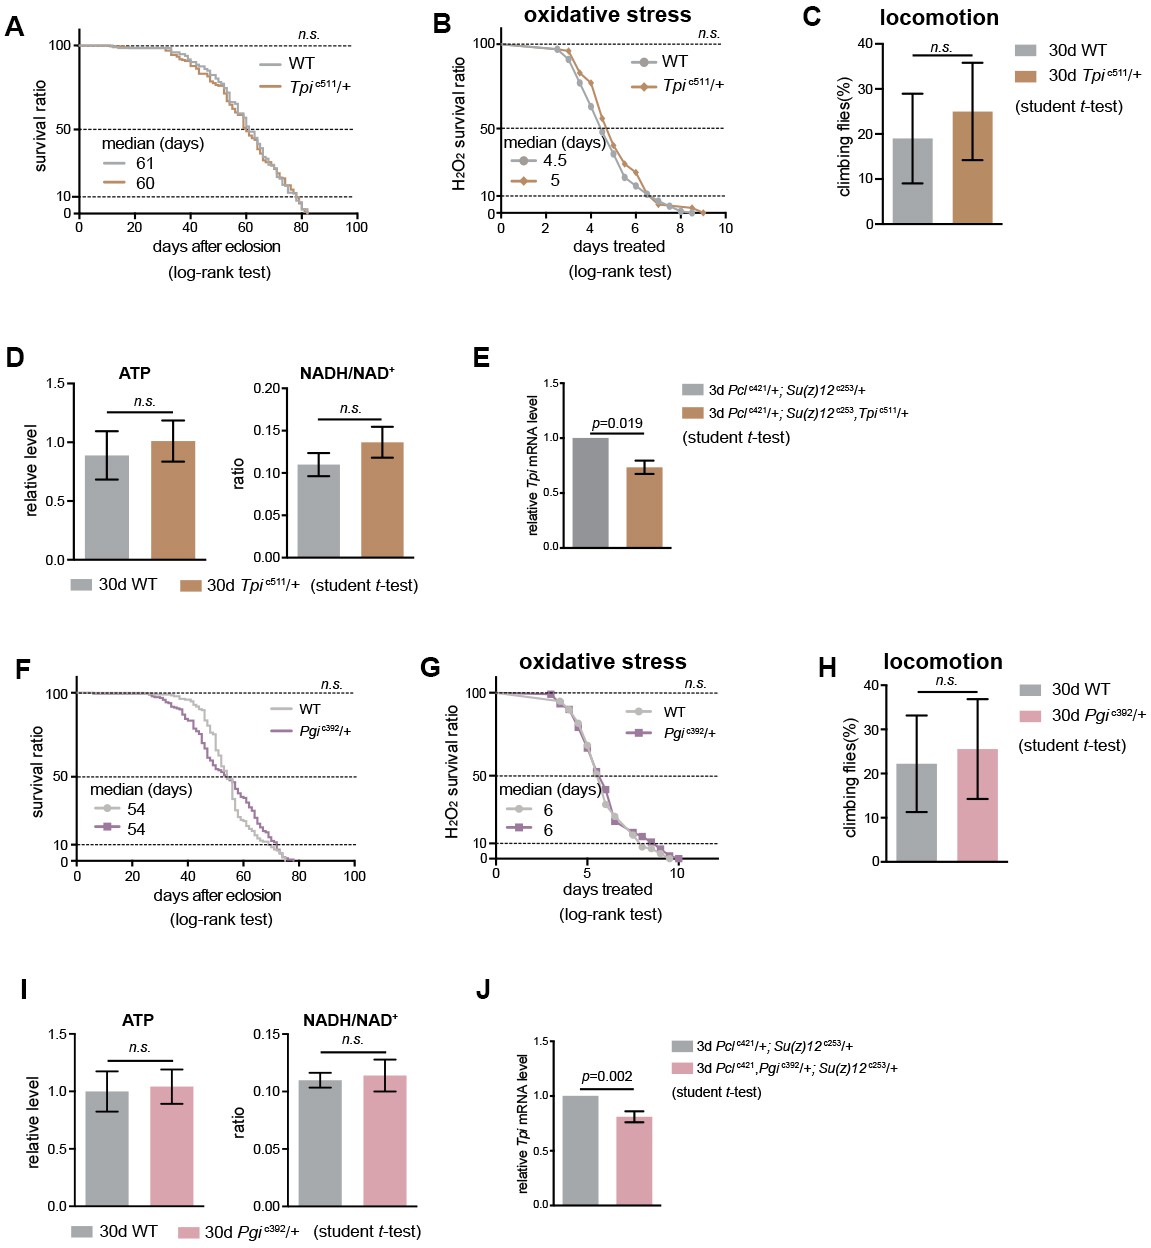
(A)-(D) and (F)-(I) Assessments of adult lifespan (A) and (F), oxidation test (B) and (G), climbing ability (C) and (H), and the levels of ATP and the ratio of NADH/NAD+ (D) and (I), show no difference between WT and flies with either Tpi or Pgi heterozygous mutation. (for lifespan assay: 25°C; n > 190 per genotype for curve; log-rank test; for oxidation tests: 25°C; n = 100 per genotype for curve; log-rank test; for climbing assay: mean ±SD of 10 biological for each repeats; student t-test; for analysis of metabolites: mean ±SD of three biological for each repeats; student t-test; n.s.: not significant). Genotypes: WT: 5905. Tpic511/+. Pgic392/+. (E) and (J) Tpi and Pgi mRNA level in triple mutants. (mean ±SD of three biological repeats; student t-test). qRT-PCR was from muscle tissues of 3d-old male flies. Genotypes: Pclc421/+; Su(z)12 c253/+. Pclc421/+; Su(z)12c253, Tpic511/+. Pclc421,Pgic392/+; Su(z)12 c253/+, Tpic511/+.
Figure 9 with 1 supplement
Transgenic increase of glycolytic genes suffices to elevate glycolysis and healthy lifespan.
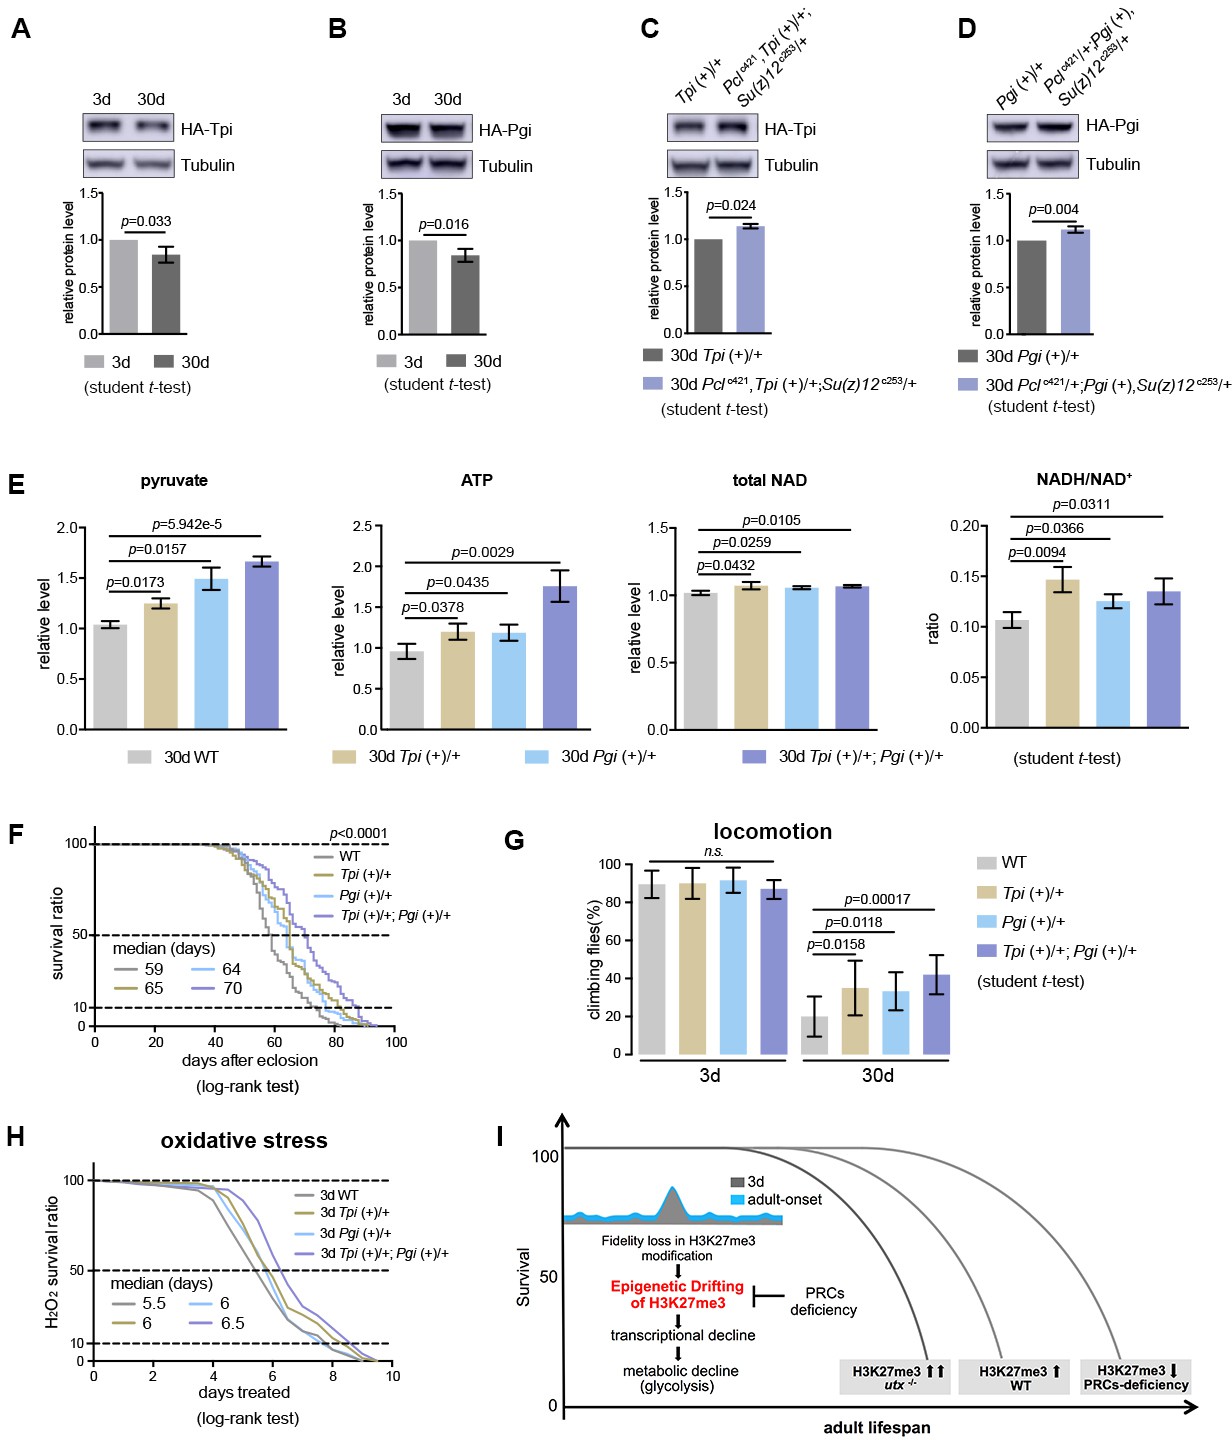
(A) Tpi protein western blot (top) and quantification (bottom) shows a decrease with age. (mean ±SD of three biological repeats; student t-test). Western blot was from 3d- and 30d-old male flies. Genotype: Tpi (+)/+. (B) Pgi protein western blot (top) and quantification (bottom) shows a decrease with age. Statistics and Western blot as in (A). Genotype: Pgi (+)/+. (C) Tpi protein western blot (top) and quantification (bottom) shows an increase in PRC2 mutants. Statistics and western blot as in (A). Genotype: Tpi (+)/+. Pclc421, Tpi (+)/+; Su(z)12 c253/+. (D) Pgi protein western blot (top) and quantification (bottom) shows an increase in PRC2 mutants. Statistics and western blot as in (A). Genotype: Pgi (+)/+. Pclc421/+; Pgi (+), Su(z)12 c253/+. (E) Transgenic increase of glycolytic genes stimulates glycolysis, as shown by elevated pyruvate, ATP, and NADH/NAD+ ratio compared to age-matched WT (mean ±SD of three biological repeats; student t-test). Metabolite analysis was from muscle tissues of 30d-old male flies. Genotypes: WT: 5905. Tpi (+)/+. Pgi (+)/+. Tpi (+)/+; Pgi (+)/+. (F–H) Transgenic increase of glycolytic genes promotes adult fitness, including lifespan (F), locomotion (G), and resistance to oxidative stress (H). (for lifespan assay: 25°C; n ≥ 200 per genotype for curve; log-rank test; for climbing assay: mean ±SD of 10 biological repeats with 10 flies for each repeat; student t-test; for oxidation assay: 25°C; n = 100 per genotype for curve; log-rank test). Genotypes as in (E). (I) Model. Adult-onset fidelity loss results in epigenetic drift of H3K27me3. Over a chronic timescale, the drifting of H3K27me3 induces transcriptional and metabolic decline including a reduction of glycolysis. Effects of PRC2-deficiency in life-extension can be at least in part attributed to the effect in stimulation of glycolysis, thereby maintaining metabolic health and longevity. Adult lifespan is inherently modulated by the alterations in the levels of H3K27me3, as shown by the corresponding change during natural aging, in utx mutants as well as in PRCs-deficiency.
Figure 9—figure supplement 1
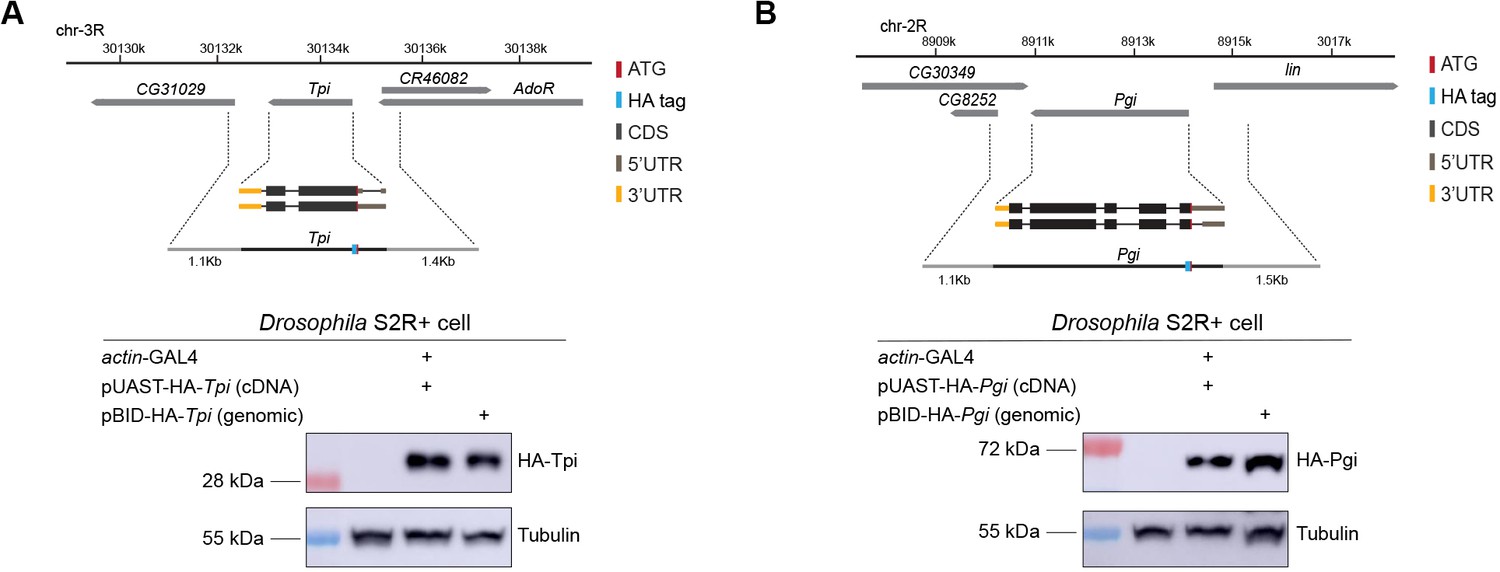
Genomic transgenes for Tpi and Pgi.
(A) and (B) Genomic structure and gene isoforms were shown according to the Flybase annotation. Color codes represented ATG (the translation start site), HA tag, CDS (coding sequence), 5’UTR, and 3’UTR. Positive control was based on the UAS/Gal4 system and overexpression of cDNAs for Tpi and Pgi, respectively. Transient transfection of Tpi and Pgi genomic constructs yielded protein of appropriate size. Western blot was using Drosophila S2R+ cells.
Tables
Key resources table
| Reagent type (species) or resource | Designation | Source or reference | Identifiers | Additional information |
|---|---|---|---|---|
| Cell line (D. melanogaster) | S2R+ | This paper | FLYB:FBtc0000150 | |
| Antibody | H3K27me3 (rabbit polyclonal) | Millipore | Cat#07–449; RRID:AB_310624 | |
| Antibody | H3K27me2 (rabbit polyclonal) | Abcam | Cat#ab24684; RRID:AB_448222 | |
| Antibody | H3K27me (rabbit polyclonal) | Millipore | Cat#07–448 | |
| Antibody | H3K27ac (rabbit polyclonal) | Abcam | Cat#ab4729; RRID:AB_2118291 | |
| Antibody | H3K9me3 (rabbit polyclonal) | Abcam | Cat#ab8898; RRID:AB_306848 | |
| Antibody | H3K9ac (rabbit polyclonal) | Millipore | Cat#06–942; RRID:AB_310308 | |
| Antibody | H3K23ac (rabbit polyclonal) | Millipore | Cat#07–355; RRID:AB_310546 | |
| Antibody | H3K4me3 (rabbit polyclonal) | Millipore | Cat#07–473; RRID:AB_1977252 | |
| Antibody | H3K4me2 (rabbit polyclonal) | Millipore | Cat#07–030; RRID:AB_310342 | |
| Antibody | H3K4me (rabbit polyclonal) | Millipore | Cat#07–436; RRID:AB_310614 | |
| Antibody | H3K36ac (rabbit polyclonal) | Millipore | Cat#07–540 | |
| Antibody | H3K36me3 (rabbit polyclonal) | Abcam | Cat#ab9050; RRID:AB_306966 | |
| Antibody | H3K14ac (rabbit polyclonal) | Millipore | Cat#07–353; RRID:AB_310545 | |
| Antibody | H3K18ac (rabbit polyclonal) | Abcam | Cat#ab1191; RRID:AB_298692 | |
| Antibody | H4K20me3 (rabbit polyclonal) | Abcam | Cat#ab9053 | |
| Antibody | H3 (goat polyclonal) | Abcam | Cat#Ab12079 | |
| Antibody | HA (rabbit monoclonal) | Cell signaling technology | Cat#3724 | |
| Antibody | Tubulin (rabbit polyclonal) | Medical and biological laboratories co | Cat#PM054 | |
| Antibody | Anti-Rabbit IgG | Sigma | Cat#A9169 | |
| Antibody | Anti-Mouse IgG | Sigma | Cat#A4416 | |
| Antibody | Anti-Goat IgG | Abcam | Cat#ab6471 | |
| Recombinant DNA reagent | pBID UAS vector: HA-Tpi | Addgene | 35198 | |
| Recombinant DNA reagent | pBID UAS vector: HA-Pgi | Addgene | 35198 | |
| Recombinant DNA reagent | pBID vector: HA-Tpi genomic | Addgene | 35190 | |
| Recombinant DNA reagent | pBID vector: HA-Pgi genomic | Addgene | 35190 | |
| Recombinant DNA reagent | pU6b-sgRNA | Ren et al., 2013 | N/A | |
| Commercial assay or kit | TURBO DNA-free kit | ThermoFisher | Cat#AM1907 | |
| Commercial assay or kit | SuperSignal West Pico Chemilluminescent Subtrate | ThermoFisher | Cat#34078 | |
| Commercial assay or kit | Nuclear-Cytosol Extraction Kit | Aogma | Cat#9988 | |
| Commercial assay or kit | SYBR Select Master Mix | ThermoFisher | Cat#26161 | |
| Commercial assay or kit | SuperScript III First-strand synthesis system for RT-PCR | ThermoFisher | Cat#18080–051 | |
| Commercial assay or kit | ChIP-Grade Protein A/G Plus Agarose | ThermoFisher | Cat#26161 | |
| Commercial assay or kit | QIAquick PCR Purification Kit | QIAGEN | Cat#28106 | |
| Commercial assay or kit | Qubit dsDNA HS Assay Kit | ThermoFisher | Cat#Q32851 | |
| Commercial assay or kit | High Sentivity DNA Analysis Kits | Agilent Technologies | Cat#5067–4626 | |
| Commercial assay or kit | NEBNext DNA Library Prep Kit | New England Biolabs | Cat#E7370L | |
| Commercial assay or kit | NEBNext Poly(A) mRNA Magnetic Isolation Module | New England Biolabs | Cat#E7490L | |
| Commercial assay or kit | NEBNext Multiplex Oligos for Illumina | New England Biolabs | Cat#E7600S | |
| Commercial assay or kit | NEBNext Ultra RNA library Prep Kit for Illumina | New England Biolabs | Cat#E7530L | |
| Commercial assay or kit | RNase A/T1 Mix | ThermoFisher | Cat#EN0551 | |
| Commercial assay or kit | Glucose (HK) Assay Kit | Sigma | Cat#GAHK20 | |
| Commercial assay or kit | NAD/NADH Quantitation Kit | Sigma | Cat#MAK037 | |
| Commercial assay or kit | NADP/NADPH Quantitation Kit | Sigma | Cat#MAK038 | |
| Commercial assay or kit | ENLITEN ATP Assay System | Promega | Cat#FF2000 | |
| Commercial assay or kit | Pyruvate Assay Kit | Sigma | Cat#: MAK071 | |
| Commercial assay or kit | GSH/GSSG Ratio Detection Assay | Abcam | Cat#ab13881 | |
| Commercial assay or kit | Amicon Ultra 0.5 mL centrifugal filters | Sigma | Cat#Z677108-96EA | |
| Chemical compound, drug | Tris-buffer (1 mol/L, pH8.5) | Sangon Biotech | Cat#SD8141 | |
| Chemical compound, drug | TRIZol Rreagent | ThermoFisher | Cat#15596018 | |
| Chemical compound, drug | Chloroform | Sinopharm Chemical Reagent | Cat#10006818 | |
| Chemical compound, drug | Isopropanol | Sinopharm Chemical Reagent | Cat#10006818 | |
| Chemical compound, drug | DEPC-treated water | Invitrogen | Cat#46–2224 | |
| Chemical compound, drug | NuPAGE 12% Bis-Tris Gel | ThermoFisher | Cat#NP0342BOX | |
| Chemical compound, drug | PageRuler Prestained Protein Ladder | ThermoFisher | Cat#26616 | |
| Chemical compound, drug | NuPAGE MOPS SDS Running Buffer | ThermoFisher | Cat#NP0001 | |
| Chemical compound, drug | Immobilon Transfer Membranes | Millipore | Cat#: IPVH00010 | |
| Chemical compound, drug | Glycine | beyotime | Cat#ST085-1000G | |
| Chemical compound, drug | 20 X PBS | Sangon Biotech | Cat#B548117-0500 | |
| Chemical compound, drug | 37% formaldehyde solution | Sigma | Cat#F1635 | |
| Chemical compound, drug | Protease inhibitor cocktail tablets | Roche | Cat#11697498001 | |
| Chemical compound, drug | RIPA buffer | Sigma | Cat#R-278–500 ML | |
| Chemical compound, drug | 5M NaCl | ThermoFisher | Cat#AM9760G | |
| Chemical compound, drug | 0.5M EDTA | ThermoFisher | Cat#15575–038 | |
| Chemical compound, drug | 1M Tris-HCl | ThermoFisher | Cat#15568–025 | |
| Chemical compound, drug | Triton X-100 | Sigma | Cat#T8787-50ML | |
| Chemical compound, drug | 10% SDS | Sangon Biotech | Cat#SD8118 | |
| Chemical compound, drug | RNase A/T1 Mix | ThermoFisher | Cat#EN0551 | |
| Chemical compound, drug | Sodium dicarbonate | Sigma | Cat#S5761 | |
| Chemical compound, drug | Proteinase K | Sangon Biotech | Cat#A100706 | |
| Chemical compound, drug | 3M Sodium Acetate pH5.5 | ThermoFisher | Cat#AM9740 | |
| Chemical compound, drug | Methyl viologen dichloride hydrate | Sigma | Cat#856177 | |
| Chemical compound, drug | Hydrogen peroxide 30% | Sinopharm Chemical Reagent | Cat#10011208 | |
| Chemical compound, drug | D(+)-Arabinose | Sangon Biotech | Cat#A600071-0100 | |
| Chemical compound, drug | D-glucose | Sangon Biotech | Cat#A100188-0500 | |
| Chemical compound, drug | Sodium hydroxide solution | Sigma | Cat#72068 | |
| Chemical compound, drug | Methanol | Honeywell | Cat#LC230-2.5HC | |
| Chemical compound, drug | Acetonitrile | Merck | Cat#1.00029.2500 | |
| Chemical compound, drug | Water | Honeywell | Cat#LC365-2.5HC | |
| Chemical compound, drug | Ammonium acetate | Sigma-Aldrich | Cat#73594–25 G-F | |
| Chemical compound, drug | Ammonium hydroxide | Sigma-Aldrich | Cat#44273–100 mL-F | |
| Chemical compound, drug | Sequencing Grade Modified Trypsin | Promega | Cat#V5111 | |
| Chemical compound, drug | Centrifugal Filters Ultracel 30K | Amicon | Cat#UFC30SV00 | |
| Chemical compound, drug | Water, LC/MS | J.T.Baker | Cat#9831–03 | |
| Chemical compound, drug | Formic acid, eluent additive for LC-MS | Sigma | Cat#56302–50 ml-f | |
| Chemical compound, drug | Acetonitrile,LC/MS,4L | J.T.Baker | Cat#9829–03 | |
| Chemical compound, drug | Ammonium bicarbonate | Sigma | Cat#09830–1 KG | |
| Chemical compound, drug | Urea | Sigma | Cat#U5128-500G | |
| Chemical compound, drug | Trizma hydrochloride | Sigma | Cat#T5941-100G | |
| Chemical compound, drug | Ammonium formate | Flucka | Cat#17843–50G | |
| Chemical compound, drug | Lys(6) SILAC yeast | Silantes | Cat#234CXX-SYK6-509-01 | |
| Chemical compound, drug | D-Glucose (U-13C6,99%) | Cambridge Isotope Laboratories, Inc. | Cat#110187-42-3 | |
| Software, algorithm | Bowtie2 | Langmead and Salzberg (2012) | http://bowtie-bio.sourceforge.net/bowtie2/index.shtml | |
| Software, algorithm | Samtools | Li et al. (2009) | http://samtools.sourceforge.net/; RRID:SCR_002105 | |
| Software, algorithm | deepTools | Ramírez et al., 2014 | https://deeptools.github.io/ | |
| Software, algorithm | homer | Heinz et al., 2010 | http://homer.ucsd.edu/homer/ngs/index.html; RRID:SCR_010881 | |
| Software, algorithm | bwtool | Pohl and Beato, 2014 | https://users.dcc.uchile.cl/~peortega/bwtool/; RRID:SCR_003035 | |
| Software, algorithm | Galaxy | Grüning et al., 2017 | https://github.com/bgruening/galaxytools; RRID:SCR_006281 | |
| Software, algorithm | Cistrome | Liu et al., 2011 | http://cistrome.dfci.harvard.edu/ap/; RRID:SCR_000242 | |
| Software, algorithm | BEDTools | Quinlan and Hall, 2010 | http://bedtools.readthedocs.io/; RRID:SCR_006646 | |
| Software, algorithm | J-circos | An et al., 2015 | https://omictools.com/j-circos-tool; RRID:SCR_011798 | |
| Software, algorithm | VENNY | Oliveros, 2007 | http://bioinfogp.cnb.csic.es/tools/venny/index.html | |
| Software, algorithm | R | R Core Team, 2013 | https://www.r-project.org; RRID:SCR_001905 | |
| Software, algorithm | DAVID Bioinformatics Resources | Huang et al., 2009b | https://david.ncifcrf.gov/; RRID:SCR_001881 | |
| Software, algorithm | IGV | Robinson et al., 2011 | http://software.broadinstitute.org/software/igv/; RRID:SCR_011793 | |
| Software, algorithm | STAR | Dobin et al., 2013 | https://github.com/alexdobin/STAR; RRID:SCR_005622 | |
| Software, algorithm | HTSeq | Anders et al., 2015 | http://www-huber.embl.de/HTSeq/; RRID:SCR_005514 | |
| Software, algorithm | DESeq | Anders and Huber, 2010 | http://www-huber.embl.de/users/anders/DESeq/; RRID:SCR_000154 | |
| Software, algorithm | WGCNA | Langfelder and Horvath, 2008 | https://labs.genetics.ucla.edu/horvath/htdocs/CoexpressionNetwork/Rpackages/WGCNA/; RRID:SCR_003302 | |
| Software, algorithm | XCMS | Smith et al., 2006 | http://www.bioconductor.org/packages/release/bioc/html/xcms.html; RRID:SCR_015538 | |
| Software, algorithm | MetaboAnalyst 3.0 | Xia et al., 2015 | http://www.metaboanalyst.ca/; RRID:SCR_015539 | |
| Software, algorithm | CAMERA | Kuhl et al. (2012) | https://bioconductor.org/packages/release/bioc/html/CAMERA.html; RRID:SCR_011924 | |
| Software, algorithm | PD1.4 | Thermo | https://www.thermofisher.com/order/catalog/product/IQLAAEGABSFAKJMAUH | |
| Software, algorithm | Pathways to PCDL (version B.07.00) | Agilent Technologies | ||
| Software, algorithm | PCDL Manager (version B.07.00) | Agilent Technologies | ||
| Software, algorithm | Profinder (version B.08.00) | Agilent Technologies | ||
| Software, algorithm | Prism | GraphPad | v6; RRID:SCR_002798 |
Additional files
-
Supplementary file 1
Summary of H3K27me3 peak regions.
Summary of ChIP-seq experiments. Two criteria for peak calling: IP/input ≥ 2, signals spanning ≥3 kb. In total, 222 peak regions of H3K27me3 were reproducibly identified by four biological replicates at 3d. For each peak regions, information pertaining to chromosomal location and genes therein contained were given. ChIP-seq was using muscle tissues of 3d=old animals. Genotype: 5905.
- https://doi.org/10.7554/eLife.35368.020
-
Supplementary file 2
Summary of CRISPR/Cas9-led gene mutagenesis and lifespan.
For each gene, two sgRNAs with indicated sequences, detailed deletion sites confirmed by Sanger sequencing, and PCR validation were shown. To name new CRISPR mutant, a superscript amended to the gene contained a letter c denoting CRISPR/Cas9-directed mutagenesis followed by the size of genomic deletion. Mutants were backcrossed (at least five generations) into 5905 (Flybase ID FBst0005905, w1118) to assure that phenotypes were not associated with any variation in background. Lifespan curves, together with 50% (median lifespan) and 10% survival data were listed. (for lifespan assay: 25°C; n ≥ 140 per genotype for curve; log-rank test).
- https://doi.org/10.7554/eLife.35368.021
-
Supplementary file 3
Summary of transcriptomic analysis of PRC2 longevity mutants.
RNA-seq summary. This table summarizes five categories of genes and their transcriptional changes in long-lived PRC2 mutants of indicated genotype: (1) commonly upregulated and (2) downregulated genes in all PRC2 long-lived mutants; genes known to promote longevity upon upregulation, including (3) insulin pathway genes, (4) TOR signaling pathway genes, and (5) genes of miscellaneous pathways. RNA-seq was from muscle and head tissues of 30d-old male flies.
- https://doi.org/10.7554/eLife.35368.022
-
Supplementary file 4
Summary of transcriptomic analysis of genes in glycolysis, citric acid cycle, pentose phosphorylation pathway, and oxidative phosphorylation.
This table summarizes metabolic genes and their transcriptional changes in long-lived PRC2 mutants of indicated genotype. RNA-seq was from head and muscle tissues of 3d- and 30d-old male flies.
- https://doi.org/10.7554/eLife.35368.023
-
Supplementary file 5
Supplemental Materials and methods: Primer sequences used for the study.
- https://doi.org/10.7554/eLife.35368.024
-
Transparent reporting form
- https://doi.org/10.7554/eLife.35368.025
Download links
A two-part list of links to download the article, or parts of the article, in various formats.
Downloads (link to download the article as PDF)
Open citations (links to open the citations from this article in various online reference manager services)
Cite this article (links to download the citations from this article in formats compatible with various reference manager tools)
Epigenetic drift of H3K27me3 in aging links glycolysis to healthy longevity in Drosophila
eLife 7:e35368.
https://doi.org/10.7554/eLife.35368


