The multi-subunit GID/CTLH E3 ubiquitin ligase promotes cell proliferation and targets the transcription factor Hbp1 for degradation
- ETH Zürich, Switzerland
- Paul Scherrer Institute, Switzerland
Figures
Figure 1 with 1 supplement
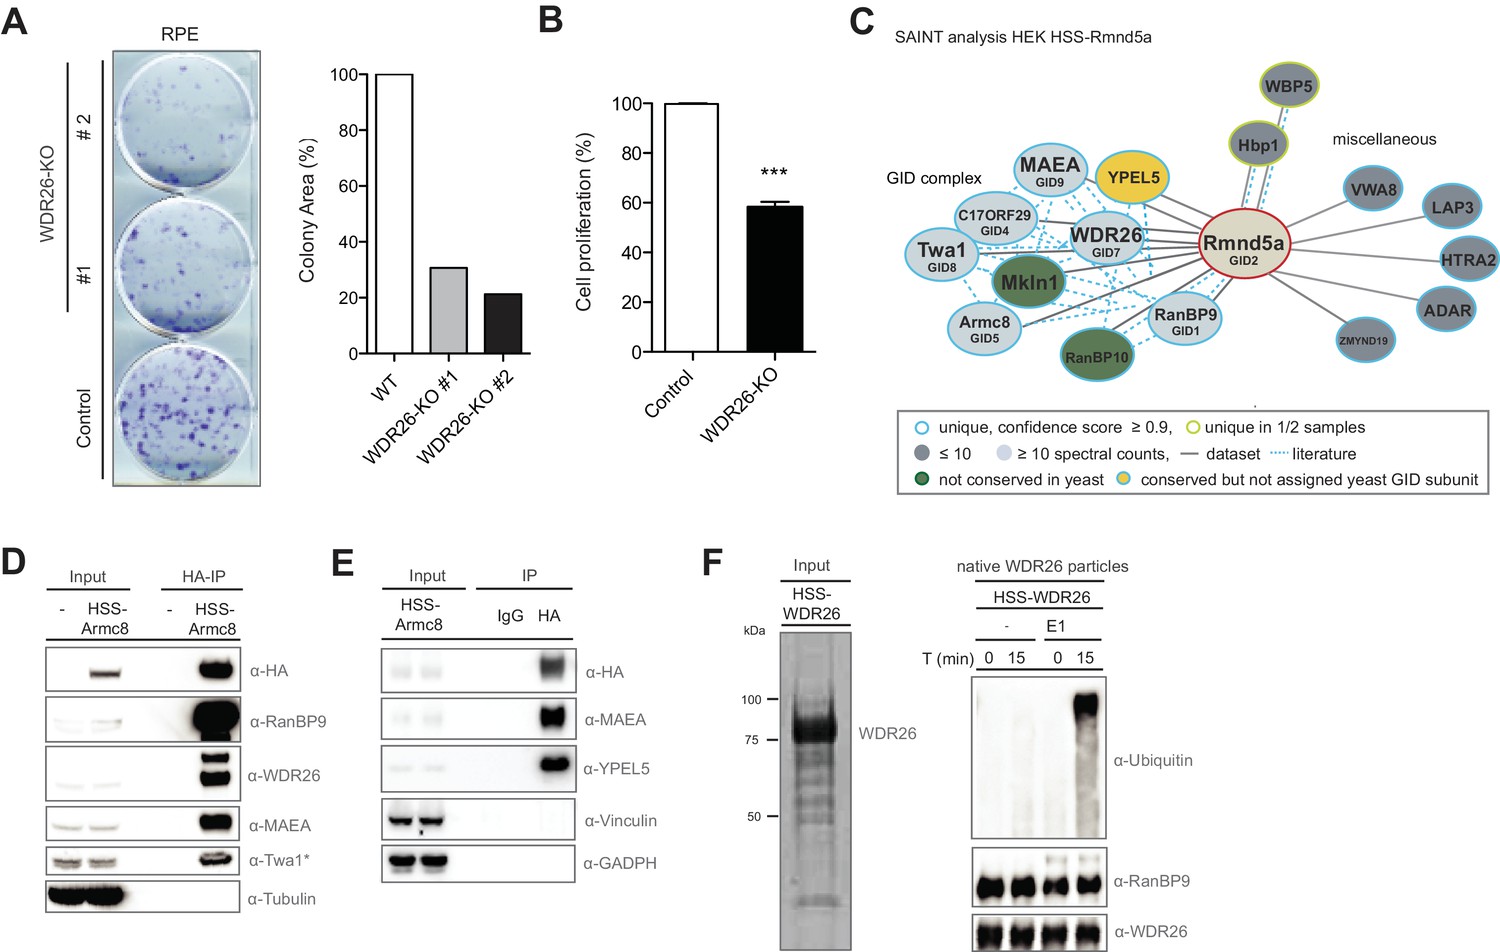
The human GID complex is composed of 10 subunits and possesses E3 ligase activity.
(A) Representative clonogenic survival assay and corresponding quantification of RPE cells (technical replicates, n ≥ 2) treated with lentiviruses expressing either control gRNAs (WT) or two gRNAs deleting the GID subunit WDR26 (WDR26-KO). (B) Cell proliferation of RPE control and WDR26-KO cells was quantified by MTT assays between days 6–9 after lentiviral transfection. Data are shown as mean of quadruplicates and % change in signal relative to control gRNA-treated cells ± SD, n = 3, ∗∗∗p≤0.0003. (C) Network of Rmnd5a high-confidence interacting proteins (HCIPs) in HEK-239 cells analyzed by SAINT (confidence score ≥0.9, FC ≥2, n = 2). GID subunits with no sequence/functional homologue within the S. cerevisiae GID complex are labeled in green. Conserved GID subunits currently not assigned in S. cerevisiae as bona fide GID proteins are colored in yellow. (D) Stably expressed HSS-Armc8 was isolated from HEK-293 cells, and after HA-peptide elution the presence of additional GID proteins in the immunoprecipitate was analyzed using the indicated antibodies. The asterisk (*) marks an unspecific strong band detected by the Twa1 antibody at approximately the same size in WCEs. (E) Transiently expressed HSS-Armc8 was immunoprecipitated from HEK-293 cells and probed by immunoblotting for the presence of the novel GID subunit YPEL5 and the RING protein MAEA. (F) Native GID-particles were purified from HEK-293 stably expressing HSS-tagged WDR26. The eluted complexes were visualized by SDS-PAGE and Sypro-Ruby staining (left panel) or subjected to an ubiquitination assay in the presence of Cdc34 and UbcH5b (right panel), with or without addition of E1 enzyme. The reaction was analyzed after the times indicated by SDS-PAGE followed by immunoblotting with the respective antibodies.
-
Figure 1—source data 1
List of WDR26-interactors identified by AP-MS.
- https://doi.org/10.7554/eLife.35528.004
-
Figure 1—source data 2
List of Rmnd5a-interactors identified by AP-MS and SAINT analysis.
- https://doi.org/10.7554/eLife.35528.005
-
Figure 1—source data 3
List of Armc8-interactors identified by AP-MS and SAINT analysis.
- https://doi.org/10.7554/eLife.35528.006
Figure 1—figure supplement 1
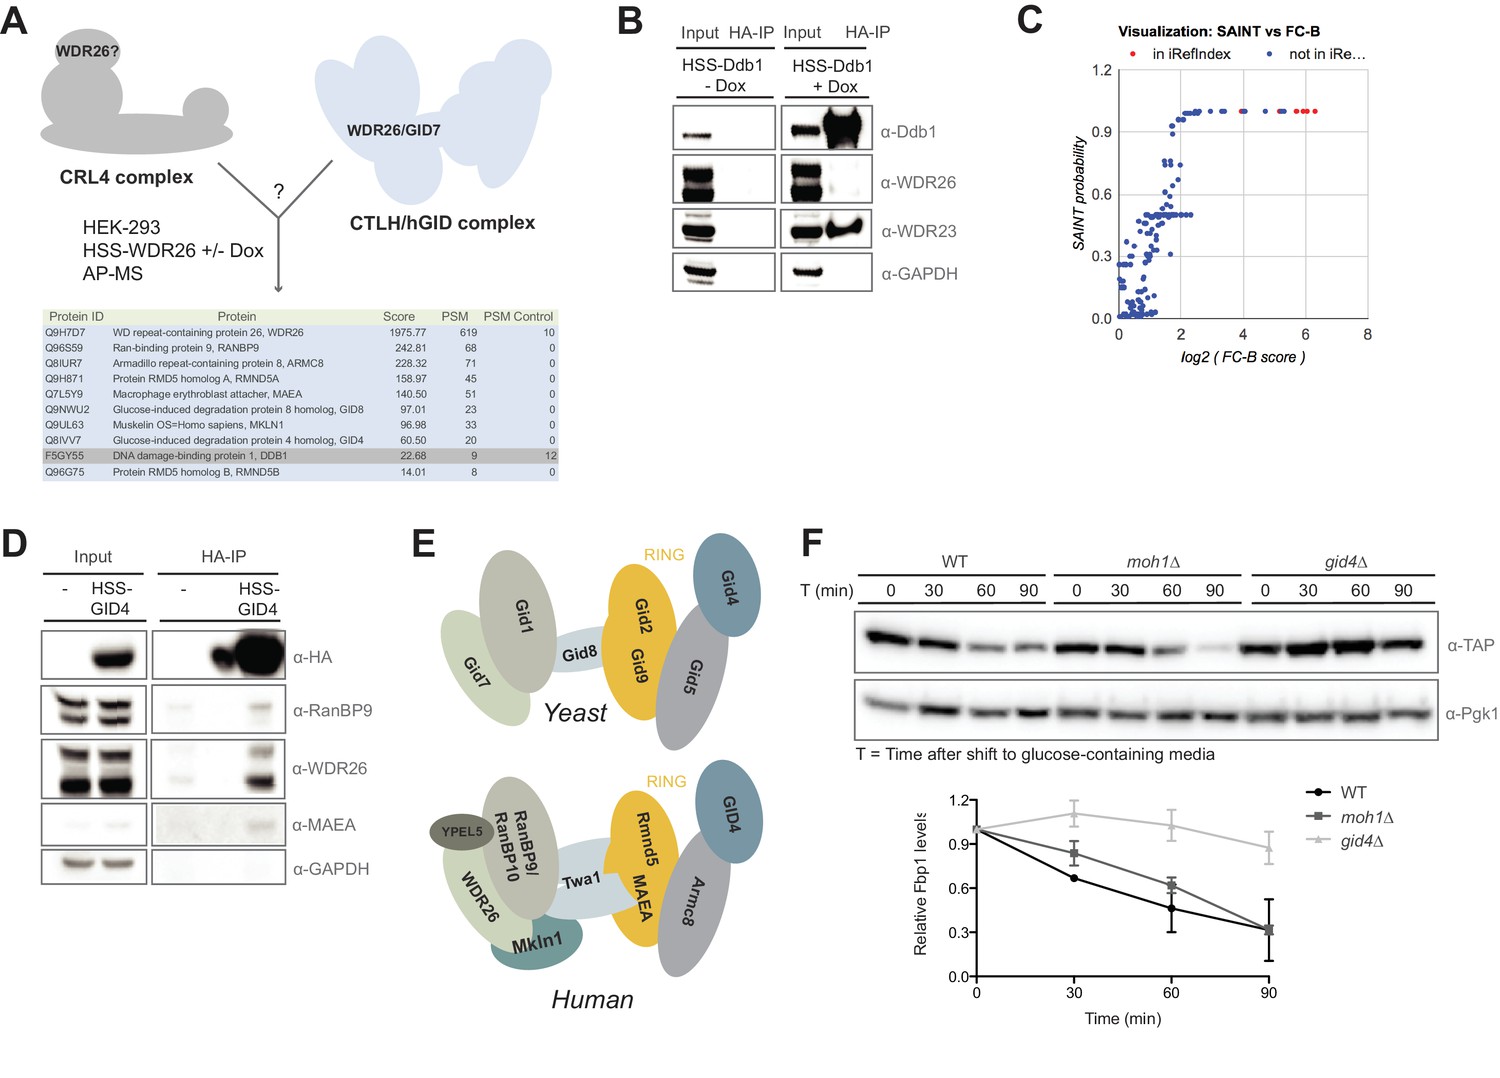
Compositional analysis of the mammalian GID complex.
(A) AP-MS analysis of N-terminally HSS-tagged WDR26 in HEK-293 cells from a doxycycline-inducible promoter using lentiviral transduction. HSS-WDR26 expression was induced for 24 hr and immunoprecipitated using HA-antibodies. The number of peptide spectral matches (PSM) of HSS-WDR26 and selected proteins in control - and WDR26 samples are listed in the table below. Note that in contrast to multiple hGID/CTLH subunits, the CRL4 core component Ddb1 is not enriched. (B) Immunoprecipitation of N-terminally HSS-tagged Ddb1 stably expressed in HeLa cells. The HA-peptide eluate (HA-IP) was probed for the presence of the canonical DCAF protein WDR23 and the putative CRL4 adapter WDR26. (C) SAINT analysis plot of previously annotated and novel Rmnd5a-HCIPs corresponding to Figure 1C. (D) Immunoprecipitation of a transiently expressed HSS-GID4 construct in HEK-293 cells was analyzed for the presence of the GID proteins RanBP9, WDR26 and MAEA. (E) Schematic illustration of the yeast GID E3 ligase (adapted from Menssen et al., 2012) and the potential architecture of the human GID complex (this study). (F) S. cerevisiae wild-type (WT), moh1∆ and gid4∆ deletion strains expressing Fbp1-TAP were grown o/n in YP + 3% EtOH before shifting into YP medium containing 2% glucose. Samples for immunoblot analysis were taken at the indicated time points and relative Fbp1-TAP levels were quantified using ImageJ.
Figure 2 with 1 supplement
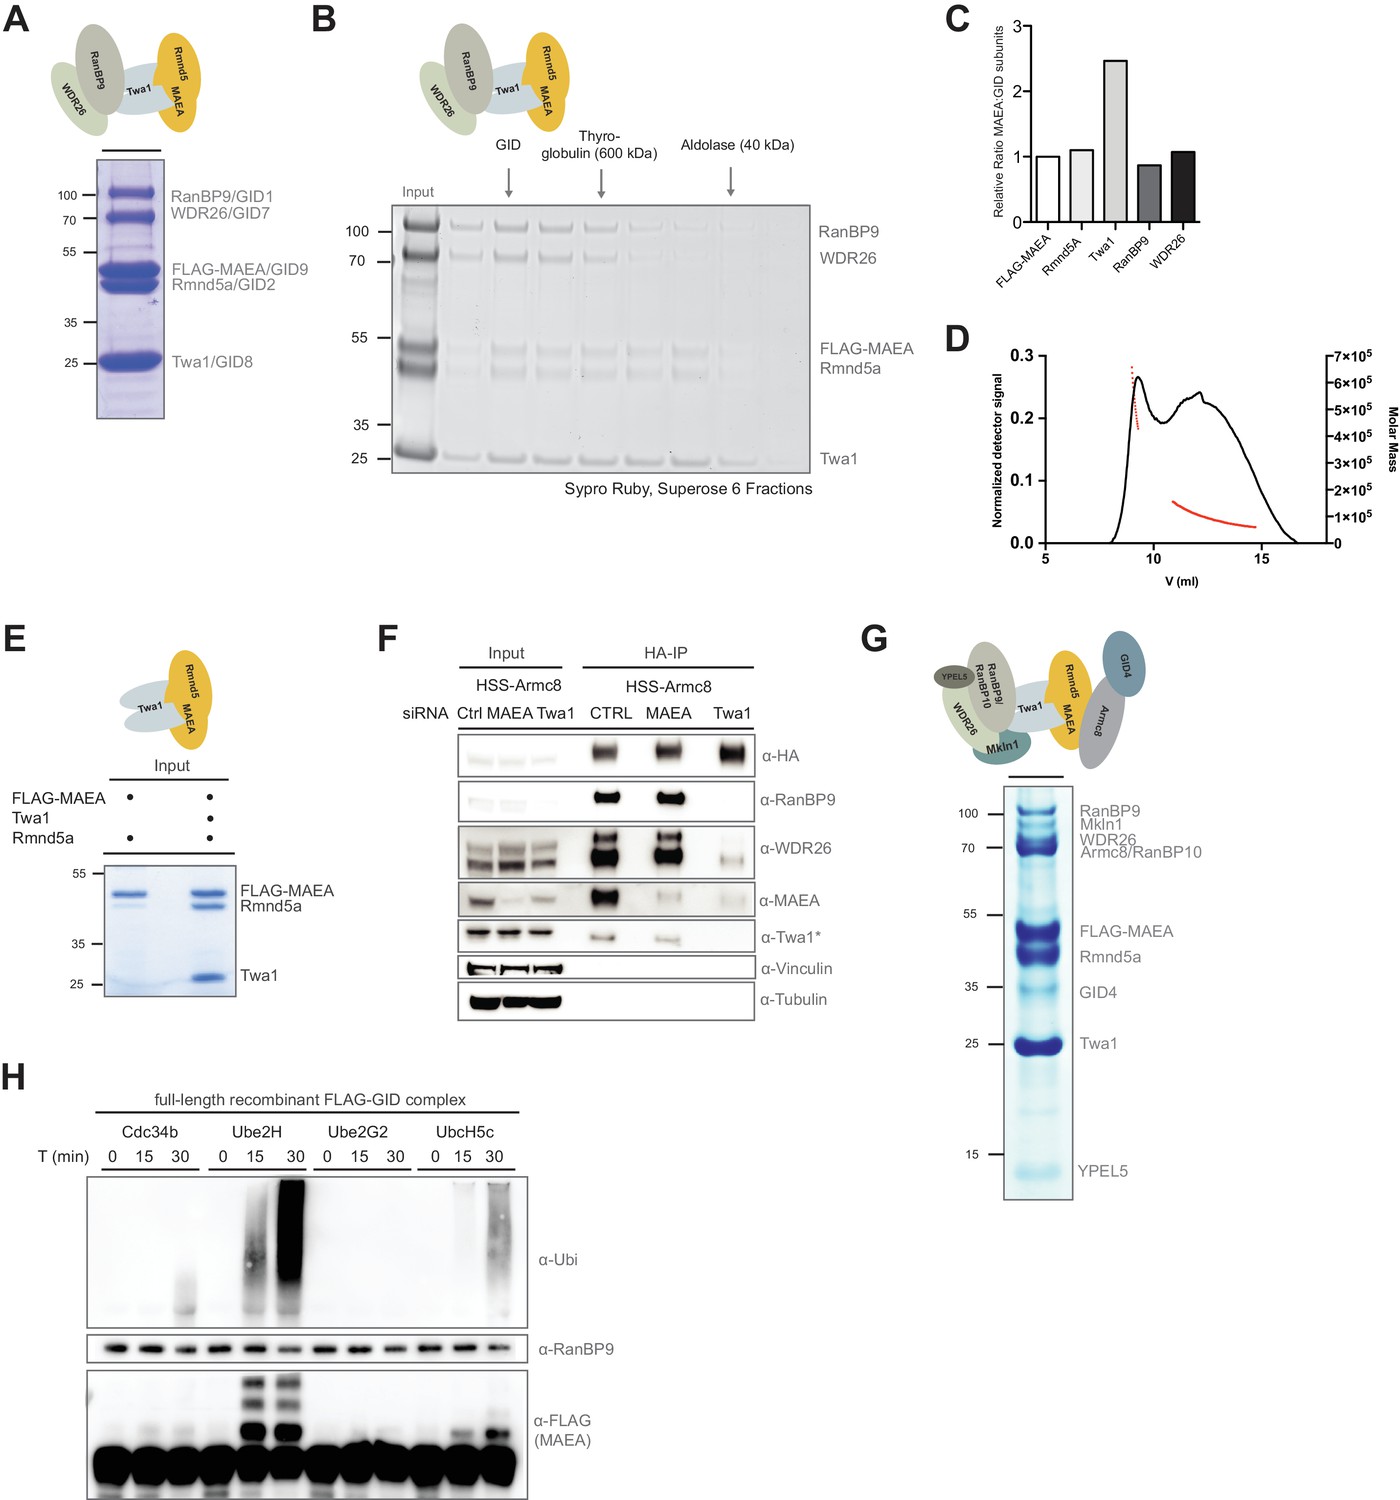
Reconstitution of the human GID E3 ligase complex.
(A) Coomassie-stained SDS-PAGE showing a stable pentameric GID subcomplex expressed in insect cells and purified via the FLAG-tagged MAEA/GID9 subunit. All co-expressed proteins migrate at the predicted molecular weight. The molecular mass in kDa is indicated on the left. The deduced assembly of the GID subcomplex is schematically illustrated on top. (B) The pentameric GID complex was separated by size-exclusion chromatography and the fractions analyzed by Sypro-Ruby staining (left panel). The peak fraction is indicated (GID) relative to the size marker proteins. (C) The ratio of FLAG-tagged MAEA over co-eluting proteins in the peak fraction was quantified by densitometry analysis (right panel). Note that Twa1 is likely present as a dimer in the subcomplex. (D) SEC-MALS profile of the pentameric GID complex on a Superose six column. Over the center of the peak regions, the molecular weight of the molecules is indicated by the red line. (E) Co-expression of the RING proteins FLAG-MAEA and Rmnd5a in the presence or absence of Twa1. FLAG-peptide elutions of the individual purifications were analyzed side-by-side by SDS-PAGE/Coomassie staining. (F) Stably expressed HSS-Armc8 was isolated from HEK-293 cells treated for 72 hr with the indicated siRNAs. After HA-peptide elution the presence of several GID proteins was analyzed by immunoblotting. Note that in the absence of Twa1 the complex disintegrates. The asterisk (*) marks an unspecific strong band detected by the Twa1 antibody. (G) In vitro reconstitution of the human FLAG-tagged GID complex comprising all 10 full-length subunits from Sf9 cells. Single-step FLAG-purification analyzed by SDS-PAGE and subsequent Coomassie staining. The organization of the hGID is schematically illustrated on top. (H) Autoubiquitination capacity of the FLAG-tagged recombinant GID complex was tested in the presence of E1, Ubiquitin (Ubi) and Mg2+•ATP and either Cdc34, Ube2H, Ube2G2 or UbcH5c. Over the indicated time-course, Ube2H most efficiently promoted ubiquitin chain assembly and specific ubiquitination of the FLAG-tagged GID subunit MAEA, as visualized by means of immunoblotting using anti-Ubiquitin and anti-FLAG-antibodies. Immunoblotting of RanBP9 controls the presence of purified GID complexes.
Figure 2—figure supplement 1

In vitro reconstitution of the human GID E3 ligase complex.
(A) Individual protein standard and pentameric GID elution profiles from a size-exclusion run corresponding to Figure 2B. (B) Coomassie-stained SDS-PAGE of purified recombinant hGID complexes with and without the protein Mkln1. The asteriks (*) marks an unspecific contaminant. The organization of the analyzed hGID complex is schematically illustrated on top. Note that the presence of Mkln1 does not affect the levels of WDR26 within the complex. (C) Autoubiquitination assay of recombinant FLAG-tagged decameric GID complex in the presence of E1, ubiquitin (Ubi) and Mg2+•ATP and either the E2 enzymes Ube2E1, Ube2E2 or Ube2H. Ubiquitin chain assembly and MAEA autoubiquitination was assayed with anti-ubiquitin (upper panel) and FLAG-antibodies (lower panel). (D) FLAG-pull down assay of the catalytic hGID core complex in the presence of bovine serum albumin (BSA) and the E2 enzymes Ube2E2, Ube2G2 and Ube2H. The different hGID subunits and the immunoglobulin heavy- (HC) and light chains (LC) are indicated on the right. Ube2H weakly but specifically interacts with the stable GID subcomplex (arrow).
Figure 3 with 1 supplement
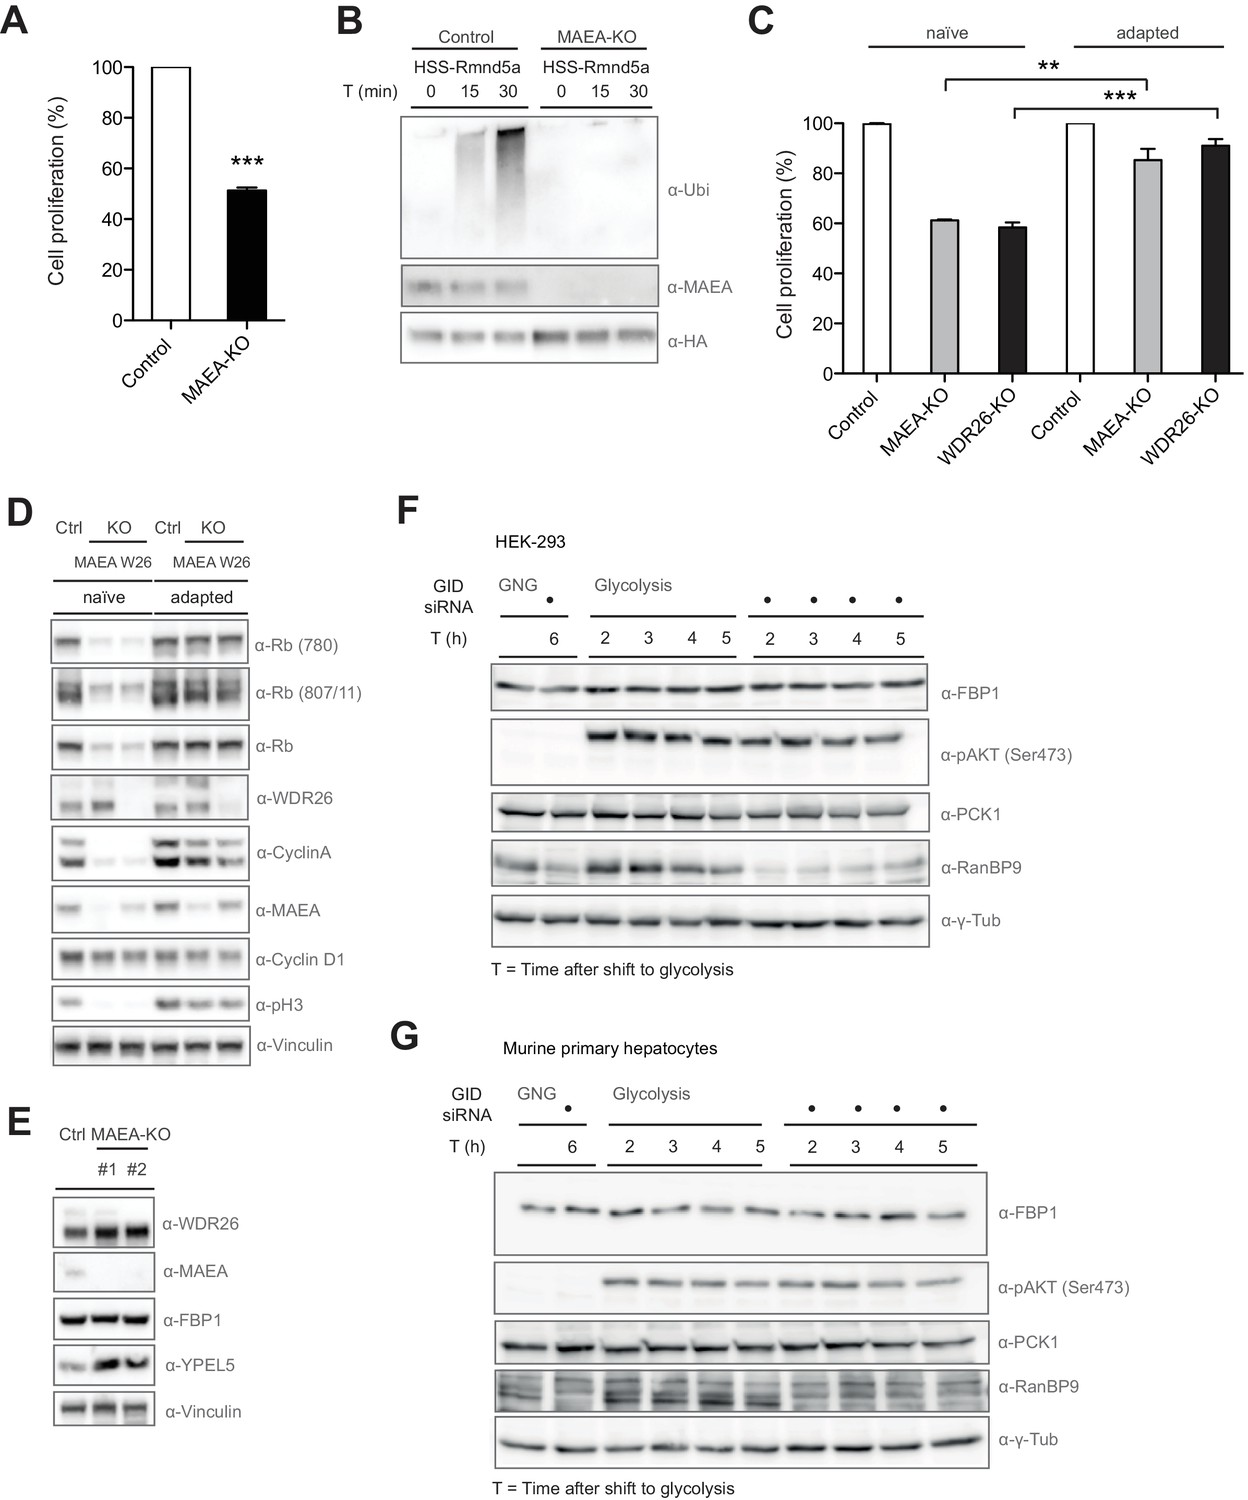
Compromised GID activity results in an intermittent cellular growth defect.
(A) Cell proliferation of RPE control and MAEA-KO cells was quantified with MTT assays between days 6 and 9 after lentiviral transfection. Data are shown as mean of triplicates and % change in signal relative to control gRNA-treated cells ± SD, n = 3, ∗∗∗p≤0.0006. (B) In vitro autoubiquitination assay of native GID particles isolated via the stably expressed HSS-tagged RING protein Rmnd5a from HEK-293 control or MAEA-KO cells in the presence of Ube2H. Deletion of MAEA results in complete loss of the catalytic activity of the GID complex as shown by immunoblotting using an antibody directed against Ubiquitin. (C) Cell proliferation of RPE MAEA-KO and WDR26-KO cells was measured by MTT assays between days 6–9 (naïve) and 15–17 (adapted) after lentiviral transfection. Data are shown as mean of triplicates and % change in signal relative to control gRNA-treated cells ± SD, n =≥2, ∗∗p≤0.0016, ∗∗∗p≤0.0007. (D) Cell extracts prepared from naïve and adapted RPE MAEA-KO and WDR26-KO cells were analyzed for cell cycle and growth pathway markers by immunoblotting. Note that the adapted GID-KO cells overcome the proliferation defect as judged by the presence of phosphorylated Histone H3, Rb (S780 and S807/811) and restored levels of the cell cycle markers Cyclin A and Cyclin D1. (E) Untreated (naïve) control and MAEA-KO RPE cells express comparable FBP1 protein levels in contrast to the autoregulated and stabilized GID subunit YPEL5. (F and G) The murine GID complex is dispensable for degradation of the gluconeogenic enzymes FBP1 and PCK1 in HEK-293 and primary murine hepatocytes. Cells were starved after control and GID siRNA treatment before switching them back to glycolytic conditions. Samples for immunoblot analysis were taken at the indicated time points and probed for FBP1 and PCK1 protein levels (n = 2). The metabolic switch in these cells was controlled by phosphorylation of Akt (Ser473) and the efficiency of GID complex depletion was probed using an antibody directed against the subunit RanBP9 of the complex.
Figure 3—figure supplement 1
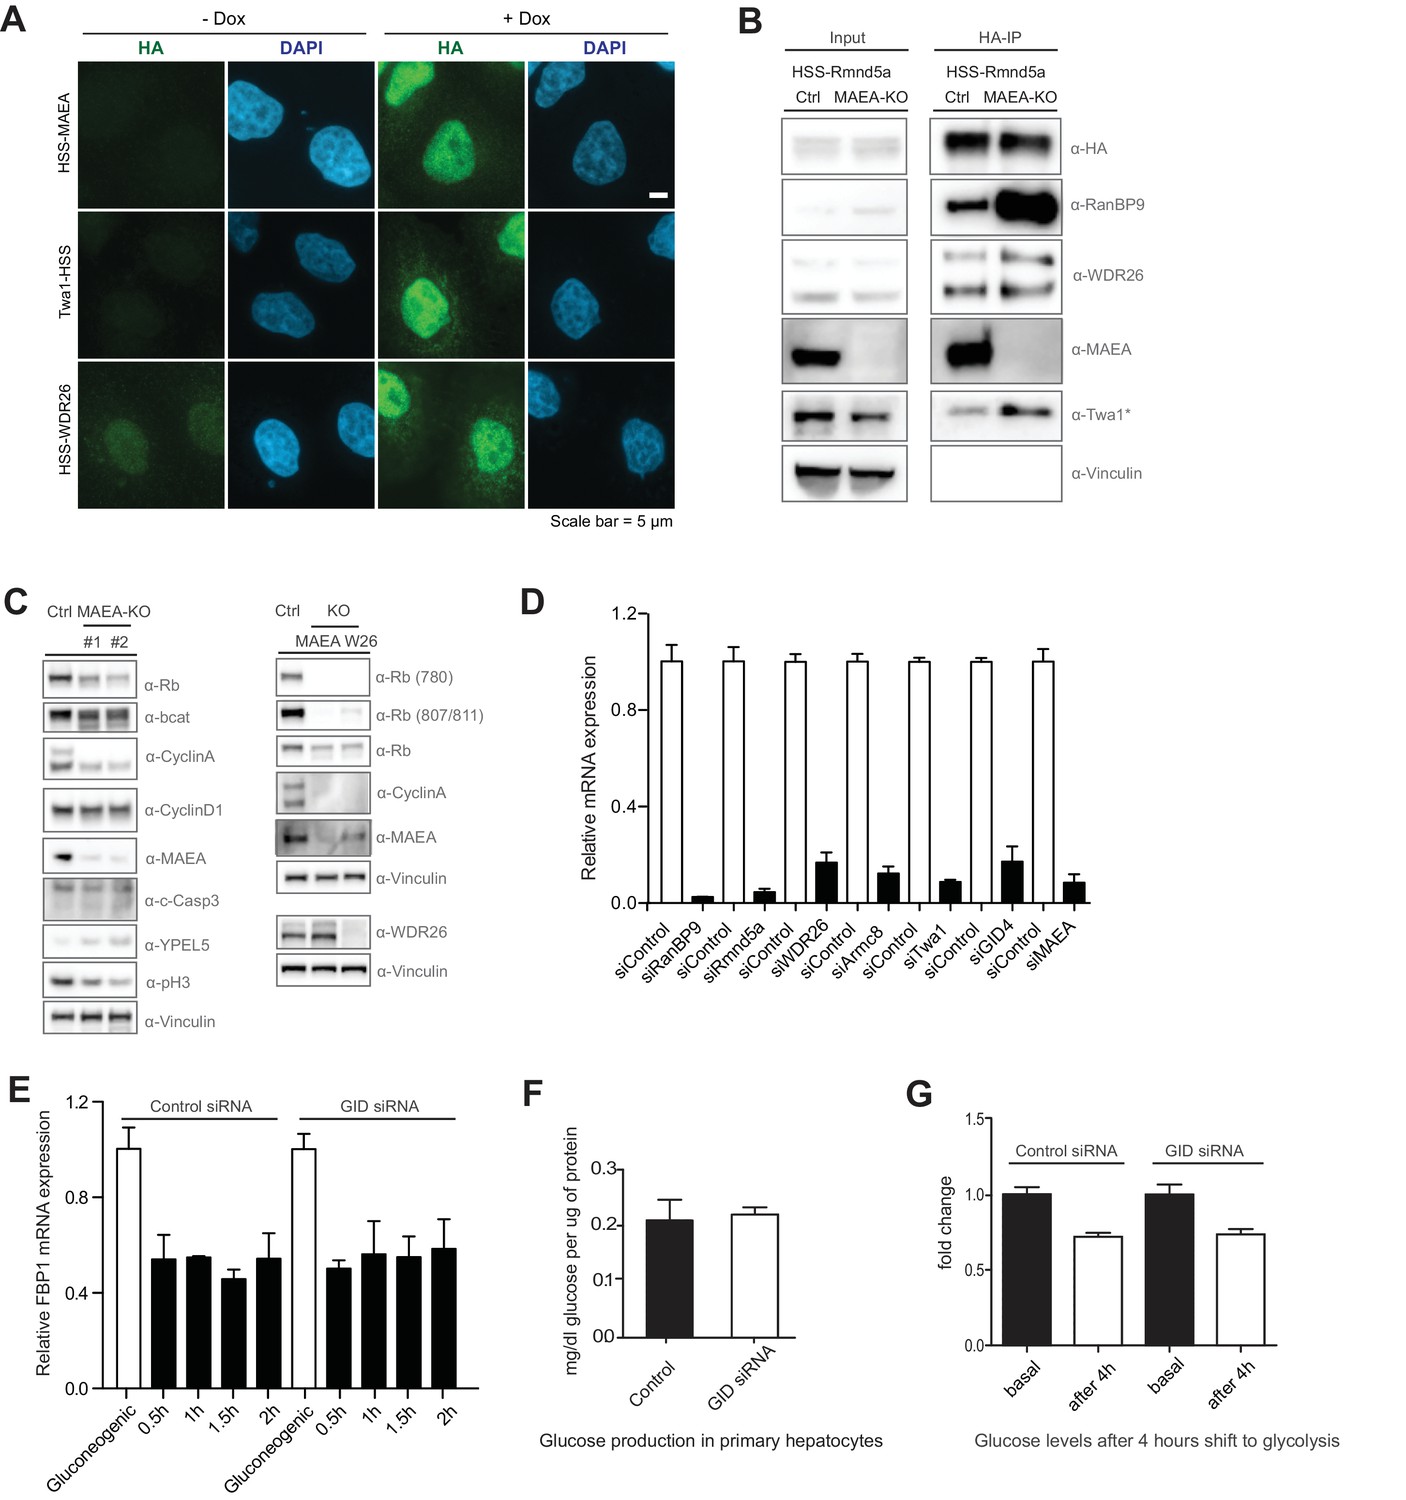
GID activity is required for cell growth in RPE cells.
(A) Gallery of HA-immunofluorescence images showing the respective subcellular localization of HSS-tagged GID subunits MAEA, Twa1 and WDR26, stably expressed from a doxycycline-inducible promoter. Co-staining of DNA with DAPI visualizes the nuclei. The proteins are predominantly nuclear with some diffuse staining in the cytoplasm. Scale bar, 5 μM. (B) Immunoprecipitation of HEK-293 control and MAEA-KO cells transiently expressing HSS-tagged Rmnd5a. The presence of associated proteins was examined by immunoblotting with the indicated antibodies. The Twa1 antibody also recognizes an unspecific band at approximately the same size in WCEs (asterisks). Note that the assembly of the GID complex requires the RING protein MAEA. (C) Cell extracts prepared from RPE control (ctrl), MAEA-KO (targeted by two distinct sets of gRNAs, left panel) or WDR26-KO cells (right panel) were analyzed 6 days after lentiviral treatment for the indicated cell cycle and growth pathway markers by immunoblotting with the indicated antibodies. Note that cells deficient for GID activity show reduced levels of phosphorylated (780 and 807/811) and total levels of the tumor suppressor protein Rb, Cyclin A and phosphorylated Histone H3 indicating that they stopped proliferating. The autoregulated novel GID subunit YPEL5 is stabilized in catalytically inactive MAEA-KO cells. (D) Depletion efficiency of individual GID subunits in mouse primary hepatocytes analyzed by qRT-PCR using gene-specific primers. Averaged data plotted from independent experiments ± SEM, n = 2. (E) Relative mRNA expression of FBP1 in murine primary hepatocytes in gluconeogenic and glycolytic conditions in control siRNA or GID siRNA samples analyzed by qRT-PCR. Graphs present the averaged data from two independent experiments performed in duplicates ± SEM, n = 2. (F) The ability of hepatic glucose production was measured in control- and GID siRNA-treated cells starved for 6 hr before processing. Data expressed as mean mg/dl of glucose per μg protein relative to control ± SD, n = 6. (G) Glucose levels in the medium of control and GID-depleted primary hepatocytes were determined 4 hr after they were shifted from gluconeogenesis to glycolysis. Data presented as mean fold change relative to control ± SD, n = 3.
Figure 4 with 1 supplement
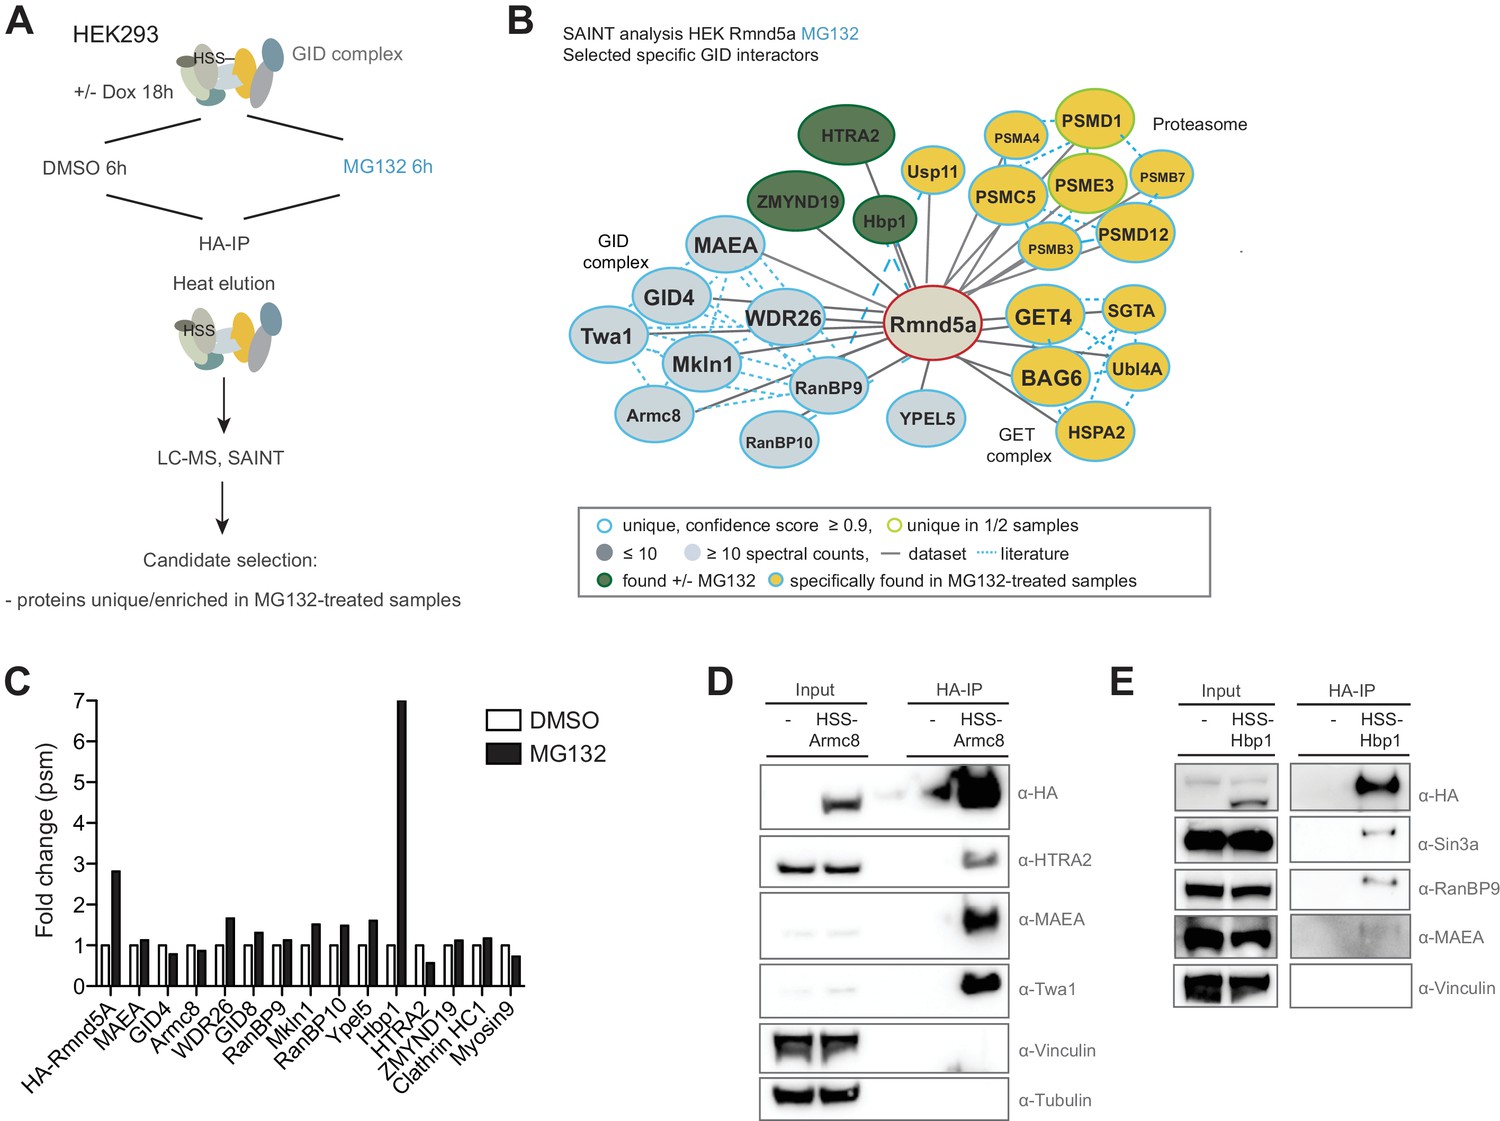
Semi-quantitative proteomics identifies novel stable and regulated GID-interacting proteins.
(A) Scheme of the applied AP-MS workflow to identify MG132-enriched Rmnd5a-HCIPs in HEK-293 cells. (B) SAINT-network of Rmnd5a-HCIPs in cells treated with MG132 for 6 hr (confidence score ≥0.9, FC ≥ 4, n = 2). The GID subunits are labeled in light blue and remain stably associated in the presence of MG132. Constitutive HCIPs that were recovered in control and MG132-treated samples are colored in green. Proteins and protein networks that are specifically associated with the GID complex in the presence of MG132 are highlighted in yellow. (C) Quantification of total peptide spectral matches (psm) measured for Rmnd5a-HCIPs in DMSO control vs. MG132-treated samples. Note that the transcription factor Hbp1 is specifically enriched upon proteasome inhibition. (D) Co-immunoprecipitation experiment (HA-IP) using HEK-293 cells stably expressing HSS-Armc8 demonstrates specific interaction of the mitochondrial protease HTRA2 with the GID complex. (E) Immunoprecipitation and subsequent immunoblot analysis of HEK-293 cells expressing a doxycycline-inducible HSS-tagged construct of Hbp1. Note that Hbp1 not only binds its corepressor protein Sin3a but also multiple subunits of the GID complex.
-
Figure 4—source data 1
List of Rmnd5a-interactors in the presence of MG132 identified by AP-MS and SAINT analysis.
- https://doi.org/10.7554/eLife.35528.013
-
Figure 4—source data 2
List of Hbp1-interactors identified by AP-MS and SAINT analysis.
- https://doi.org/10.7554/eLife.35528.014
Figure 4—figure supplement 1
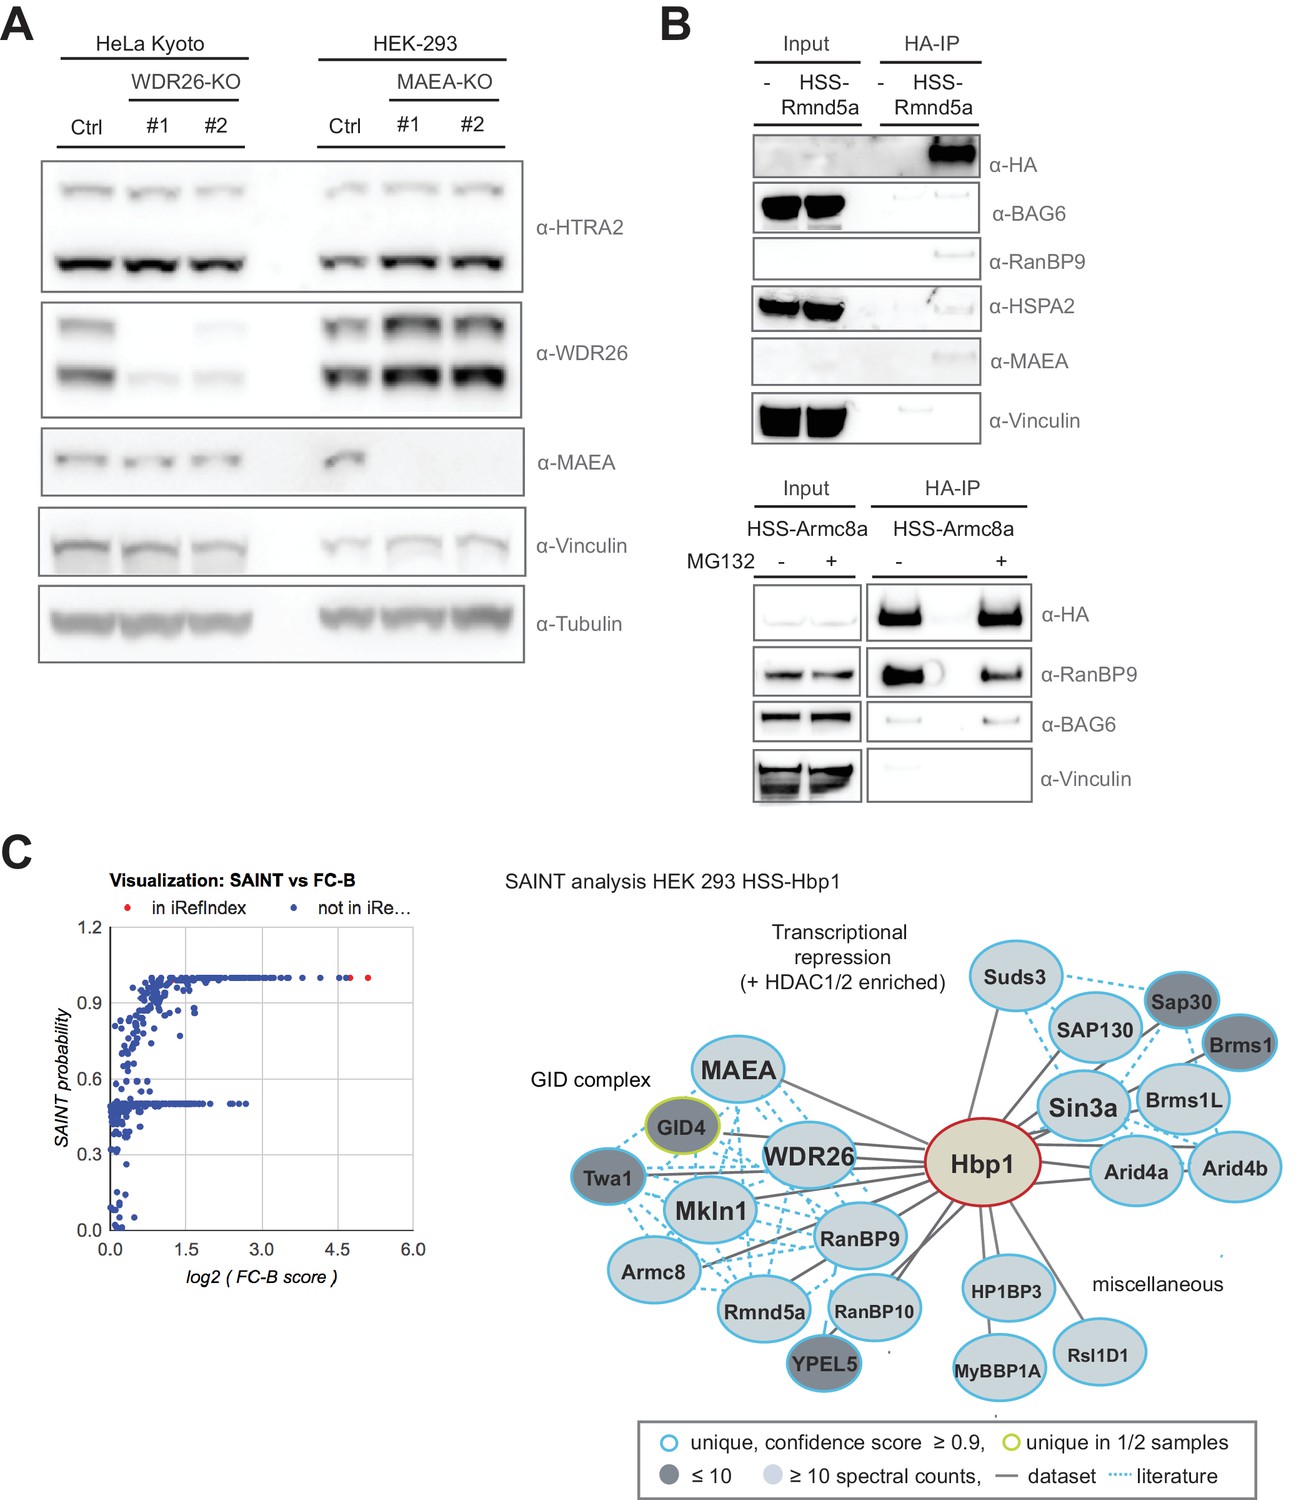
The transcription factor Hbp1 is a novel reciprocal GID-interacting protein.
(A) The protein levels of the GID-interactor and mitochondrial protease HTRA2 was compared by immunoblotting of extracts prepared from HeLa Kyoto and HEK-293 cells deleted for WDR26 or MAEA using different gRNAs. (B) HA-immunoprecipitation of stably expressed HSS-Rmnd5a (upper panel) or HSS-Armc8 (lower panel) from HEK-293 cells. Where indicated (+), the cells were treated for 30 min with MG132 prior to cell lysis to prevent proteasomal degradation. Note that the mammalian GET complex protein BAG6 and the chaperone HSPA2 only weakly interact with the hGID complex, and the interaction of Rmnd5a with BAG6 is only marginally increased in the presence of MG132. (C) Graphical (left) and network (right) view of Hbp1-HCIPs mapped by AP-MS and subsequent SAINT analysis in HEK-293 cells (SAINT probability score ≥0.9, fold change over control (FC-B) ≥4, n = 2). Hbp1 shows two strong independent interaction modules comprising multiple subunits of the Sin3a co-repressor complex and the GID E3 ligase with all subunits present. Previously reported hits documented in the interaction database (iRefIndex) are displayed by red dots and novel hits are colored in blue.
Figure 5 with 1 supplement

The transcription factor Hbp1 is a proteolytic ubiquitination target of the human GID E3 ligase.
(A) Depletion of WDR26 and Rmnd5a with pools of siRNAs for 72 hr increase the protein levels of the transcription factor Hbp1 in HeLa Kyoto cells. (B) Corresponding quantification of the relative proteins levels of Hbp1 and WDR26 upon downregulation of WDR26 compared to control siRNA-treated samples. Average data ± SEM, n ≥ 3 independent experiments, ∗∗p≤0.006. (C) qRT-PCR analysis of total Hbp1 mRNA levels in HeLa Kyoto cells upon RNAi-mediated depletion of WDR26, Rmnd5a and Hbp1. Data are shown as mean fold change relative to control siRNA-treated cells ± SD, n = 3. (D) Immunoblot analysis of HeLa Kyoto cells stably expressing from a doxycycline-inducible promoter an untagged WDR26RNAi-resist construct. As indicated, the cells were treated for 72 hr with control siRNA or siRNA oligos depleting endogenous WDR26. (E) HeLa Kyoto WDR26-KO cells generated with two different sets of gRNAs were immunoblotted for protein levels of WDR26, Hbp1 and Cyclin D1. (F) The half-life of endogenous Hbp1 was determined in HeLa Kyoto cells treated with siRNA control or RNAi-depleted of WDR26 or HBP1 for 72 hr. Protein translation was blocked by the addition of 50 μg/μl cycloheximide, and Hbp1 levels were analyzed at the indicated time points after drug treatment. (G) Ubiquitination of Hbp1-FLAG in vitro. Purified Hbp1 was incubated with ubiquitin, E1, Ube2H and the full-length recombinant GID complex or control neddylated CRL4CRBN at 37°C for the indicated time (min). Samples were analyzed by immunoblotting with an antibody directed against Hbp1.
Figure 5—figure supplement 1
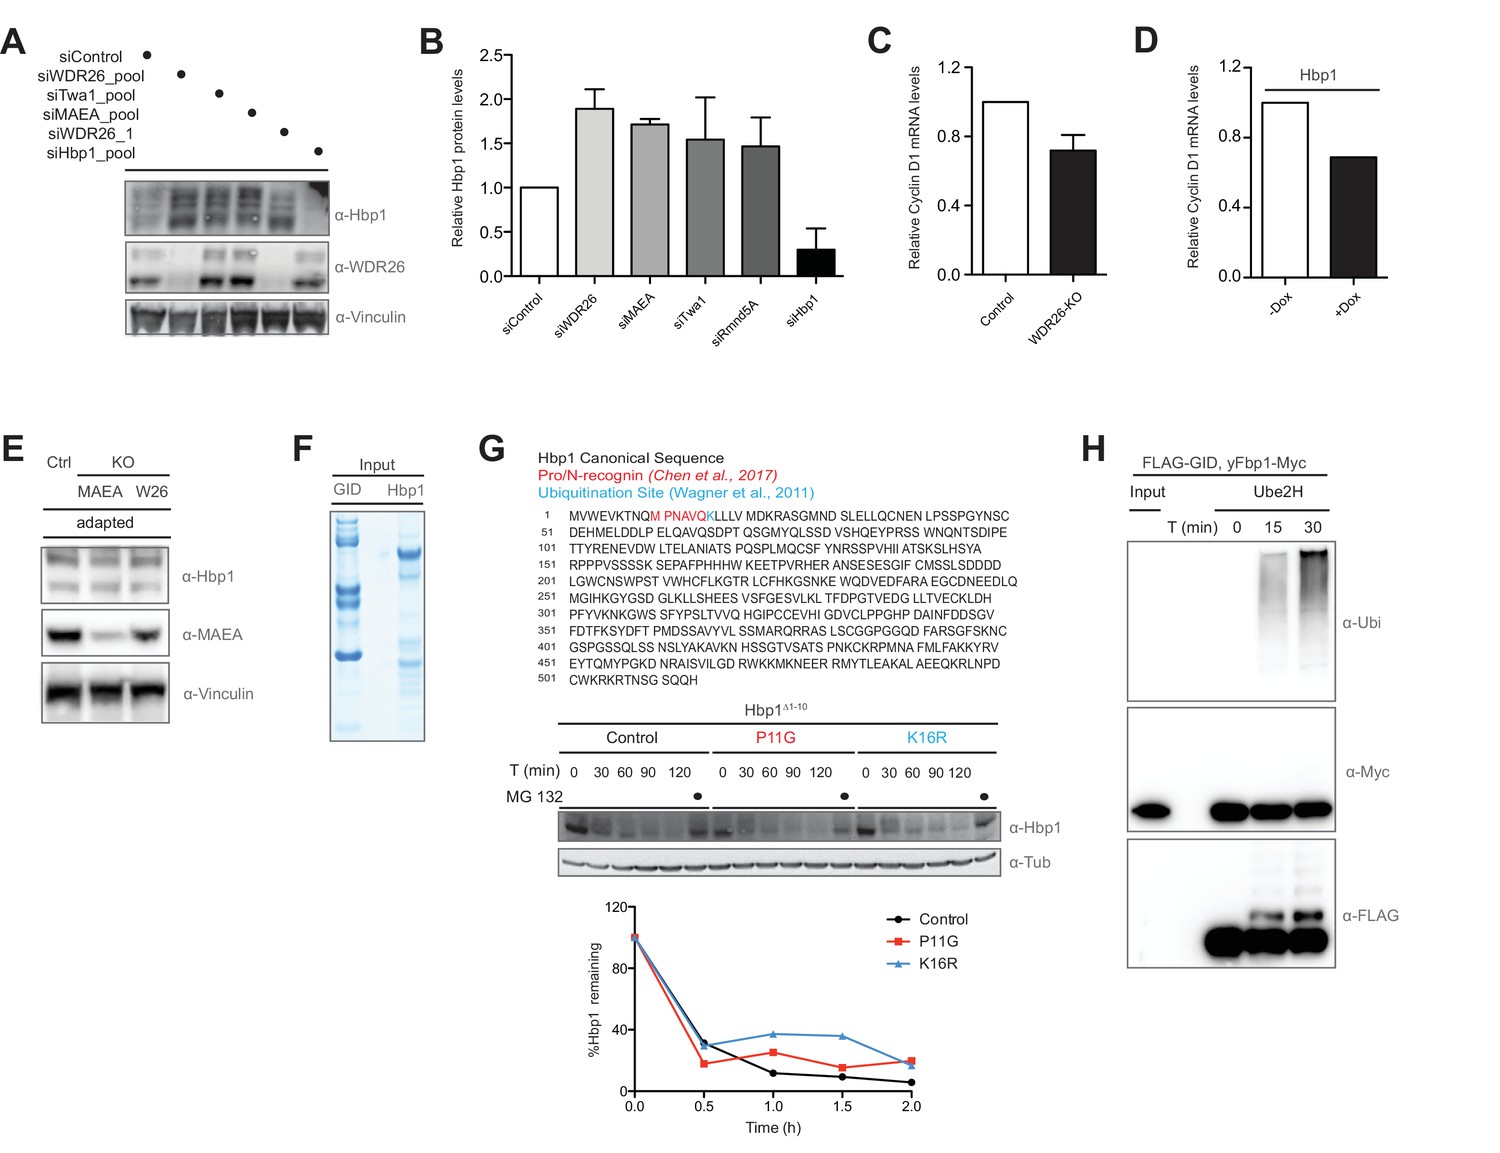
The transcription factor Hbp1 is regulated by the human GID complex.
(A and B) Protein levels of the transcription factor Hbp1, WDR26 and Vinculin in HeLa Kyoto cells treated with control siRNA or depleted for 72 hr of WDR26, Twa1, MAEA and Hbp1 with pools of siRNAs. The blots were quantified and presented as relative protein levels of Hbp1 upon downregulation of the individual GID subunits compared to control and Hbp1 siRNA-treated samples. Averaged data ± SEM, n ≥ 2 independent experiments. (C) Representative qRT-PCR analysis of total Cyclin D1 mRNA levels in HeLa Kyoto cells upon CRISPR-mediated knockout of WDR26. (D) Representative qRT-PCR analysis of total Cyclin D1 mRNA levels in HeLa Kyoto cells upon doxycycline-induced overexpression of Hbp1. (E) Immunoblot analysis of adapted (day 15) RPE MAEA and WDR26-KO cells indicating that Hbp1 protein levels normalize over time. Control cells were generated in parallel with gRNAs directed against Luciferase and maintained for 15 days. (F) Coomassie-stained SDS-PAGE of the purified recombinant hGID complex and its substrate Hbp1-FLAG from Sf9 insect cells, which correspond to the in vitro ubiquitination assay shown in Figure 5F. (G) Ectopic expression in HeLa Kyoto cells of a N-terminally truncated Hbp1 construct to generate an alternative start site matching the Pro/N-end rule consensus sequence required for substrate recognition by the yeast GID complex (Chen et al., 2017). Mutating the proline residue right after the start codon to a glycine (P11G) and a previously published Hbp1 ubiquitination site (Wagner et al., 2011) to an arginine (K16R) has no obvious influence on the half-life of Hbp1 using cycloheximide assays described in Figure 5F. (H) The human recombinant GID complex is not able to in vitro ubiquitinate the purified yFbp1-Myc protein. Ubiquitination of yFbp1-Myc was tested in the presence of E1, Ubiquitin (Ubi) and Mg2+•ATP and Ube2H, and analyzed by immunoblotting with the indicated antibodies after 0, 15 and 30 min. Note that hGID efficiently promotes ubiquitin chain assembly (α-Ubi) and specific ubiquitination of the FLAG-tagged GID subunit MAEA (α-FLAG).
Figure 6

Model illustrating newly identified and potential GID E3 ligase functions in human cells.
(A) Schematic representation of the mammalian GID complex summarizing its subunit composition, potential architecture and major catalytic features. In brief, the multi-subunit E3 ligase complex is formed around a stable catalytic core formed by the RING proteins MAEA and Rmnd5. The RING proteins MAEA and Rmnd5 are strictly required for normal complex formation and catalysis. Twa1 is a dimer that is critical for association of both RING proteins and downstream complex assembly. Armc8 is required for recruitment of GID4. The E2 enzyme Ube2H cooperates with the GID complex in substrate ubiquitination. (B) Based on our results we suggest that the GID complex is a conserved and ubiquitously expressed E3 ligase that resides both in the nucleus and cytoplasm, and regulates cell proliferation in human cells. While it remains to be investigated if and how the activity of the complex is spatially and/or temporally regulated, we speculate that the more peripheral subunits such as WDR26, RanBP9, Mkln1 and possibly GID4 may play important roles in anchoring the complex at specific subcellular locations and/or provide distinct docking sites for substrates. This might in part help to explain the plethora of interacting proteins reported for RanBP9 (Salemi et al., 2017). We were neither able to identify an obvious role for the metazoan GID complex in targeting gluconeogenic enzymes for proteasomal degradation nor find direct evidence for a potentially conserved function in a Pro/N-end rule pathway. A series of AP-MS experiments however, isolated novel GID-interacting proteins including the transcription factor and negative regulator of several pro-proliferative genes Hbp1. Hpb1 protein turnover is regulated by the GID E3 ligase and biochemical evidence suggests that Hbp1 is directly ubiquitinated by the complex, which might contribute to the intermittent proliferation phenotype observed for GID-KO cell lines.
Author response image 1
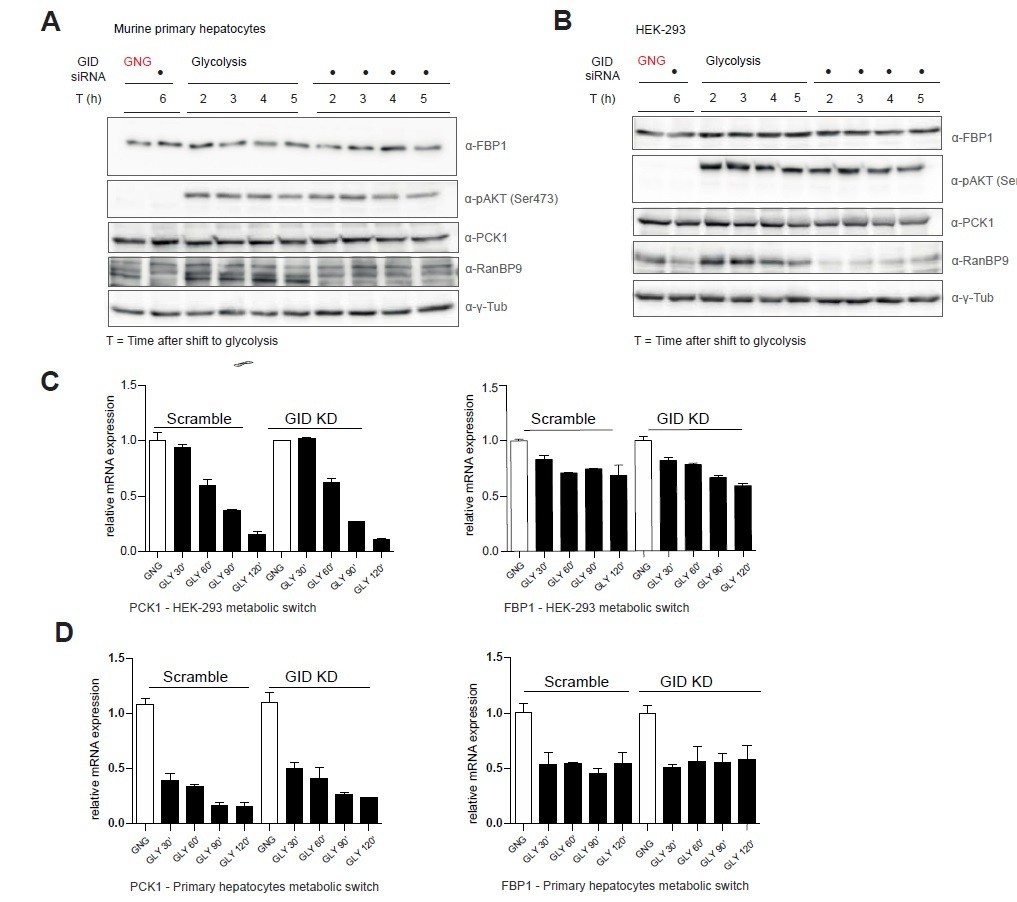
Murine GID is dispensable for the regulation of gluconeogenic enzymes FBP1 and PCK1.
A, B. Western blot analysis of control- and GID siRNA-treated primary mouse hepatocytes and HEK-293 cells shifting from gluconeogenesis (GNG) to glycolysis (GLY) over the indicated period of time. C, D. qRT-PCR of PCK1 and FBP1 transcripts in HEK-293 and primary hepatocytes in control and GID-depleted cells during a metabolic shift from GNG to GLY. Data is shown as mean fold change relative to control ± SD, n = 3.
Author response image 2
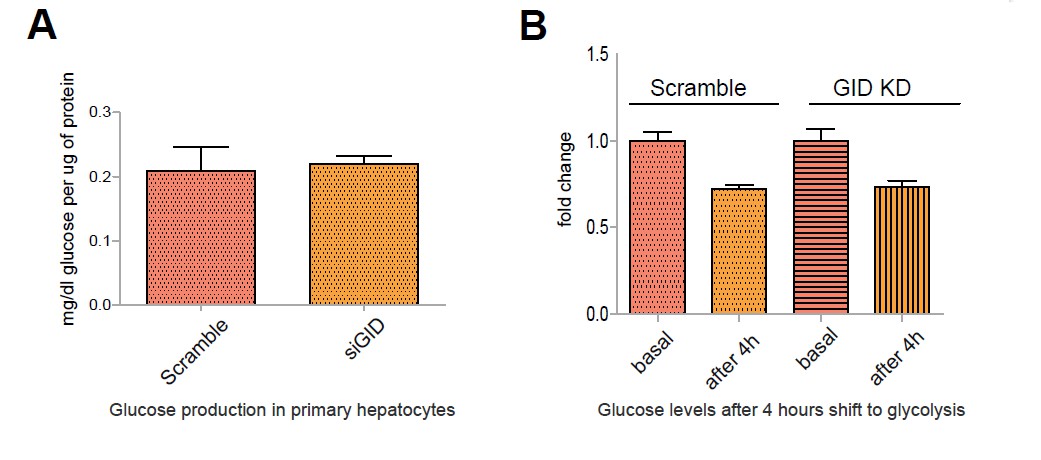
Murine GID does not affect glucose output in primary hepatocytes during a metabolic switch.
A. Glucose production in primary hepatocytes following a 6 h incubation in glucose-producing medium. Data expressed as mean mg/dl of glucose per μg protein relative to control ± SD, n=6. B. Glucose levels in the medium of primary hepatocytes after a 4 h shift from gluconeogenesis to glycolysis. Data presented as mean fold change relative to control ± SD, n=3.
Additional files
-
Supplementary file 1
is related to the Materials and methods section and contains the lists of plasmids, siRNAs, qRT-PCR primers, guide RNAs, yeast strains and cell lines used in this study.
- https://doi.org/10.7554/eLife.35528.018
-
Transparent reporting form
- https://doi.org/10.7554/eLife.35528.019
Download links
A two-part list of links to download the article, or parts of the article, in various formats.
Downloads (link to download the article as PDF)
Open citations (links to open the citations from this article in various online reference manager services)
Cite this article (links to download the citations from this article in formats compatible with various reference manager tools)
The multi-subunit GID/CTLH E3 ubiquitin ligase promotes cell proliferation and targets the transcription factor Hbp1 for degradation
eLife 7:e35528.
https://doi.org/10.7554/eLife.35528


