A cerebellar substrate for cognition evolved multiple times independently in mammals
- Stony Brook University, United States
- University College London, United Kingdom
- The George Washington University, United States
Figures
Figure 1
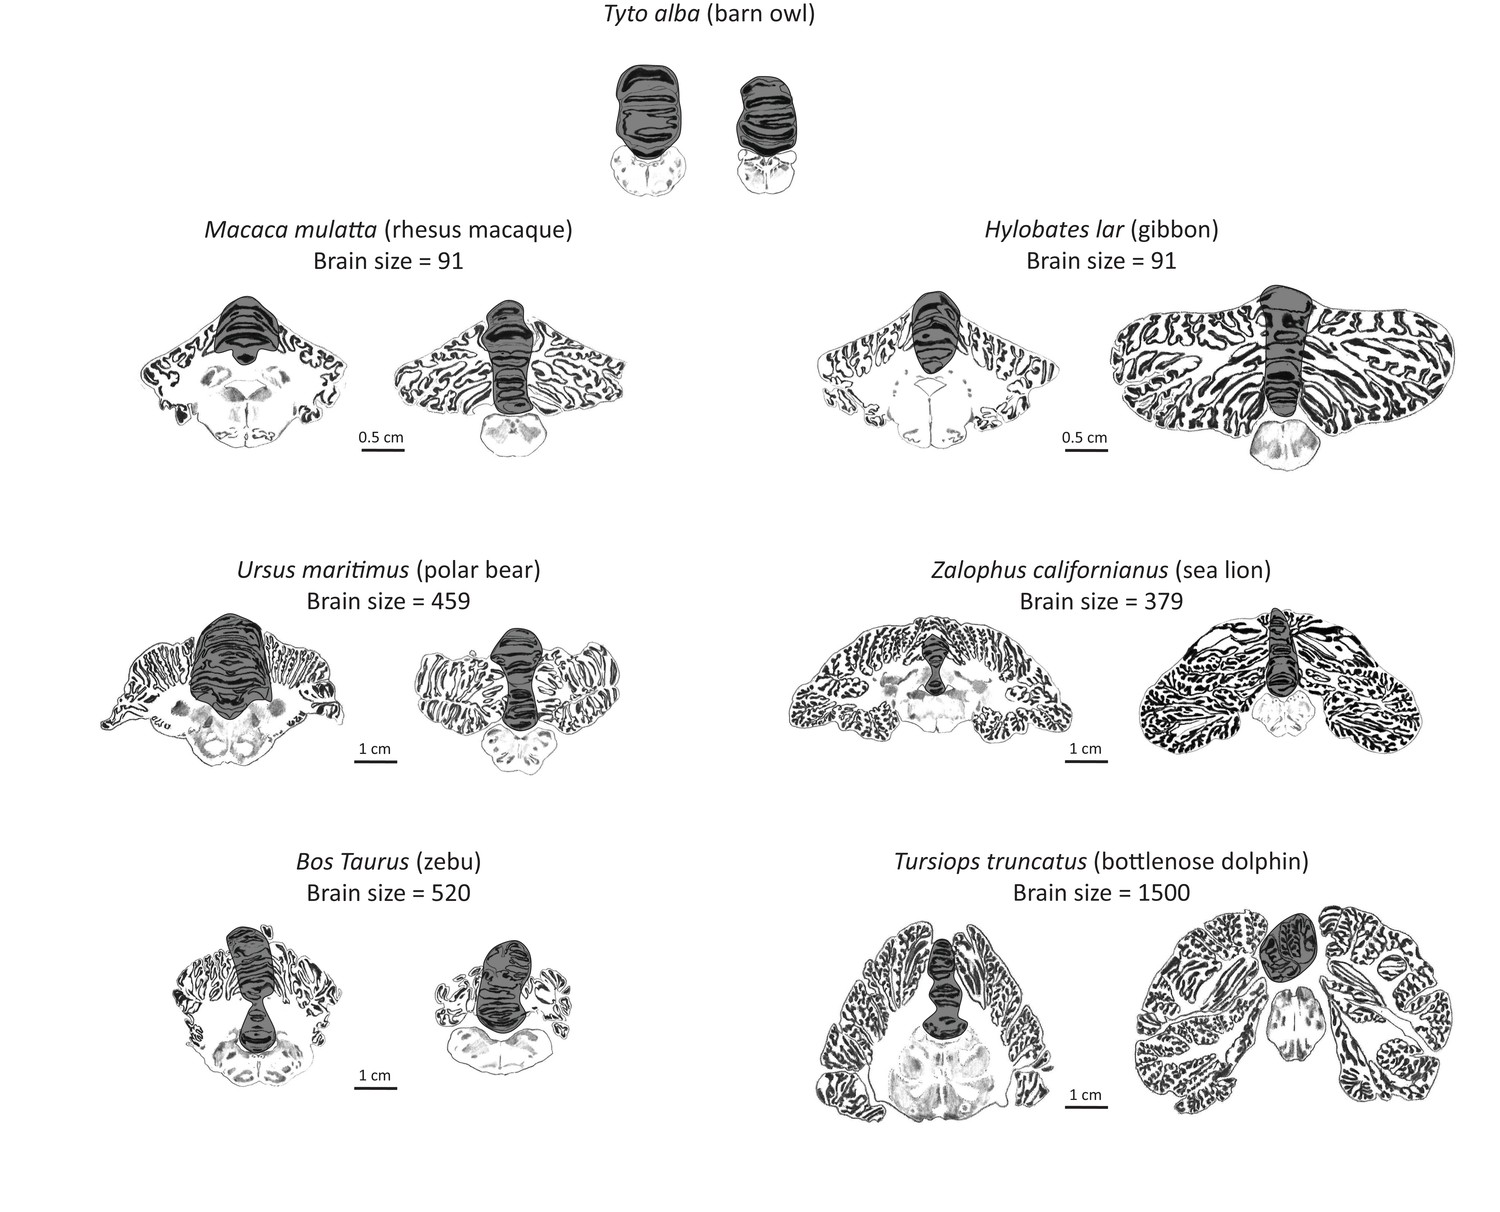
Artist’s rendering of scans of brain sections from representative species in the sample.
For each species, the left pane depicts a coronal section of the anterior cerebellum (near the facial colliculum of the rhomboid fossa), and the right pane of the posterior cerebellum (first available section in which white matter is no longer present). The dark overlay indicates the medial cerebellum. Note the absence of lateral cerebellar hemispheres in the barn owl. All illustrations are to scale, except for those of the barn owl. Original illustrations of Macaca mulatta, Ursus maritimus, Zalophus californianus, Bos Taurus, and Tursiops truncatus come from www.brainmuseum.org, Tyto alba comes from brainmaps.org, and Hylobates lar comes from the collection at the Vogt Institute for Brain Research (Zilles et al., 2011).
Figure 2
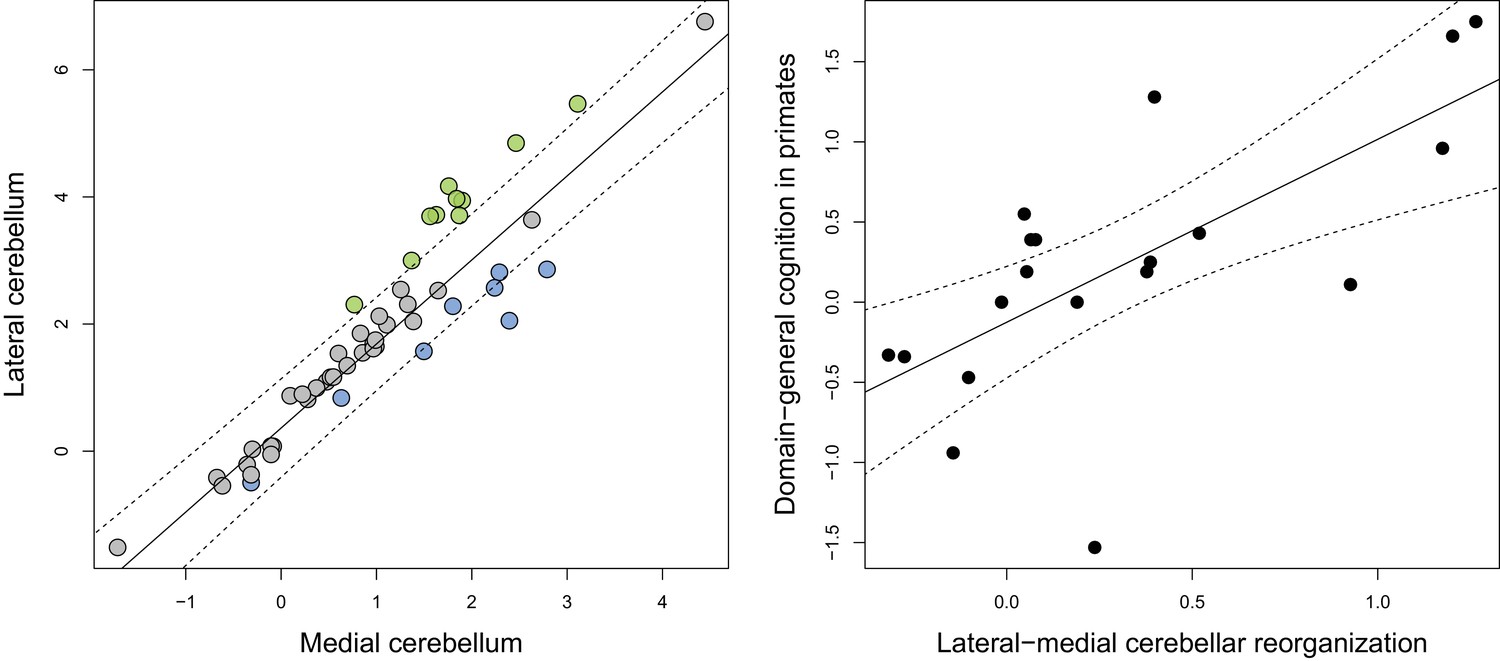
Phylogenetic generalized least-squares analysis of lateral cerebellar size to medial cerebellar size (left pane; colors as in Figure 3), and of lateral-medial cerebellar reorganization to a measure of domain-general cognition in primates (right pane).
The original measure of domain-general cognition (Deaner et al., 2006) is inversely related to cognitive ability (low scores indicate high cognitive ability). Here, for the purposes of visualization, we inversed this measure so that higher scores indicate a higher cognitive ability. Phylogenetic confidence intervals were computed following Smaers and Rohlf (Smaers and Rohlf, 2016).
-
Figure 2—source data 1
Brain data used in the analyses.
- https://doi.org/10.7554/eLife.35696.005
Figure 3 with 3 supplements
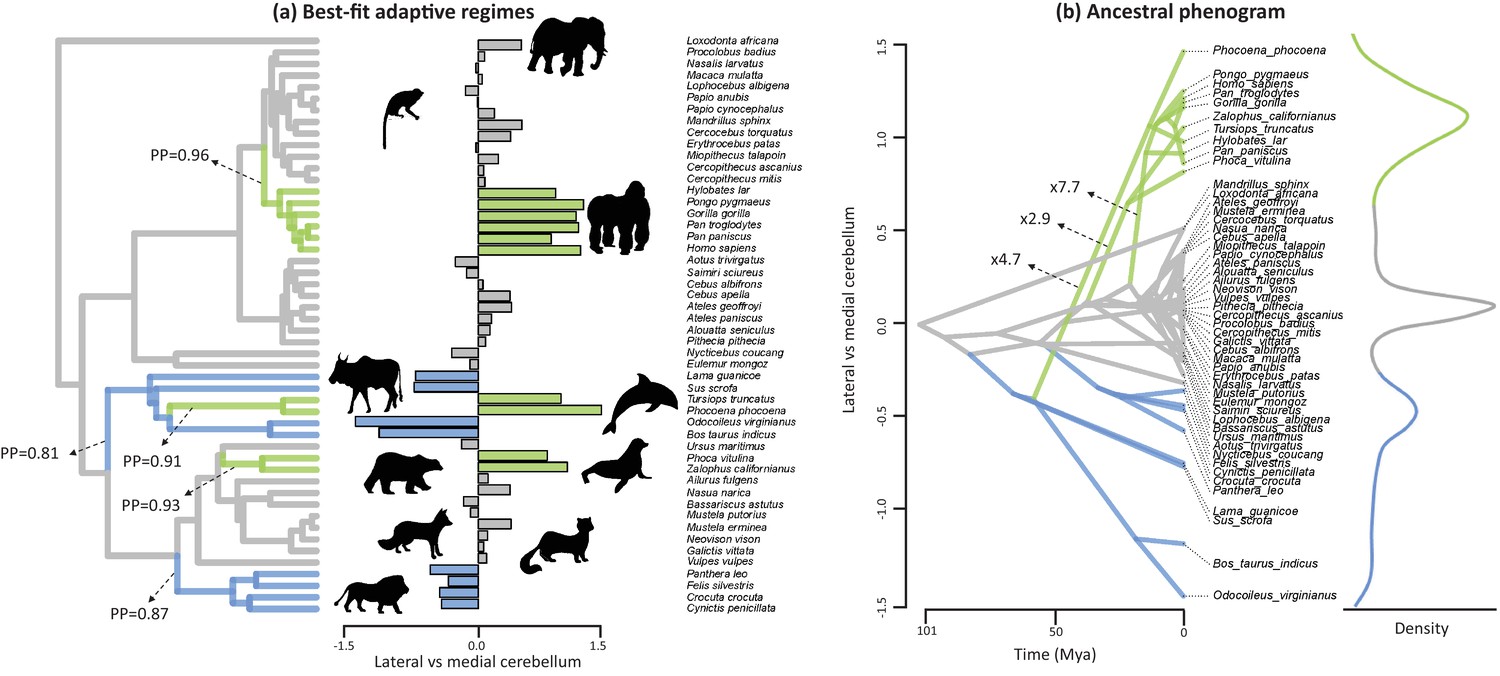
Best-fit adaptive regimes and ancestral phenogram for lateral-medial cerebellar reorganization.
Best-fit adaptive regimes were estimated using a Bayesian reversible-jump procedure for fitting OU models (Uyeda and Harmon, 2014) and confirmed as significant grade shifts using a phylogenetic ANCOVA (Smaers and Rohlf, 2016). Posterior probabilities (PP) of regime shifts were estimated using the Bayesian reversible-jump procedure. Nodal values for the ancestral phenogram were estimated using a multiple variance Brownian motion approach (Smaers et al., 2016). Green data points and branches comprise the convergent regimes of apes, toothed whales and pinnipeds, blue data points and branches comprises those of feliformes and artiodactyls.
-
Figure 3—source data 1
Tree used in the analyses.
- https://doi.org/10.7554/eLife.35696.010
Figure 3—figure supplement 1
Results of the Bayesian reversible-jump Ornstein-Uhlenbeck approach for lateral-medial cerebellar reorganization, relative cerebellum size, medial cerebellum size, and lateral cerebellum size.
https://doi.org/10.7554/eLife.35696.007
Figure 3—figure supplement 2
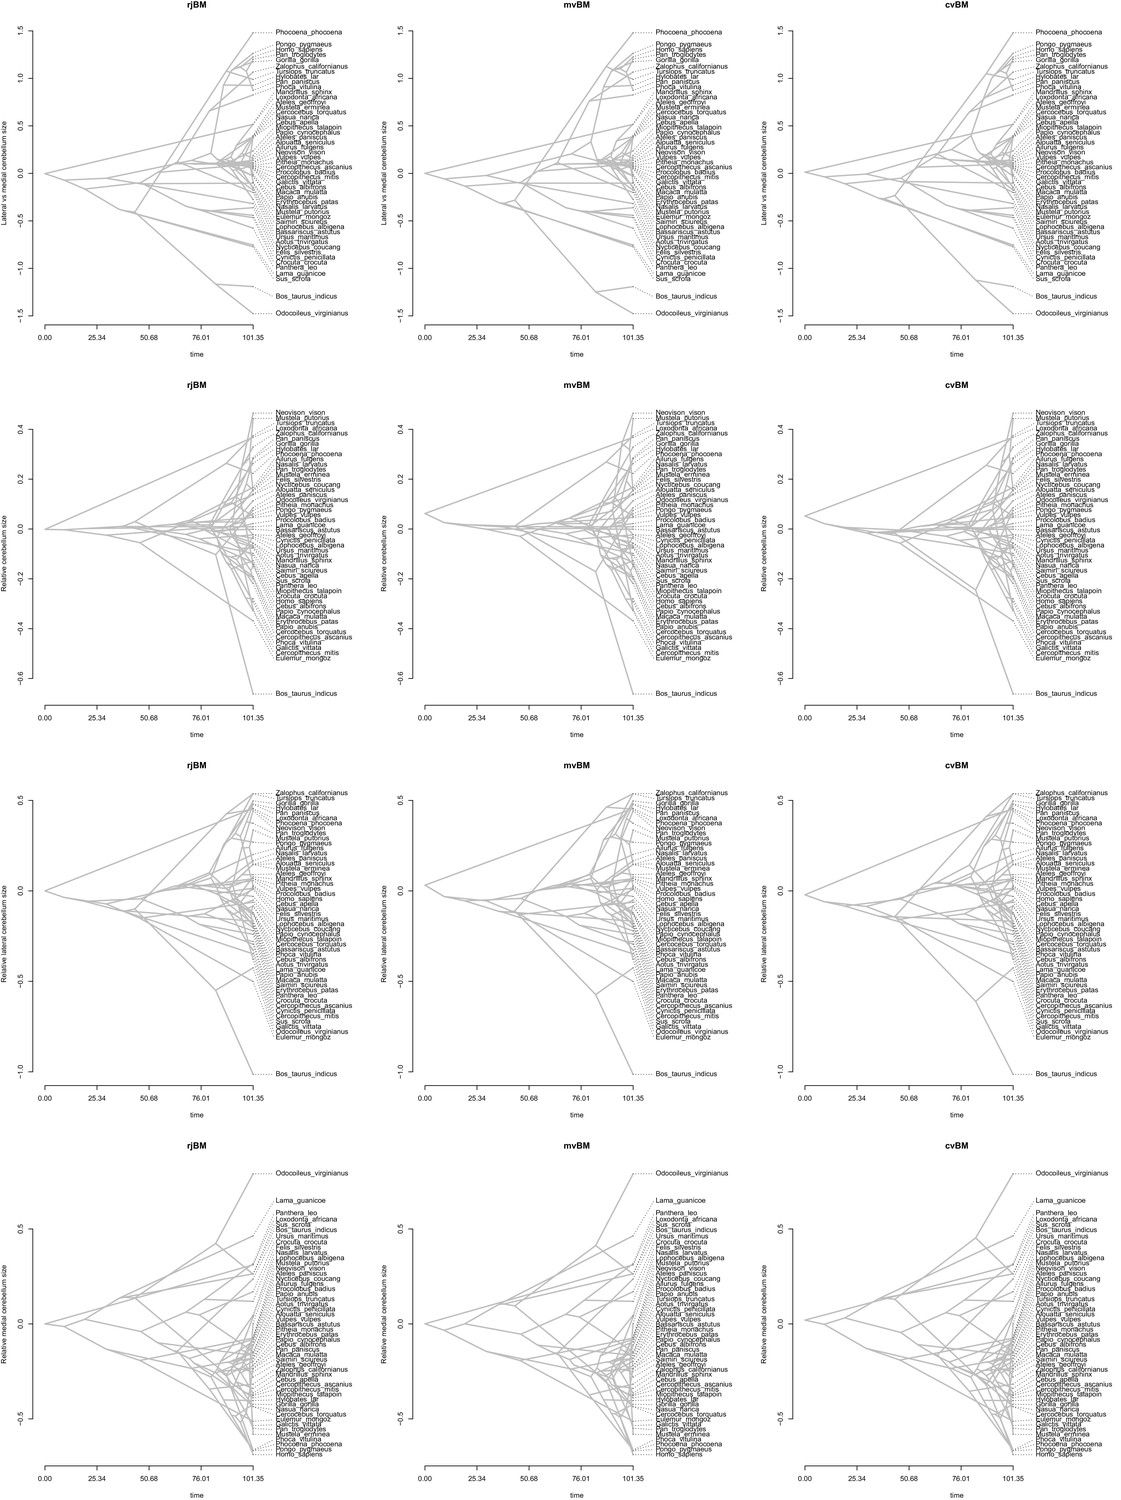
Ancestral phenograms using a reversible-jump (‘rjBM’), multiple variance (‘mvBM’) and standard Brownian motion (or ‘constant variance’ Brownian motion; ‘cvBM’) approach.
https://doi.org/10.7554/eLife.35696.008
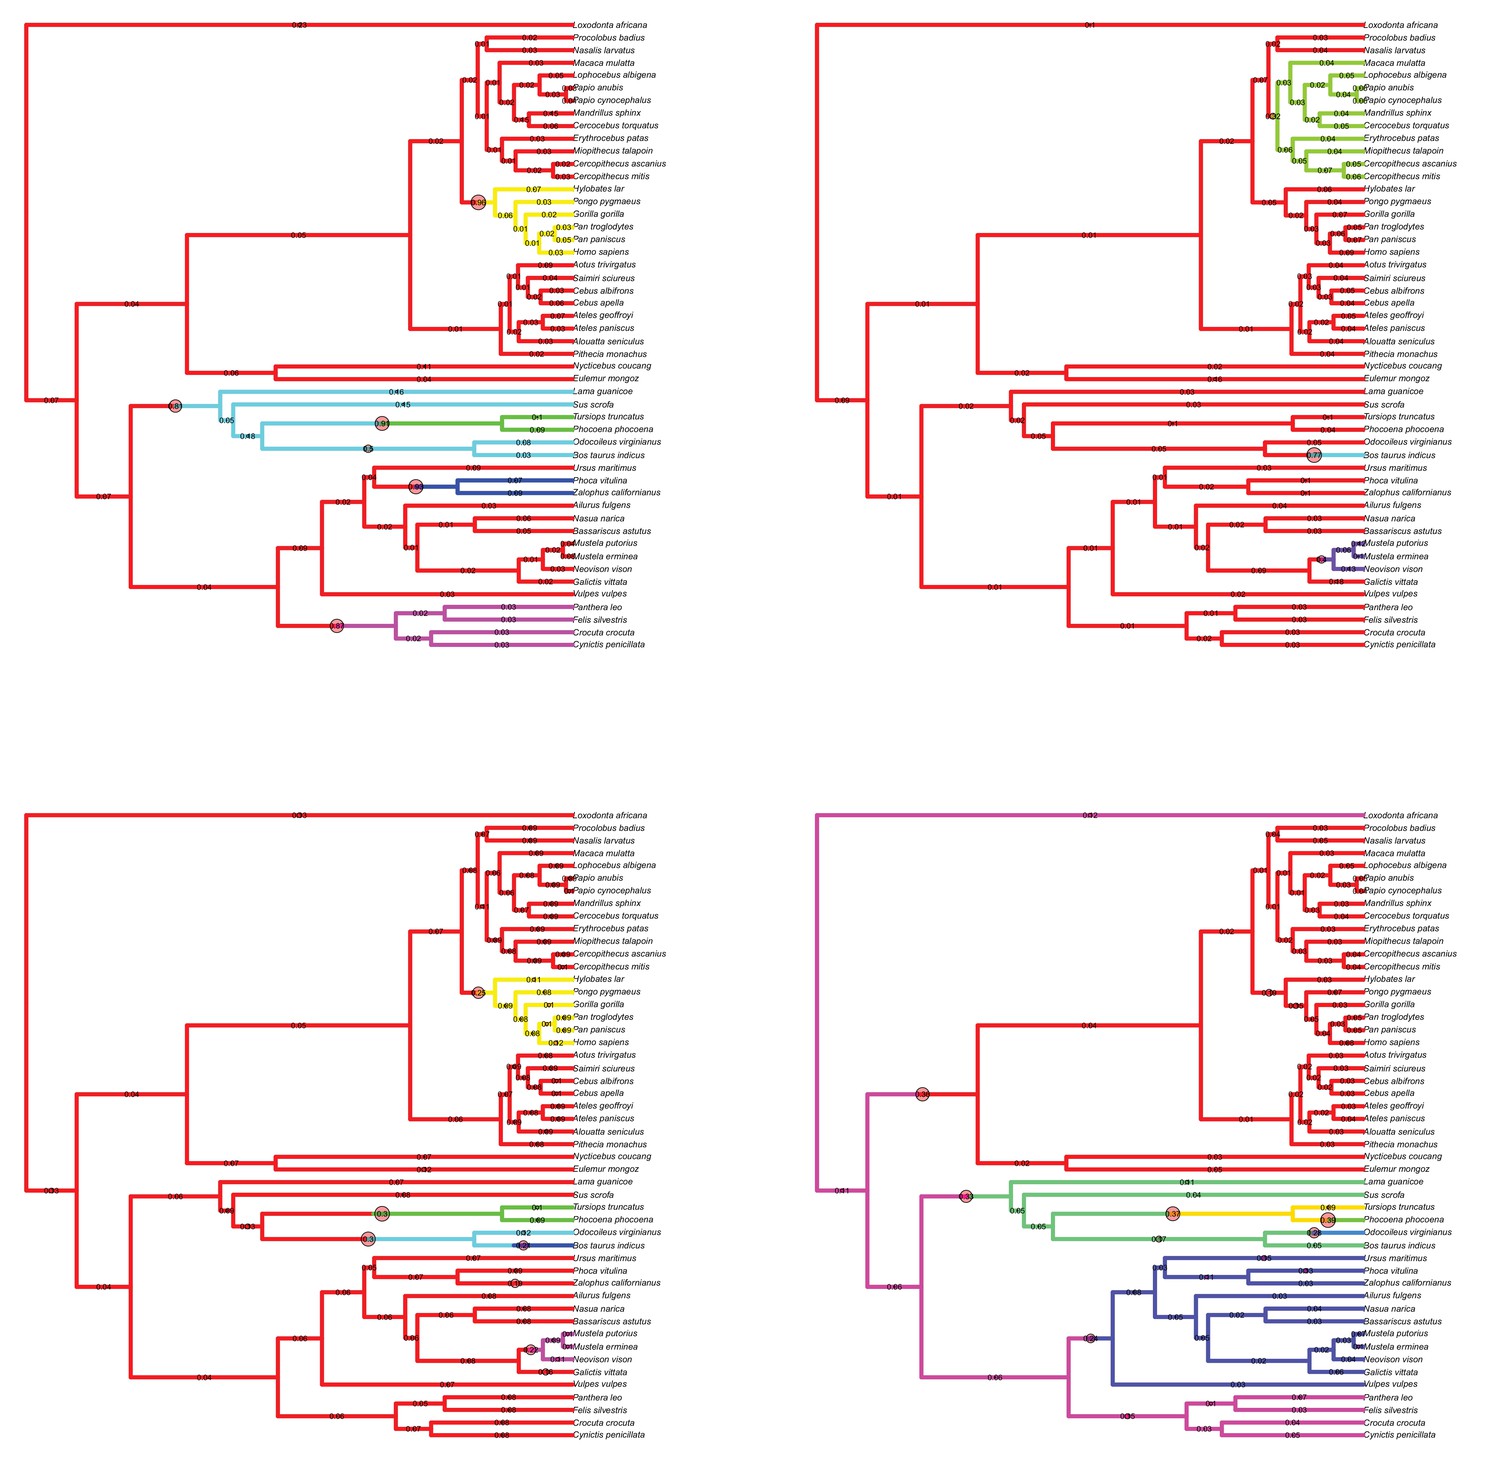
Figure 3—figure supplement 3
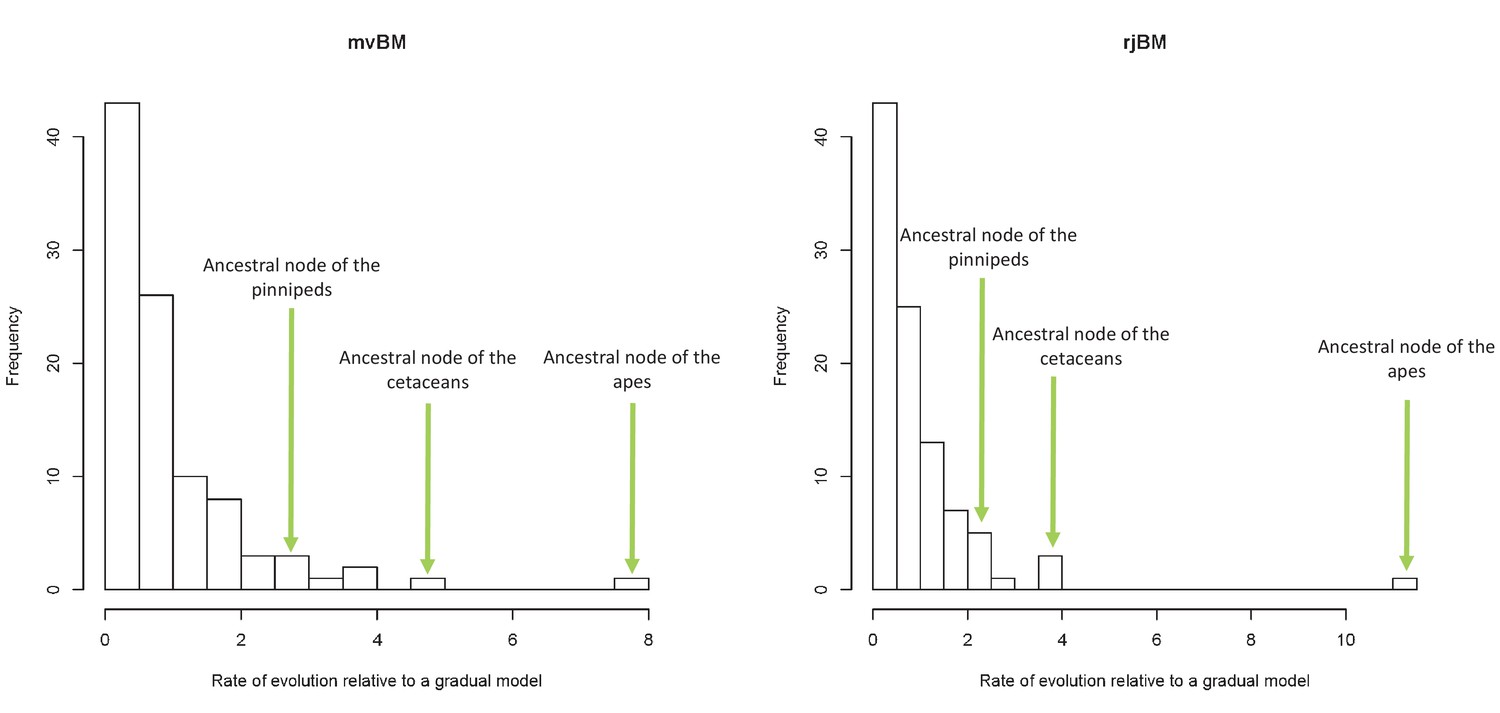
Lineage-specific rates of evolution relative to a gradual model using the mvBM and rjBM approaches.
https://doi.org/10.7554/eLife.35696.009
Figure 4
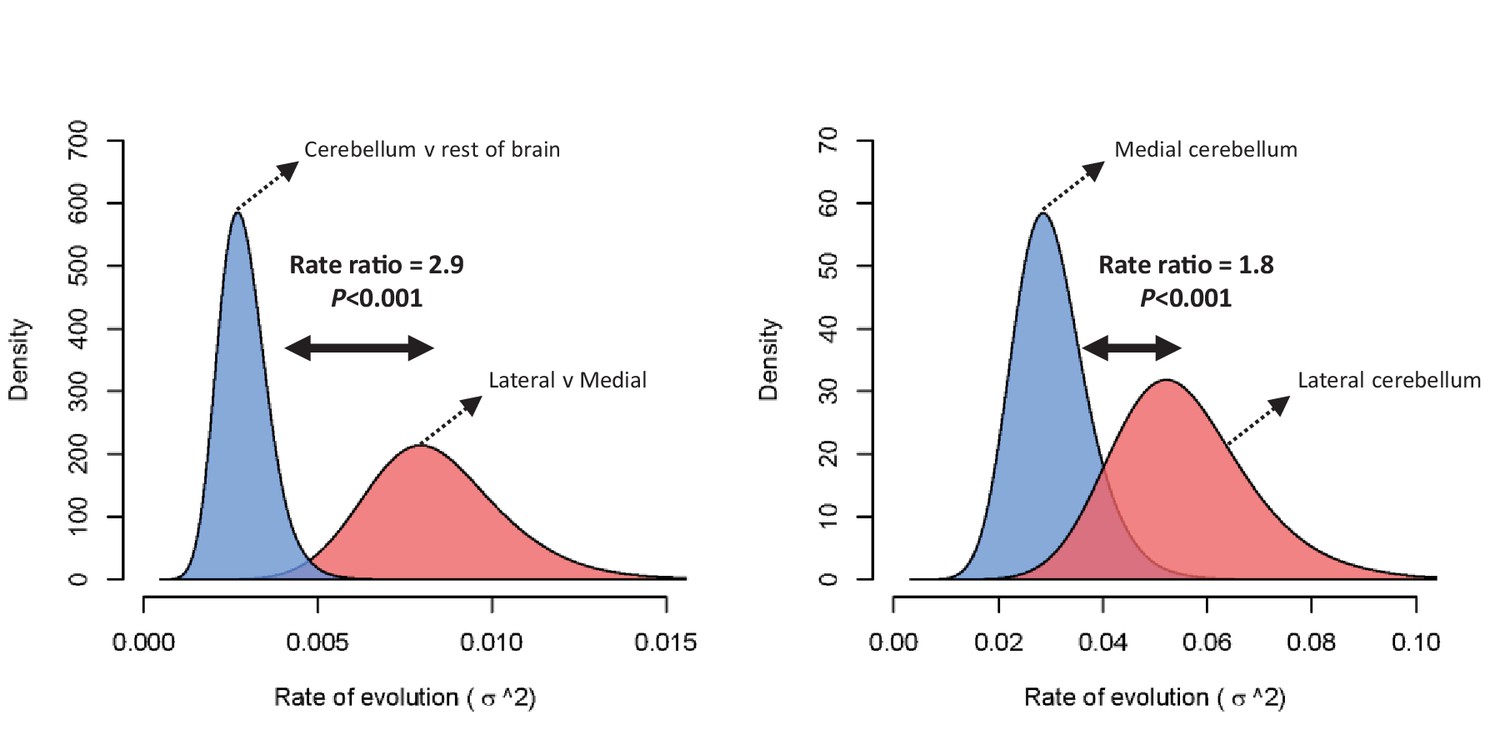
Rate of evolution (σ2) for relative cerebellum size and lateral-medial cerebellar reorganization (left panel), and medial and lateral cerebellar volume (right panel) as estimated by a standard Brownian motion model (Revell, 2012).
Rate ratios and P values are calculated using Q-mode rate analysis (Adams, 2014). Reversible-jump (Venditti et al., 2011) and multiple variance (Smaers et al., 2016) Brownian motion models yield equivalent results.
Tables
Table 1
Results from a phylogenetic analysis of covariance (Smaers and Rohlf, 2016).
Results relate to tests of differences in intercept among groups with the slope held constant. ‘Others’ refers to all species in the sample not included in the other allocated groups. The analysis includes the comparison of multiple treatment groups (group a ‘versus’ group b) to a control group (‘|’ group c). High, medium, low indicates which groups have the highest, medium, and lowest trait values.
| pANCOVA | |||||
|---|---|---|---|---|---|
| Group allocation | df | F | P | ||
| Convergence among regimes | |||||
| Apes versus toothed whales, pinnipeds | others | 1,46 | 0.810 | 0.373 | Ns | |
| Toothed whales versus apes, pinnipeds | others | 1,46 | 3.488 | 0.068 | Ns | |
| Pinnipeds versus apes, toothed whales | others | 1,46 | 0.195 | 0.661 | Ns | |
| Artiodactyls versus feliformes | others | 1,46 | 1.911 | 0.174 | Ns | |
| 3 grade model | |||||
| Apes, toothed whales, pinnipeds versus others versus artiodactyls, feliformes | 2,46 | 28.819 | <0.001 | *** | |
| Apes, toothed whales, pinnipeds versus others | artiodactyls, feliformes | 1,46 | 35.980 | <0.001 | *** | |
| Artiodactyls, feliformes versus others | apes, toothed whales, pinnipeds | 1,46 | 8.374 | 0.006 | ** | |
Additional files
-
Supplementary file 1
phylogenetic ancova procedures for relative cerebellum size, using the regimes as identified by Bayesian reversible-jump estimation of multi-optima OU models (SI1) as groups.
- https://doi.org/10.7554/eLife.35696.013
-
Transparent reporting form
- https://doi.org/10.7554/eLife.35696.014
Download links
A two-part list of links to download the article, or parts of the article, in various formats.
Downloads (link to download the article as PDF)
Open citations (links to open the citations from this article in various online reference manager services)
Cite this article (links to download the citations from this article in formats compatible with various reference manager tools)
A cerebellar substrate for cognition evolved multiple times independently in mammals
eLife 7:e35696.
https://doi.org/10.7554/eLife.35696


