Metazoan evolution of glutamate receptors reveals unreported phylogenetic groups and divergent lineage-specific events
- Biomedical Research Institute Sant Pau, Spain
- Universitat Autònoma de Barcelona, Spain
- Universitat de Barcelona, Spain
- University of Barcelona, Spain
- Biomedical Research Institute Sant Pau, Hospital de la Santa Creu i Sant Pau, Spain
- Sorbonne Université, CNRS, Biologie Intégrative des Organismes Marins, France
Figures
Figure 1 with 5 supplements
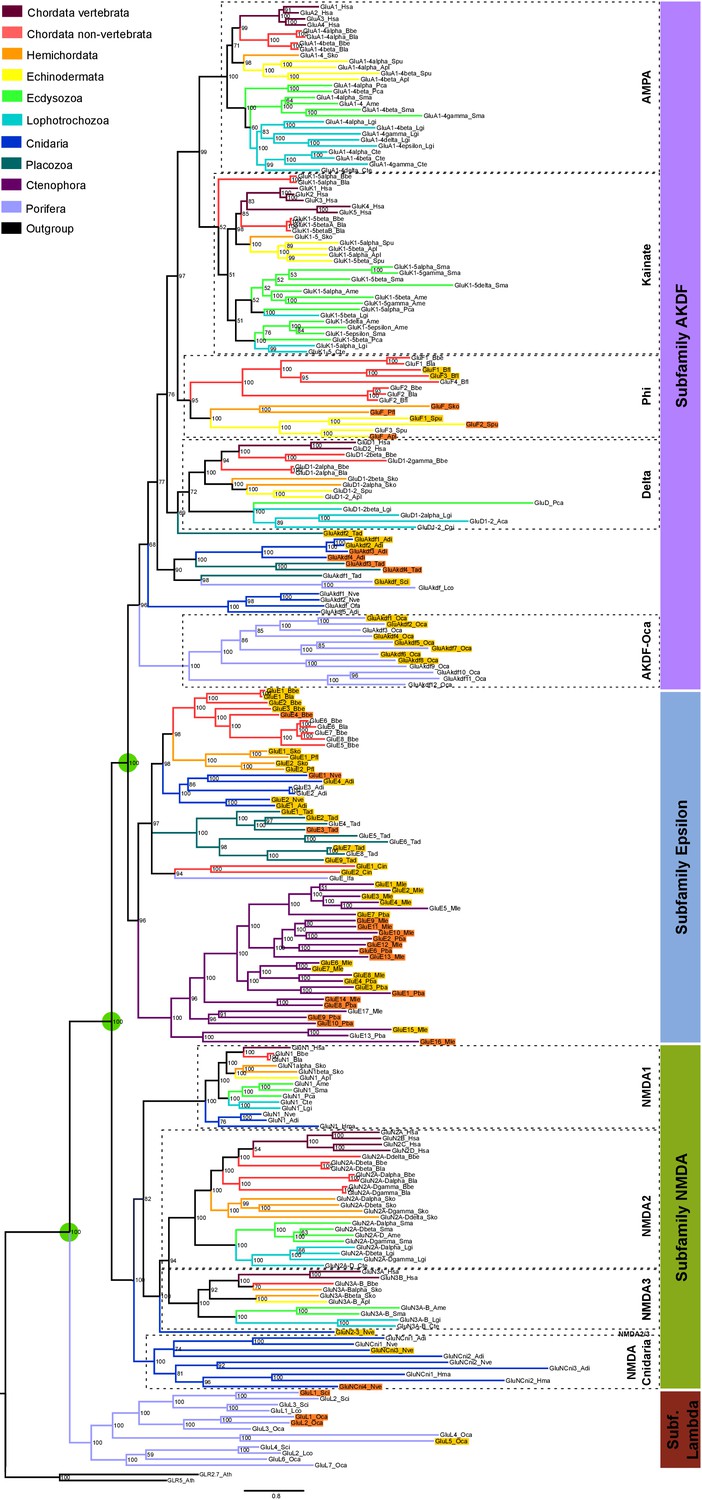
Bayesian phylogeny of metazoan ionotropic glutamate receptors.
Ionotropic glutamate receptor subfamilies are indicated in colored boxes at the right. Sequences belonging to the same class are highlighted together by dashed lines and the class name is also shown. Green circles highlight the three duplications occurred before the divergence of the ctenophore lineage that lead to these four subfamilies. Posterior probabilities are shown at tree nodes and protein names at the end of each branch. Tree branches are colored based on phylum, as indicated in the legend. For unreported phylogenetic groups, names of proteins predicted to bind glycine or glutamate are highlighted in yellow or orange, respectively. Protein names from non-vertebrate species are composed of four parts: (i) ‘GluR#’, where # is a code denoting class or subfamily (A, AMPA; K, Kainate; F, Phi; D, Delta; Akdf, AKDF; E, Epsilon; N, NMDA and L, Lambda); (ii) a number, or range of numbers, denoting orthologous vertebrate protein(s), if any; (iii) a Greek letter to identify non-vertebrate paralogs, if any and (iv) a three-letter species code. iGluRs from A. thaliana were used as an outgroup. All information on species and proteins used is given in Figure 1—source data 2. Phylogenetic reconstruction was performed using Bayesian inference. The amino acid substitution model used was Vt + G + F, number of generations: 14269000, final standard deviation: 0.007016 and potential scale reduction factor (PSRF): 1.000. Scale bar denotes number of amino acid substitutions per site. Although the GluAkdf2_Tad protein localizes to the Delta class in this tree, we do not consider this molecule as a confident member of this class. This is because the statistical support provided by the Bayesian analysis is low and because the Maximum-likelihood analysis (see Figure 1—figure supplement 1) does not position this protein in the Delta branch.
-
Figure 1—source data 1
Conservation of protein domains in ionotropic glutamate receptors from unreported groups.
- https://doi.org/10.7554/eLife.35774.009
-
Figure 1—source data 2
Reference table of species and proteins used in the phylogenetic analysis of iGluRs.
- https://doi.org/10.7554/eLife.35774.010
-
Figure 1—source data 3
Aligned protein sequences used to construct ionotropic glutamate receptor phylogenies.
- https://doi.org/10.7554/eLife.35774.011
-
Figure 1—source data 4
Table with MolProbity scores of 3D models.
- https://doi.org/10.7554/eLife.35774.012
Figure 1—figure supplement 1
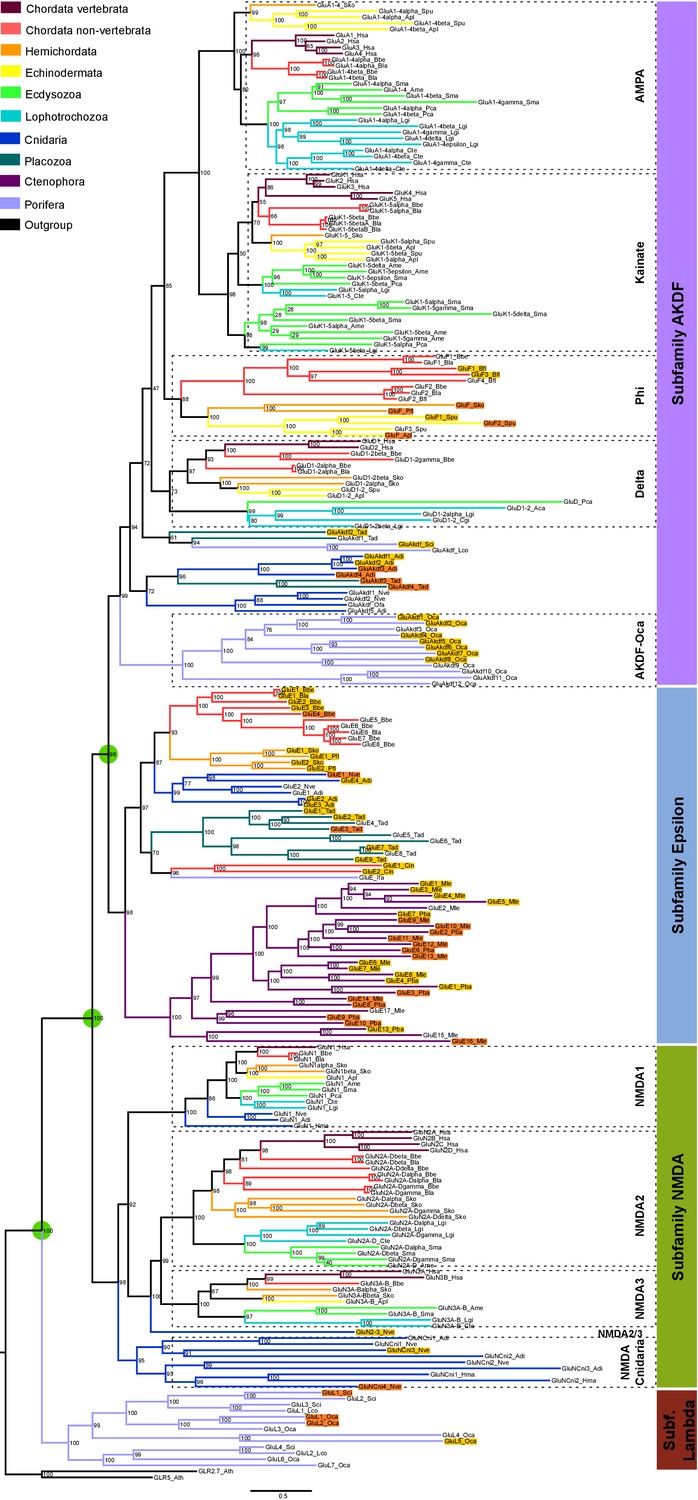
Maximum-likelihood phylogeny of metazoan ionotropic glutamate receptors.
Ionotropic glutamate receptor subfamilies are indicated in colored boxes at the right. Sequences belonging to the same class are grouped together by dashed lines and the class name is also shown. Green circles highlight the three duplications occurred before the divergence of the ctenophore lineage that lead to these four subfamilies. Bootstrap values are shown at tree nodes and protein names at the end of each branch. Tree branches are colored based on phylum, as indicated in the legend. For unreported phylogenetic groups, names of proteins predicted to bind glycine or glutamate are highlighted in yellow or orange, respectively. Protein names from non-vertebrate species are composed of four parts: (i) ‘GluR#’, where # is a code denoting class or subfamily (A, AMPA; K, Kainate; F, Phi; D, Delta; Akdf; AKDF; E, Epsilon; N, NMDA and L, Lambda); (ii) a number, or range of numbers, denoting orthologous vertebrate protein(s), if any; (iii) a Greek letter to identify non-vertebrate paralogs, if any and (iv) a three-letter species code. iGluRs from A. thaliana were used as an outgroup. All information on species and proteins used in this phylogeny is given in Figure 1—source data 2. Phylogenetic reconstruction was performed using Maximum-likelihood inference. The amino acid substitution model used was Vt + G + F. Branch support was obtained after 1000 iterations of ultrafast bootstrapping (Hoang et al., 2018). Scale bar denotes number of amino acid substitutions per site.
Figure 1—figure supplement 2
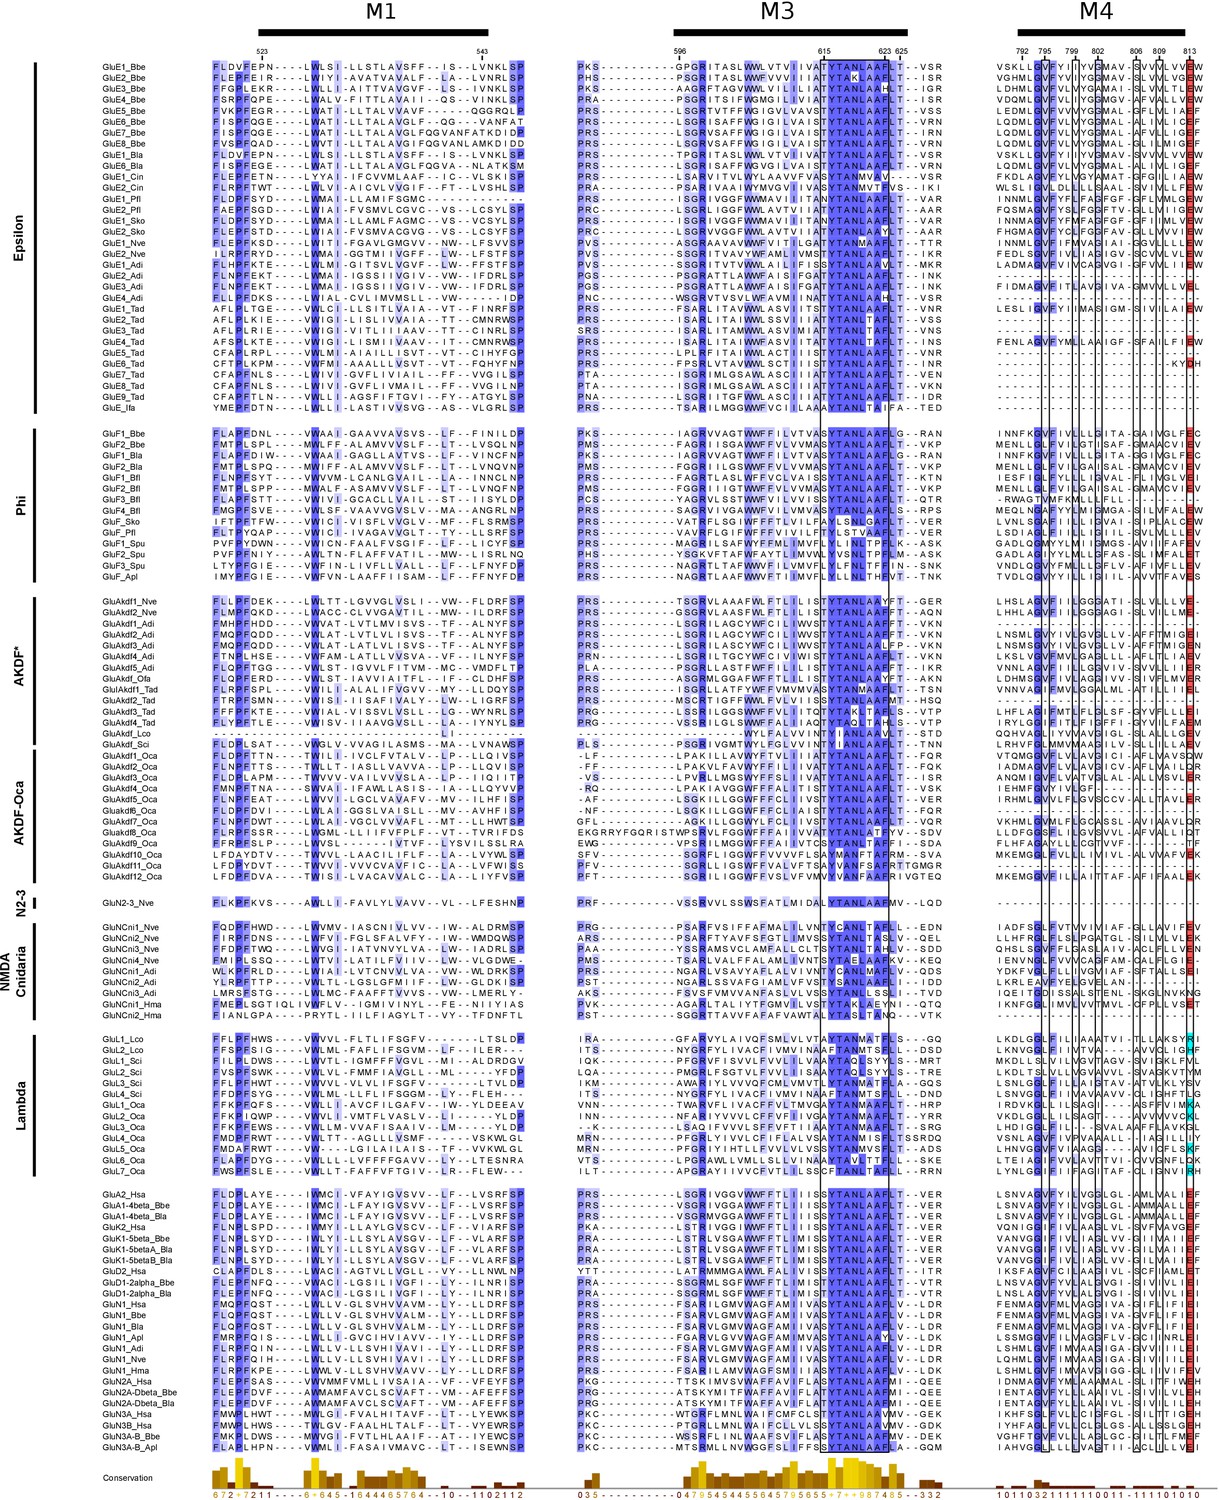
Multiple protein alignment of transmembrane regions M1, M3 and M4 from unreported iGluRs.
The alignment includes protein sequences from members of unreported phylogenetic groups, with the exception of Epsilon sequences from ctenophores, which have been described previously (Alberstein et al., 2015). It also includes representative sequences of AMPA, Kainate, Delta and NMDA1-3 classes. Phylogenetic subfamily or class name is indicated in the left. Unclassified non-bilateral proteins from porifers, placozoans and cnidarians from the AKDF subfamily are labeled as AKDF*. iGluR residues are shadowed as follows: red for acid residues and light blue and basic ones. The highly conserved ‘SYTANLAAF’ motif (at M3) and the M4 residues involved in tetramerization are highlighted by a black frame. Higher amino acid conservation is represented by increasing intensity of blue background and by a bar chart at the bottom. Residue numbers shown on top indicate the start and finish of each transmembrane helix. Protein numbering corresponds to mature rat GluA2 sequence. Figure was prepared with Jalview v2.10.4b1 (Waterhouse et al., 2009).
Figure 1—figure supplement 3
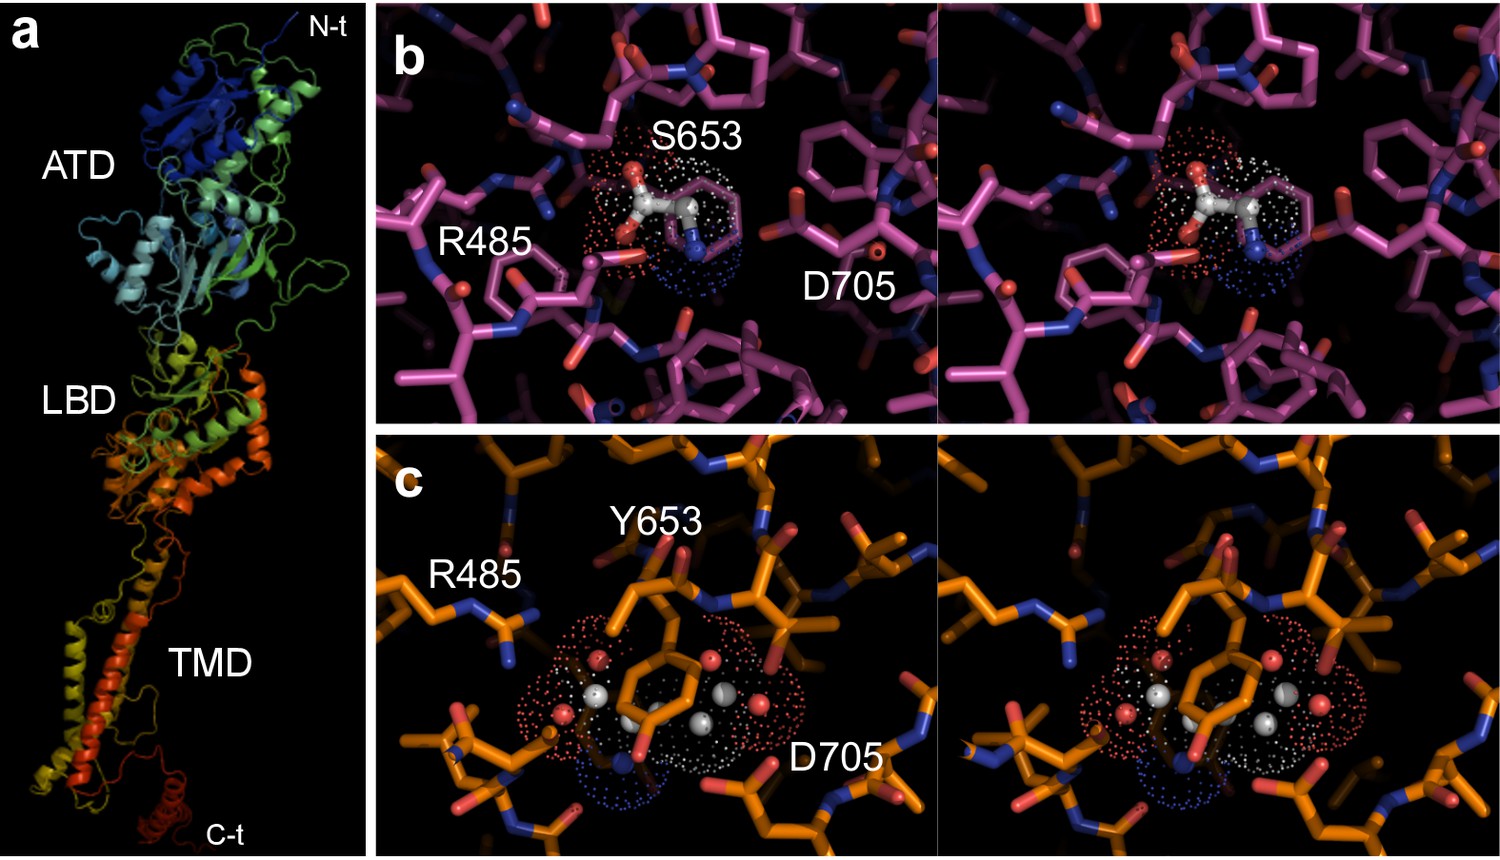
Three-dimensional models of Epsilon class members.
(a) Three-dimensional model of the full-length GluE1 from B. lanceolatum. Secondary structure elements are shown with rainbow color-coding from N- to C-terminus (β-strands, arrows; α-helices, coils). The major amino-terminal, ligand-binding and transmembrane domains (ATD, LBD and TMD, respectively) are indicated. (b, c) Stereo plots of ligand-binding pockets (LBP) in Epsilon family members from amphioxus. Close-ups of the ligand binding site in (b) GluE1 from B. lanceolatum and (c) GluE7 from B. belcheri. Residues are shown as sticks, color-coded (carbon, magenta or orange, respectively; oxygen, red; and nitrogen, blue). (b) Bound glycine is color coded with carbon atoms in white; its Van-der-Waals shell is represented by a dotted surface. Hydrogen bonds between bound glycine and Arg485 are indicated as white dotted lines. For simplicity, only a few residues have been labeled. Note that glycine is perfectly accommodated inside the GluE1 LBP. This is restricted by the side chains of Pro655 and Trp704 (these side chains would collide with a bound glutamate, explaining the preference for the less bulky glycine), but also by that of a serine at position 653. (c) A putatively bound glutamic acid has been modeled in the LBP of GluE7. This is shown by a dotted surface representing its Van-der-Waals shell and solid spheres for its carbon, nitrogen and oxygen atoms. Note that GluE7 presents a bulky tyrosine at position 653 instead of the serine found in GluE1. The side chain from Tyr653 would essentially occupy the ligand-binding pocket of GluE7, leaving no space for any ligand. These structural features are fully in line with the results of electrophysiological experiments.
Figure 1—figure supplement 4
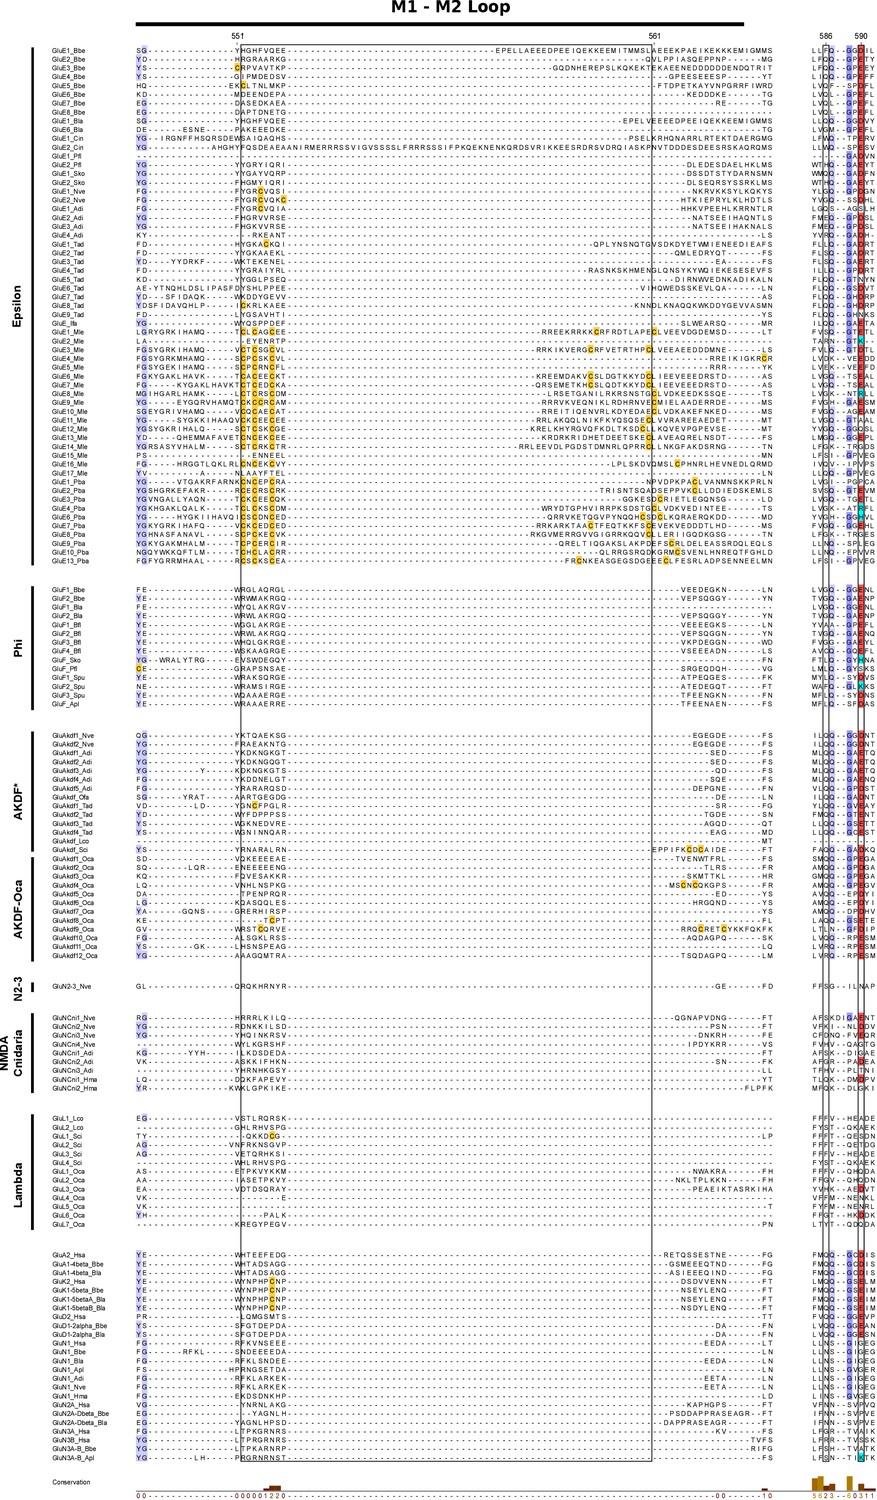
Multiple protein alignment of the M1-M2 intracellular loop and the Q/R and +4 sites.
The alignment includes all protein sequences from unreported phylogenetic groups and representative sequences of AMPA, Kainate, Delta and NMDA receptor subunits. Unclassified non-bilateral proteins from porifers, placozoans and cnidarians from the AKDF subfamily are labeled as AKDF*. iGluR residues are shadowed as follows: yellow for cysteines and red and light blue for acid and basic residues, respectively. The characteristic insertion in the M1-M2 intracellular loop presented by Epsilon subunits is highlighted by a black frame. The Q/R (Q586) and the Q/R +4 sites, involved in calcium permeability and polyamines block of some AMPA and Kainate receptors, are indicated by a black frame. Protein numbering corresponds to mature rat GluA2 sequence. Higher amino acid conservation is represented by increasing intensity of blue background and by a bar chart at the bottom. Figure was prepared with Jalview v2.10.4b1 (Waterhouse et al., 2009).
Figure 1—figure supplement 5
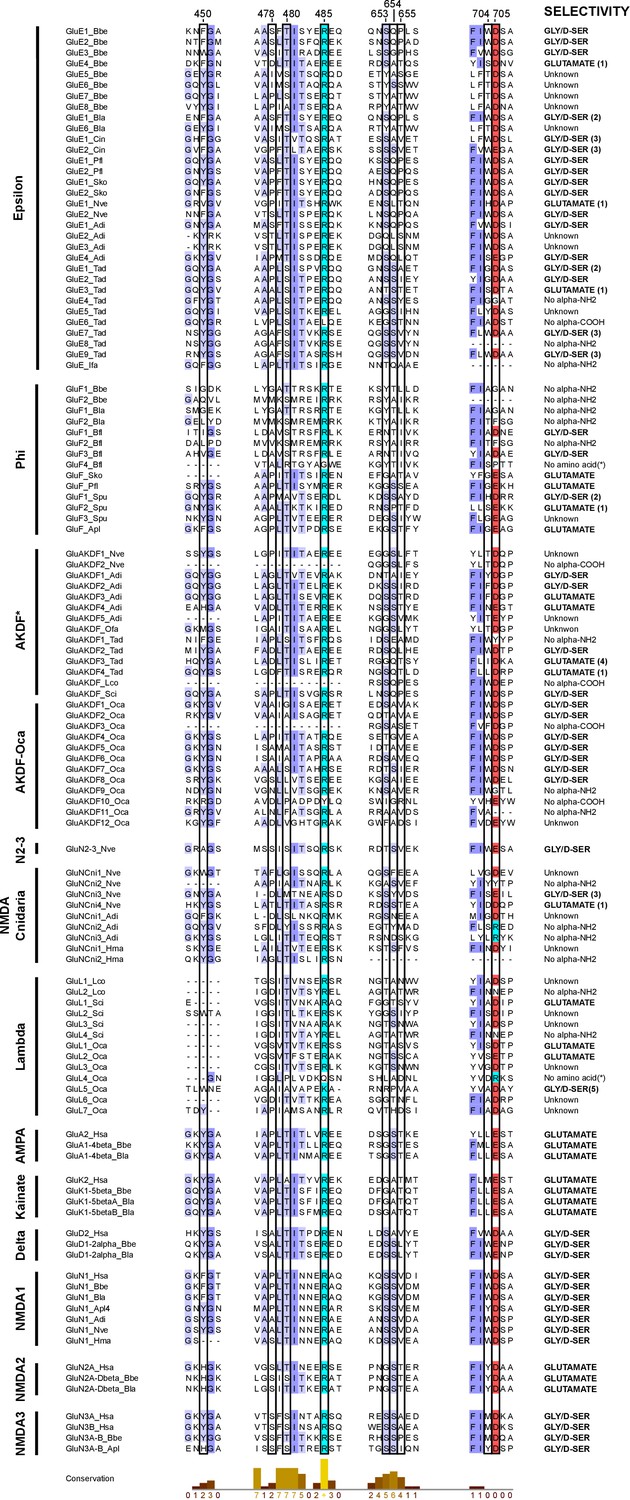
Multiple protein alignment of iGluR residues involved in ligand-binding.
Protein sequences shown belong to unreported phylogenetic groups (with the exception of Epsilons from ctenophores, which have been described previously [Alberstein et al., 2015]). Representative sequences for AMPA, Kainate, Delta and NMDA classes are also shown. Unclassified non-bilateral proteins from porifers, placozoans and cnidarians from the AKDF subfamily are labeled as AKDF*. Residue numbering is shown on top and corresponds to mature rat GluA2 sequence. Residues involved in agonist binding are highlighted by a black frame. Of these, residue 450 is involved in Van-der-Waals interactions with the α-carbon, residues 485 and 654 engage in electrostatic interactions with the α-carboxyl group, residues 478, 480 and 705 form interactions with the α-amino group and residues 653, 655 and 704 contact the amino acid side chain. iGluR residues are shadowed as follows: red for acid residues and light blue for basic ones. Higher amino acid conservation is represented by increasing intensity of blue background and by a bar chart at the bottom. Agonist selectivity is indicated at the right. Overall prediction is based on sequence similarity with vertebrate proteins, but in particular considers the following sequences: (Fonnum, 1984) similarity with the M. leidyi GluE13_Mle sequence (gene reference ML05909A), (Danbolt, 2001) similarity with H. sapiens GluN3A sequence, (Pascual-Anaya and D'Aniello, 2006) similarity with H. sapiens GluN1 sequence (Sobolevsky et al., 2009) similarity with AMPA receptor subunits sequence and (Conn and Pin, 1997) similarity with M. leidyi GluE7_Mle (gene reference ML032222a). Protein sequences with changes predicted to abolish binding to the α-amino (No α-NH2) or α-carboxyl (No α-COOH) group are also indicated. For some sequences a reliable prediction cannot be made, these are labeled as ‘Unknown’. Figure was prepared with Jalview v2.10.4b1 (Waterhouse et al., 2009).
Figure 2

Schematic representation of iGluRs metazoan evolution.
(a) Summary tree showing the evolution of iGluR subfamilies and classes in the metazoan lineages investigated. Each branch corresponds with one lineage. Phylogenetic subfamilies are represented by yellow boxes and classes by blue boxes. The four subfamilies present in the ancestor of all current metazoan lineages are shown at the base of the tree. Duplications of subfamilies in ancestors of current lineages are indicated. When a class or subfamily is lost in a lineage or in an ancestor, the corresponding box is crossed out with a red cross. Mollusca and annelida are lophotrochozoans and priapulida and arthropoda ecdysozoans. In priapulida NMDA2s and NMDA3s were not investigated. (b) Table indicating the presence or absence of iGluR subfamilies and classes in the metazoan lineages investigated. When a phylogenetic group is present in a lineage it is indicated by a green tick and if it is absent by a red cross. The last column shows the total number of groups found in each phylum. The last row shows the number of phyla where each phylogenetic group is present.
Image credit: Placozoa, author Oliver Voigt, licensed under CC BY-SA 3.0 Germany license; source https://commons.wikimedia.org/wiki/File:Trichoplax_mic.jpg; P caudatus, author Shunkina Ksenia, licensed under CC BY 3.0 source https://commons.wikimedia.org/wiki/File:Priapulus_caudatus.jpg; Hemichordata, released under GNU Free Documentation License, source https://commons.wikimedia.org/wiki/File:Eichelwurm.jpg; Cephalochordata, author Hans Hillewaert, licensed CC BY-SA 4.0 International license, source https://commons.wikimedia.org/wiki/File:Branchiostoma_lanceolatum.jpg.
Figure 3 with 1 supplement
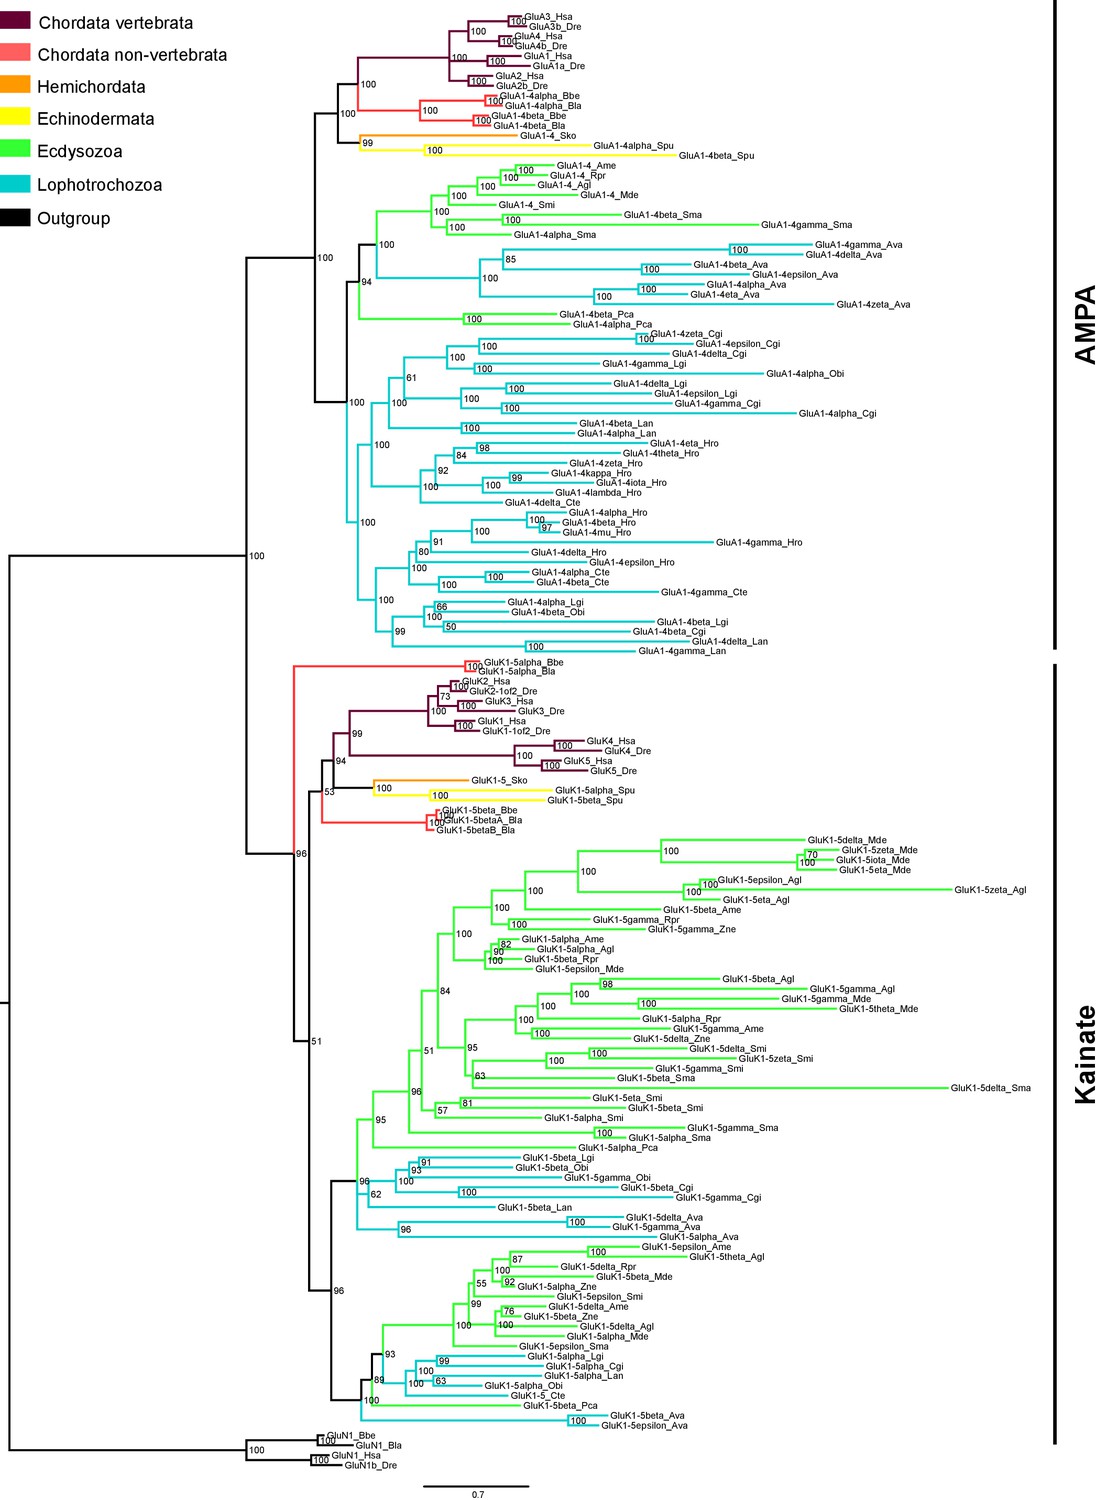
Bayesian phylogeny of AMPA and Kainate classes in protostomes.
Ionotropic glutamate receptors classes are indicated at the right. Posterior probabilities are shown at tree nodes and protein names at the end of each branch. Tree branches are colored based on phylum, as indicated in the legend. Protein names from non-vertebrate species are composed of four parts: (i) ‘GluR#’, where # is a one letter code denoting class (A for AMPA and K for Kainate); (ii) a number, or range of numbers, denoting orthologous vertebrate protein(s), if any; (iii) a Greek letter to identify non-vertebrate paralogues, if any and (iv) a three-letter species code. GluN1s from chordates were used as an outgroup. All information on species and proteins used in this phylogeny is given in Figure 3—source data 2. Phylogenetic reconstruction was performed using Bayesian inference. The amino acid substitution model used was Vt + I + G, number of generations: 8868000, final standard deviation: 0.0072 and potential scale reduction factor (PSRF): 1.001. Scale bar denotes number of amino acid substitutions per site.
-
Figure 3—source data 1
Aligned protein sequences used to construct AMPA and Kainate class phylogenies in protostomes.
- https://doi.org/10.7554/eLife.35774.016
-
Figure 3—source data 2
Reference table of species and proteins used in the phylogenetic analysis of AMPA and Kainate classes in protostomes.
- https://doi.org/10.7554/eLife.35774.017
Figure 3—figure supplement 1
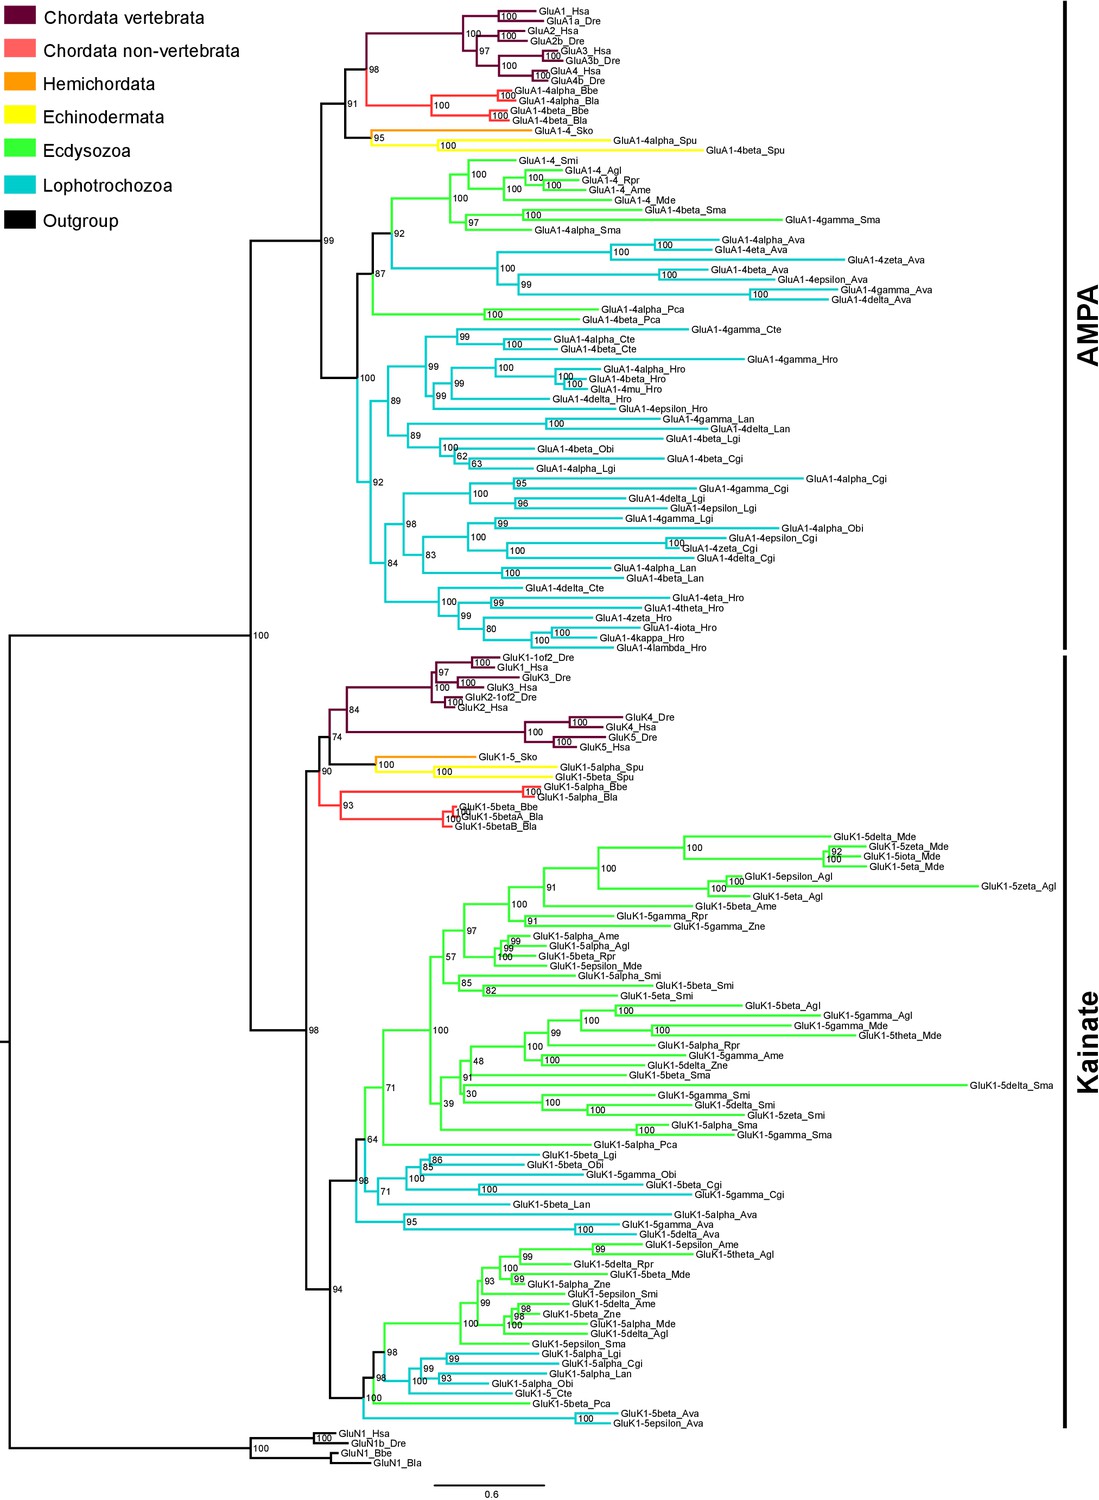
Maximum-likelihood phylogeny of AMPA and Kainate classes in protostomes.
Ionotropic glutamate receptors classes are indicated at the right. Bootstrap values are shown at tree nodes and protein names at the end of each branch. Tree branches are colored based on phylum, as indicated in the legend. Protein names from non-vertebrate species are composed of four parts: (i) ‘GluR#’, where # is a one letter code denoting class (A for AMPA and K for Kainate); (ii) a number, or range of numbers, denoting orthologous vertebrate proteins(s), if any; (iii) a Greek letter to identify non-vertebrate paralogues, if any and (iv) a three-letter species code. GluN1s from chordates were used as outgroup. All information on species and proteins used in this phylogeny is given in Figure 3—source data 2. Phylogenetic reconstruction was performed using Maximum-likelihood inference. Amino acid substitution model: Vt + I + G. Branch support was obtained after 1000 iterations of ultrafast bootstrapping (Hoang et al., 2018). Scale bar denotes number of amino acid substitutions per site.
Figure 4 with 2 supplements
Expression and functional analysis of amphioxus iGluRs.
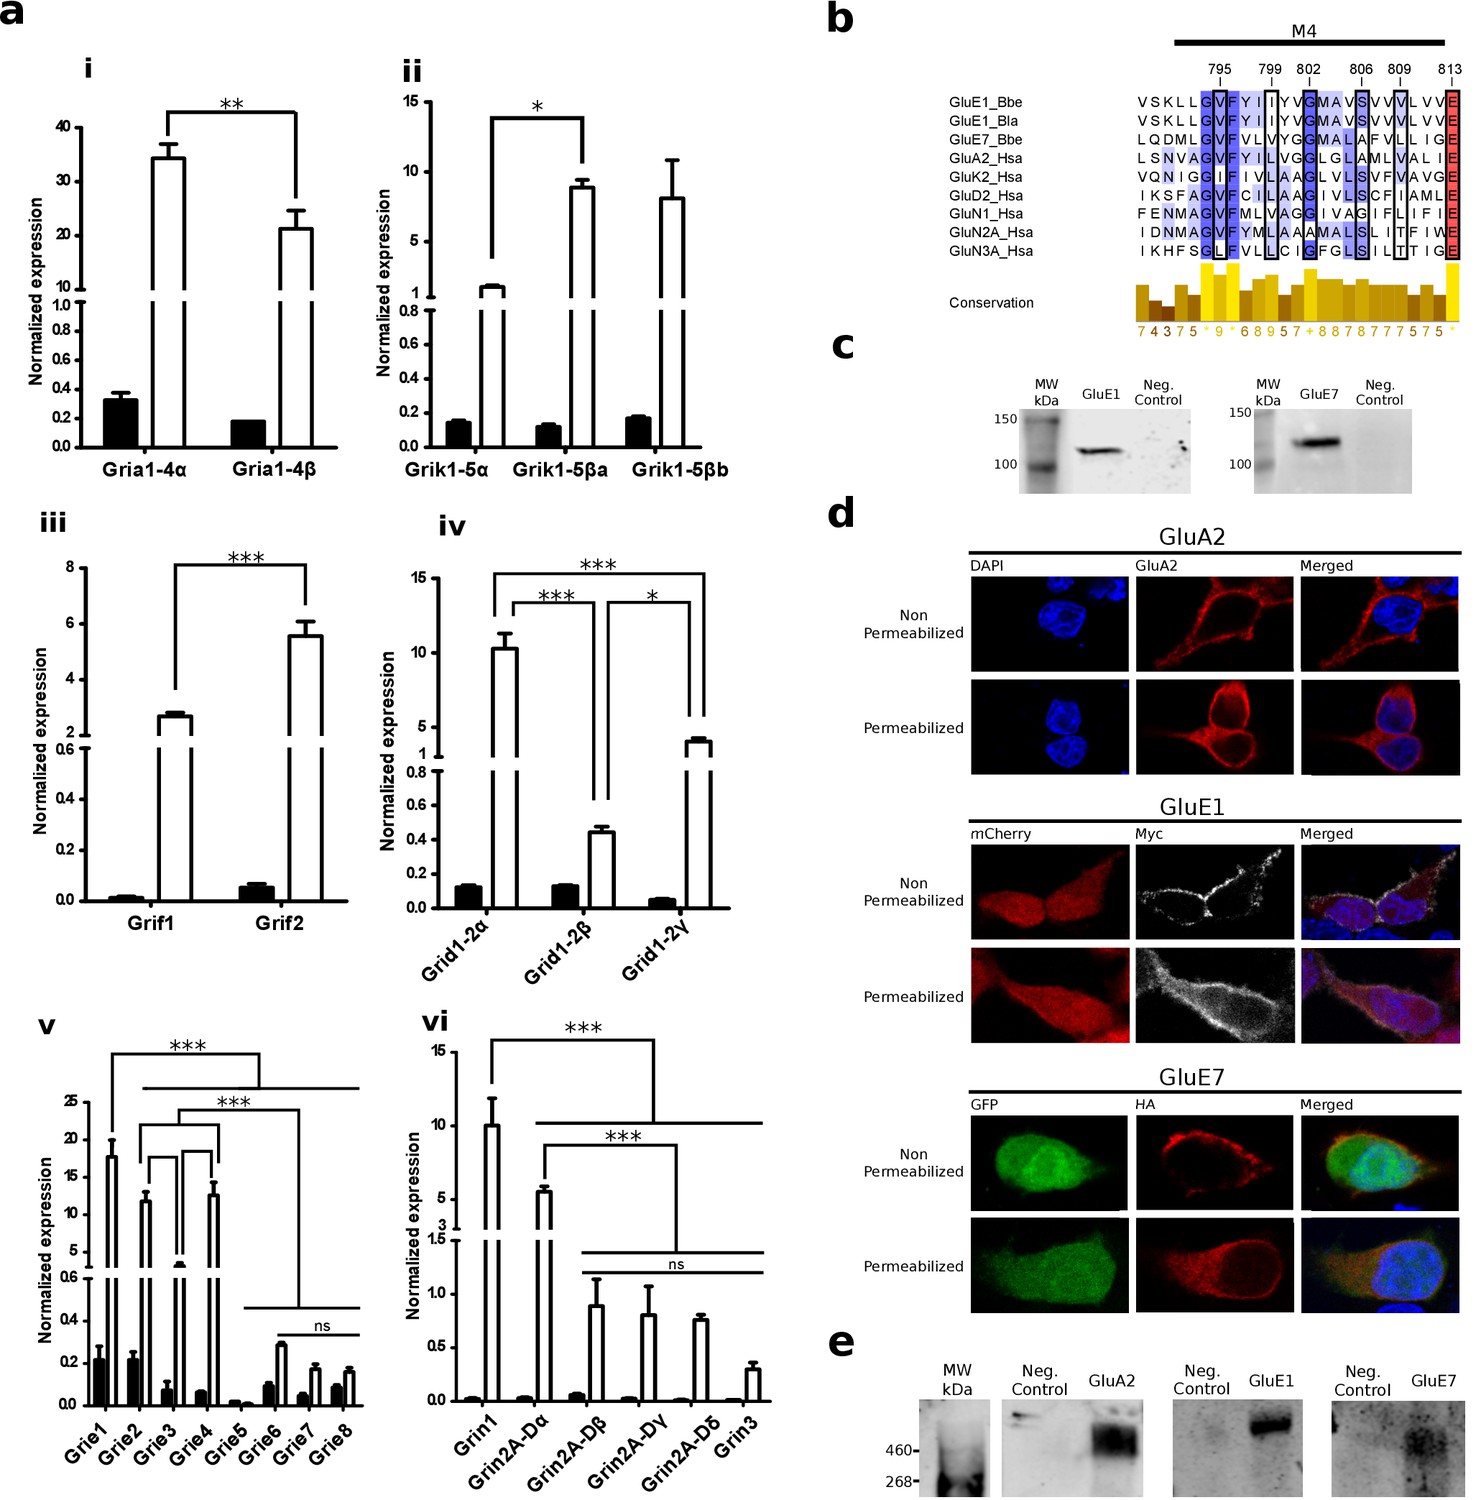
(a) iGluRs mRNA expression (mean and standard deviation) in Branchiostoma lanceolatum. Bars show average relative expression of B. lanceolatum (amphioxus) iGluR genes as determined by qPCR. Filled bars represent whole body and open bars nerve cord expression levels. Note that all genes show significantly enriched expression in the nerve chord relative to the whole body, with the exception of Grie5 (Student’s t-test, n = 3). Expression level in the nerve chord is compared across genes of the same class. Statistics: pair comparisons were done by Student’s t-test, n = 3, multiple comparisons were done by one-way ANOVA followed by Tukey’s Post-Hoc test, n = 3. Significance levels: ***p < 0.001, **p < 0.01 and *p < 0.05; ns, not significant. (i) AMPA class. (ii) Kainate class. (iii) Phi class. (iv) Delta class. (v) Epsilon subfamily. (vi) NMDA classes. (b) Multiple sequence alignment of iGluRs transmembrane region M4 containing residues involved in tetramerization, these are indicated by a black frame. Higher amino acid conservation is represented by increasing intensity of blue background and by a bar chart at the bottom. Sequences included are GluE1 and GluE7 from amphioxus and representatives of human iGluRs. (c) Immunoblot of chimeric GluE1 and GluE7, containing the signal peptide from rat GluA2, expressed in HEK293T cells. Proteins were detected using the immuno-tags (c-Myc and HA, respectively) located after the rat signal peptide. Protein extracts from non-transfected cells were loaded as negative controls. (d) Immunofluorescence of HEK293T cells expressing rat GluA2 (top), cMyc-tagged GluE1 (middle) or HA-tagged GluE7 (bottom). Both non-permeabilized and permeabilized conditions are shown. (e) Immunoblot of tetrameric rat GluA2, GluE1 and GluE7 expressed in HEK293T cells. Amphioxus proteins were detected using the immuno-tags (c-Myc and HA, respectively) located at the N-terminus of each sequence. Protein extracts from non-transfected cells were loaded as negative controls.
-
Figure 4—source data 1
qPCR values used to generate Figure 4a.
- https://doi.org/10.7554/eLife.35774.021
Figure 4—figure supplement 1
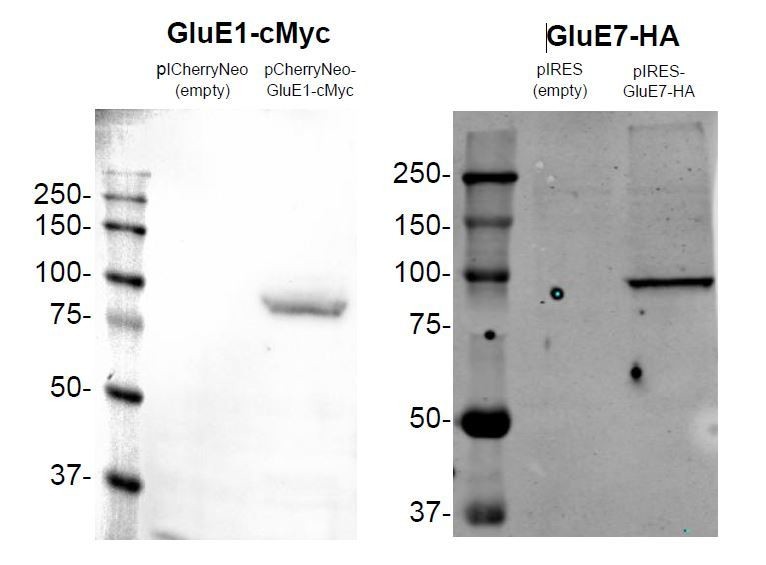
Wild-type GluE1 and GluE7 expression in HEK293T cells and genetic strategy used to add a signal peptide.
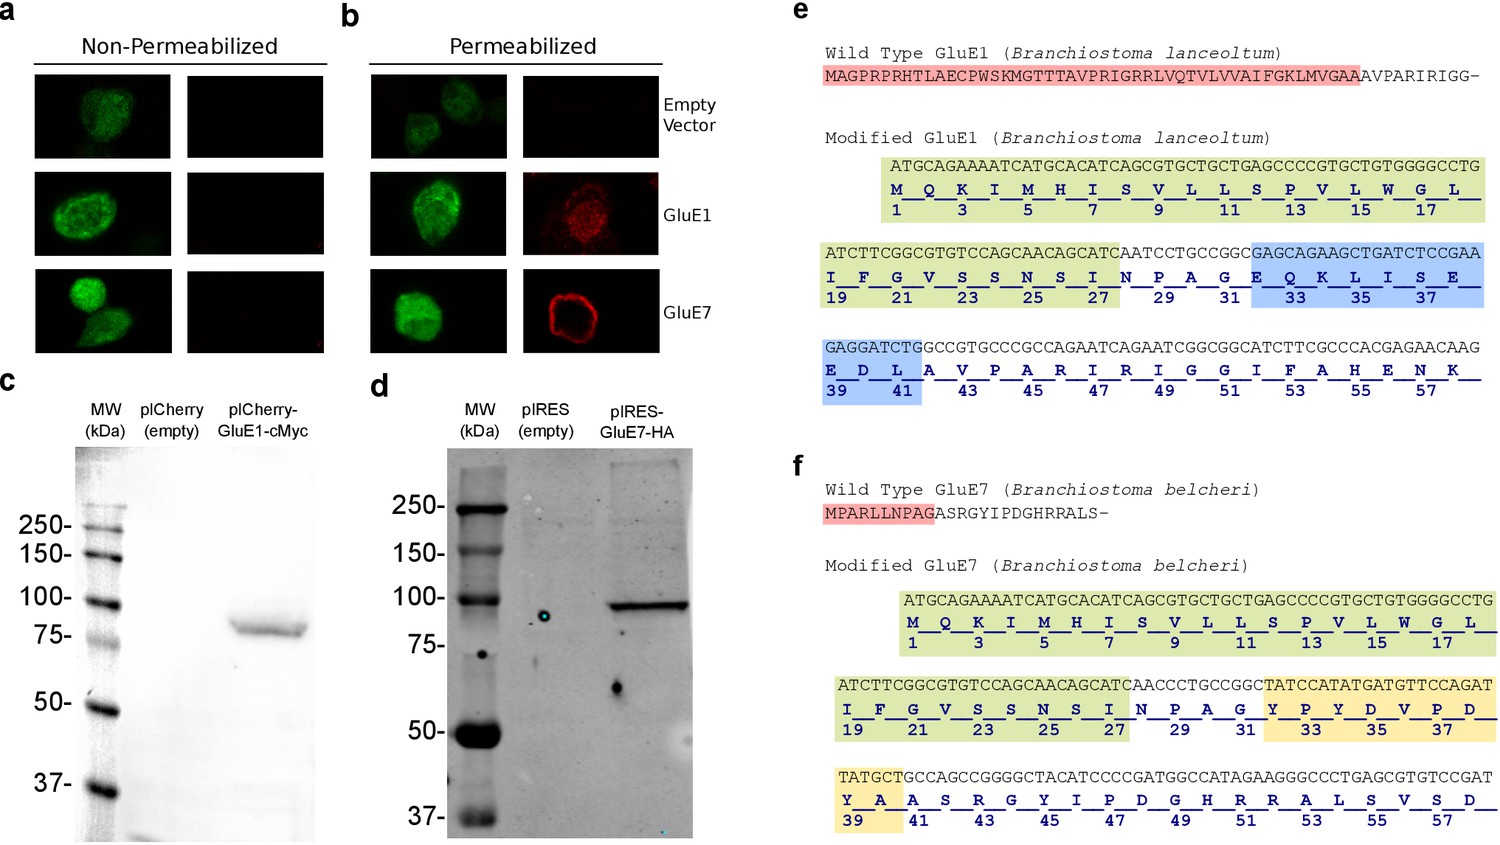
(a) Immunofluorescence of non-permeabilized HEK293T cells transfected with an empty pIRES vector, which expresses EGFP (top), or a pIRES vector with the sequence from cMyc-tagged GluE1 (middle) or HA-tagged GluE7 (bottom). Left images show EGFP signal and right images show fluorescence corresponding to cMyc and HA. The lack of cMyc and Ha signal in non-permeabilized cells indicates that the protein is not trafficked to the plasma membrane. (b) Immunofluorescence of permeabilized HEK293T cells transfected with an empty pIRES vector, which expresses EGFP (top), or a pIRES vector with the sequence from cMyc-tagged GluE1 (middle) or HA-tagged GluE7 (bottom). Left images show EGFP signal and right images show fluorescence corresponding to cMyc and HA. (c) Immunoblot of a total extract of HEK293T cells expressing the wild-type form (without the signal peptide from rat GluA2) of the GluE1 protein during 48 hr. Extracts from transfected cells with an empty vector are used as negative controls. (d) Immunoblot of a total extract of HEK293T cells expressing during 48 hr the wild-type form of the GluE7 protein (without the signal peptide from rat GluA2). Extracts from transfected cells with an empty vector are used as negative control. (e) Above, N-terminal wild-type protein sequence of GluE1 from B. lanceolatum. Red shading indicates the sequence replaced by the rat GluA2 signal peptide and the c-Myc-tag. Below, modified sequence used for gene synthesis. The new sequence included the rat GluA2 signal peptide (in green) and the c-Myc-tag (in blue). A four residues spacer was inserted between them. (f) Above, N-terminal wild-type protein sequence of GluE7 from B. belcheri. Red shading indicates the sequence replaced by the rat GluA2 signal peptide and HA-tag. Below, modified sequence used for gene synthesis. The new sequence included the rat GluA2 signal peptide (in green) and the hemagglutinin tag (in yellow). A four residues spacer was inserted between them.
Figure 4—figure supplement 2
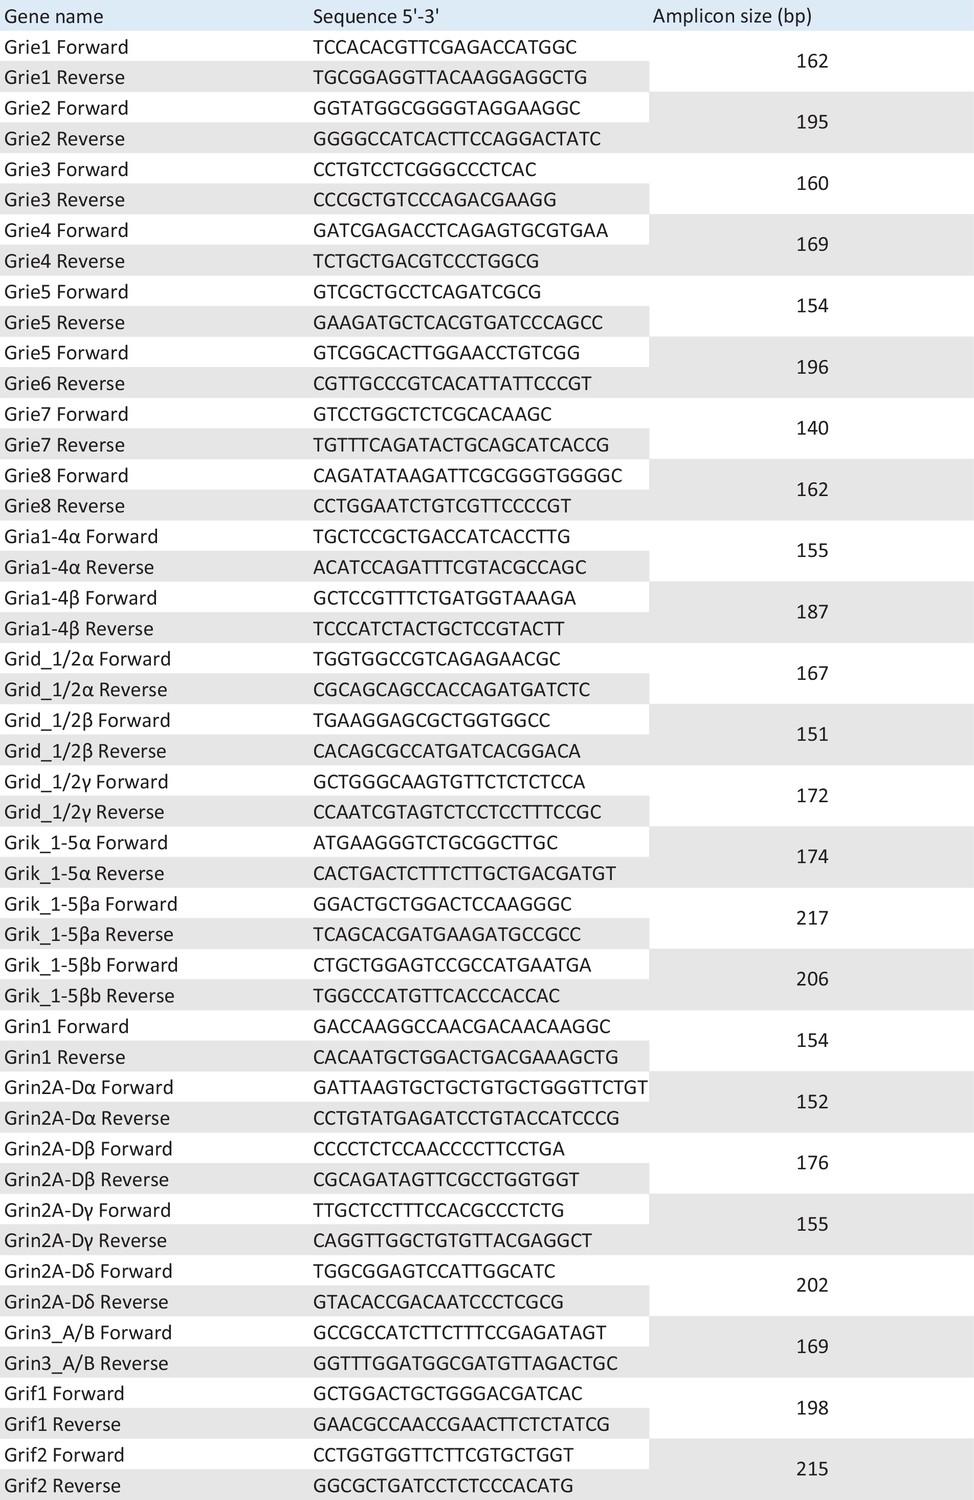
List of primers used in qPCR experiments.
Primer sequences are included.
Figure 5

Glycine activates an amphioxus homomeric Epsilon receptor.
(a) Representative homomeric GluE1 (from B. lanceolatum) whole-cell currents evoked by a rapid pulse (500 ms) of different amino acids (10 mM) in HEK293T cells. Left and right glycine-mediated currents denote agonist application before and after alanine, D-serine and glutamate applications respectively for ruling out run-down of the currents. (b) Representative GluE1 responses to 10 mM glycine at different membrane voltages (from −80 to +80 mV in 20 mV steps). Note that a strong inward rectification can be observed even in the absence of added polyamines in the intracellular solution. Inset: currents at negative membrane voltages are shown. (c) Current-voltage relationship for peak currents evoked by glycine (500 ms, 10 mM) applied to whole HEK293T cells containing homomeric GluE1 subunits normalized for the current at −80 mV (n = 3) fitted to a 5th order polynomial function. Error bars represent SEM. (d) Homomeric GluE1 glycine-mediated currents recorded at different time intervals by using a paired pulse protocol. (e) Rate of recovery of desensitization fitted to a single exponential of time constant 10.8 s (n = 3–5). Plot shows the average ratio values (P2/P1) and SEM (error bars).
Figure 6 with 4 supplements
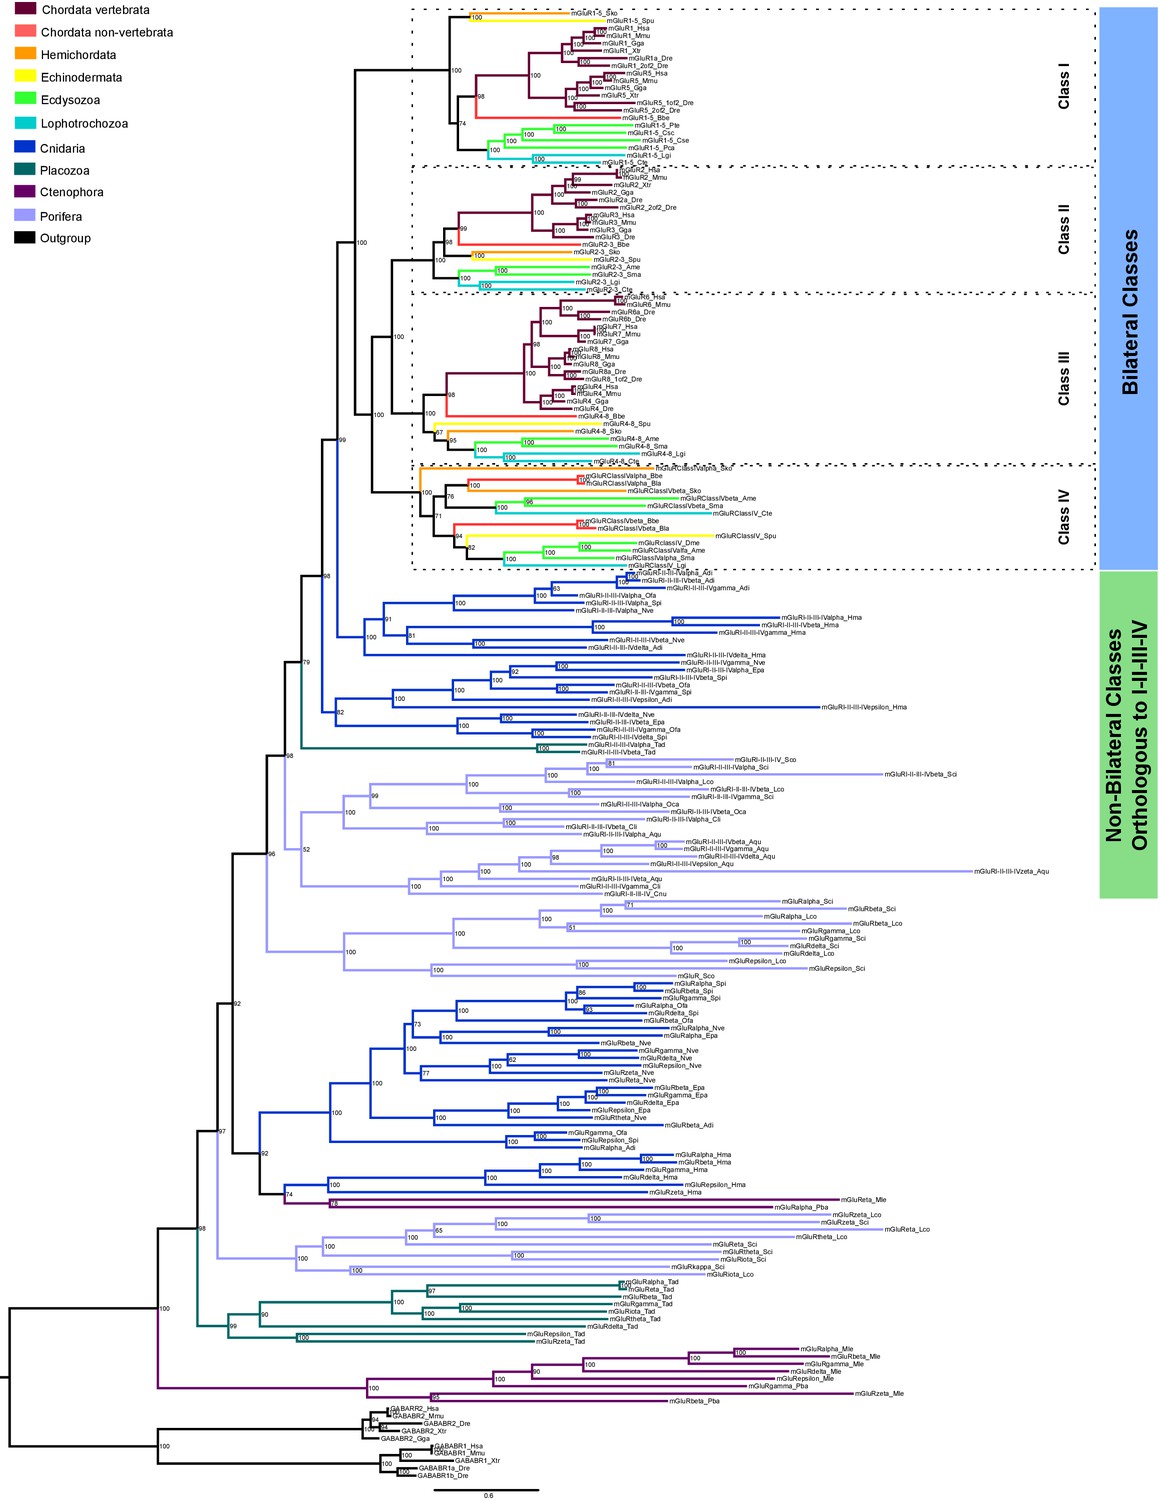
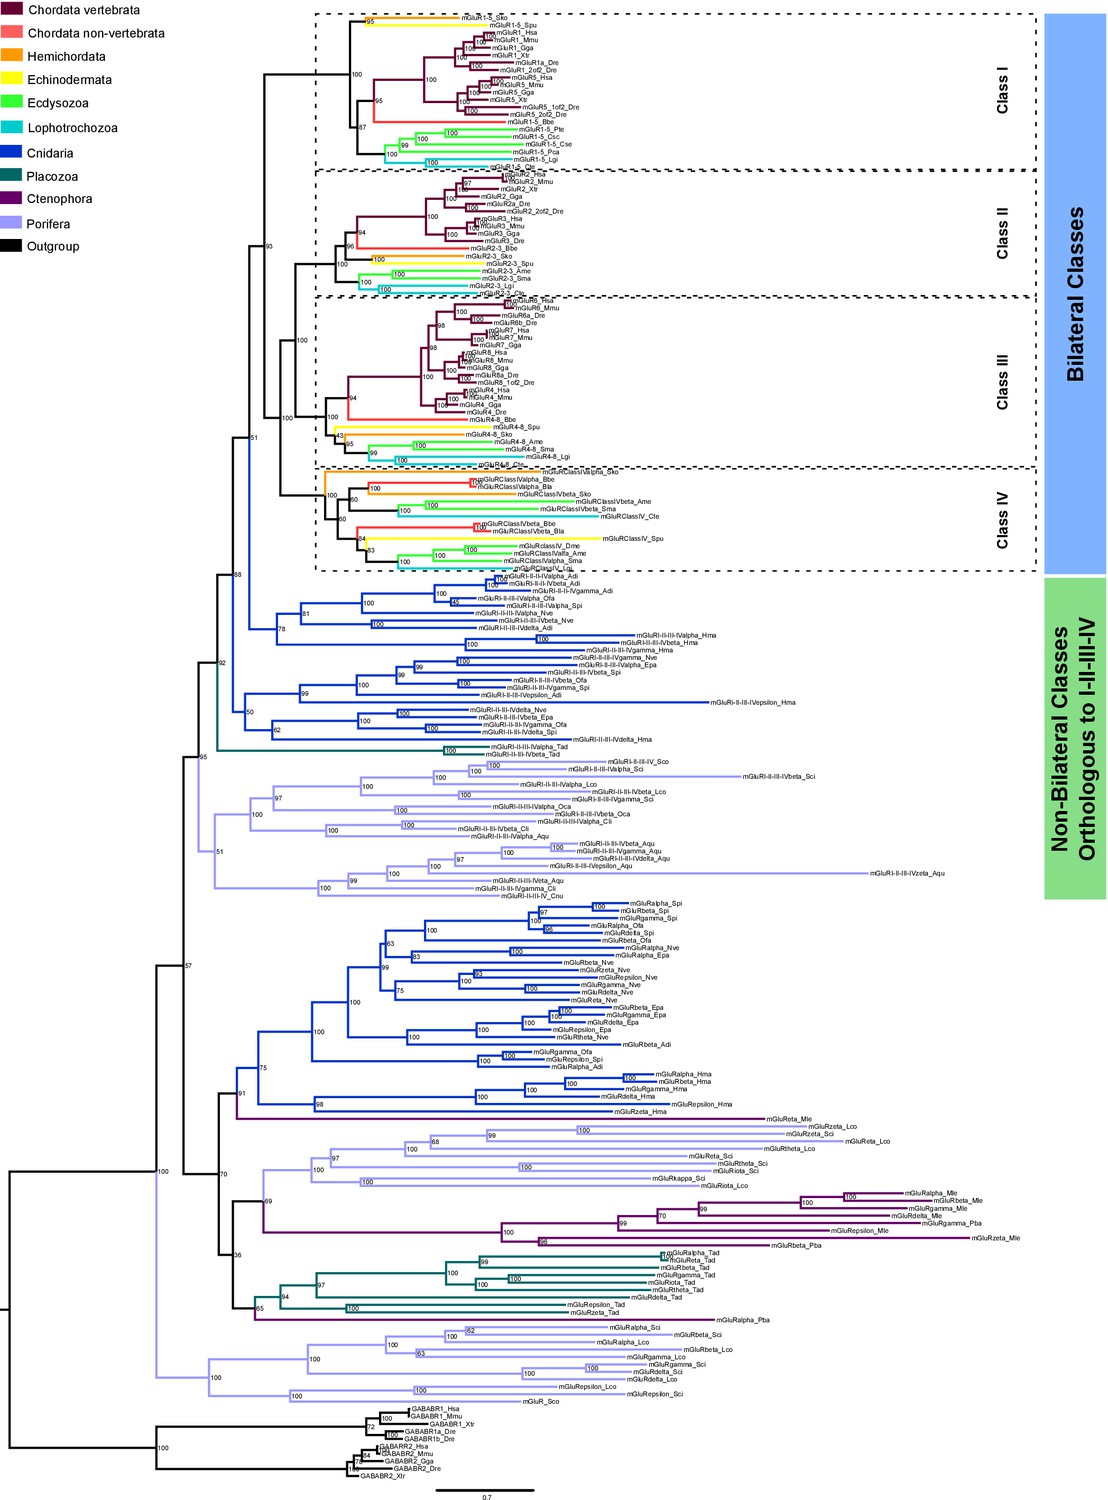
Bayesian phylogeny of metazoan metabotropic glutamate receptors.
Identified metabotropic glutamate receptor classes from bilateral and non-bilateral organisms are indicated by colored boxes at the right. Dashed boxes further highlight individual classes from bilateral organism. Posterior probabilities are shown at tree nodes and protein names at the end of each branch. Tree branches are colored based on phylum, as indicated in the legend. Protein names from non-vertebrate species are composed of four parts: (i) ‘mGluR’, followed by a number, or range of numbers, denoting orthologous vertebrate protein(s), if any (for Class IV and group I-II-III-IV proteins, the name is followed by the name of the class/group); (ii) a Greek letter to identify non-vertebrate paralogs, if any and (iv) a three-letter species code. GABA-B receptors from vertebrates were used as an outgroup. All information on species and proteins used in this phylogeny is given in Figure 6—source data 2. Phylogenetic reconstruction was performed using Bayesian inference. The amino acid substitution model used was WAG + I + G + F, number of generations: 5327000, final standard deviation: 0.004788 and potential scale reduction factor (PSRF): 1.001. Scale bar denotes number of amino acid substitutions per site.
-
Figure 6—source data 1
Conservation of protein domains in metabotropic glutamate receptors from unreported classes.
- https://doi.org/10.7554/eLife.35774.028
-
Figure 6—source data 2
Reference table of species and proteins used in the phylogenetic analysis of mGluRs.
- https://doi.org/10.7554/eLife.35774.029
-
Figure 6—source data 3
Aligned protein sequences used to construct metabotropic glutamate receptor phylogenies.
- https://doi.org/10.7554/eLife.35774.030
-
Figure 6—source data 4
qPCR values used to generate Figure 6—figure supplement 2b.
- https://doi.org/10.7554/eLife.35774.031
Figure 6—figure supplement 1
Maximum-likelihood phylogeny of metazoan metabotropic glutamate receptors.
Identified metabotropic glutamate receptor classes from bilateral and non-bilateral organisms are indicated by colored boxes at the right. Dashed boxes further highlight individual classes from bilateral organism. Bootstrap values are shown at tree nodes and protein names at the end of each branch. Tree branches are colored based on phylum, as indicated in the legend. Protein names from non-vertebrate species are composed of four parts: (i) ‘mGluR’, followed by a number, or range of numbers, denoting orthologous vertebrate protein(s), if any (for Class IV and group I-II-III-IV proteins, the name is followed by the name of the class/group); (ii) a Greek letter to identify non-vertebrate paralogs, if any and (iv) a three-letter species code. GABA-B receptors from vertebrates were used as outgroup. All information about species and proteins used in this phylogeny is given in Figure 6—source data 2. Phylogenetic reconstruction was performed using Maximum-likelihood inference. The amino acid substitution model used was: WAG + I + G + F. Branch support was obtained after 1000 iterations of ultrafast bootstrapping (Hoang et al., 2018). Scale bar denotes number of amino acid substitutions per site.
Figure 6—figure supplement 2
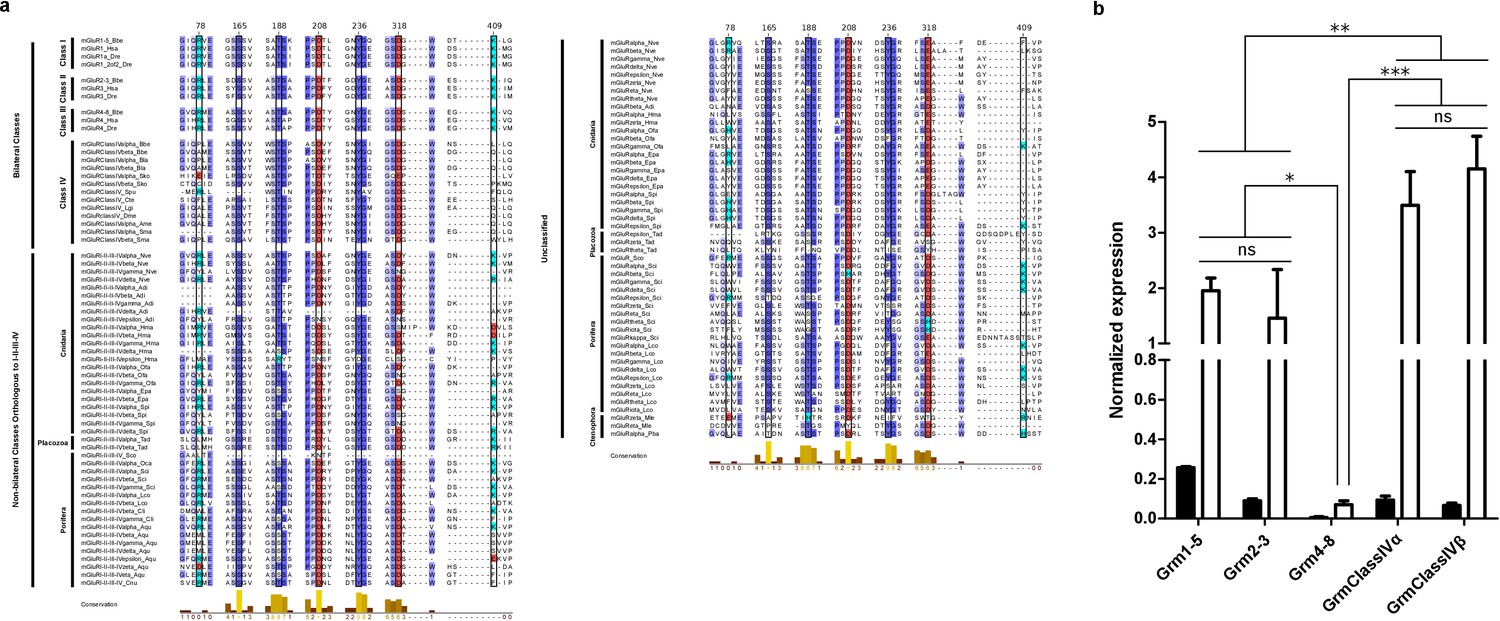
Multiple protein alignment of mGluR residues involved in ligand binding and expression levels of B.lanceolatum mGluR genes.
(a) Multiple alignment of mGluR residues involved in ligand binding. Representative class I-III chordate proteins and all class IV sequences identified are included (with the only exception of mGluRClassIVβ_Ame as it is incomplete). Also, representative sequences from non-bilaterian groups of mGluRs are shown. Bilateral classes, non-bilateral classes orthologous to I-II-III-IV and unclassified proteins are labeled in the left. Class name is also indicated. Residue numbers are indicated on top and correspond to human mGluR1. Residues involved in agonist binding are highlighted by a black frame, these are: residues 165 and 168 that perform electrostatic interactions with the α-carboxyl group, residues 208, 236 and 318 that bind the α-amino group and residues 78 and 409 that contact the amino acid side chain. Acid residues are colored in red and basic residues in light blue. Higher amino acid conservation is represented by increasing intensity of blue background and by a bar chart at the bottom. Figure was prepared with Jalview v2.10.4b1 (Waterhouse et al., 2009). (b) Bars show average (and standard deviation) relative expression of Branchiostoma lanceolatum (amphioxus) mGluR genes as determined by qPCR. Filled bars represent whole body and open bars nerve cord expression levels. All genes show significantly enriched expression in the nerve chord relative to the whole body (Student’s t-test, n = 3). Expression level in the nerve chord is compared across all genes. Note that class IV genes show the highest expression. Statistics: one-way ANOVA followed by Tukey’s Post-Hoc test, n = 3. Significance levels: ***p < 0.001, **p < 0.01 and *p < 0.05; ns, not significant.
Figure 6—figure supplement 3
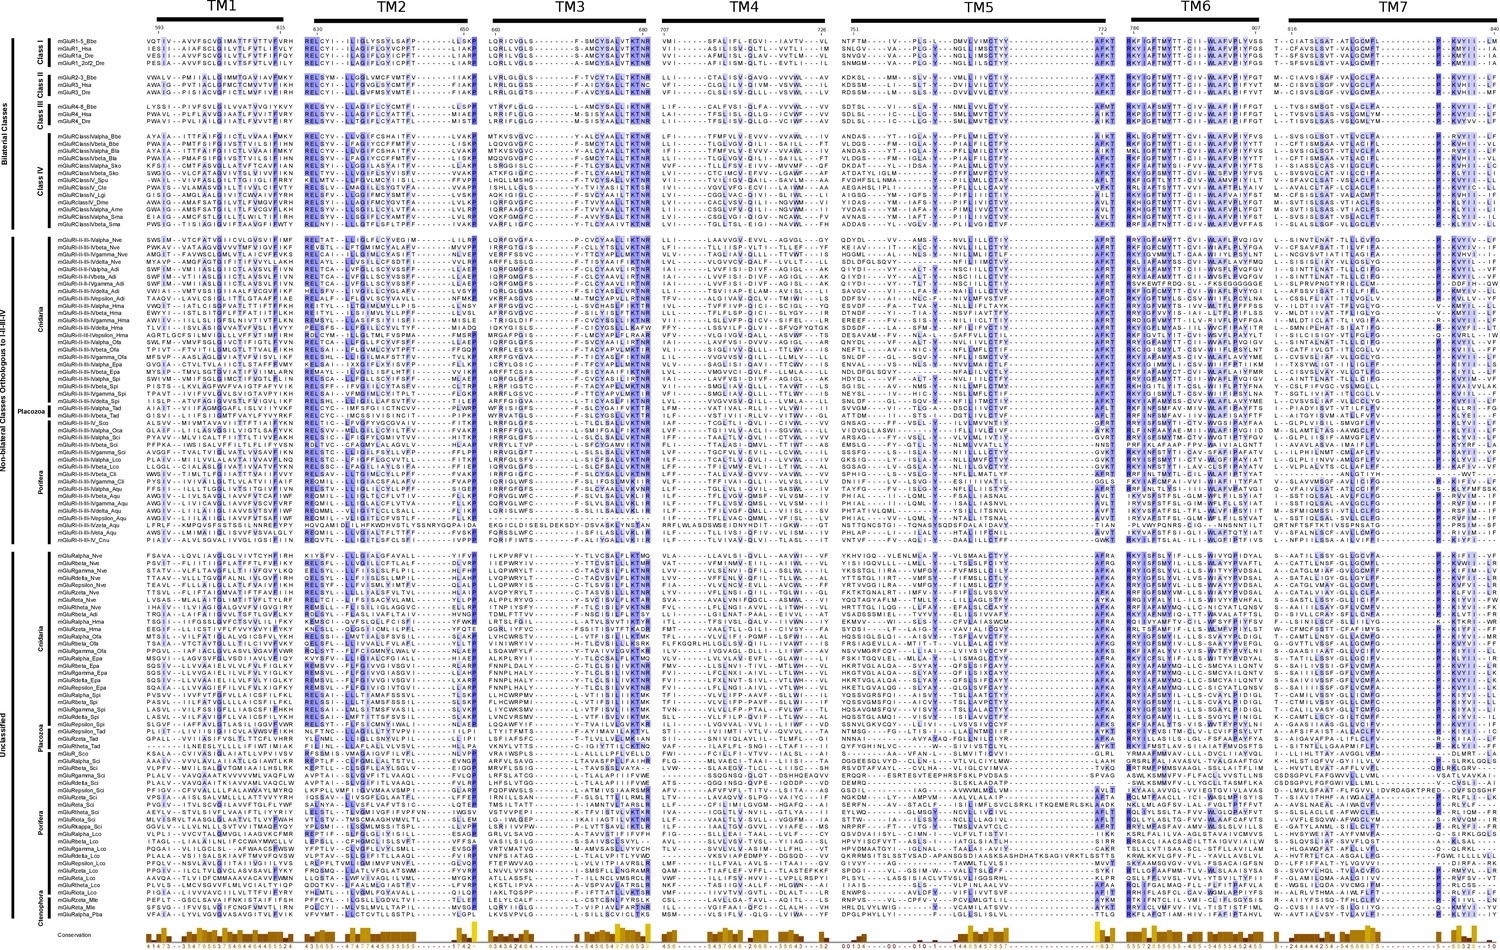
Multiple protein alignment of mGluR transmembrane regions.
The alignment includes all protein sequences from class IV together with vertebrate and amphioxus representative sequences of class I-III. Representative sequences from non-bilaterian groups are also shown. Bilateral classes, non-bilateral classes orthologous to I-II-III-IV and unclassified proteins are labeled in the left. Class name is also indicated. Residue numbers are shown on top and correspond to human mGluR1. Higher amino acid conservation is represented by increasing intensity of blue background and by a bar chart at the bottom. Figure was prepared with Jalview v2.10.4b1 (Waterhouse et al., 2009).
Figure 6—figure supplement 4
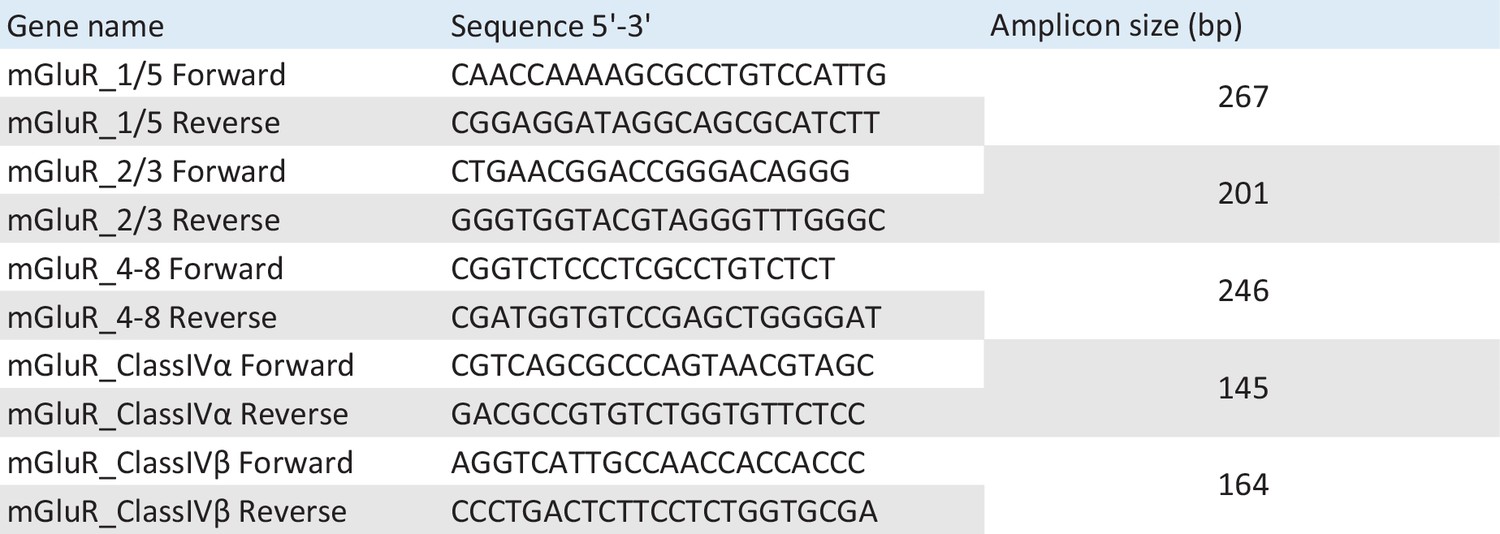
List of primers used in qPCR experiments.
Primer sequences are included.
Author response image 1
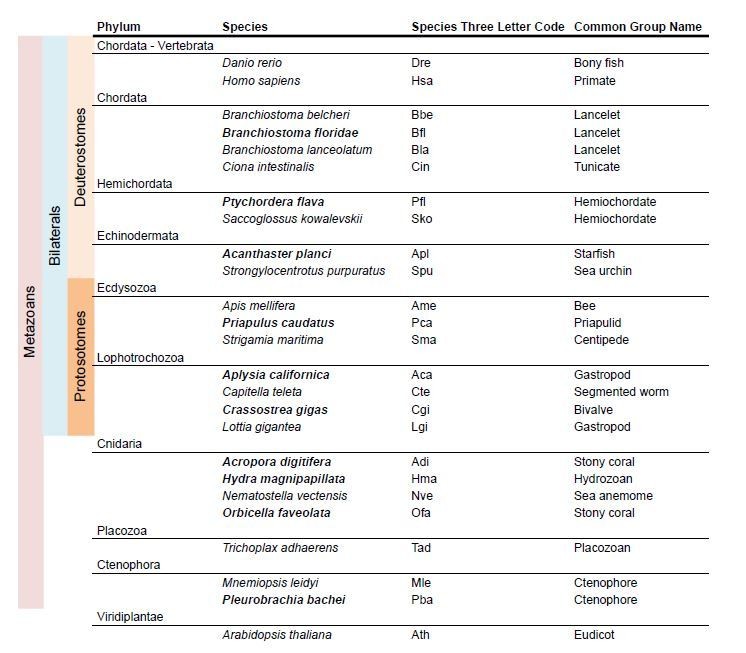
Species used in iGluR phylogeny.
In bold new species used in the present version of the manuscript.
Author response image 2
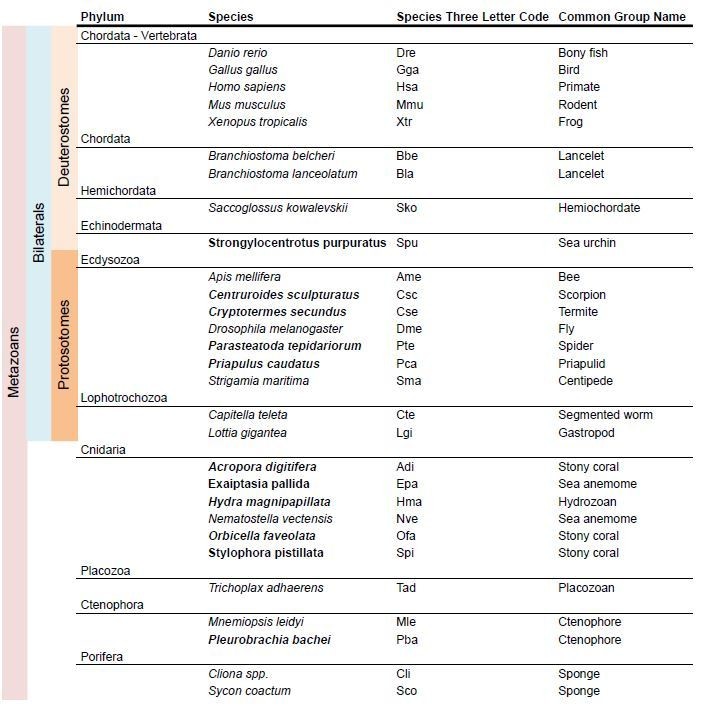
Species used in the mGluR phylogeny.
In bold new species used in the present version of the mansucript.
Author response image 3
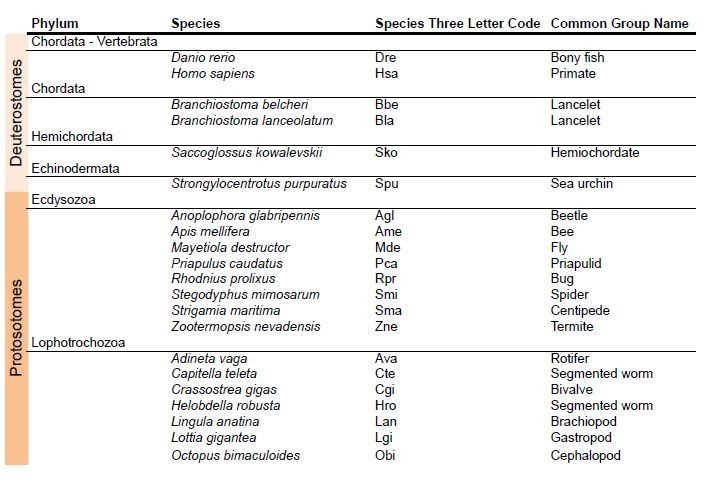
Species used in the phylogeny of AMPA and Kainate classes in protosotomes.
https://doi.org/10.7554/eLife.35774.036
Author response image 4
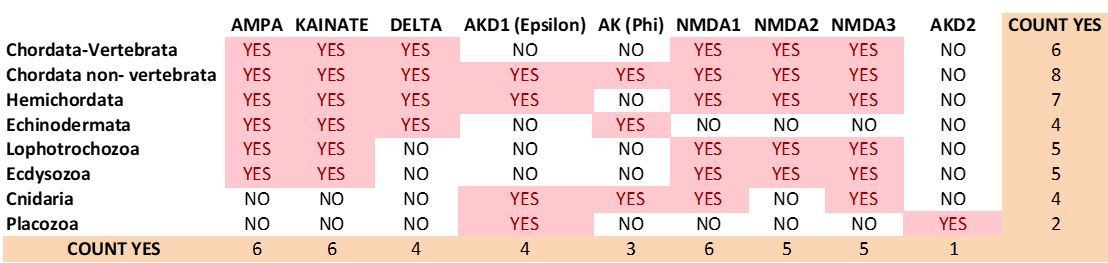
Previous distribution of iGluR classes among metazoan phyla.
https://doi.org/10.7554/eLife.35774.037
Author response image 5
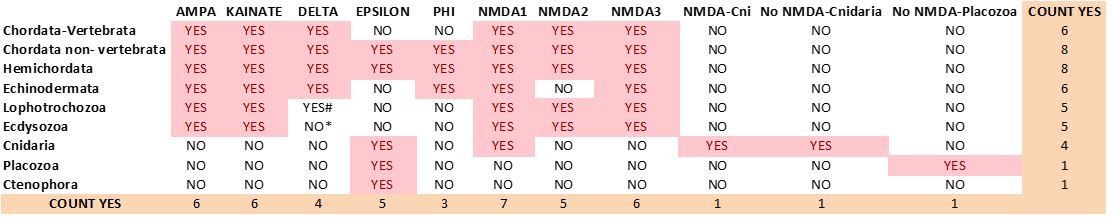
Current distribution of iGluR classes among metazoan phyla.
# We could only find 3 species with members of the Delta class in Lophotrochozoans.
* Among Ecdysosoans members of the Delta class are only found in Priapulids. We have not found genes coding for subunits of Delta receptors in arthropod or nematode species.
Author response image 6
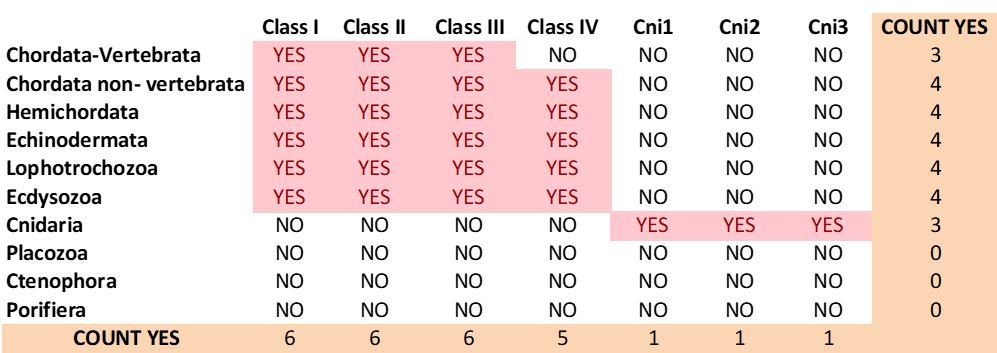
Current distribution of mGluR classes among metazoan phyla.
https://doi.org/10.7554/eLife.35774.039
Author response image 7
Author response image 8
Author response image 9
Expression of GluE1 and GluE7 in HEK293 48 hours after transfection.
https://doi.org/10.7554/eLife.35774.042Tables
Key resources table
| Reagent type (species) or resource | Designation | Source or reference | Identifiers | Additional information |
|---|---|---|---|---|
| Cell line (Homo sapiens) | HEK293T | American Type Culture Collection | Cat#: CRL-3216 RRID: CVCL_0063 | |
| Transfected construct (synthesize) | pIRES2_EGFP | Addgene | Cat. #: 6029–1 | |
| Transfected construct (synthesize) | pICherryNeo | Addgene | Cat. #: 52119 | |
| Transfected construct (synthesize) | Grie1 in pICherryNeo | Invitrogen GeneArt Gene Synthesis | ||
| Transfected construct (synthesize) | Grie7 in pIRES2_EGFP | Invitrogen GeneArt Gene Synthesis | ||
| Biological sample (Branchiostoma lanceolatum) | whole animal | Collected in the bay of Argelès- sur-Mer, France (latitude 42° 32' 53’ N and longitude 3° 03' 27’ E) | ||
| Biological sample (Branchiostoma lanceolatum) | nerve chord | Collected in the bay of Argelès-sur- Mer, France (latitude 42° 32' 53’ N and longitude 3° 03' 27’ E) | ||
| Antibody | Mouse anti-HA | Covance | Cat. #: MMS-101P RRID: AB_291259 | IF (1:200), WB (1:1000) |
| Antibody | Rabbit anti-c-Myc | Cell Signalling | Cat. #: 2272S RRID: AB_10692100 | IF (1:100), WB (1:1000) |
| Antibody | Mouse anti-GluA2 | Millipore | Cat. #: MAB397 RRID: AB_2113875 | IF (1:200), WB (1:1000) |
| Antibody | Alexa Fluor 555 donkey anti- mouse IgG | Invitrogen | Cat. #: A-31570 RRID: AB_2536180 | IF (1:1000) |
| Antibody | Alexa Fluor 647 goat anti -rabbit IgG | Life Technologies | Cat. #: A-21245 RRID: AB_2535813 | IF (1:500) |
| Antibody | Donkey anti-mouse | Li-cor | Cat. #: 926–32212 RRID: AB_621847 | WB (1:7500) |
| Antibody | Donkey anti-rabbit | Li-cor | Cat. #: 926–68073 RRID: AB_10954442 | WB (1:7500) |
| Recombinant DNA reagent | ||||
| Sequence- based reagent | Grie1 gene from B. Lanceolatum | |||
| Sequence- based reagent | Grie7 gene from B. Belcheri | |||
| Sequence-based reagent | Seqeucne corresponding with rat Gria2 signal peptide | |||
| Chemical compound, drug | N-dodecyl-α- maltopyranoside; DDM | Anatrace | Cat. #: D310HA | 2% w/v |
| Software, algorithm | pClamp10 | Molecular Devices | ||
| Software, algorithm | IgorPro | Wavemetrics | ||
| Software, algorithm | Neuromatic | doi: 10.3389/ fninf.2018. 00014 | RRID: SCR_004186 | |
| Software, algorithm | MrBayes 3.2.6 | doi: 10.1093/sysbio/sys029 | ||
| Software, algorithm | IQTree | doi: 10.1093/molbev/msu300 | ||
| Software, algorithm | MolProbity | doi: 10.1107/S0907444909042073 | RRID: SCR_014226 | |
| Software, algorithm | MIFit | GitHub (Smith, 2010) | ||
| Software, algorithm | FIJI | doi: 10.1038/nmeth.2019 | RRID: SCR_002285 | |
| Other | CIPRES Science Gateway | doi: 10.1109/GCE.2010.5676129 | RRID: SCR_008439 | Free on-line super computing resource for evolutionary research |
Additional files
-
Transparent reporting form
- https://doi.org/10.7554/eLife.35774.032
Download links
A two-part list of links to download the article, or parts of the article, in various formats.
Downloads (link to download the article as PDF)
Open citations (links to open the citations from this article in various online reference manager services)
Cite this article (links to download the citations from this article in formats compatible with various reference manager tools)
Metazoan evolution of glutamate receptors reveals unreported phylogenetic groups and divergent lineage-specific events
eLife 7:e35774.
https://doi.org/10.7554/eLife.35774


