Differential requirement of kindlin-3 for T cell progenitor homing to the non-vascularized and vascularized thymus
- Max-Planck-Institute of Biochemistry, Germany
- Ludwig-Maximilians-Universität, Germany
Figures
Figure 1 with 1 supplement
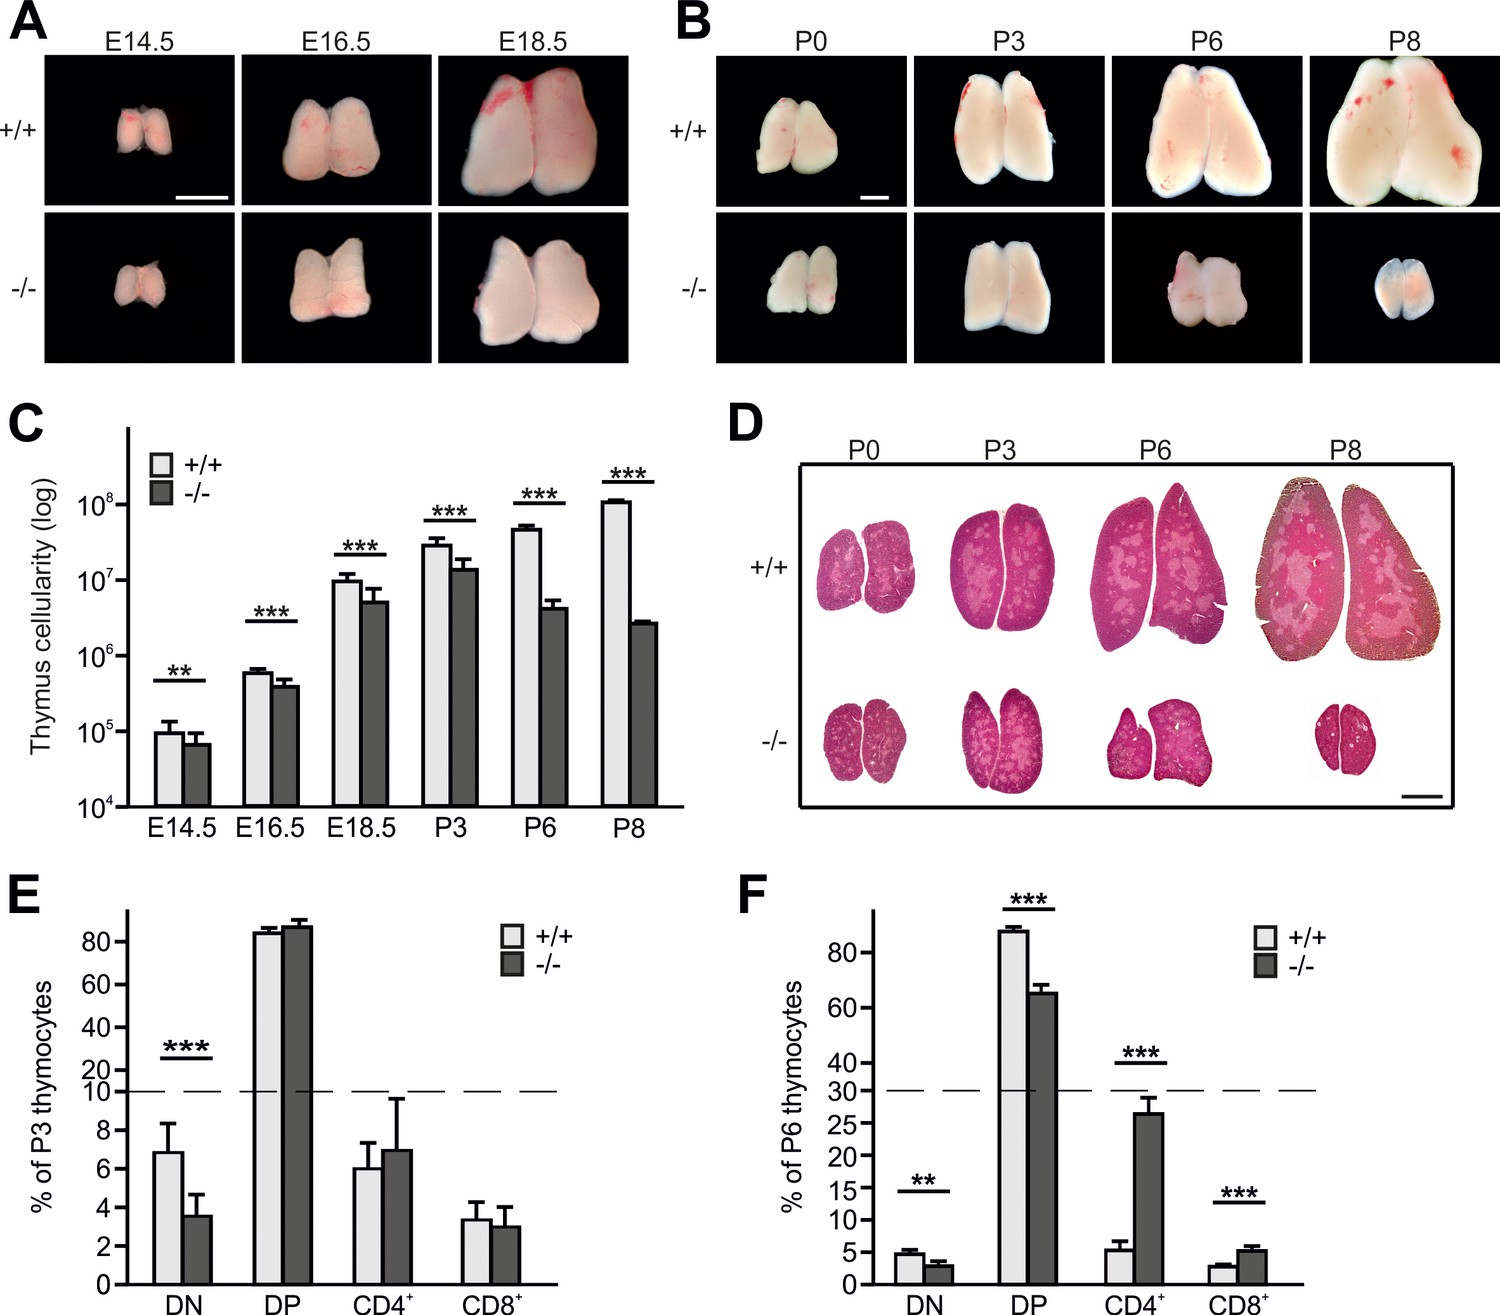
Kindlin-3 deficiency causes thymus atrophy.
(A and B) Images from Fermt3+/+ (upper panel) and Fermt3-/- (lower panel) thymi isolated at the indicated embryonic and postnatal stages. Scale bars 1 mm. (C) Total thymocyte numbers at indicated time points (E14.5 to P8). N(E14.5)=28/28; N(E16.5)=12/12; N(E18.5)=30/21; N(P3)=6/4; N(P8)=3/2. (D) Haematoxylin and Eosin staining of paraffin-embedded thymus sections. Scale bar 1 mm. (E and F) Frequencies of CD4 and CD8 double negative (DN), double positive (DP) and single positive CD4 and CD8 thymocytes isolated from P3 and P6 thymi. N(P3)=16/18; N(P6)=8/4. Bars indicate means ± standard errors. **p<0.01; ***p<0.001. See also Figure 1—figure supplement 1.
Figure 1—figure supplement 1
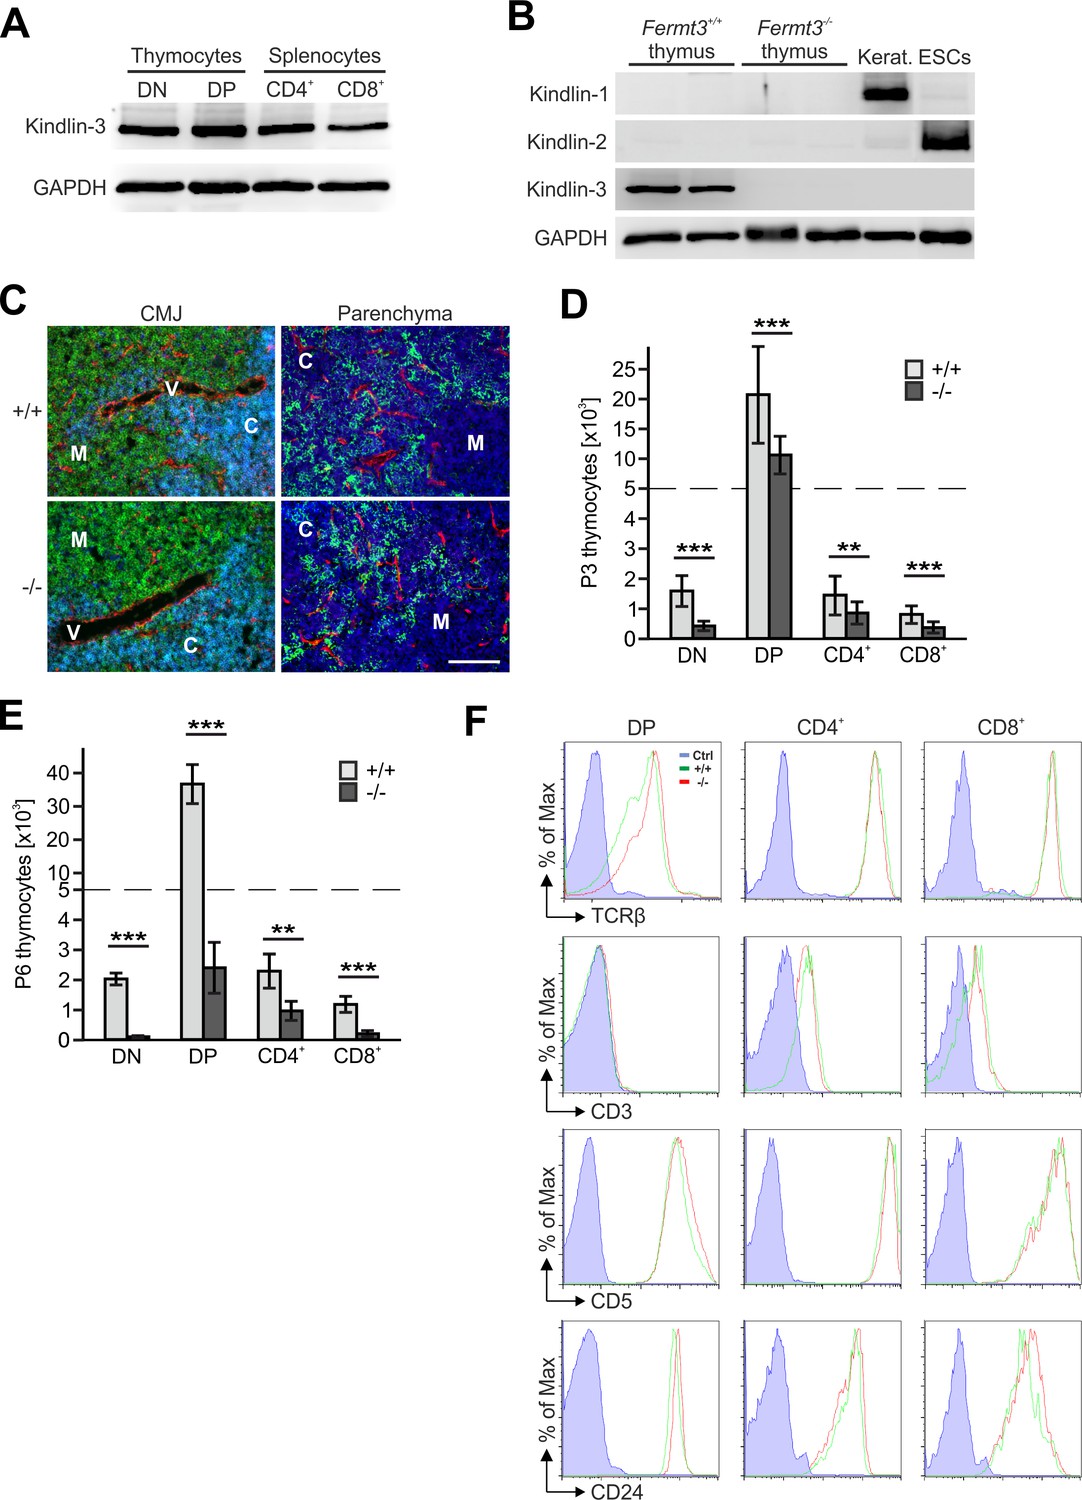
Kindlin-3 deficiency causes thymus atrophy.
(A) Kindlin-3 expression in protein lysates from FACS sorted CD4/CD8 double negative (DN), CD4/CD8 double positive (DP), CD4 and CD8 single positive thymocytes. GAPDH served as loading control. (B) Expression of kindlin-1,–2 and −3 in protein lysates of Fermt3+/+ and Fermt3-/- thymi. Keratinocyte and embryonic stem cell (ESC) lysates were used as positive controls for kindlin-1 and −2 expression, respectively. GAPDH was used as loading control. (C) Cryosections of P3 Fermt3+/+ and Fermt3-/- thymi were stained with anti-pan-laminin (red), anti-CD4 (green) and anti-CD8 (blue) antibodies (left panel), or with anti-pan-cytokeratin (green), anti-PECAM-1 (red) antibodies and DAPI (blue) (right panel). Cells in cyan indicate CD4/CD8 double positive cells. M, medulla; C, cortex; V, vessel; CMJ, cortico-medullary junction. Scale bar 100 µm. Absolute numbers of DN, DP, CD4+ and CD8+ thymocytes present in P3 (D) and P6 (E) thymi. (F) Expression of TCRβ, CD3, CD5 and CD24 on DP, CD4+ and CD8+ thymocytes from P3 Fermt3+/+ and Fermt3-/- thymi analysed by flow cytometry. Isotype matched controls (blue); Fermt3+/+ cells (green); Fermt3-/- cells (red). Bars indicate means ± standard errors. **p<0.01; ***p<0.001.
Figure 2 with 1 supplement
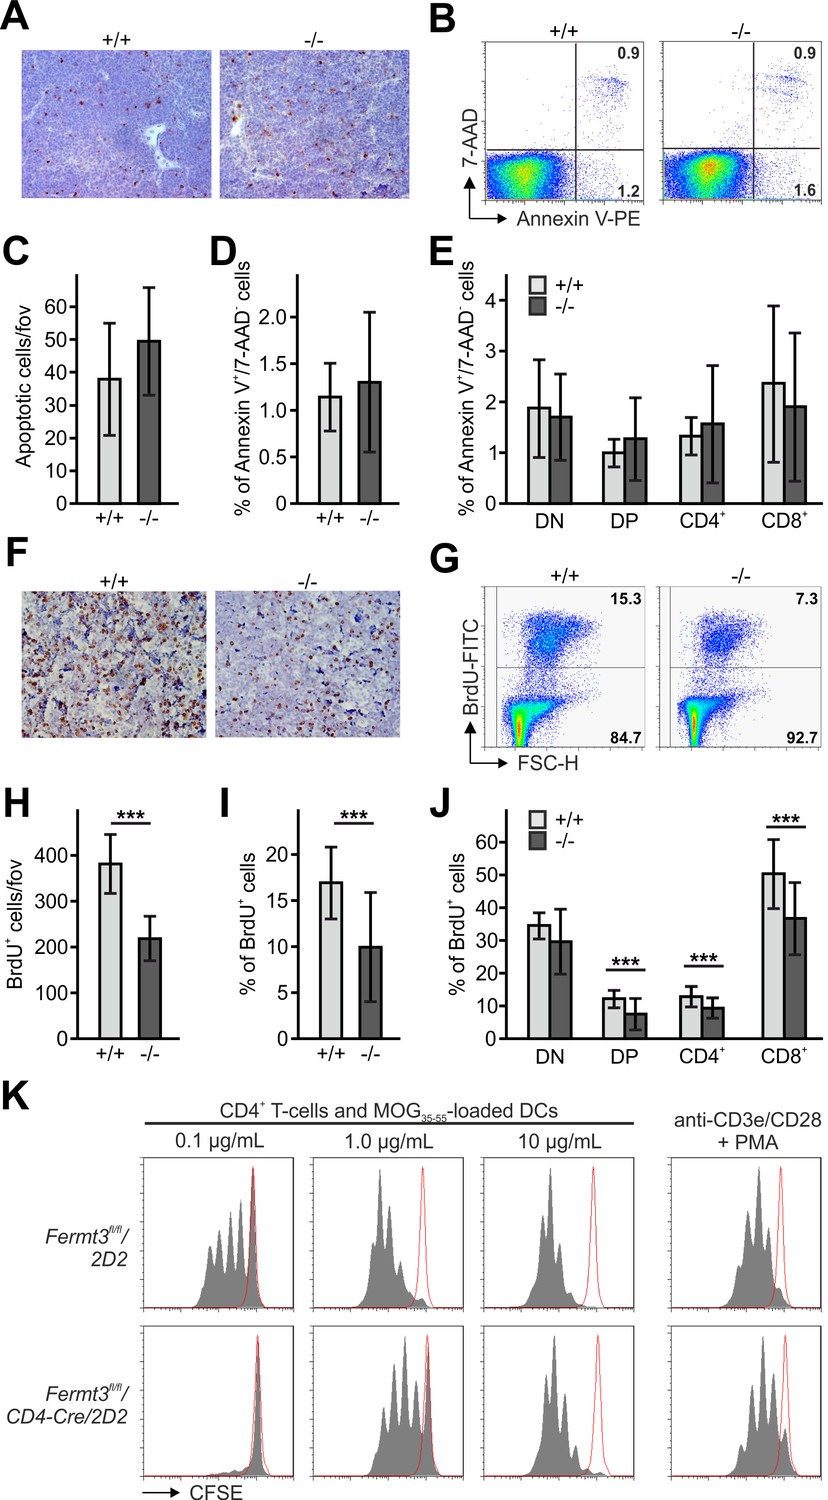
Reduced thymocyte proliferation contributes to thymus atrophy of kindlin-3-deficient mice.
(A) Staining for cleaved caspase-3 counterstained with Mayer´s haematoxylin on paraffin sections of Fermt3+/+ and Fermt3-/- P3 thymi. Scale bar 100 µm. (B) Single-cell suspensions of thymocytes from control and Fermt3-/- P3 thymi were stained with the apoptotic (Annexin V) and dead cell (7-AAD) markers. Numbers within the FACS blots represent percent of cells within each quadrant. (C) Number of apoptotic cells per field of view (fov) observed in (A). N = 10. Percentage of early apoptotic cells (Annexin V+, 7-AAD-) in control and Fermt3-/- thymi (D) and in distinct T cell subpopulations (CD4/CD8 DN, CD4/CD8 DP, CD4 single positive and CD8 single positive) (E). N = 7/10. (F) Sections of Fermt3+/+ and Fermt3-/- P3 thymi stained for BrdU incorporation and counterstained with Mayer´s haematoxylin. Scale bar 100 µm. (G) BrdU incorporation in thymocytes analysed by flow cytometry. (H) Numbers of BrdU positive cells per field of view (fov) observed in (F). N = 8/6. (I) Percentage of proliferating, BrdU positive thymocytes measured by flow cytometry. N = 14. (J) Percentage of BrdU positive cells in distinct T cell subpopulations. N = 14. (K) CD4 T cells isolated from spleens of control Fermt3fl/fl/2D2 and Fermt3fl/fl/2D2/CD4Cre mice were stained with CFSE and stimulated either with DCs loaded with different concentrations of MOG35-55 peptide or primed with anti-CD3e/CD28 antibodies and PMA. Representative histograms show CSFE dilution. Red-lined histograms represent cells incubated with not-loaded DCs or no antibodies. Bars indicate means ± standard errors. **p<0.01; ***p<0.001. See also Figure 2—figure supplement 1.
Figure 2—figure supplement 1
Reduced thymocyte proliferation contributes to thymus atrophy of kindlin-3-deficient mice.
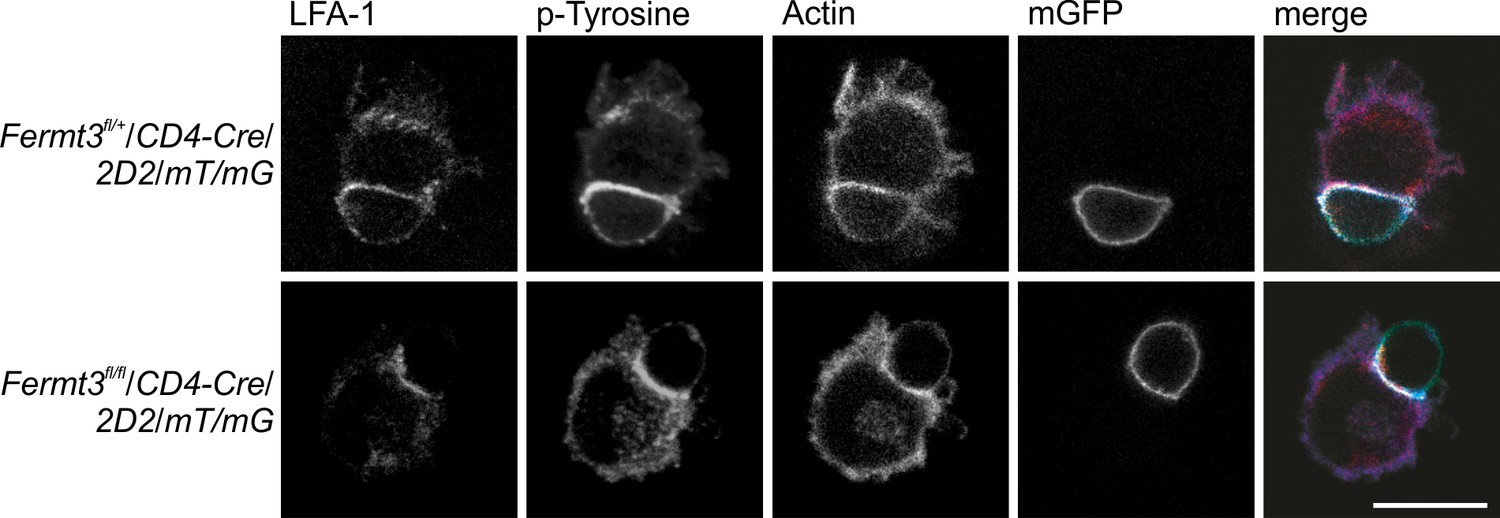
Kindlin-3-deficient CD4+ T cells are able to form immune synapses with dendritic cells. Mature wild-type dendritic cells loaded with MOG35-55 peptide were incubated with CD4+ T cells from Fermt3fl/+ (K3fl/+) and Fermt3fl/fl (K3fl/fl) mice expressing Cre-recombinase under the control of the CD4 promoter, a MOG35-35 specific TCR (2D2) and a double fluorescent reporter transgene to verify Cre activity (mT/mG). Cells were stained for intergin LFA-1, tyrosin-phosphorylated proteins and actin and imaged by confocal microscopy. Size bar 10 µm.
Figure 3 with 1 supplement
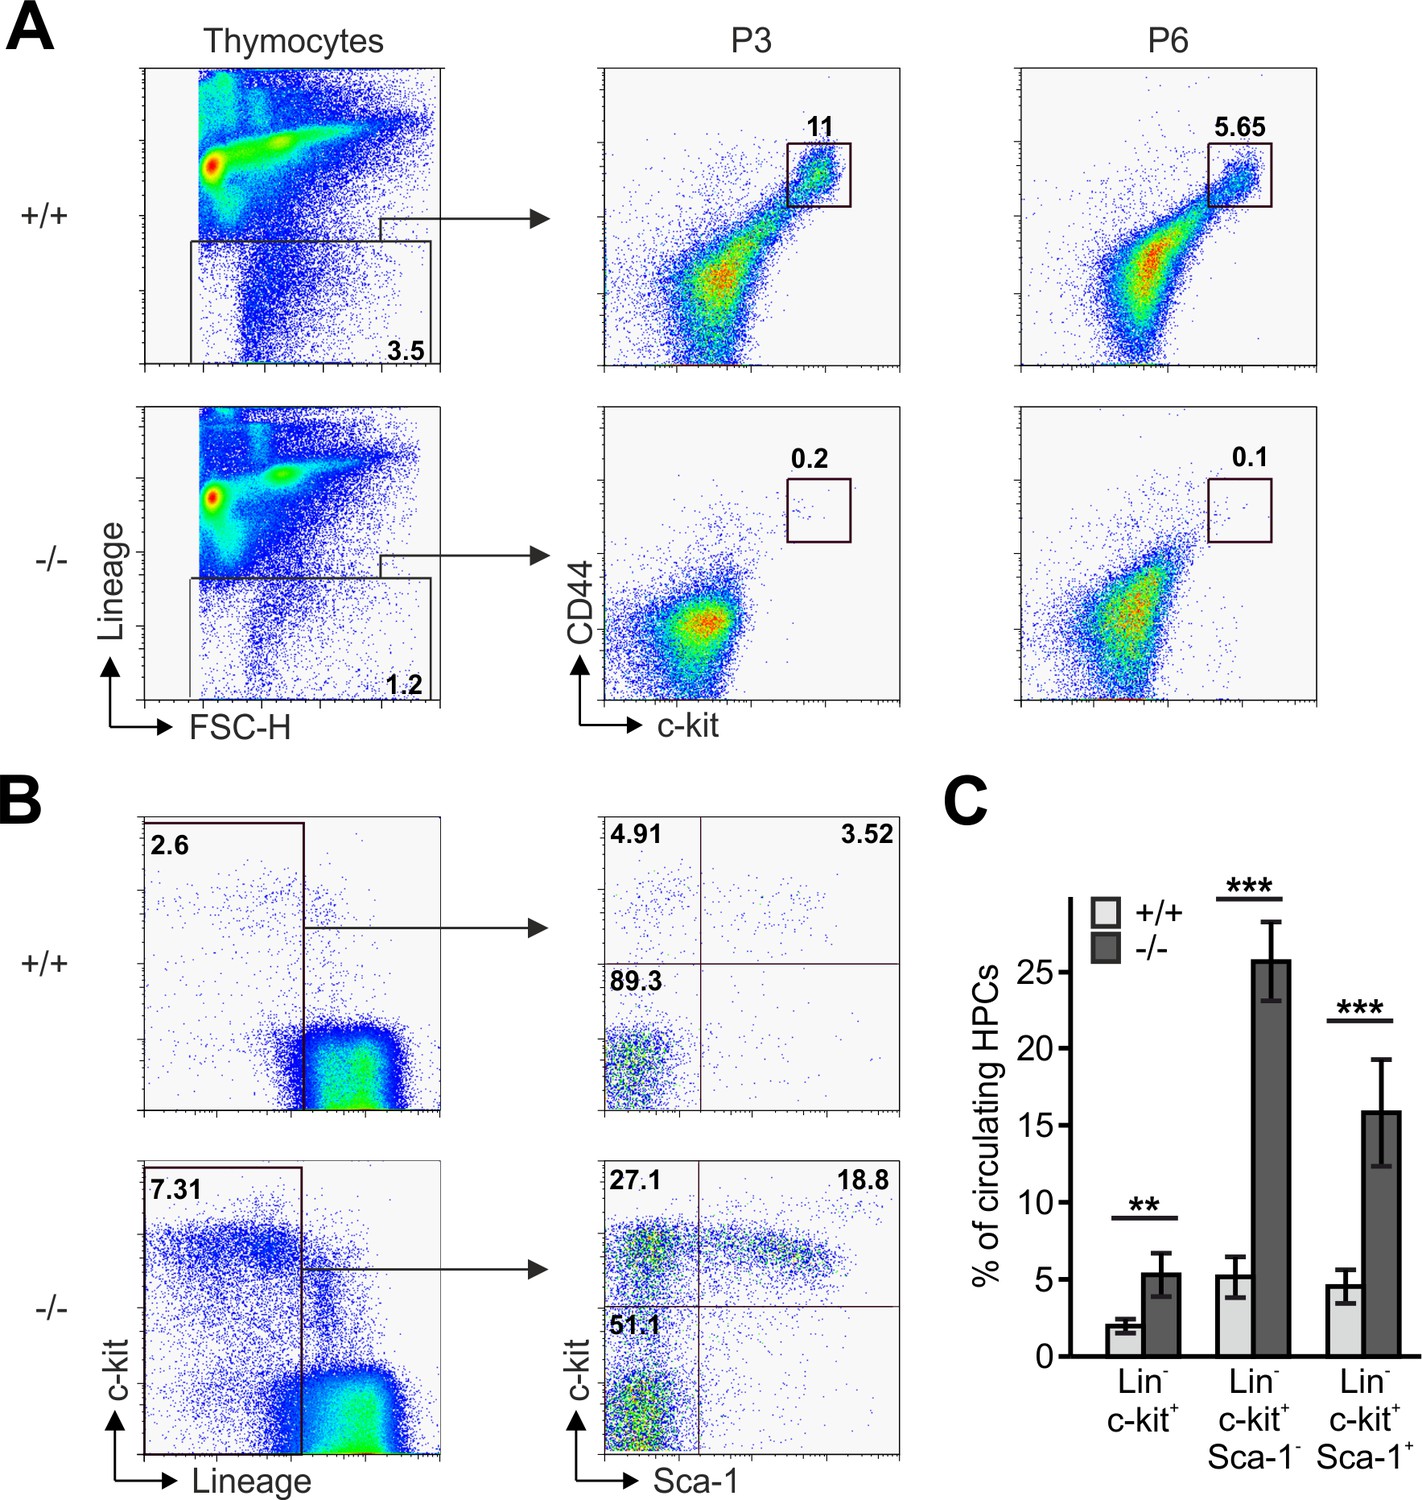
Reduced frequencies of T cell progenitors in Fermt3-/- thymi.
(A) Thymocytes from Fermt3+/+ and Fermt3-/- mice were stained for lineage markers (B220, CD19, TER119, NK1.1, CD11b, Gr-1, CD8α, CD3e, TCRβ, TCRγδ and CD11c), CD44 and c-kit to identify DN1-2 (Linneg, c-kithi, CD44hi) and the DN3-4 (Linneg, c-kitlow, CD44low) populations. (B and C) PB from Fermt3+/+ and Fermt3-/- animals (P3) were stained for lineage markers (TER119, B220, CD11b, Gr-1, CD11c, NK1.1, CD4 and CD8α), c-kit and Sca-1 to identify hematopoietic progenitor cells and analysed by flow cytometry. N = 4. Numbers within the representative FACS plots indicate cell percentages. Bars indicate means ± standard errors. **p<0.01; ***p<0.001. See also Figure 3—figure supplement 1.
Figure 3—figure supplement 1
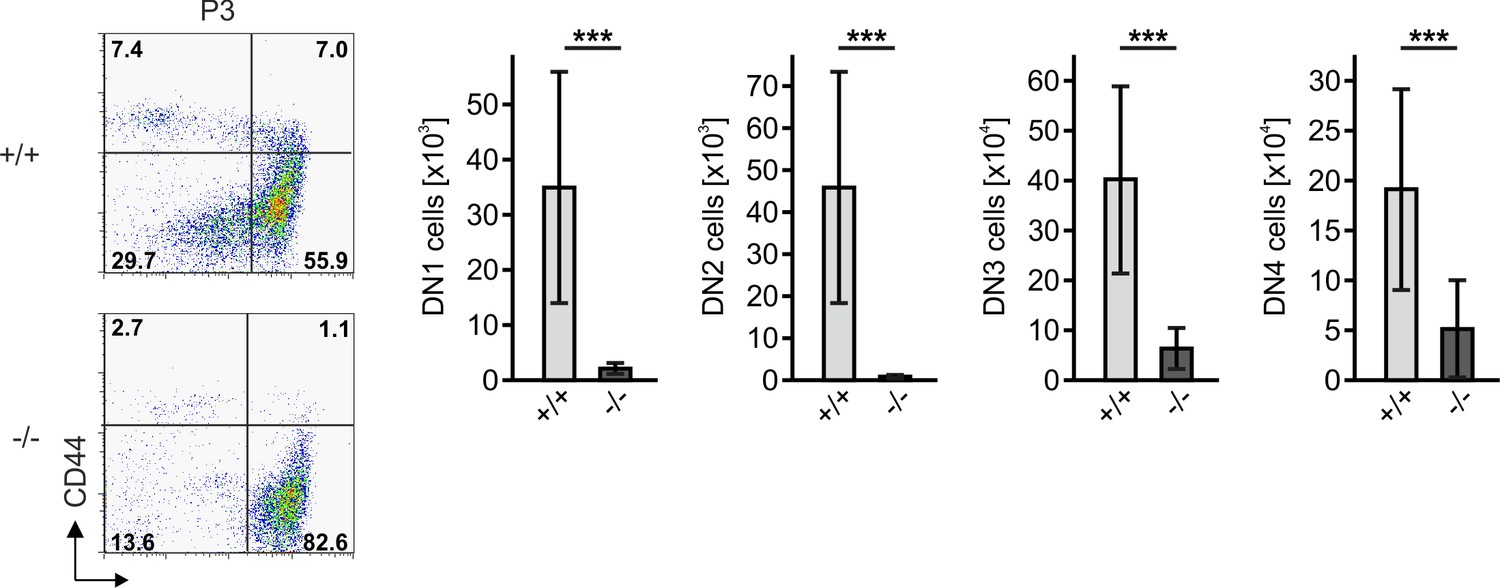
Reduced frequencies of T cell prognitors in Fermt3-/- thymi.
Thymocytes from Fermt3+/+ and Fermt3-/- P3 mice were stained for lineage markers (B220, CD19, TER119, NK1.1, CD11b, Gr-1, CD8α, CD3ε, TCRβ, TCRγδ and CD11c), CD44 and CD25 to identify and quantify DN1 (Linneg, CD44hi, CD25-), DN2 (Linneg, CD44hi, CD25+), DN3 (Linneg, CD44low, CD25+) and DN4 (Linneg, CD44low, CD25-) populations by flow cytometry. Numbers within FACS plots indicate cell percentages. Total number of DN1, DN2, DN3 and DN4 cells were measured by flow cytometry. N = 20. Bars indicate means ± standard errors. *p<0.05; **p<0.01; ***p<0.001.
Figure 4 with 2 supplements

Kindlin-3-deficient T cell progenitors are severely impaired in seeding the adult thymus.
(A–C) Images (A), weights (B) and cell numbers (C) of thymi from adult WT and Rag2-/- mice and Rag2-/- mice 10 weeks after reconstitution with Fermt3+/+ and Fermt3-/- fetal liver cells. Scale bar 5 mm. N = 10. (D) Single-cell suspensions were stained for lineage markers (B220, CD19, TER119, NK1.1, CD11b, Gr-1, CD11c, CD8α, CD3e, TCRβ, and TCRγδ), c-kit, CD44 and CD25 to identify the DN1-2 (Linneg, c-kithi, CD44hi) and the DN3-4 (Linneg, c-kitlow, CD44low) populations (upper panel), and DN1 (Linneg, CD44hi, CD25-), DN2 (Linneg, CD44hi, CD25+), DN3 (Linneg, CD44low, CD25+) and DN4 (Linneg, CD44low, CD25-) populations (lower panel) by flow cytometry. Frequencies of DN1-2 (E) and DN4 (F) thymocytes. N = 8–10. (G) Analysis of peripheral blood T-lymphocytes. (H and I) Frequencies of circulating CD4+ and CD8+ T cells calculated from flow cytometric analyses shown in (G). N = 10. Numbers within the representative FACS plots indicate cell percentages. (J) Expression of talin-1 and kindlin-3 in CD4+ T cells isolated from the spleen of Rag2-/- mice after reconstitution with Fermt3+/+ and Fermt3-/- fetal liver cells. GAPDH serves as loading control. (K) genomic PCR of CD8+ T cells sorted from the spleen of Rag2-/-/Fermt3+/+ and Rag2-/-/Fermt3-/- chimeras. Numbers within the representative FACS plots indicate cell percentages. Bars indicate means ± standard errors. **p<0.01; ***p<0.001. See also Figure 4—figure supplements 1 and 2.
Figure 4—figure supplement 1
Kindlin-3-deficient T cell progenitors are severely impaired in seeding the adult thymus.
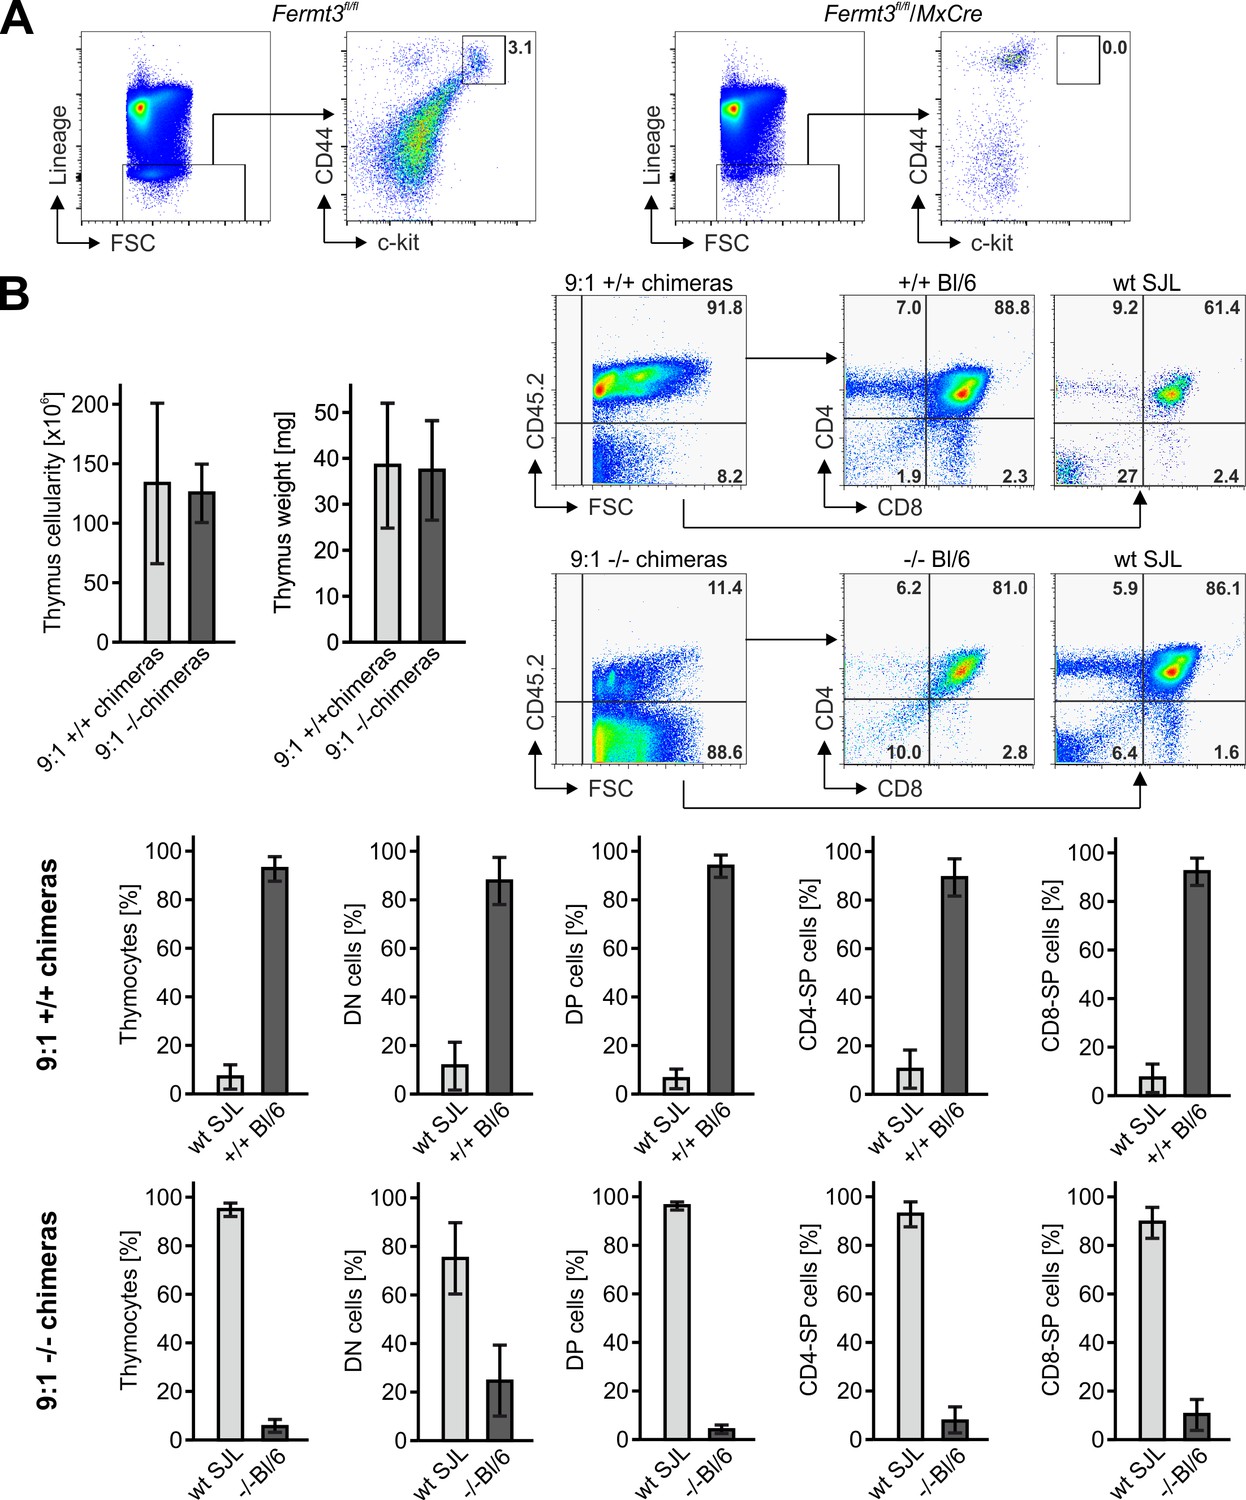
(A) Thymocytes from polyIC-induced Fermt3fl/fl/Mx1-Cre-negative and Fermt3fl/fl/Mx1-Cre-positive mice were stained for lineage markers (B220, CD19, TER119, NK1.1, CD11b, Gr-1, CD8α, CD3ε, TCRβ, TCRγδ and CD11c), CD44 and c-kit to identify the DN1-2 population (Linneg, c-kithi, CD44hi). (B) Cell numbers, weight and flow cytometric analyses of thymi from mixed FL cell chimeras, which received a 9:1 ratio of FL cells from Fermt3+/+ or Fermt3-/- embryos (CD45.2) and WT B6.SJL FL cells (CD45.1). Cells were stained for CD45.2, CD4 and CD8. Numbers within FACS plots indicate cell percentages. Frequencies of DP, DN and SP CD4 and CD8 T cells were calculated from flow cytometric analyses. N = 8/10. Bars indicate means ± standard errors.
Figure 4—figure supplement 2

Kindlin-3-deficient T cell progenitors are severely impaired in seeding the adult thymus.
Kindlin-3 is exclusively expressed in hematopoietic cells of the thymus. (A) Single cell suspensions of thymi from E15.5 embryos of WT (+/+) and Kindlin-3-EGFP knockin (Fermt3-EGFP ki/ki) mice were stained for CD45.2 and the thymic epithelial marker EpCAM. Both populations were analysed for EGFP expression. (B) Thymic cells from adult WT and Fermt3-EGFP knockin mice were stained for CD45.2, CD3, CD31 and EpCAM to distinguish between hematopoietic, endothelial and thymic epithelial cells. All subpopulations were analysed for EGFP expression.
Figure 5 with 1 supplement
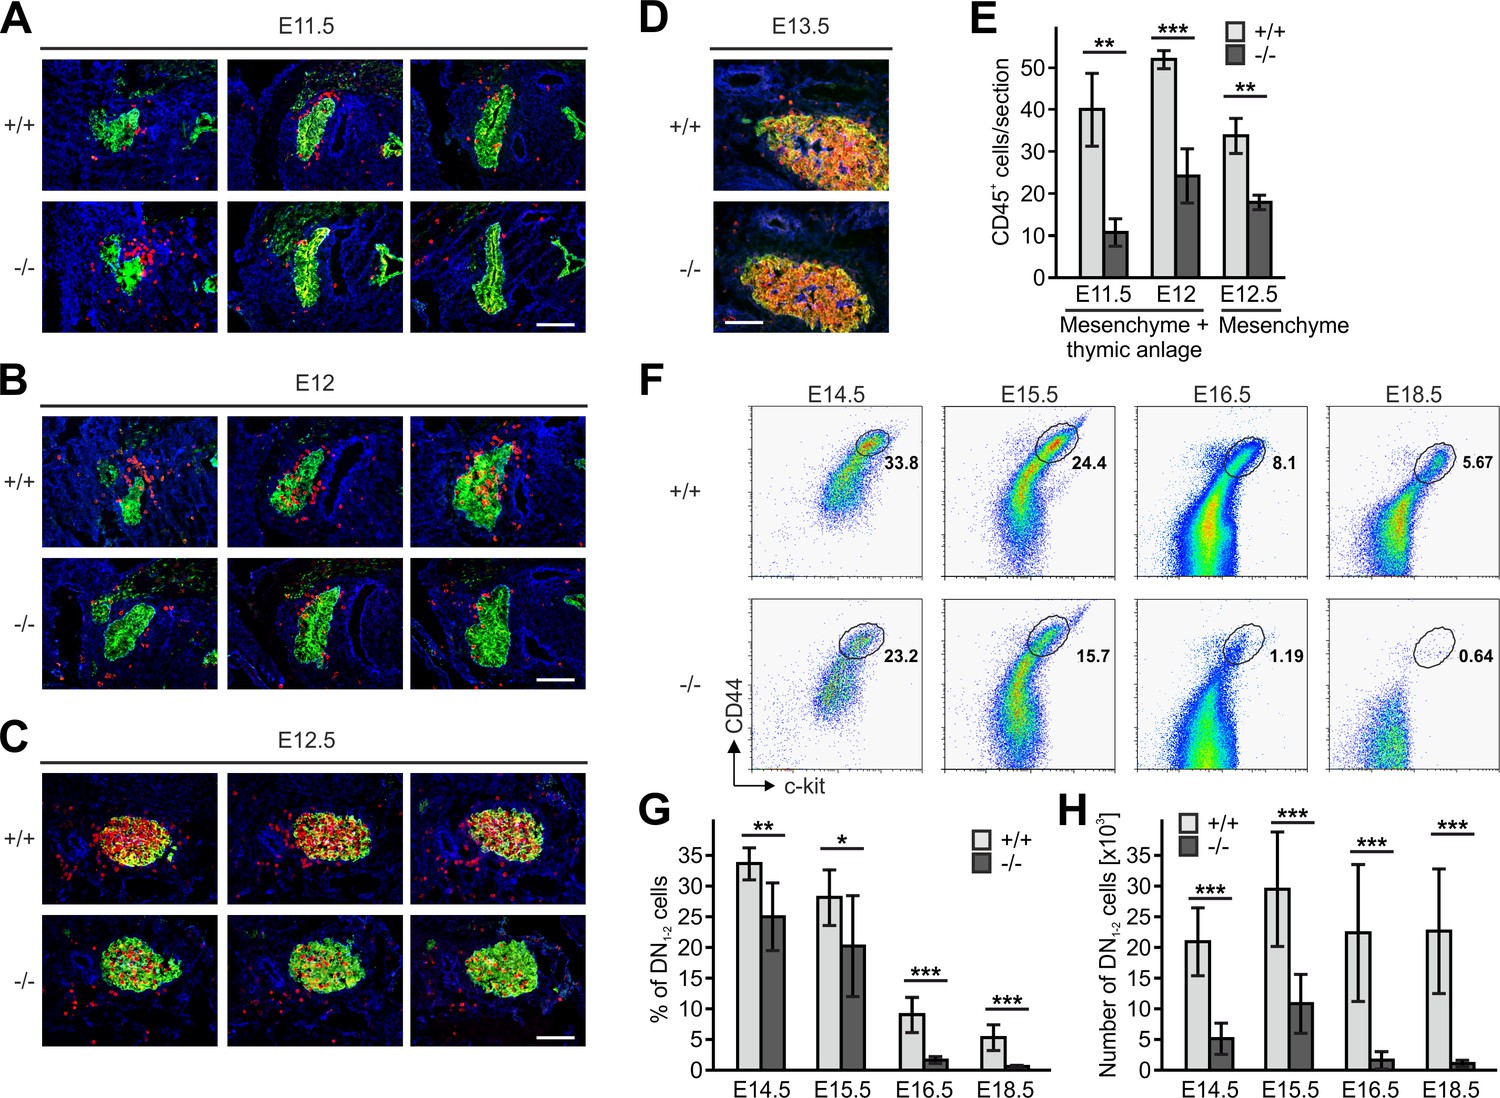
Kindlin-3-independent colonization of the fetal thymus.
(A–D) Sagittal sections of whole embryos at gestational ages E11.5 (A), E12 (B), E12.5 (C) and E13.5 (D) were stained for fibronectin (perithymic mesenchyme, blue), cytokeratin (thymic primordium, green) and CD45 (potential T cell progenitor cells, red). Scale bars 100 µm. (E) Numbers of CD45+ cells within the thymic primordium and in the perithymic mesenchyme at the indicated time points. N = 3–4. (F) Representative flow cytometric profiles of fetal thymocytes from control and Fermt3-/- thymi at the indicated time points stained for lineage markers (B220, CD19, TER119, NK1.1, CD11b, Gr-1, CD11c, CD8α, CD3e, TCRβ, and TCRγδ), c-kit and CD44 to identify the DN1-2 (Linneg, c-kithi, CD44hi) and the DN3-4 (Linneg, c-kitlow, CD44low) populations. Numbers within the representative FACS plots indicate cell percentages. Frequencies (G) and total number (H) of DN1-2 cells measured in the flow cytometric analyses shown in (F). N = 7–10 Bars indicate means ± standard errors. *p<0.05; **p<0.01; ***p<0.001. See also Figure 5—figure supplement 1.
Figure 5—figure supplement 1
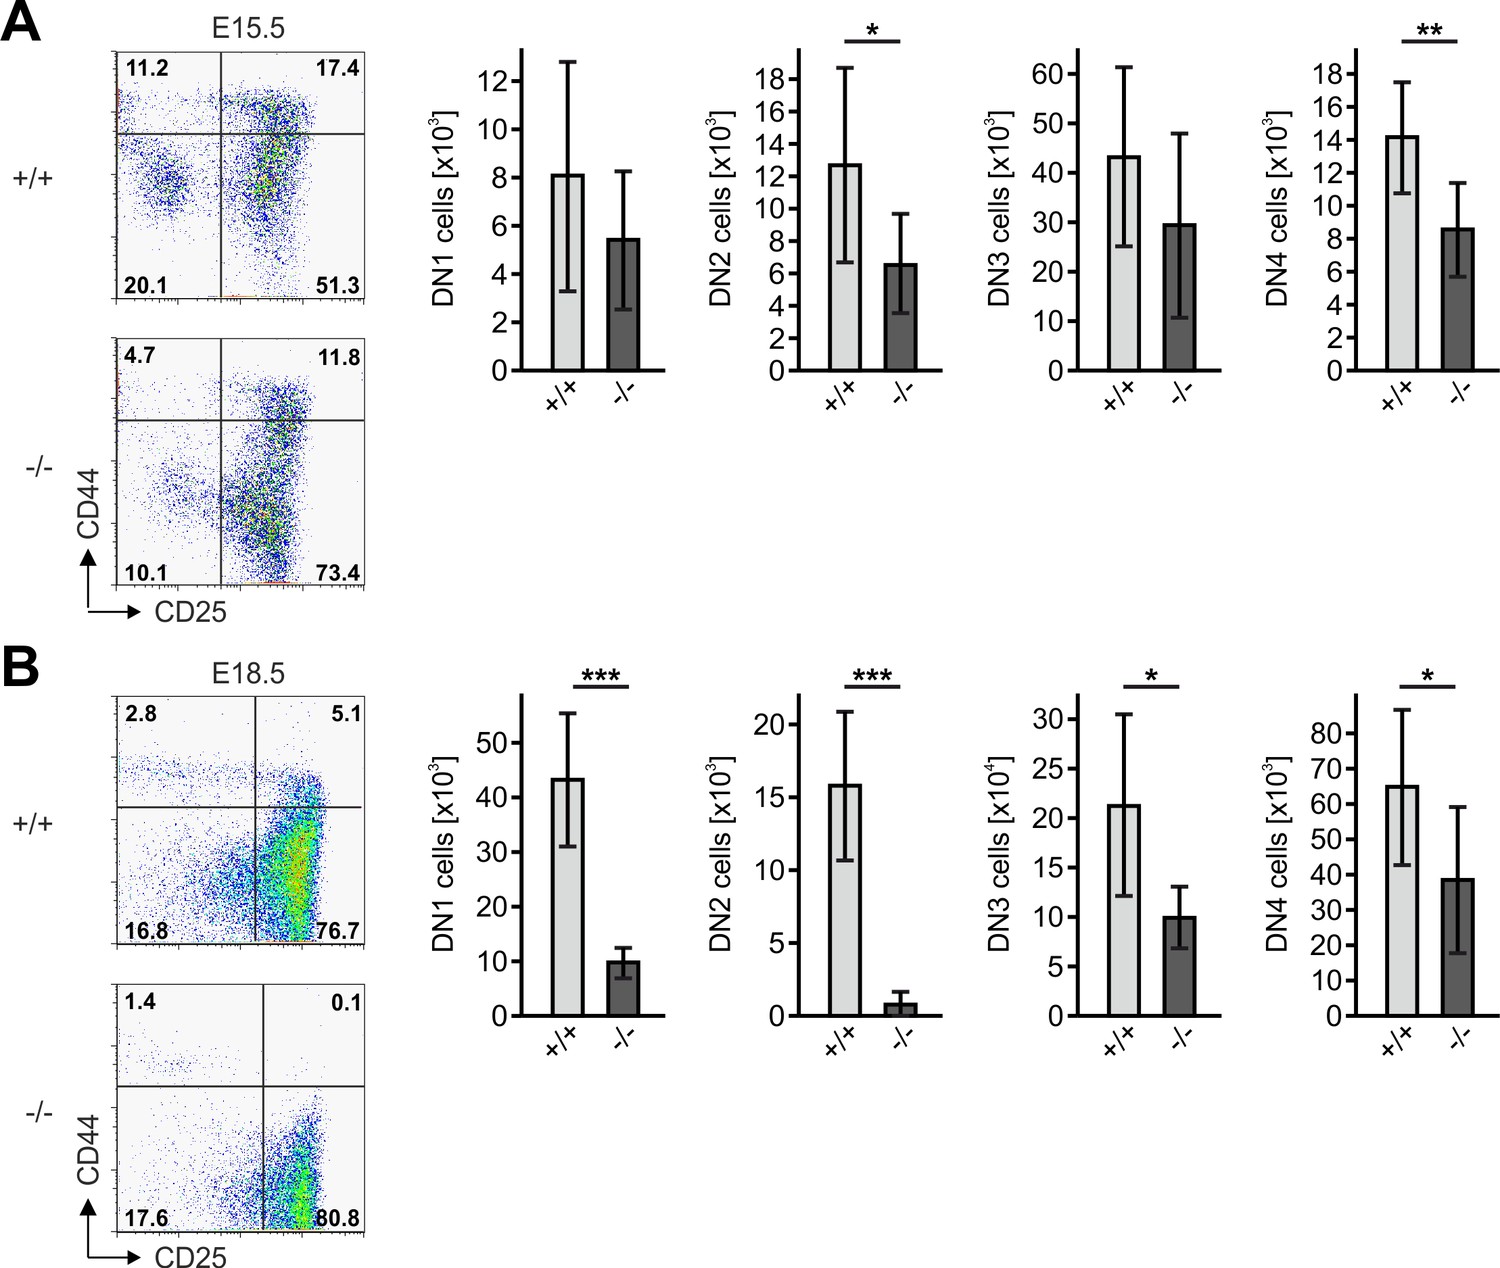
Kindlin-3-independent colonization of the fetal thymus.
Kindlin-3-deficient T cell progenitors colonize the fetal thymus but decrease with age. Thymocytes from Fermt3+/+ and Fermt3-/- E15.5 (A) and E18.5 (B) embryos were stained for lineage markers (B220, CD19, TER119, NK1.1, CD11b, Gr-1, CD8α, CD3ε, TCRβ, TCRγδ and CD11c), CD44 and CD25 to identify and quantify DN1 (Linneg, CD44hi, CD25-), DN2 (Linneg, CD44hi, CD25+), DN3 (Linneg, CD44low, CD25+) and DN4 (Linneg, CD44low, CD25-) populations by flow cytometry. Numbers within FACS plots indicate cell percentages. Total number of DN1, DN2, DN3 and DN4 cells were measured by flow cytometry. N = 6–8. Bars indicate means ± standard errors. *p<0.05; **p<0.01; ***p<0.001.
Figure 6

Fetal liver-derived T cell progenitors accumulate in the blood.
(A) Fetal liver cells from control and Fermt3-/- embryos from indicated gestational stages were stained for lineage markers (B220, CD19, TER119, NK1.1, Gr-1 and Thy1.2), c-kit, CD45 and PIR and analysed by flow cytometry. Frequencies (B) and total numbers (C) of PIR+ T cell progenitors per fetal liver. N(E12.5)=7/6; N(E13.5)=8/5; N(E14.5)=10/11; N(E15.5)=4/7. (D) FB from Fermt3+/+ and Fermt3-/- embryos were stained for lineage markers (B220, CD19, TER119, NK1.1, Gr-1 and Thy1.2), c-kit and PIR and analysed by flow cytometry. (E) Frequencies of circulating PIR+ T cell progenitors determined in (D). N(E11.5)=5; N(E12)=8/3; N(E12.5)=4/5; N(E13.5)=7/6. Numbers within the representative FACS plots indicate cell percentages. Bars indicate means ± standard errors. *p<0.05; **p<0.01; ***p<0.001.
Figure 7
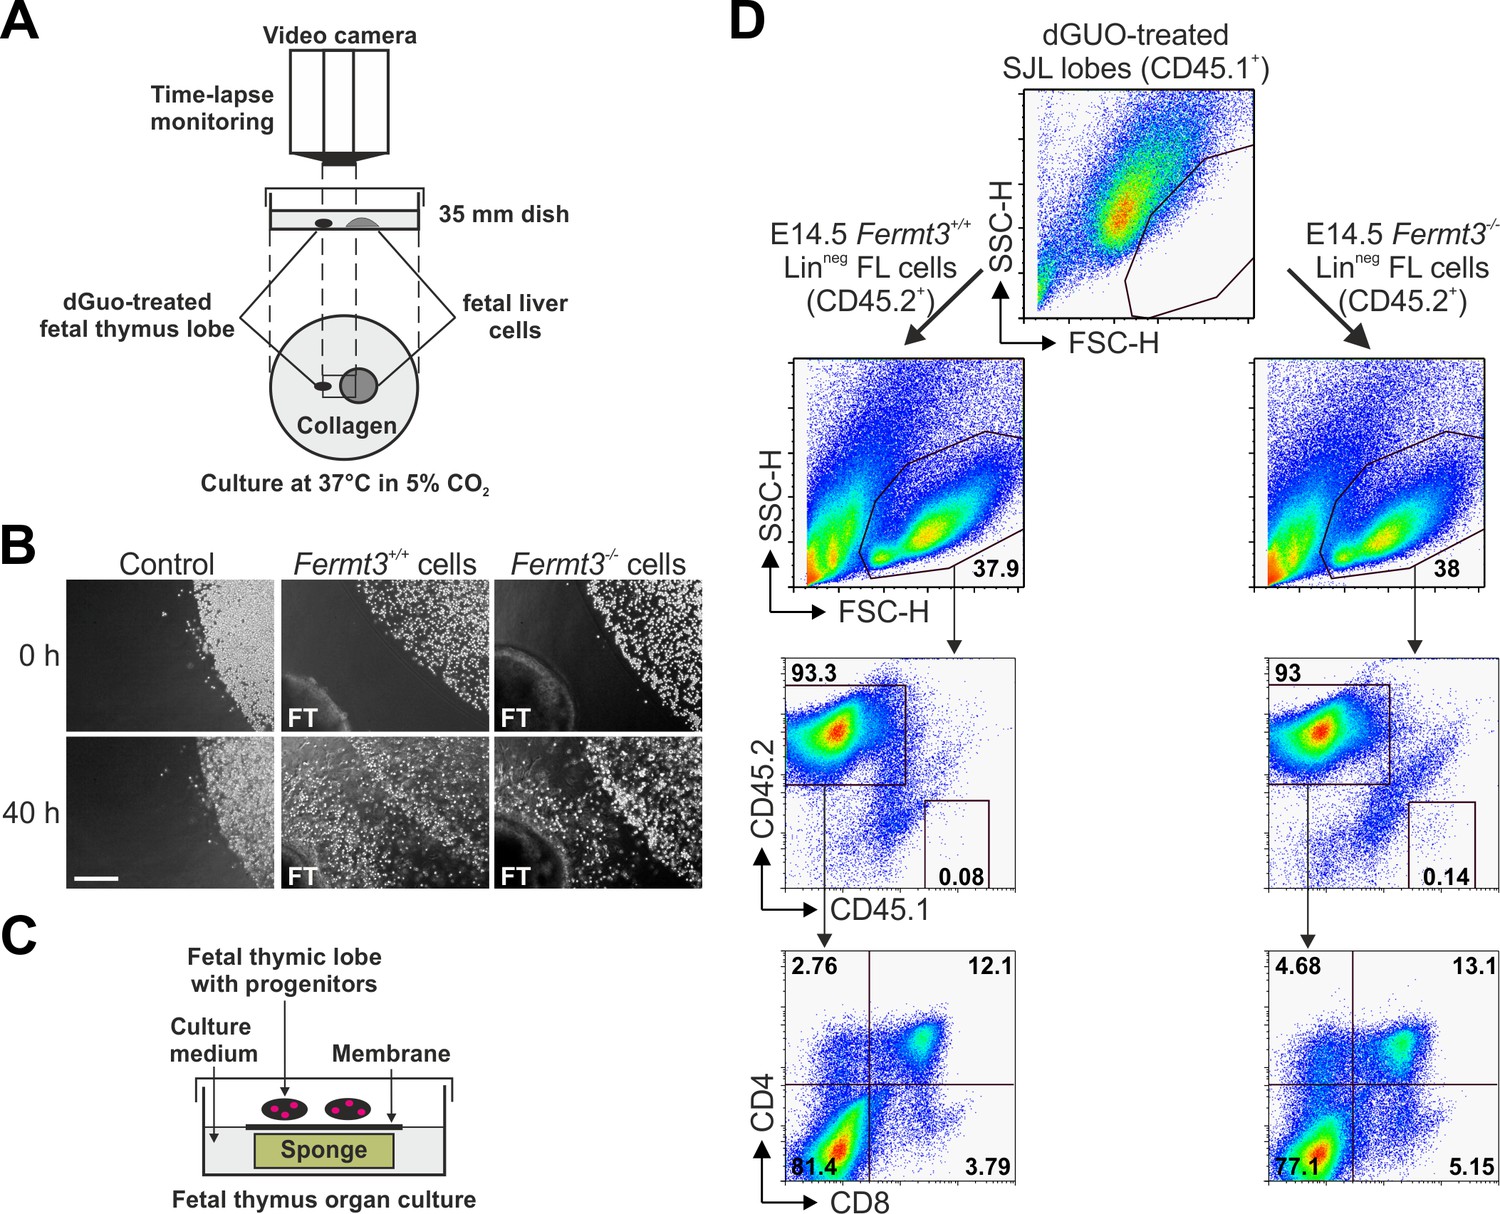
Kindlin-3-deficient T cell progenitors home to the fetal thymus and further develop into SP T cells ex vivo.
(A) Schematic description of the thymus attraction experiment. (B) Representative images of the thymus attraction experiment at the beginning and 40 hr after starting the experiment. Linneg fetal liver cells from control or Fermt3-/- embryos (both CD45.2+) are seen in the upper right corner of the images, a dGuo-treated wild-type fetal thymus lobe (FT, CD45.1+) is located at the lower left corner. Scale bar 250 µm. (C) Schematic description of the fetal thymus organ culture. (D) dGuo-treated fetal thymus lobes seeded with fetal liver cells as performed in (B) were further cultured for 18 days. Cells were stained for CD45.1, CD45.2, CD4, and CD8. Numbers within the representative FACS plots indicate cell percentages.
Figure 8 with 2 supplements
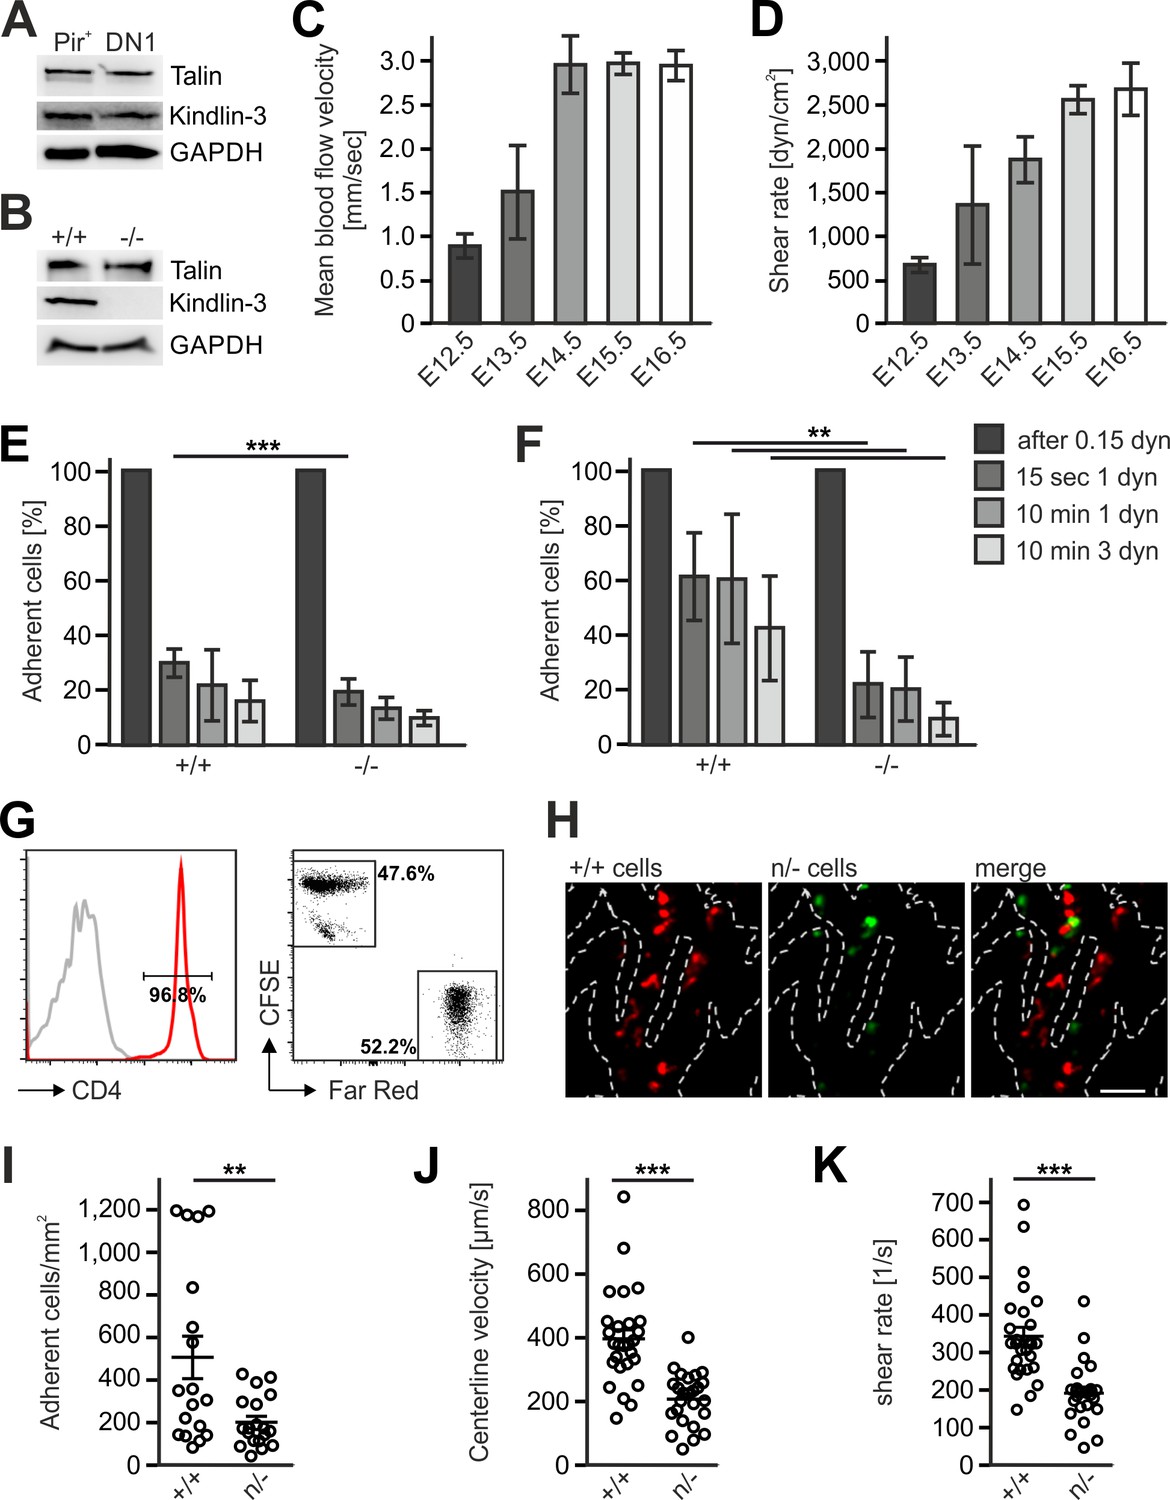
Kindlin-3 is important to stabilize the adhesion of T cell progenitors and mature T cells to vascular integrin ligands when blood flow velocities and shear rate levels increase during development and in vessel segments of higher blood flow within lymph nodes.
(A) Talin and kindlin-3 expression in FACS-sorted Pir+ T cell progenitor cells from WT FL of E13.5 embryos compared to DN1 cells sorted from the thymus of P6 mice. GAPDH served as loading control. (B) Talin and kindlin-3 expression in control and kindlin-3-/- Pir+ T cell progenitor cells isolated from E13.5 FL. GAPDH served as loading control. Mean blood flow velocities (C) and shear rates (D) within the yolk sac vasculature of E12.5 to E16.5 embryos were determined by intravital microscopy. N = 14/3/8/21/18. (E and F) Relative adhesion of Pir+ T cell progenitor cells FACS-sorted from the FLs of control and Fermt3-/- E13.5 embryos on ICAM-1, P-selectin, CCL21 and CCL25 or on VCAM-1, P-selectin, CCL21 and CCL25 coated ibidi flow chambers with stepwise increasing shear rates. N ≥ 5. Bars indicate means ± standard deviation. (G) Purity of CD4+ T cells from WT and Fermt3 hypomorphic (n/-) mice that have been labelled with CFSE and Far Red and mixed in a 1:1 ratio. Grey line represents isotype control. (H,I) Adhesion of CD4+ T cells in vivo. (H) Representative microscopic images of adherent (+/+, red) and (n/-, green) cells in the lymph node vasculature after adoptive transfer. Sum intensity Z projections of confocal stacks are shown. Segmented lines indicate vessel outlines. Scale bar = 50 µm. (I) Quantification of adherent CD4+ T cells (N = 18–19 vessels from three mice). (J, K) Microvascular blood flow in the lymph node vasculature. (J) Centerline blood flow velocity and (K) vascular shear rate in LN microvessel segments (N = 25–27 field of views from three mice). Bars indicate means ± standard deviation. **p<0.01; ***p<0.001. See also Figure 8—figure supplements 1 and 2.
Figure 8—figure supplement 1
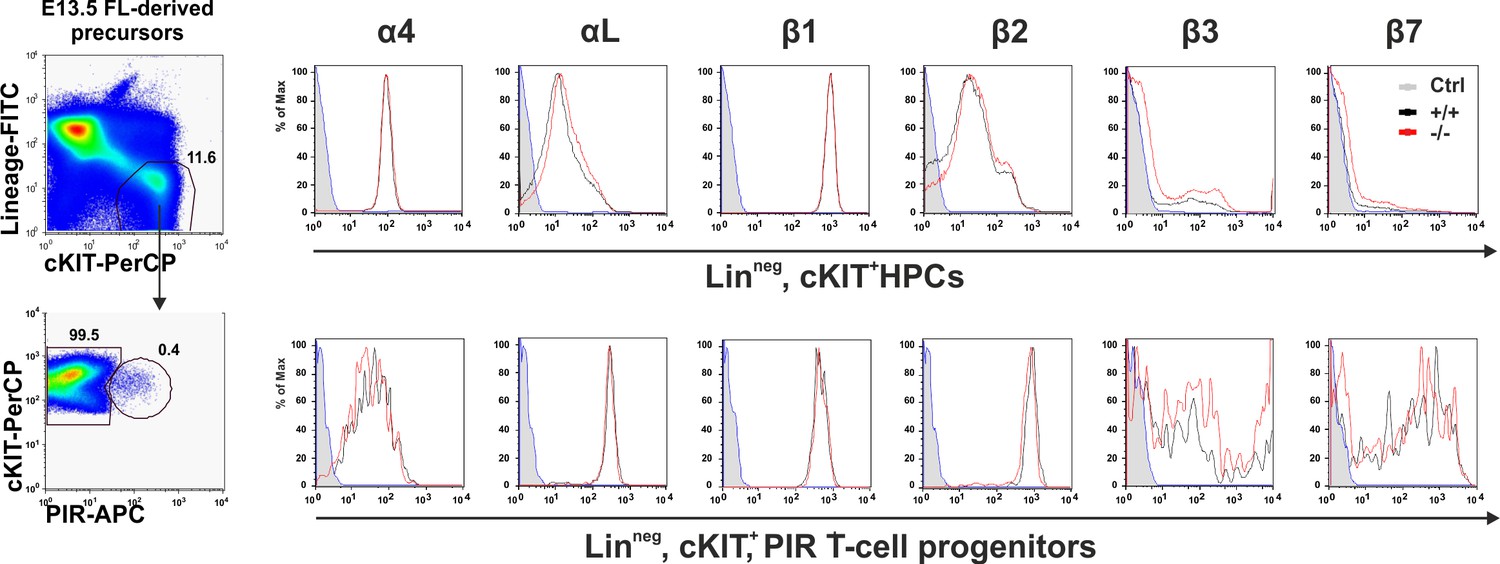
Kindlin-3 is important to stabilize the adhesion of T cell progenitors and mature T cells to vascular integrin ligands when blood flow velocities and shear rate levels increase during development and in vessel segments of higher blood flow within lymph nodes.
Surface expression of integrins on HPCs (Linneg, c-kit+) and T cell progenitors (Linneg, c-kit+, PIR+). FL cells from E13.5 control and Fermt3-/- embryos were stained for lineage markers (B220, CD19, TER119, NK1.1, Gr-1 and Thy1.2), c-kit, PIR and one of the indicated integrins.
Figure 8—figure supplement 2
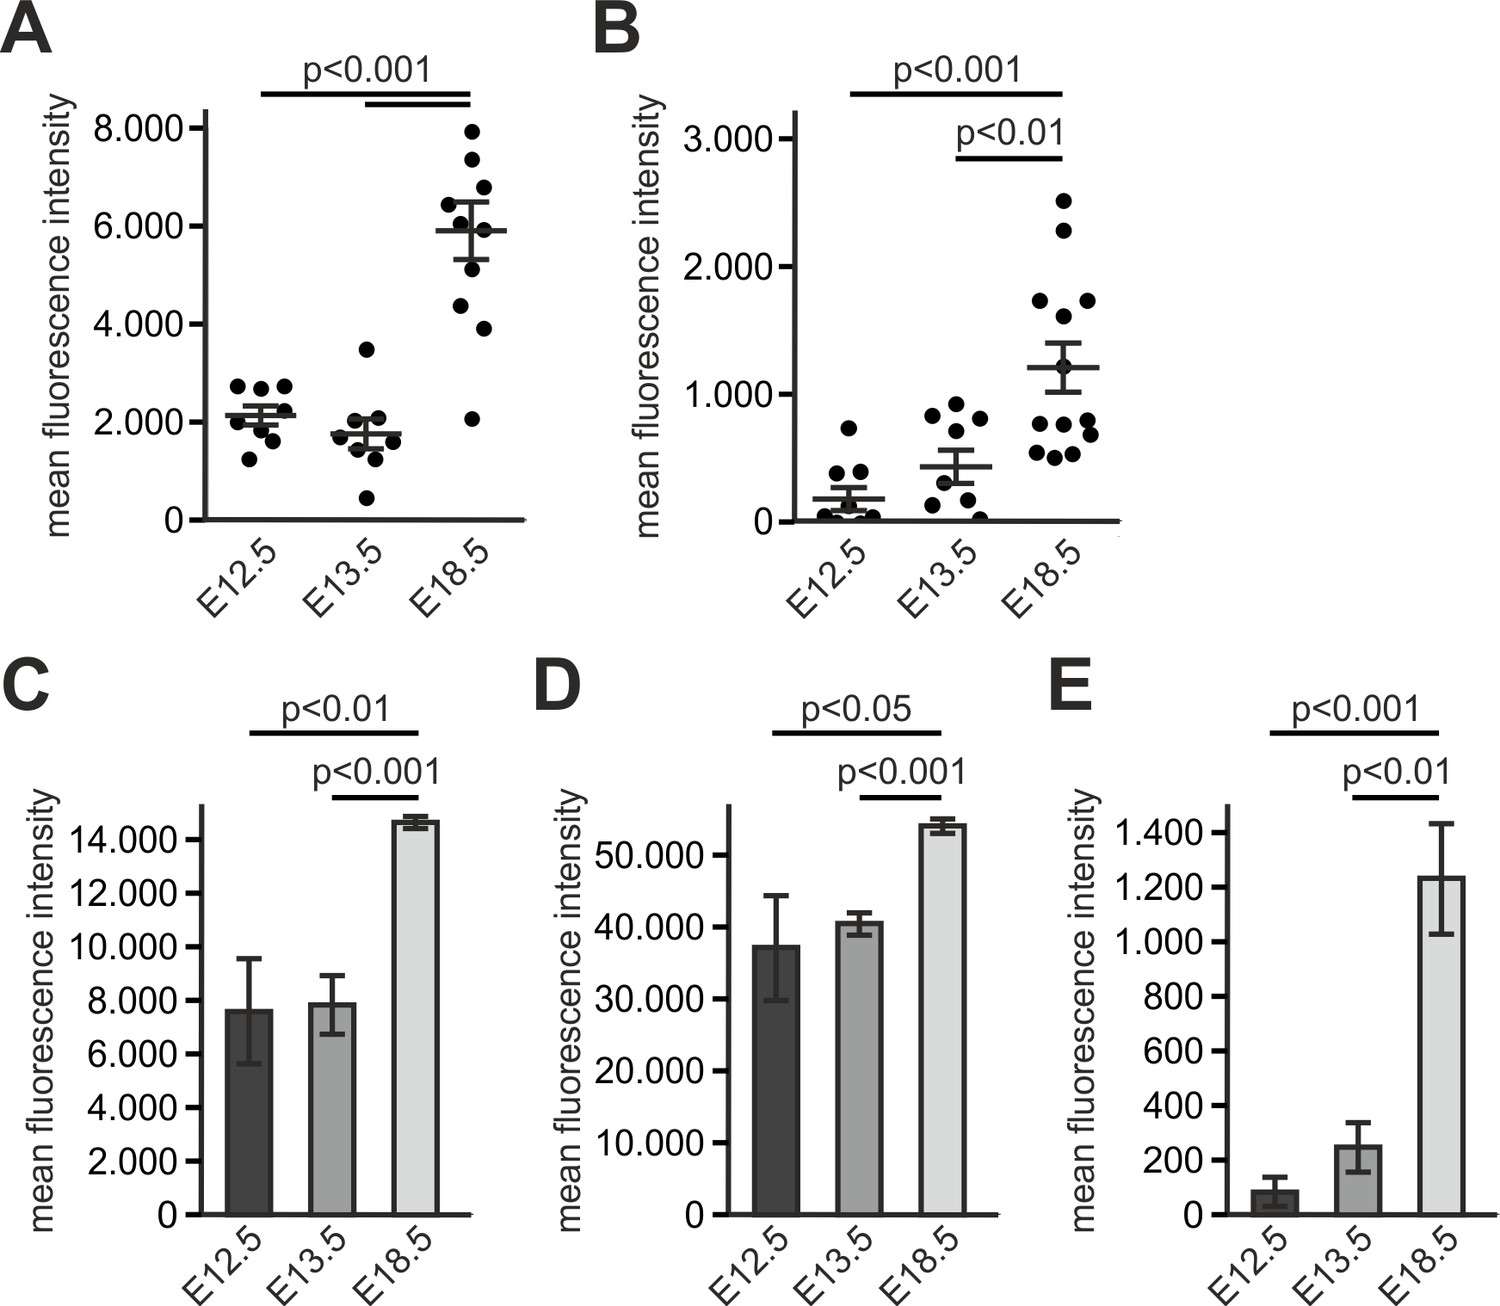
Kindlin-3 is important to stabilize the adhesion of T cell progenitors and mature T cells to vascular integrin ligands when blood flow velocities and shear rate levels increase during development and in vessel segments of higher blood flow within lymph nodes.
ICAM-1 (A) and VCAM-1 (B) expression was quantified by measuring the fluorescence intensities of immunofluorescence stainings of CD31+ pharyngeal vessels at E12.5 and E13.5 and intrathymic vessels at E18.5. N = 3. (C–E) Flow cytometric analysis of ICAM-1 (C), ICAM-2 (D) and VCAM-1 (E) expression of CD31+ endothelial cells from the thymus/neck region of E12.5, E13.5 and E18.5 embryos. N = 3. Bars indicate means ± standard deviation. Bars indicate means ±standard deviation.
Author response image 1
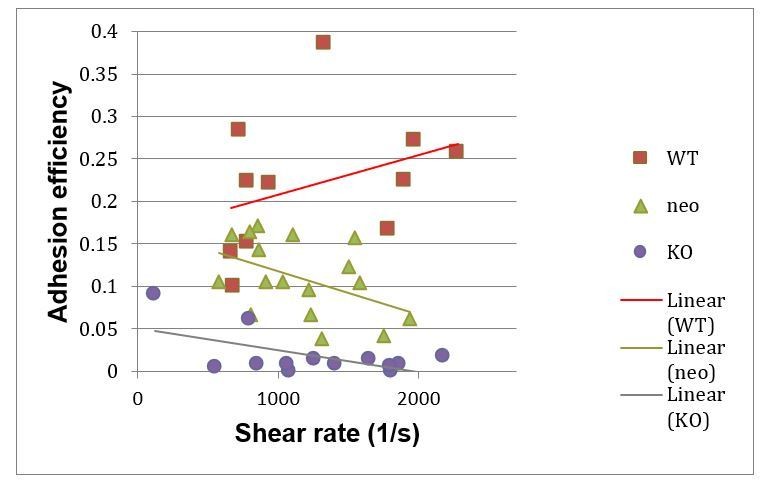
Adhesion efficiencies of PMNs in cremaster muscle venules of wild-type (WT), Kindlin-3 hypomorph (neo) mice and kindlin-3 knockout (KO) chimeras at indicated shear rates.
https://doi.org/10.7554/eLife.35816.020Tables
Key resources table
| Reagent type (species) or resource | Designation | Source or reference | Identifiers | Additional information |
|---|---|---|---|---|
| Genetic reagent (M.musculus) | Fermt3-/- | PMID: 18278053 | RRID: MGI:2147790 | Dr. Reinhard Fässler (Max Planck Institute of Biochemistry) |
| Genetic reagent (M.musculus) | Fermt3flox | PMID: 24089451 | RRID: MGI:5551978 | Dr. Reinhard Fässler (Max Planck Institute of Biochemistry) |
| Genetic reagent (M.musculus) | Fermt3n/- | PMID: 26438512 | RRID: MGI:3785479 | Dr. Reinhard Fässler (Max Planck Institute of Biochemistry) |
| Genetic reagent (M.musculus) | Rag2-/- | PMID: 1547487 | RRID: MGI:1858556 | Dr. Frederick W Alt (Howard Hughes Medical Institute) |
| Genetic reagent (M.musculus) | Mx1-Cre | PMID: 7660125 | RRID: MGI:2176073 | Dr. Klaus Rajewsky (Max Delbrück Center for Molecular Medicine) |
| Genetic reagent (M.musculus) | CD4-Cre | PMID: 11728338 | RRID: MGI: 2386448 | Dr. Christopher B. Wilson, (University of Washington) |
| Genetic reagent (M.musculus) | 2D2 | PMID: 12732654 | RRID: MGI:3700794 | Dr. Vijay K Kuchroo (Center for Neurologic Diseases) |
| Genetic reagent (M.musculus) | mTmG | PMID: 17868096 | RRID: MGI:3716464 | Dr. Liqun Luo (Howard Hughes Medical Institute) |
| Antibody | anti-B220-biotin | BD Pharmingen | Cat. #: 553085; RRID: AB_394615 | FACS (1:200) |
| Antibody | POD-coupled anti-BrdU | Roche | Cat. #: 11 585 860 001; RRID: AB_514485 | IHC (1:30) |
| Antibody | rabbit anti-mouse cleaved caspase-3 | Cell Signalling | Cat. #: 9661; RRID: AB_2341188 | IHC (1:100) |
| Antibody | anti-CD3e | eBioscience | Cat. #: 14-0031-82; RRID: AB_467049 | 10 µg/ml |
| Antibody | anti-CD3e-biotin | BD Pharmingen | Cat. #: 553060; RRID: AB_394593 | FACS (1:200) |
| Antibody | anti-CD3-PE | BD Pharmingen | Cat. #: 555275; RRID: AB_395699 | FACS (1:200) |
| Antibody | anti-CD4-biotin | BD Pharmingen | Cat. #: 553649; RRID: AB_394969 | FACS (1:200) |
| Antibody | anti-CD4-FITC | BD Pharmingen | Cat. #: 553651; RRID: AB_394971 | FACS (1:200) |
| Antibody | anti-CD4-PerCP | BD Pharmingen | Cat. #: 550954; RRID: AB_393977 | FACS (1:200) |
| Antibody | anti-CD5-PE | eBioscience | Cat. #: 12-0051-82; RRID: AB_465523 | FACS (1:200) |
| Antibody | anti-CD8α-biotin | BD Pharmingen | Cat. #: 553028; RRID: AB_394566 | FACS (1:200) |
| Antibody | anti-CD8-APC | eBioscience | Cat. #: 17-0081-81; RRID: AB_469334 | FACS (1:200) |
| Antibody | anti-CD8-PE | eBioscience | Cat. #: 12-0081-81; RRID: AB_465529 | FACS (1:200) |
| Antibody | anti-CD11b-biotin | BD Pharmingen | Cat. #: 557395; RRID: AB_2296385 | FACS (1:200) |
| Antibody | anti-CD11c-biotin | BD Pharmingen | Cat. #: 553800; RRID: AB_395059 | FACS (1:200) |
| Antibody | anti-CD16/CD32 | BD Pharmingen | Cat. #: 553142; RRID:AB_394657 | FACS (1:400) |
| Antibody | anti-CD19-biotin | eBioscience | Cat. #: 13-0193-82; RRID: AB_657656 | FACS (1:200) |
| Antibody | anti-CD24-PE | BD Pharmingen | Cat. #: 553262; RRID: AB_394741 | FACS (1:200) |
| Antibody | anti-CD25-FITC | BD Pharmingen | Cat. #: 553071; RRID: AB_394603 | FACS (1:200) |
| Antibody | anti-CD28 | eBioscience | Cat. #: 14-0281-82; RRID: AB_467190 | 2 µg/ml |
| Antibody | rat anti-CD31 (PECAM-1) | BD Pharmingen | Cat. #: 557355; RRID: AB_396660 | IHC (1:300) |
| Antibody | anti-CD31- Alexa Fluor 647 | Biolegend | Cat. #: 102415; RRID: AB_493411 | IHC (1:200) |
| Antibody | anti-CD31-eFLour450 | eBioscience | Cat. #: 48-0311-82; RRID: AB_10598807 | FACS (1:200) |
| Antibody | anti-CD44-PE | BD Pharmingen | Cat. #: 553134; RRID: AB_394649 | FACS (1:200) |
| Antibody | anti-CD45-FITC | eBioscience | Cat. #: 14-0451-82; RRID: AB_467251 | IHC (1:100) |
| Antibody | anti-CD45.2-biotin | BD Pharmingen | Cat. #: 553771; RRID: AB_395040 | FACS (1:200) |
| Antibody | anti-CD45.2-APC | eBioscience | Cat. #: 17-0454-82; RRID: AB_469400 | FACS (1:200) |
| Antibody | hamster anti- CD54 (ICAM) | BD Pharmingen | Cat. #: 553250; RRID: AB_394732 | IHC (1:100) |
| Antibody | goat anti- CD106 (VCAM) | R and D Systems | Cat. #: AF643; RRID: AB_355499 | IHC (1:80) |
| Antibody | anti-c-kit-APC | eBioscience | Cat. #: 17-1171-81; RRID: AB_469429 | FACS (1:200) |
| Antibody | anti-c-kit-PerCP | Biolegend | Cat. #: 105821; RRID: AB_893230 | FACS (1:200) |
| Antibody | mouse anti-pan -cytokeratin | Sigma-Aldrich | Cat. #: C2562; RRID: AB_476839 | IHC (1:400) |
| Antibody | anti-EpCAM-APC -eFlour780 | Thermo Fisher Scientific | Cat. #: 47-5791-82; RRID: AB_2573986 | FACS (1:200) |
| Antibody | rat anti-ER-TR4 | Eric Vroegindeweij (Princess Maxima center of pediatric oncology) | IHC undiluted | |
| Antibody | rat anti-ER-TR5 | Eric Vroegindeweij (Princess Maxima center of pediatric oncology) | IHC undiluted | |
| Antibody | anti-F4/80-biotin | Bio-Rad | Cat. #: MCA497GA; RRID: AB_323806 | FACS (1:200) |
| Antibody | alexa-fluor-488- conjugated anti- Fluorescin IgG | Thermo Fisher Scientific | Cat. #: A-11090; RRID: AB_221562 | IHC (1:500) |
| Antibody | rat anti-ICAM-1 PE | Biolegend | Cat. #:116107; RRID: AB_313698 | FACS (1:200) |
| Antibody | rabbit anti-Fibronectin | Merck Millipore | Cat. #: AB2033; RRID: AB_2105702 | IHC (1:300) |
| Antibody | mouse anti-GAPDH | Merck Millipore | Cat. #: CB1001; RRID: AB_2107426 | WB (1:20.000) |
| Antibody | anti-Gr-1-biotin | BD Pharmingen | Cat. #: 553125; RRID: AB_394641 | FACS (1:200) |
| Antibody | alexa-fluor-546 -conjugated anti-goat IgG | Thermo Fisher Scientific | Cat: #: A-11056; RRID: AB_2534103 | IHC (1:300) |
| Antibody | alexa-fluor-546- conjugated anti-hamster IgG | Thermo Fisher Scientific | Cat: #: A-21111; RRID: AB_2535760 | IHC (1:300) |
| Antibody | alexa-fluor-546- conjugated anti-mouse IgG | Thermo Fisher Scientific | Cat: #: A-11003; RRID: AB_2534071 | IHC (1:300) |
| Antibody | alexa-fluor-647 -conjugated anti-mouse IgG | Thermo Fisher Scientific | Cat: #: A-31571; RRID: AB_162542 | IHC (1:300) |
| Antibody | alexa-fluor-647 -conjugated anti-rabbit IgG | Thermo Fisher Scientific | Cat: #: A-21244; RRID: AB_2535812 | IHC (1:300) |
| Antibody | alexa-fluor-488- conjugated anti-rat IgG | Thermo Fisher Scientific | Cat: #: A-11006; RRID: AB_2534074 | IHC (1:300) |
| Antibody | alexa-fluor-647- conjugated anti-rat IgG | Thermo Fisher Scientific | Cat: #: A-21247; RRID: AB_141778 | IHC (1:300) |
| Antibody | anti-Integrin α4-PE | BD Pharmingen | Cat. #: 553157; RRID: AB_394670 | FACS (1:200) |
| Antibody | anti-Integrin αL-PE | BD Pharmingen | Cat. #: 553121; RRID: AB_394637 | FACS (1:200) |
| Antibody | anti-Integrin β1-PE | Biolegend | Cat. #: 102207; RRID: AB_312884 | FACS (1:200) |
| Antibody | anti-Integrin β2-PE | BD Pharmingen | Cat. #: 553293; RRID: AB_394762 | FACS (1:200) |
| Antibody | anti-Integrin β3-PE | eBioscience | Cat. #: 12-0611-81; RRID: AB_465717 | FACS (1:200) |
| Antibody | anti-Integrin β7-PE | BD Pharmingen | Cat. #: 557498; RRID: AB_396735 | FACS (1:200) |
| Antibody | rabbit anti-Kindlin-1 | Markus Moser (MPI of Biochemistry) | WB (1:1000) | |
| Antibody | mouse anti-Kindlin-2 | Sigma-Aldrich | Cat. # SAB4200525 -200UL | WB (1:1000) |
| Antibody | rabbit anti-Kindlin-3 | Markus Moser (MPI of Biochemistry) | WB (1:3000) | |
| Antibody | rabbit anti-pan-laminin | Rupert Timpl | IHC (1:700) | |
| Antibody | anti-LFA-1-PE | BD Pharmingen | Cat. #: 553121; RRID: AB_394637 | IF (1:100) |
| Antibody | anti-NK1.1-biotin | BD Pharmingen | Cat. #: 553163; RRID: AB_394675 | FACS (1:200) |
| Antibody | anti-PIR-APC | eBioscience | Cat. #: 17-3101-82; RRID: AB_1944406 | FACS (1:200) |
| Antibody | anti-PIR-PE | BD Pharmingen | Cat. #: 550349; RRID: AB_393628 | FACS (1:200) |
| Antibody | anti-p-Tyrosine | Santa Cruz Biotechnology | Cat. #: sc-7020; RRID: AB_628123 | IF (1:50) |
| Antibody | anti-Sca-1-PE | eBioscience | Cat. #: 12-5981-82; RRID: AB_466086 | FACS (1:200) |
| Antibody | mouse anti-talin | Sigma-Aldrich | Cat. #: T3287; RRID: AB_477572 | WB (1:20.000) |
| Antibody | anti-TCRβ-PE | eBioscience | Cat. #: 12-5961-82; RRID: AB_466066 | FACS (1:200) |
| Antibody | anti-TCRγδ-biotin | BD Pharmingen | Cat. #: 553176; RRID: AB_394687 | FACS (1:200) |
| Antibody | anti-Ter119-biotin | BD Pharmingen | Cat. #: 553672; RRID: AB_394985 | FACS (1:200) |
| Antibody | anti-Thy1.2-biotin | BD Pharmingen | Cat. #: 553001; RRID: AB_394540 | FACS (1:200) |
| Antibody | rat anti-VCAM-1 PE | Biolegend | Cat. #: 105713; RRID: AB_1134166 | FACS (1:200) |
| Peptide, recombinant protein | recombinant mouse CCL21 | R and D Systems | Cat. #: 457–6C; Accession #: P84444.1 | |
| Peptide, recombinant protein | recombinant mouse CCL25 | R and D Systems | Cat. #: 481-TK; Accession #: O35903.1 | |
| Peptide, recombinant protein | recombinant mouse ICAM-1-FC | R and D Systems | Cat. #: 796-IC; Accession #: Q3U8M7 | |
| Peptide, recombinant protein | MOG35-55 | MPI of Biochemistry, Core facility | ||
| Peptide, recombinant protein | recombinant mouse P-Selectin-FC | R and D Systems | Cat. #: 737-PS; Accession #: Q01102 | |
| Peptide, recombinant protein | recombinant mouse VCAM-1-FC | R and D Systems | Cat. #: 643-VM; Accession #: CAA47989 | |
| Commercial assay or kit | PE Annexin V Apoptosis Detection Kit | BD Biosciences | Cat. #: 559763 | |
| Commercial assay or kit | BrdU Flow Kit | BD Pharmingen | Cat. #: 559619; RRID: AB_2617060 | |
| Commercial assay or kit | anti-biotin MicroBeads | Miltenyi | Cat. #: 130-090-485; RRID: AB_244365 | |
| Commercial assay or kit | CD4 T cell isolation kit | Miltenyi | Cat. #: 130-104-454 | |
| Commercial assay or kit | Vectastain Elite ABC HRP Kit, rabbit IgG | VECTOR laboratories | Cat. #: PK-6101; RRID: AB_2336820 | |
| Chemical compound, drug | CellTrace CFSE Cell Proliferation Kit | Thermo Fisher Scientific | Cat. #: C34554 | |
| Chemical compound, drug | Collagenase D | Sigma-Aldrich | Cat. #: C0130 | 1 mg/ml |
| Chemical compound, drug | FITC-Dextran | Sigma-Aldrich | Cat. #: FD150S | |
| Chemical compound, drug | DNaseI | Sigma-Aldrich | Cat. #: D5025 | 100 U/ml |
| Chemical compound, drug | dGuo | Sigma-Aldrich | Cat. #: D0901 | 1.35 mM |
| Chemical compound, drug | CellTrace Far Red Cell Proliferation Kit | Thermo Fisher Scientific | Cat. #: C34564 | 1 µM |
| Chemical compound, drug | FluoSpheres 580/606 | Thermo Fisher Scientific | Cat. #: F8821 | 1 µM |
| Chemical compound, drug | LPS | Sigma-Aldrich | Cat. #: L2654 | 1 mg/ml |
| Chemical compound, drug | poly-L-Lysine | Sigma-Aldrich | Cat. #: P8920 | pure |
| Chemical compound, drug | Phalloidin Alexa350 | Thermo Fisher Scientific | Cat. #: A22281 | IF (1:40) |
| Chemical compound, drug | PureCol | Advanced BioMatrix | Cat. #: 5005–100 ML | |
| Chemical compound, drug | Streptavidin Cy3 | Jackson Immuno Research | Cat. #: 016-160-084; RRID: AB_2337244 | FACS (1:400) |
| Chemical compound, drug | Streptavidin FITC | Thermo Fisher Scientific | Cat. #: SA10002 | FACS (1:200) |
| Chemical compound, drug | Streptavidin PerCP-Cy5.5 | BD Pharmingen | Cat. #: 551419 | FACS (1:200) |
| Software, algorithm | ImageJ | National Institute of Health | RRID:SCR_003070 | |
| Software, algorithm | ImSpector Pro | LaVision BioTec GmbH | ||
| Software, algorithm | Photoshop | Adobe | RRID:SCR_014199 | |
| Software, algorithm | Slidebook 6.0.8 Software | Intelligant Imaging Innovations | RRID:SCR_014300 | |
| Software, algorithm | VirtualDub | GNU General Public License (GPL) | ||
| Other | Glass Bottom Microwell Dishes | MatTek Corporation | Cat. #: P35G-1.5–20 C | |
| Other | Ibidi flow chambers µ-Slide I 0.8 Luer IbiTreat | Ibidi | Cat. #: 80196 |
Additional files
-
Transparent reporting form
- https://doi.org/10.7554/eLife.35816.018
Download links
A two-part list of links to download the article, or parts of the article, in various formats.
Downloads (link to download the article as PDF)
Open citations (links to open the citations from this article in various online reference manager services)
Cite this article (links to download the citations from this article in formats compatible with various reference manager tools)
Differential requirement of kindlin-3 for T cell progenitor homing to the non-vascularized and vascularized thymus
eLife 7:e35816.
https://doi.org/10.7554/eLife.35816


