Trajectories of childhood immune development and respiratory health relevant to asthma and allergy
- Baker Heart and Diabetes Institute, Australia
- The University of Melbourne, Australia
- University of Cambridge, United Kingdom
- Imperial College London, United Kingdom
- University of Wisconsin School of Medicine and Public Health, United States
- Telethon Kids Institute, University of Western Australia, Australia
- National Heart and Lung Institute, Imperial College London, United Kingdom
- The University of Manchester, United Kingdom
- The University of Queensland, Australia
- The London School of Hygiene and Tropical Medicine, United Kingdom
- The Alan Turing Institute, United Kingdom
Figures
Figure 1 with 3 supplements

Non-parametric mixture-model-based clustering of CAS dataset, based on 174 features.
SPT = skin prick test. White spaces within the heatmap indicate missing data. Rows represent individuals; columns represent clustering features with general categories as labelled on grey background. Variables with grey background are clustering features ordered by category or type of variable first (e.g. all HDM IgE-related variables grouped together), then by timepoint (earlier to later, from left to right). Variables with lilac background indicate resultant cluster membership and outcome variable (age-5 wheeze). Heatmap values are scaled relative to range and median values for each feature; the median is coloured beige-yellow, the median +range red, and median – range blue. For sex, −1/blue = female, 0/yellow (median) = male.
Figure 1—figure supplement 1
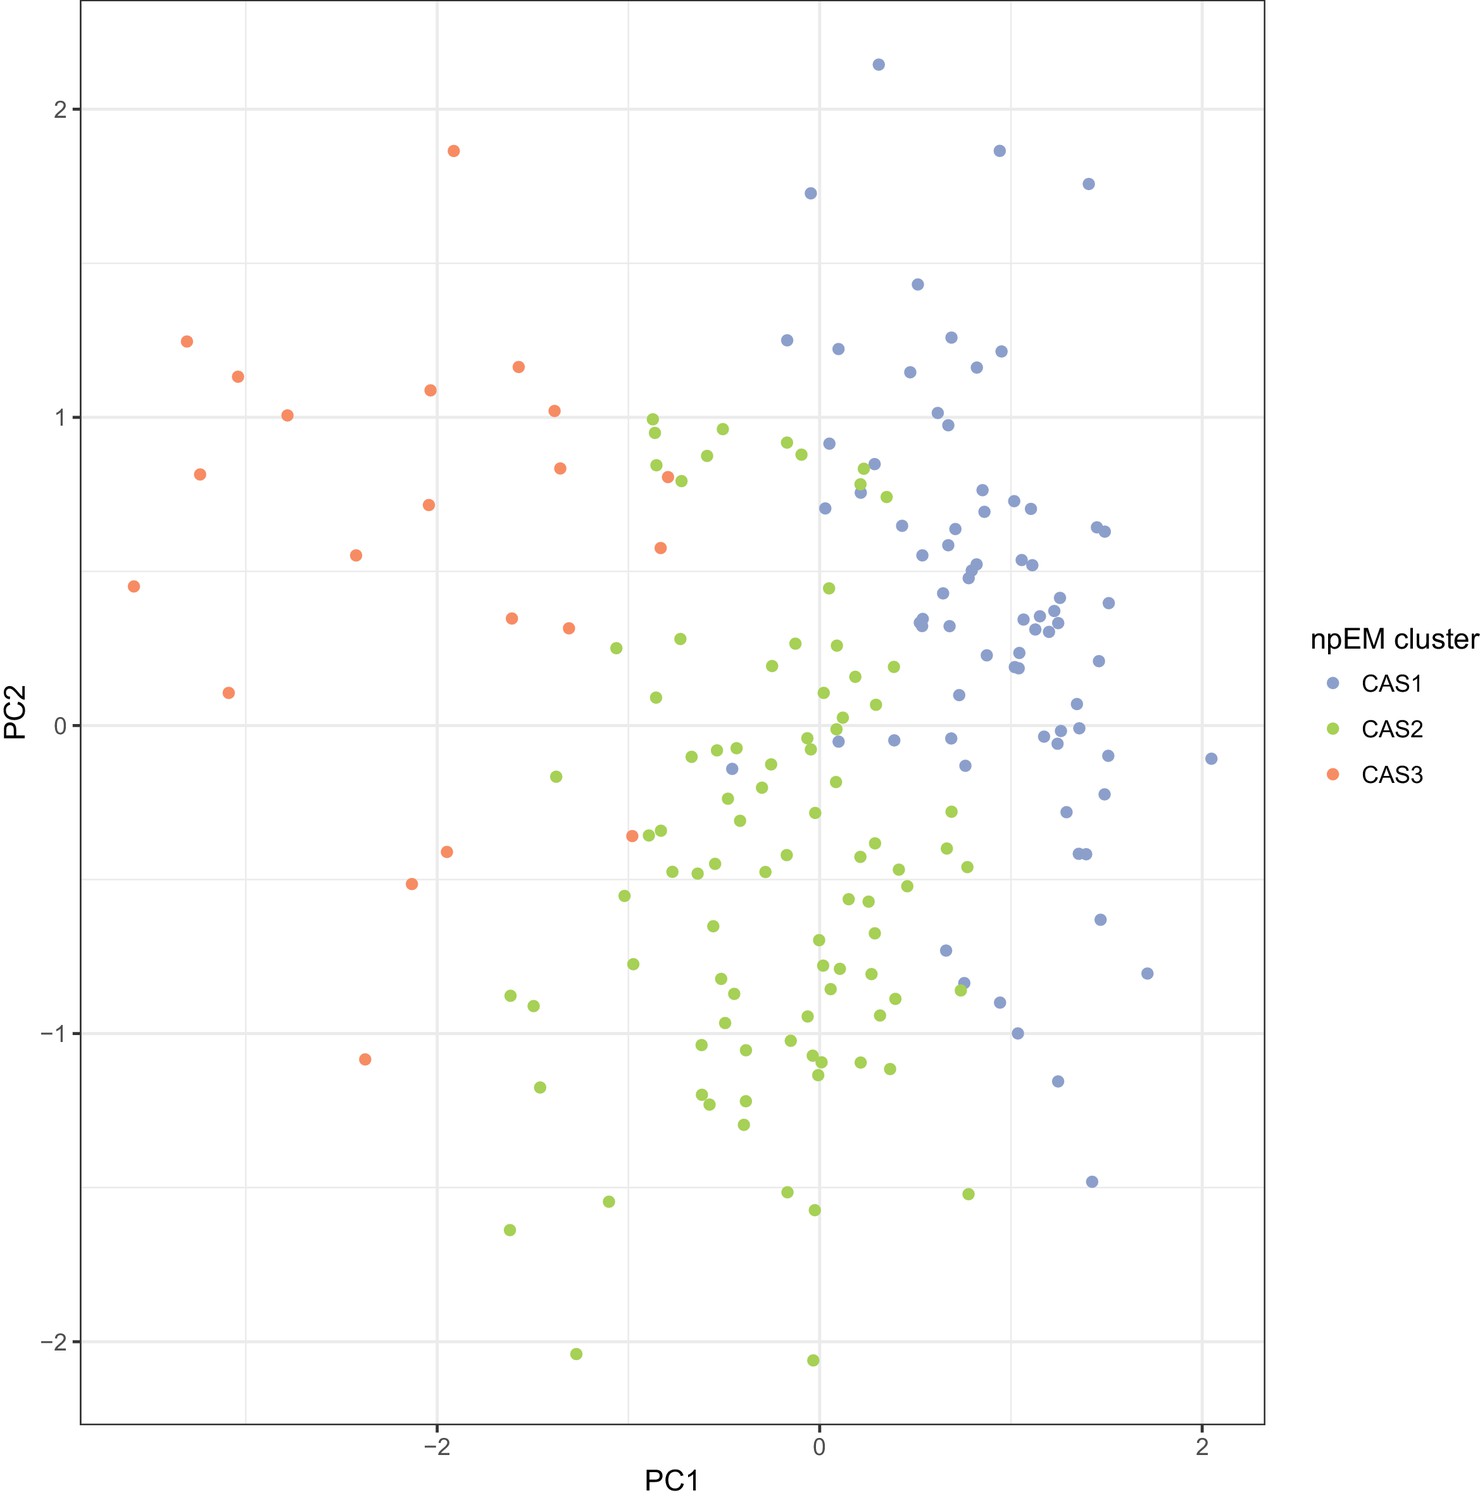
Scatterplot of principal components analysis (PCA) of the complete-case CAS dataset (N = 186), with points coloured by npEM clusters Each point represents an individual.
The first two PCs (shown) account for 16.7% of the total variance.
Figure 1—figure supplement 2
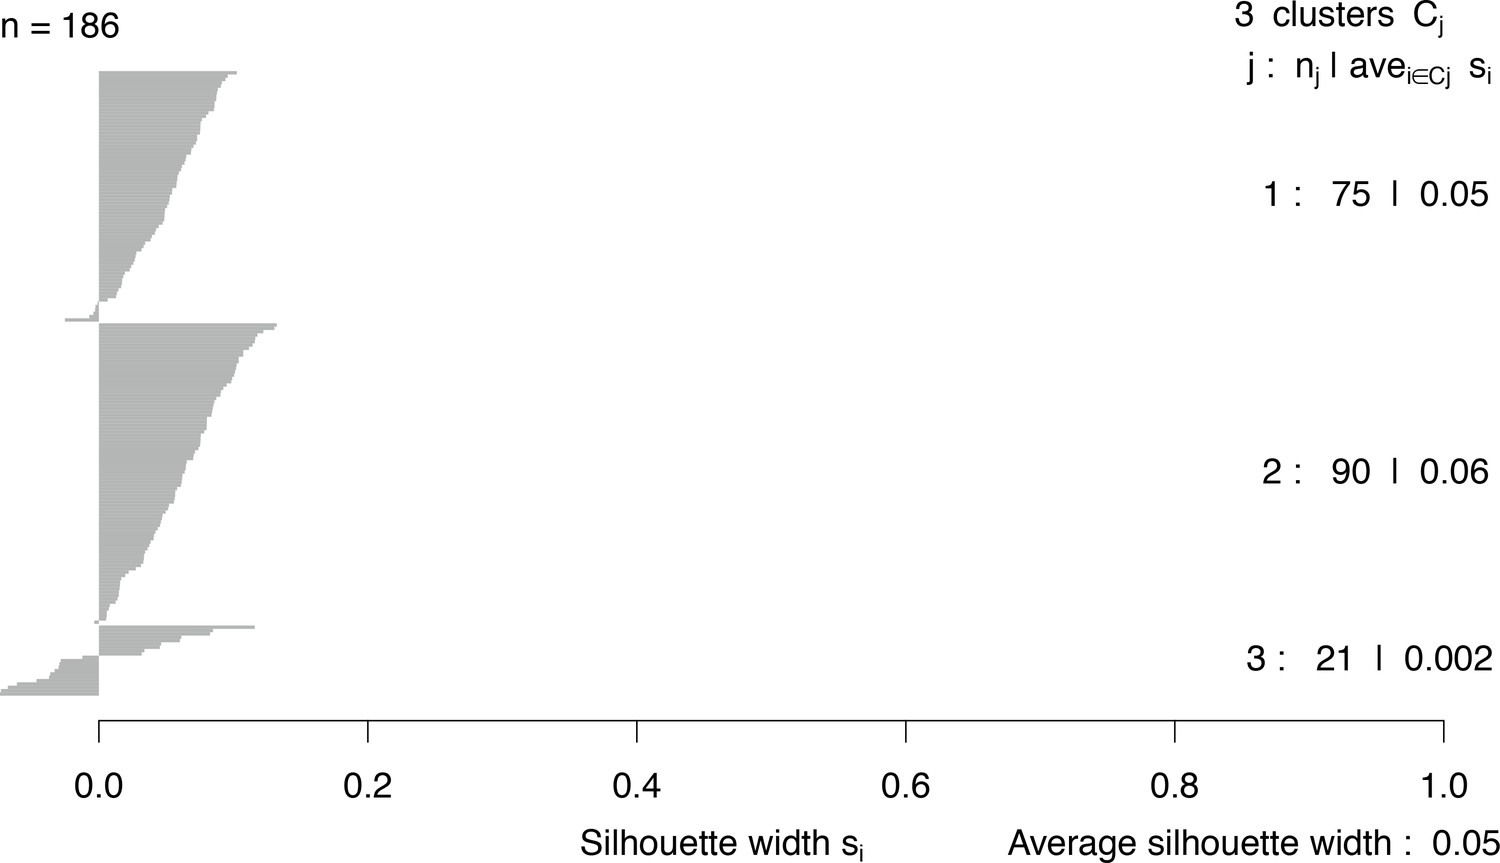
Silhouette widths of clusters generated by npEM.
j = cluster number; nj = cluster size; avei∈Cjsi = average silhouette width among members i of cluster Cj. Overall average silhouette width across all clusters is also given.
Figure 1—figure supplement 3

Overview of study methodology.
Dashed arrows indicate non-critical elements of our method.
Figure 2
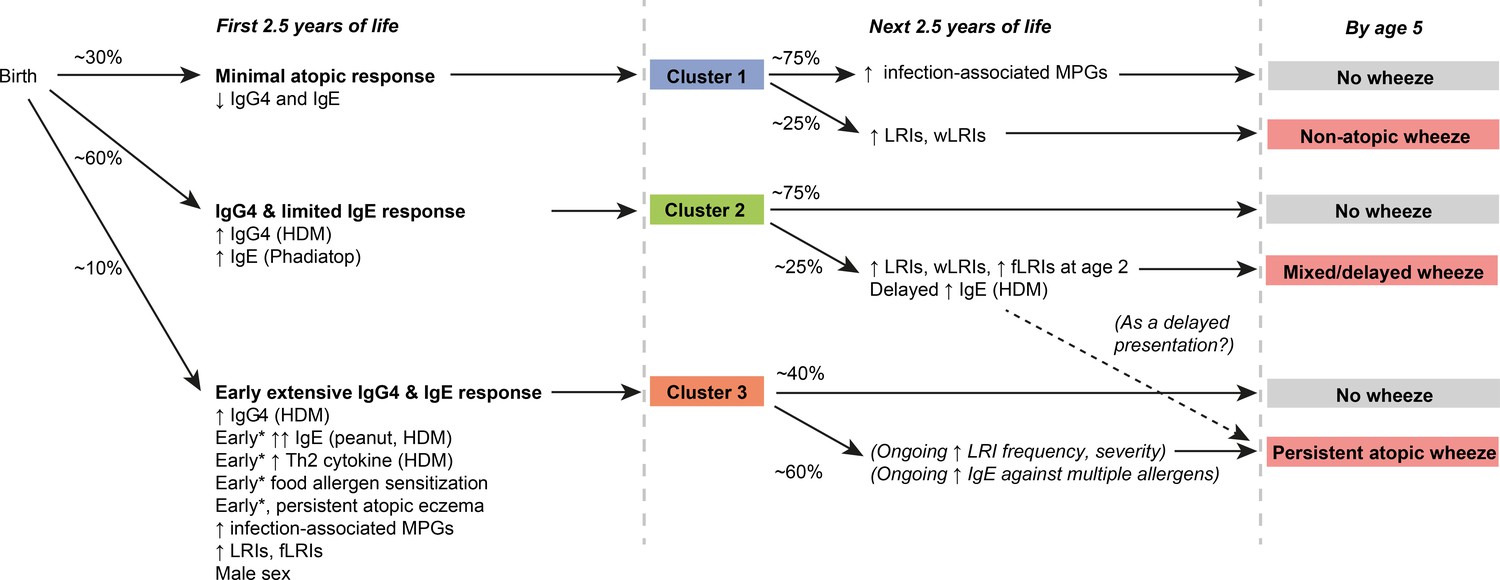
Graphical summary of proposed clusters *‘Early’ specifically refers to ‘within the first 6 months of life’.
https://doi.org/10.7554/eLife.35856.007
Figure 3 with 1 supplement
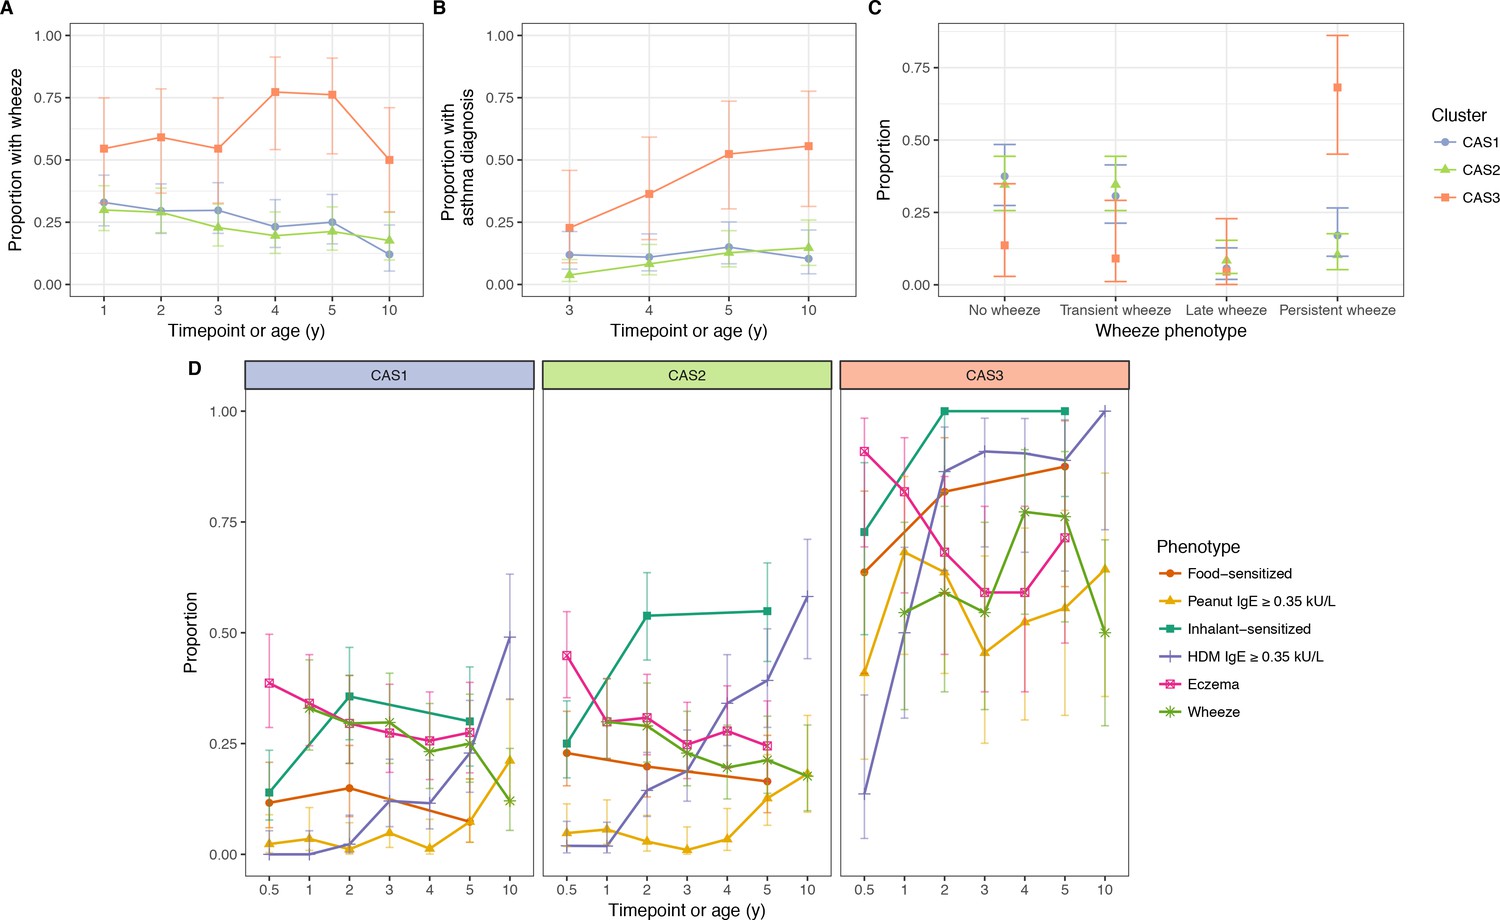
Incidence of multiple phenotypes, including parent-reported wheeze.
(A) Physician-diagnosed asthma (B) defined wheeze phenotypes (C) in relation to food and inhalant sensitisation (D) stratified by cluster and time in the CAS dataset. Points indicate observed proportion; bars indicate 95% CI (binomial distribution). Wheeze phenotypes defined as: no wheeze = no wheeze at ages 1 to 3, or age 5; transient wheeze = any wheeze at ages 1 to 3, but not age 5; late wheeze = wheeze at age 5, but not ages 1 to 3; persistent wheeze = any wheeze at both ages 1 to 3 and age 5. Food sensitisation defined as peanut IgE ≥0.35 kU/L at any age, or cow’s milk, egg white, peanut SPT > 2 or 3 mm for age ≤2 or>2 respectively. Inhalant sensitisation defined as HDM, cat, couchgrass, ryegrass, mould or Phadiatop IgE ≥0.35 kU/L at any age, or mould SPT (Alternaria or Aspergillus spp.)>2 or 3 mm for age ≤2 or>2, respectively.
Figure 3—figure supplement 1
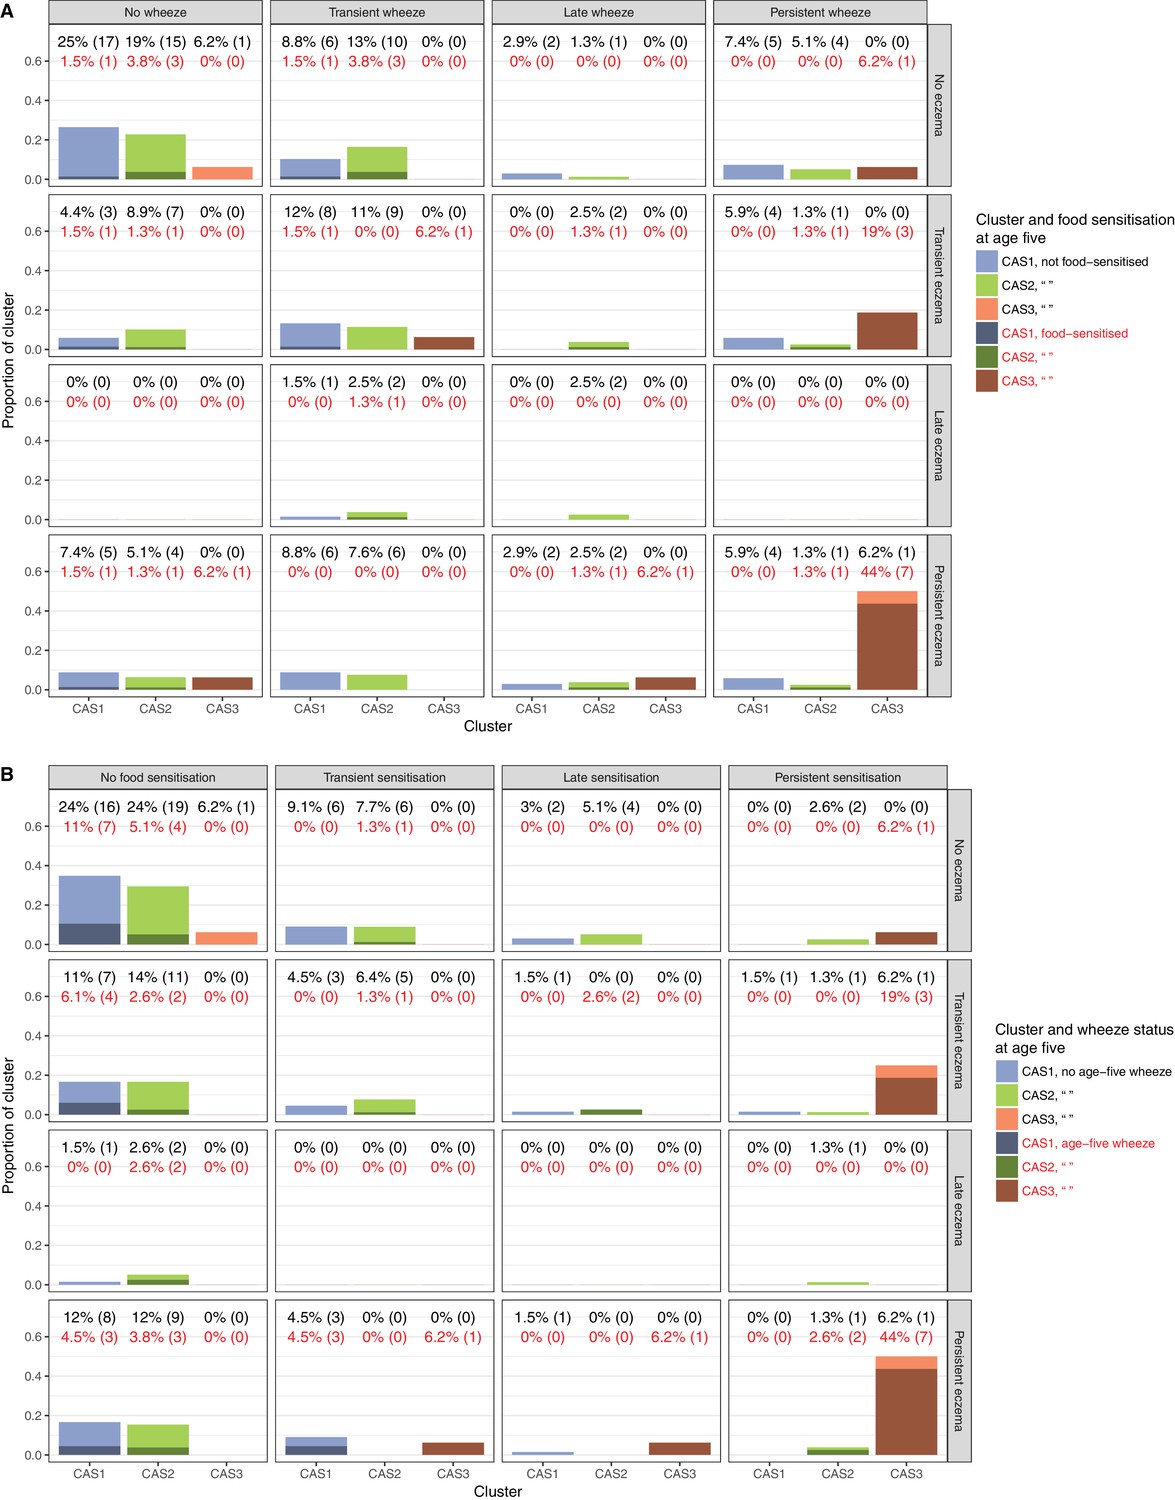
Relationship of clusters to food sensitisation, eczema and wheeze.
Percentages denote proportion of cluster displaying phenotype (numbers in brackets denote actual sample numbers). Food sensitisation defined as peanut IgE ≥0.35 kU/L at any age, or cow’s milk, egg white, peanut SPT > 2 or 3 mm for age ≤2 or>2, respectively. Subphenotypes defined for food sensitisation, eczema and wheeze as: no phenotype = phenotype absent at all ages; transient = any incidence of phenotype at the earlier ages (1 to 3 for wheeze, 6 m to three for eczema, 6 m to two for sensitisation), but not age 5; late = phenotype at age 5, but not the earlier ages; persistent = any incidence of phenotype at both earlier ages and age 5.
Figure 4 with 2 supplements
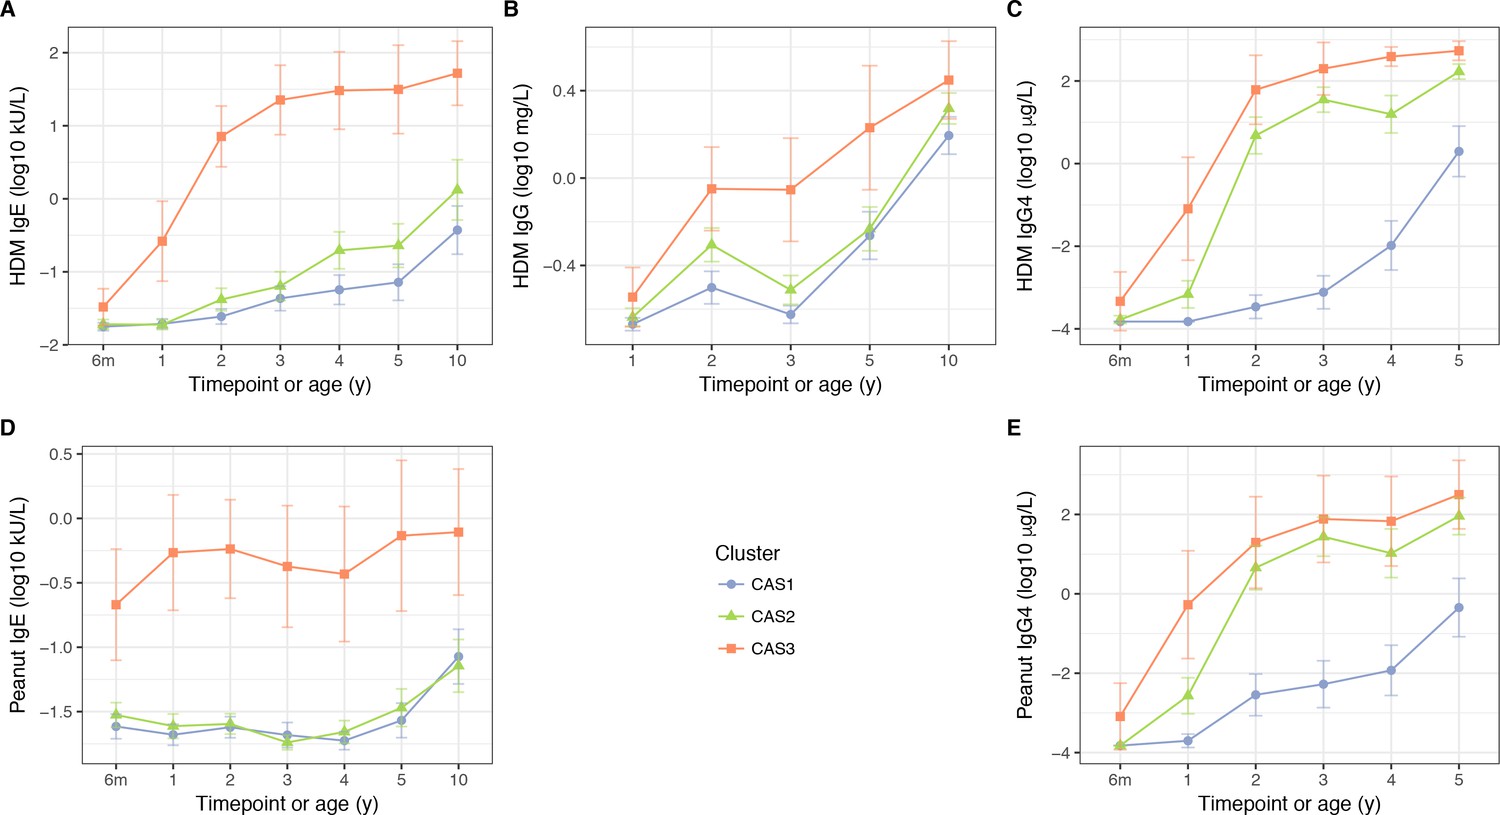
HDM IgE (A), IgG (B) and IgG4 (C); and peanut IgE (D) and IgG4 (E) stratified by cluster and time, in the CAS dataset Points indicate means; bars indicate 95% CI (t-distribution).
https://doi.org/10.7554/eLife.35856.010
Figure 4—figure supplement 1
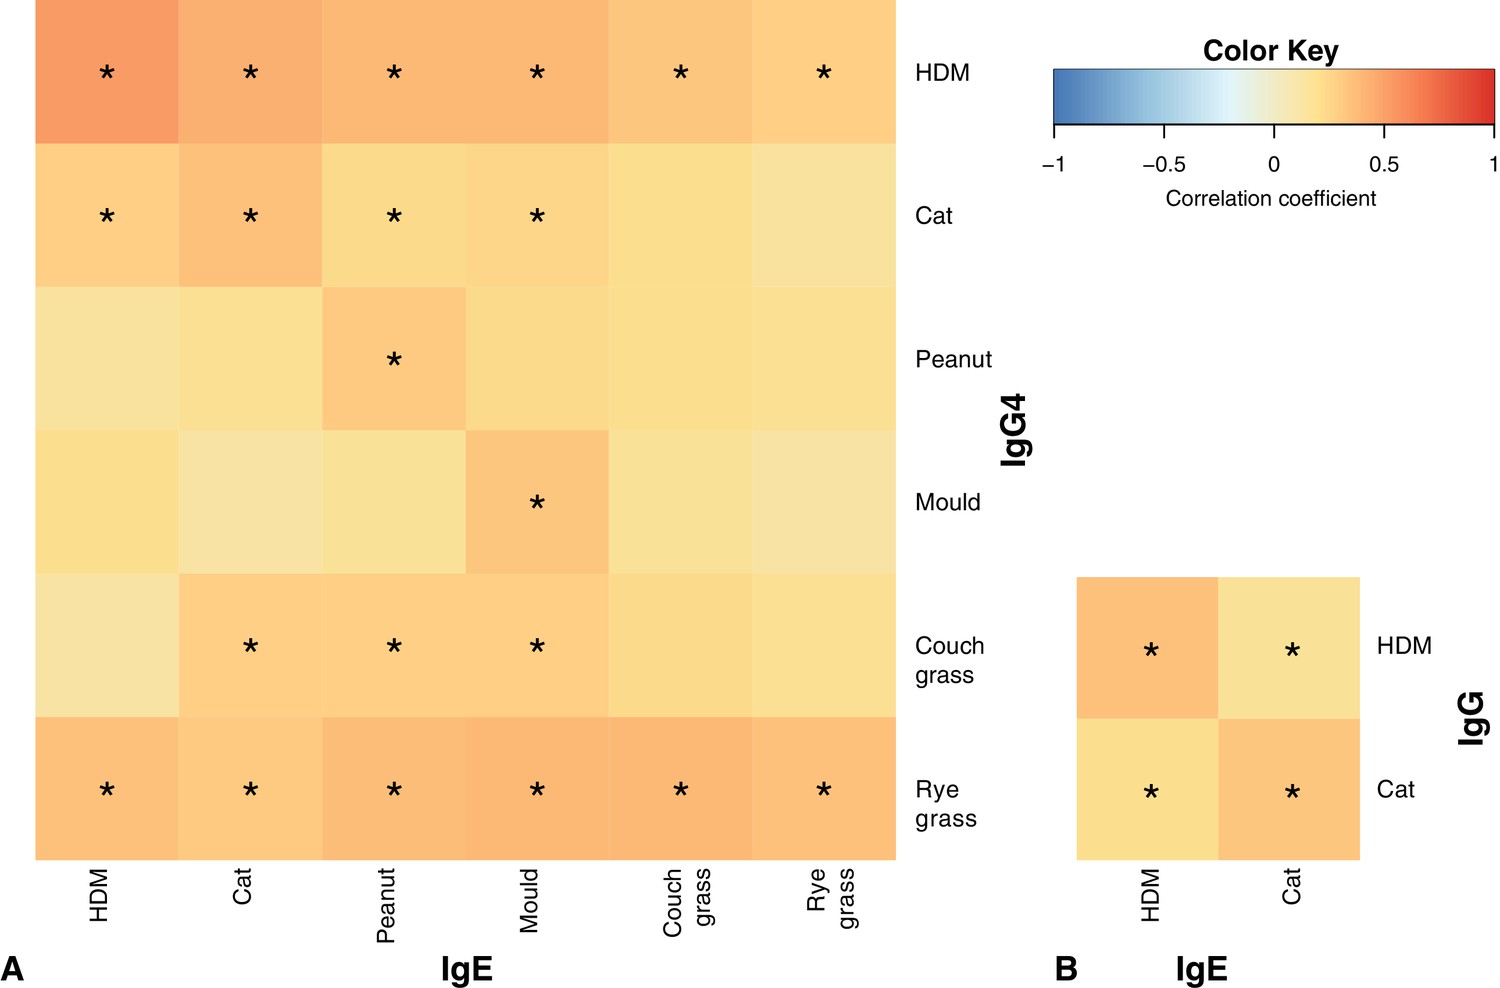
Correlation patterns between IgE vs IgG4 (A) and IgE vs IgG (B) at age five *p<0.05 for Spearman correlation with Holm correction for multiple testing.
Note the slightly stronger heat along the main diagonals of both heatmaps, especially for HDM.
Figure 4—figure supplement 2
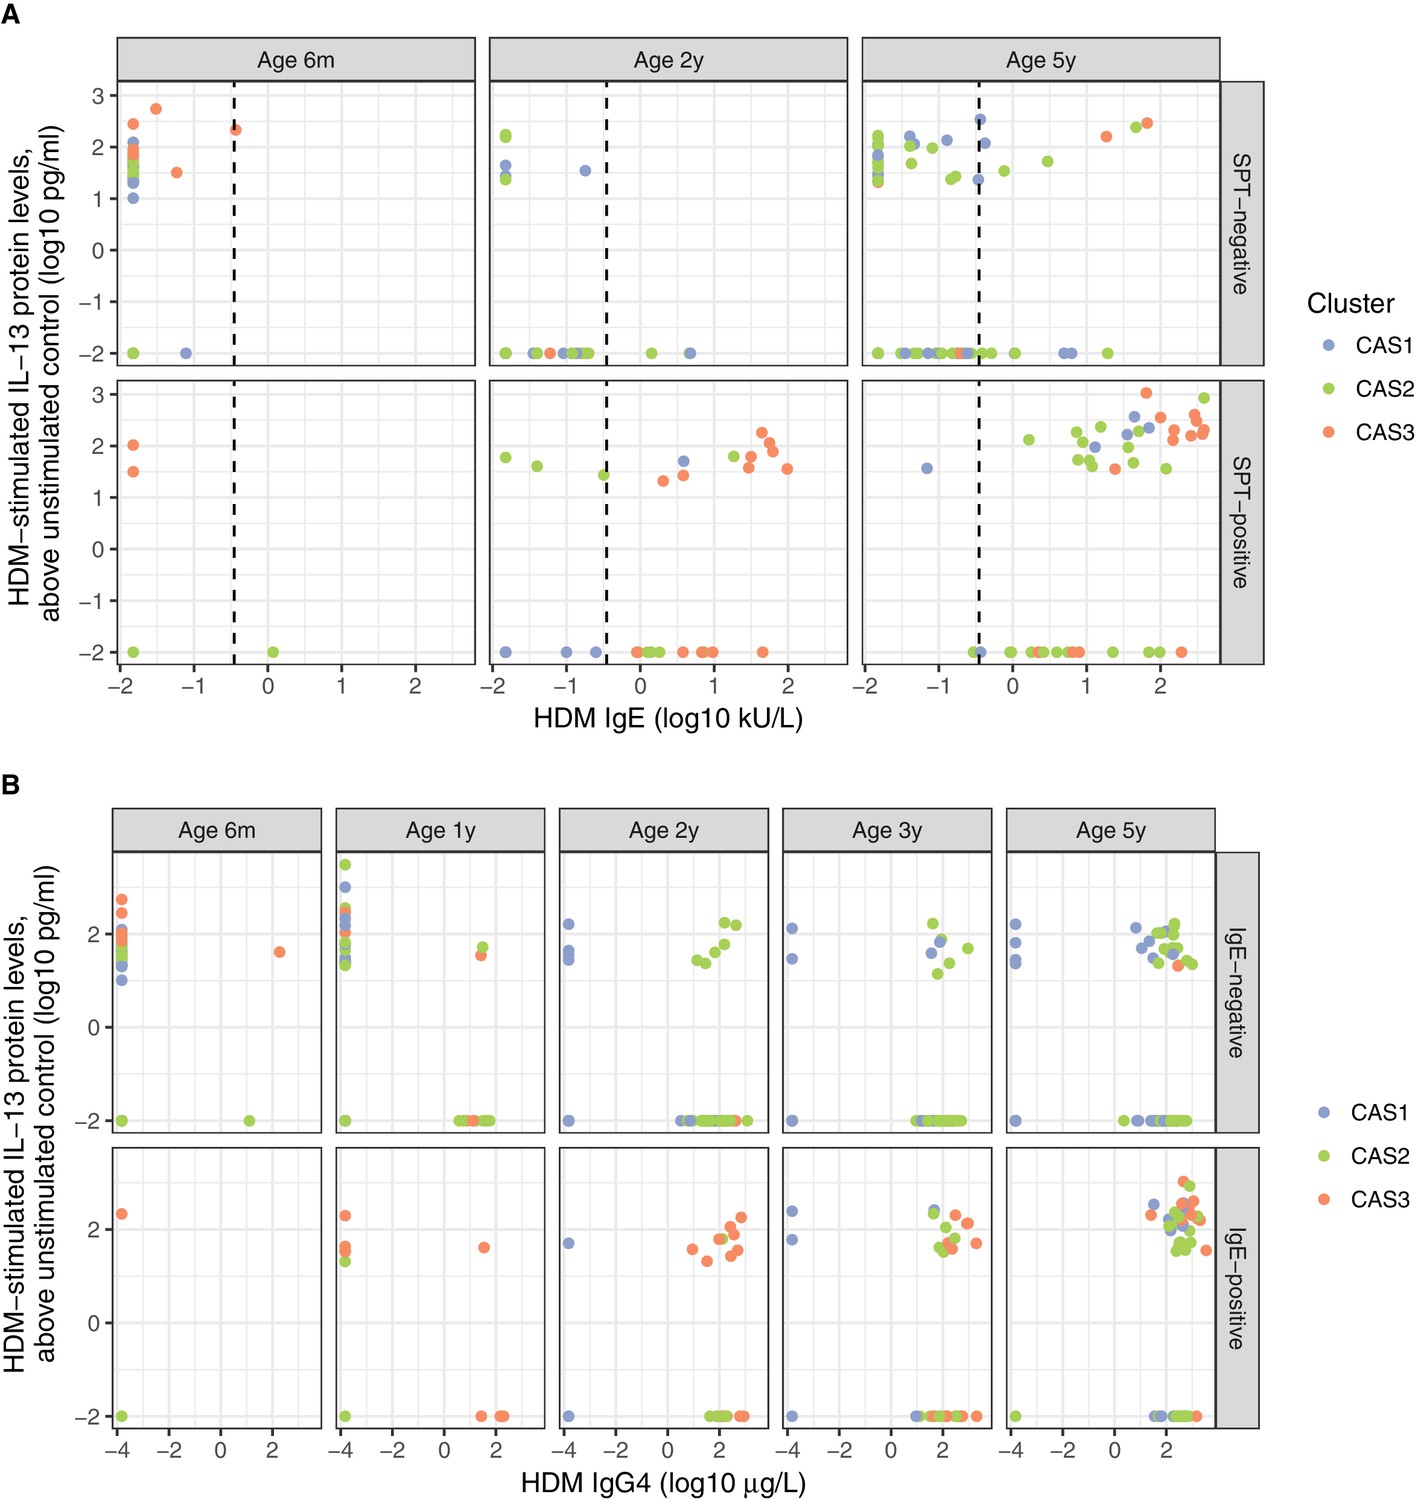
Distinct biological signals of HDM IgE, IgG4, SPT, and Th2 cytokine (IL-13).
(A) Th2 cytokine (IL-13) to HDM stimulation of PBMCs in vitro, vs.HDM IgE responses in vivo, stratified by age of testing, and SPT result (positive denoted by ≥2 mm at age <2 or 3 mm at age 5). Dotted line represents traditional threshold for HDM IgE-positive result (0.35 kU/L). Note the significant number of individuals on either side of the dotted line for both HDM SPT-positive and negative subgroups. (B) Th2 cytokine (IL-13) to HDM stimulation of PBMCs in vitro, vs. HDM IgG4 responses in vivo, stratified by age of testing and HDM IgE result (positive denoted by ≥0.35 kU/L).
Figure 5 with 4 supplements
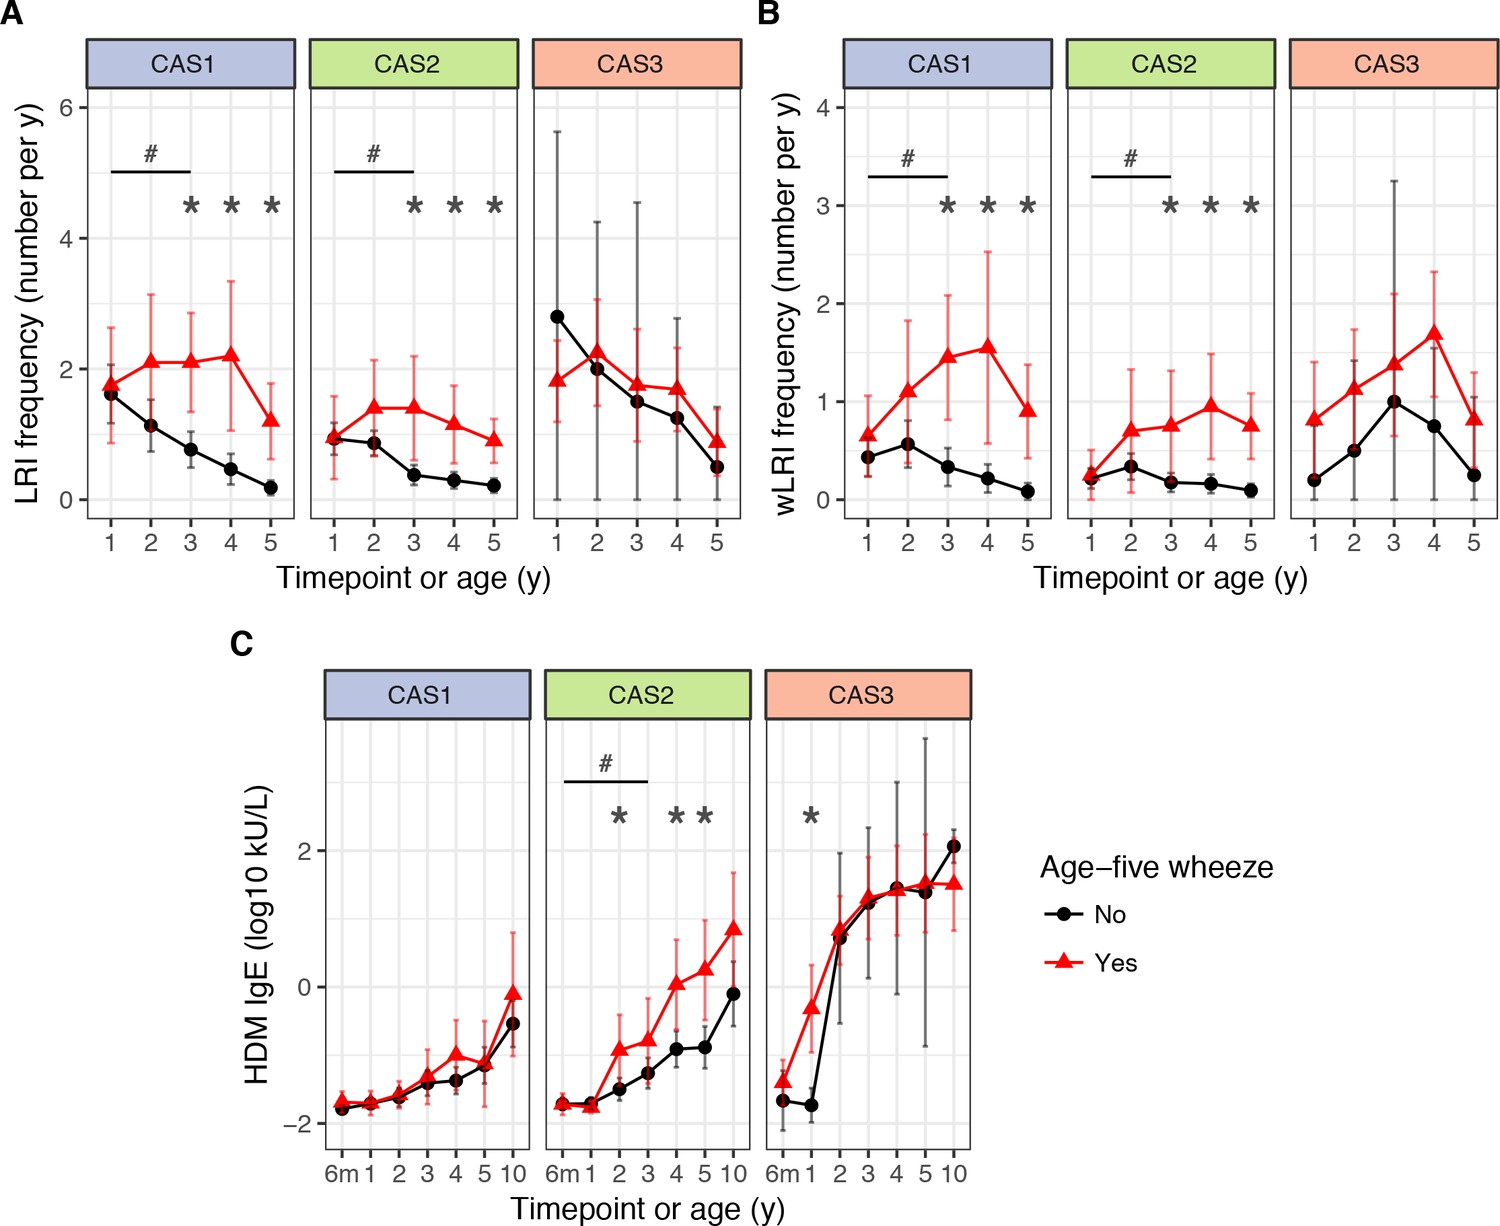
LRI frequency (A), wheezy LRI (wLRI) frequency (B), and HDM IgE (C), stratified by age-5 wheeze status, cluster and time, in the CAS dataset.
Points indicate means; bars indicate 95% CI (t-distribution). #p<0.05 for repeated-measures ANOVA across timepoints from the first 3 years of life (see Table 4). *p<0.05 for Mann-Whitney-Wilcoxon comparison within each timepoint.
Figure 5—figure supplement 1
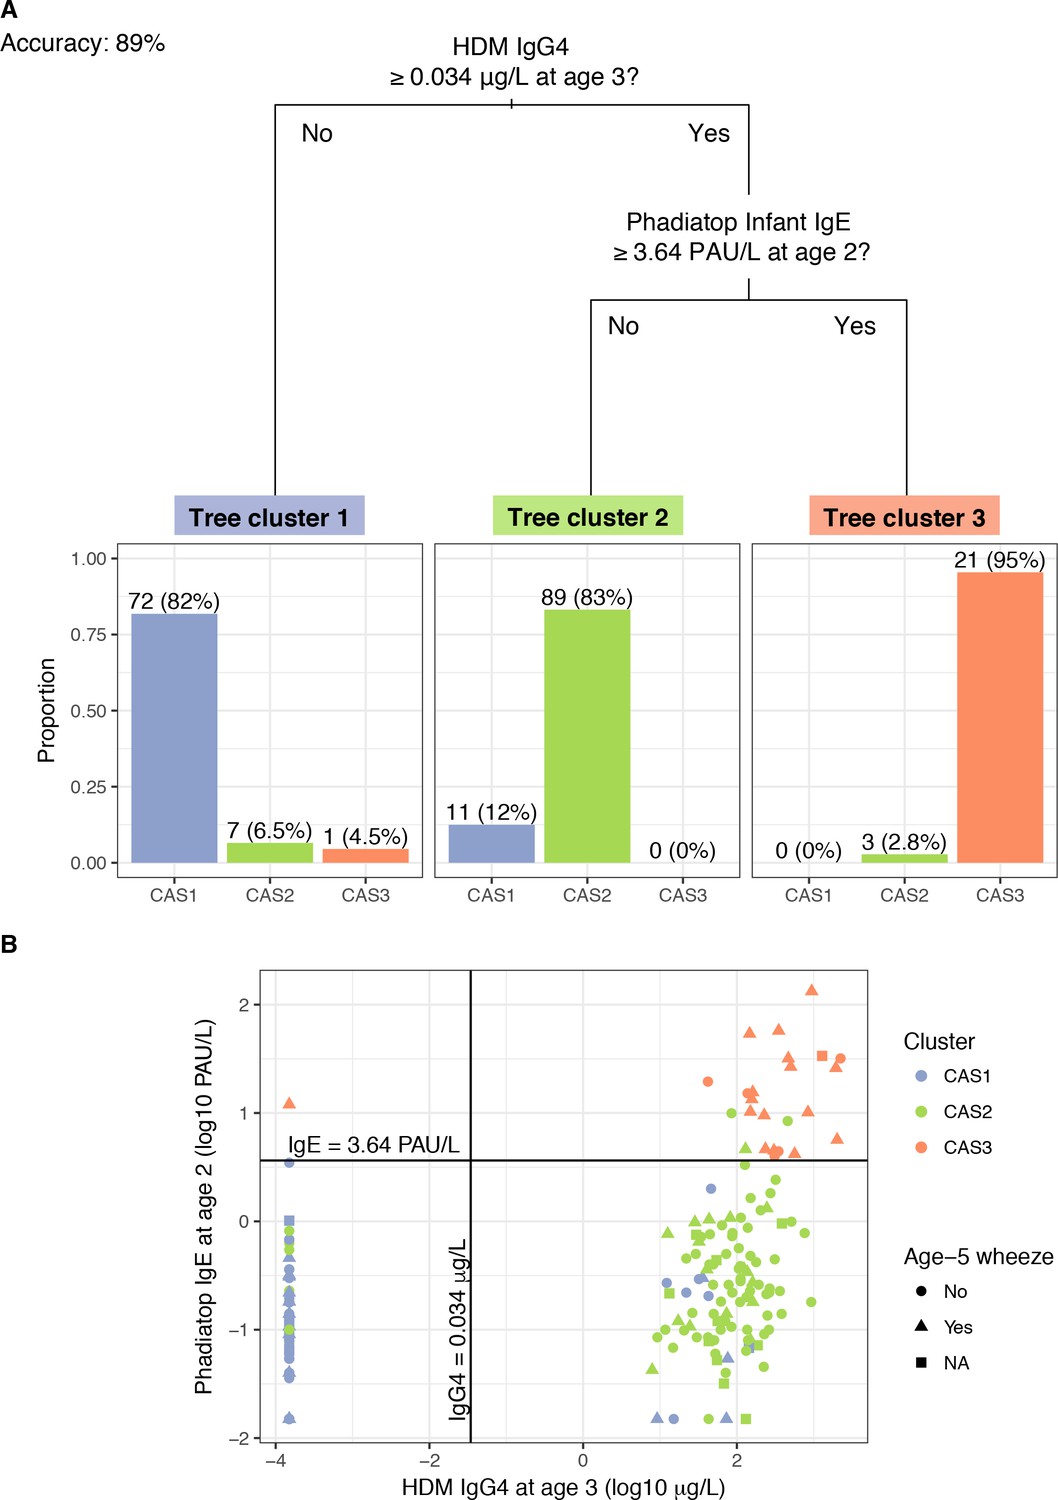
A ‘simple’ decision tree generated by recursive partitioning from CAS data, with breakdown of tree clusters by actual CAS npEM-derived clusters.
(A); scatterplot showing separation of CAS clusters by decision split thresholds (B). Percentages in Panel A may not sum up to 100% because some individuals have missing values for decision node variables, hence making them impossible to classify. In Panel B, note that left-most column of points represent values of HDM IgG4 that were less than the limit-of-detection (LOD) for that assay (0.0003 μg/L) and were subsequently assigned to half the LOD (0.00015 μg/L). Most of these points belonged to individuals from CAS1.
Figure 5—figure supplement 2
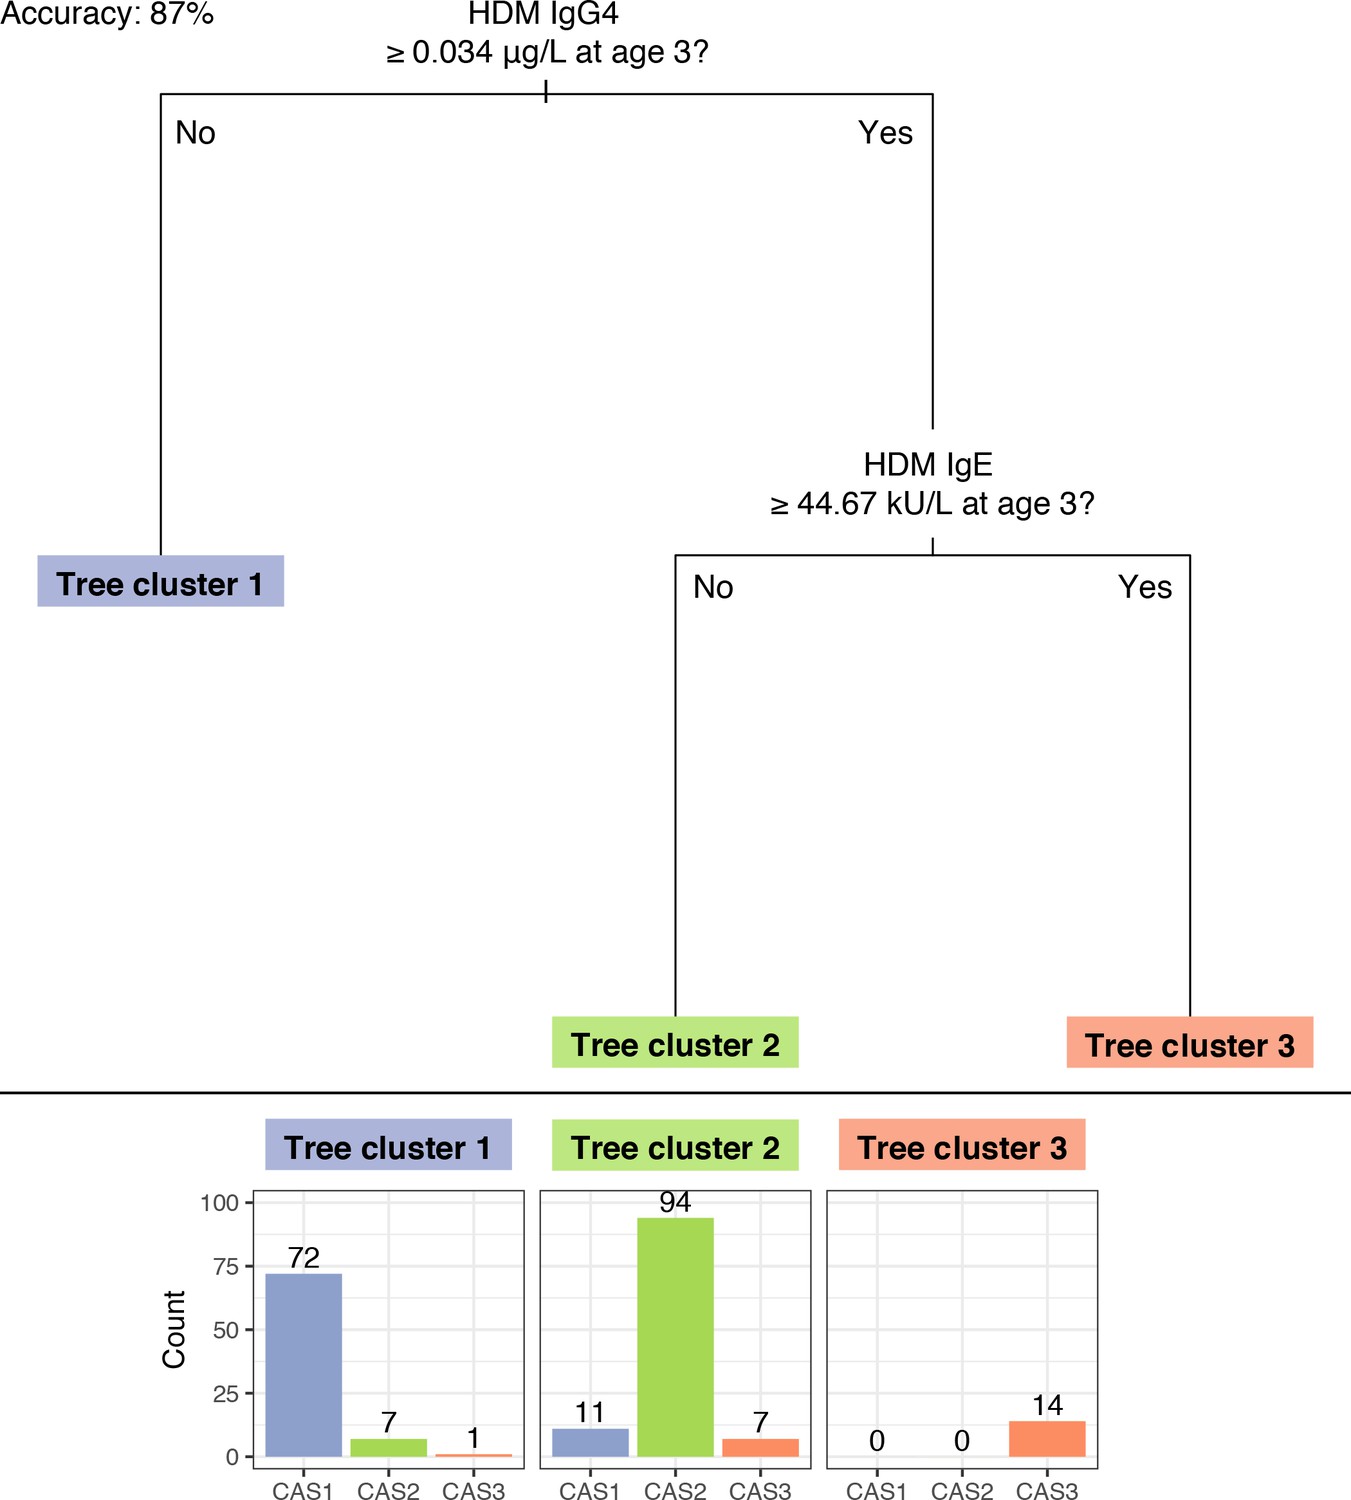
Decision tree generated by recursive partitioning from CAS data, excluding Phadiatop assay variables.
https://doi.org/10.7554/eLife.35856.017
Figure 5—figure supplement 3

A ‘comprehensive’ decision tree generated by recursive partitioning from CAS data, given CAS npEM-derived clusters and age-5 wheezing status.
CAS1.x, 2.x, and 3.x, and tree cluster 1.x, 2.x and 3.x, refer to the intersection of npEM-generated clusters and age-5 wheeze status, and their analogous decision tree cluster, respectively. The second digit (x.0 or x.1) refers to age-5 wheeze status, with ‘1’=present wheeze and ‘0’=no wheeze. Boxes, bars and digits with red outline indicate those with predicted (tree cluster) or actual (CAS npEM cluster) age-5 wheeze. Note that the tree did not predict for non-wheezing CAS3, so there is no tree cluster 3.0, and all CAS3 individuals were automatically assigned to a wheezing tree cluster.
Figure 5—figure supplement 4
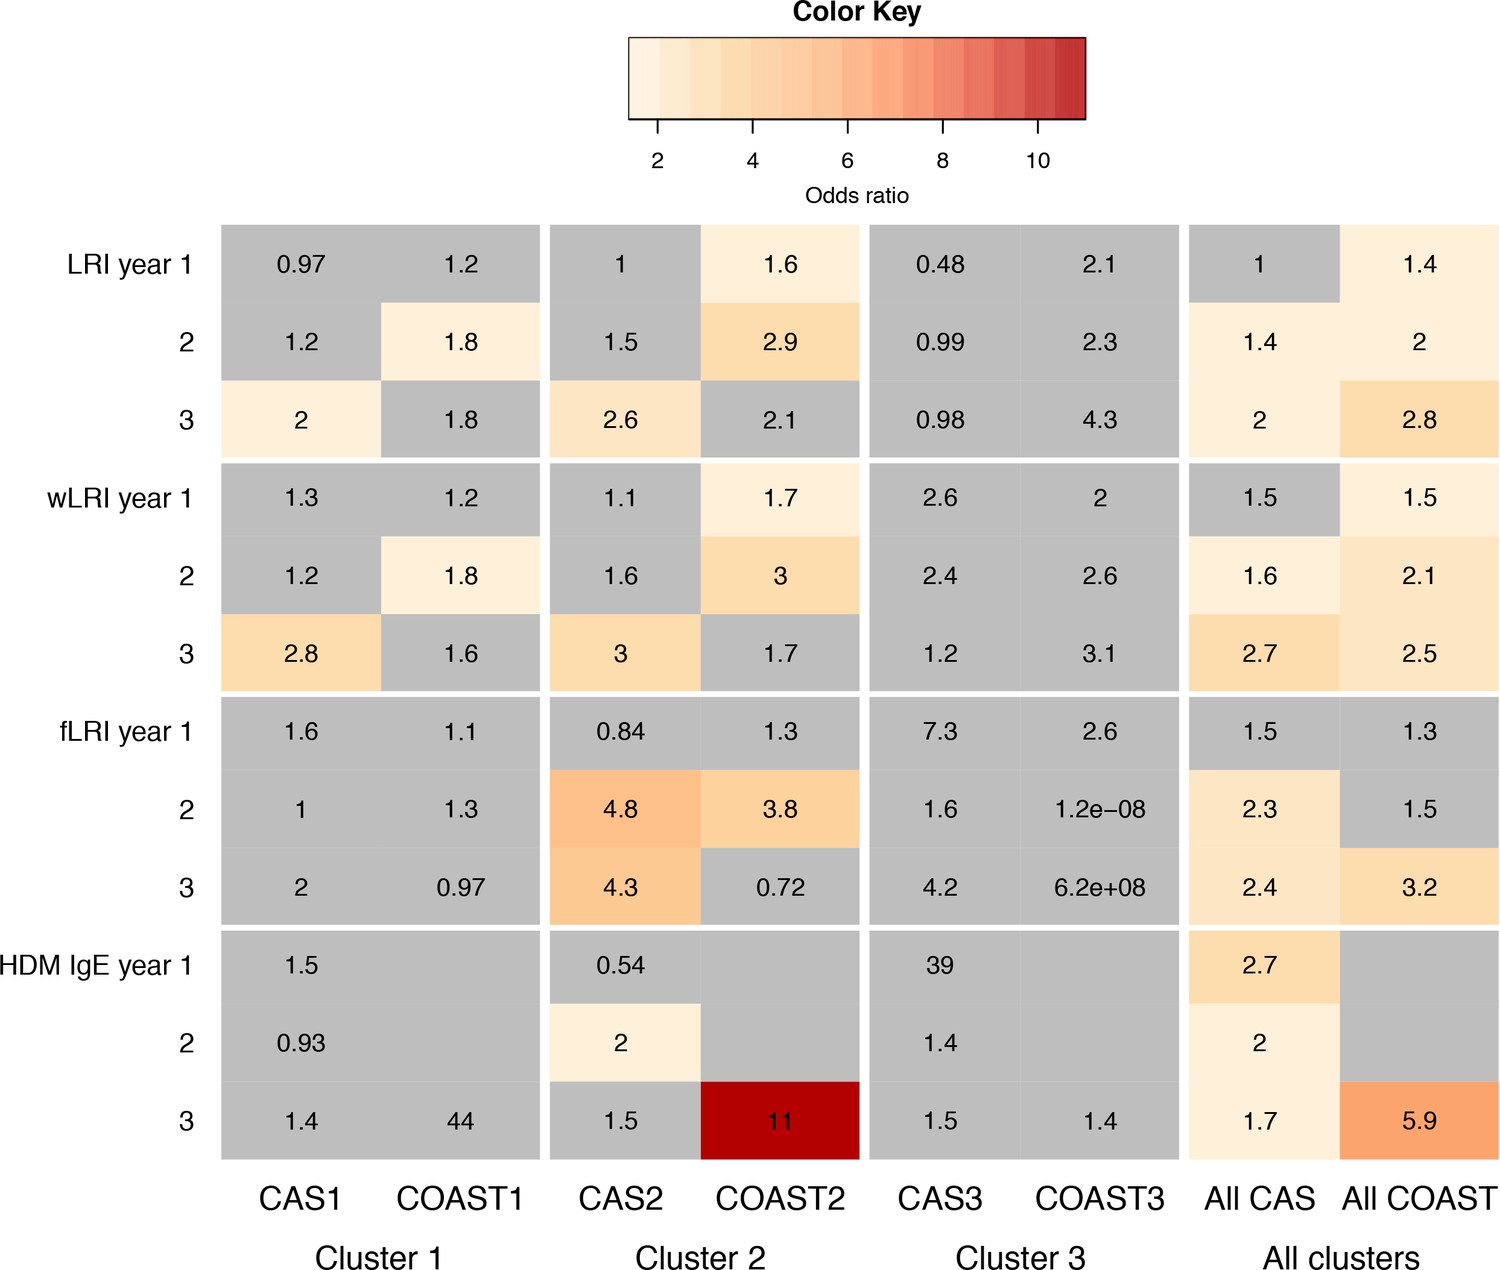
Comparison of predictors for age-5 wheeze in CAS and COAST clusters.
Colour coding and numbers in cells indicate odds ratio (OR) of predictor for age-5 wheeze in GLM, with sex, maternal and paternal history of asthma, and (for CAS) BMI as covariates. Non-grey cell with number indicates statistically significant association (p<0.05). Grey cell with number indicates non-significant (p>0.05); grey non-numbered cell indicates test not done due to lack of data.
Figure 6
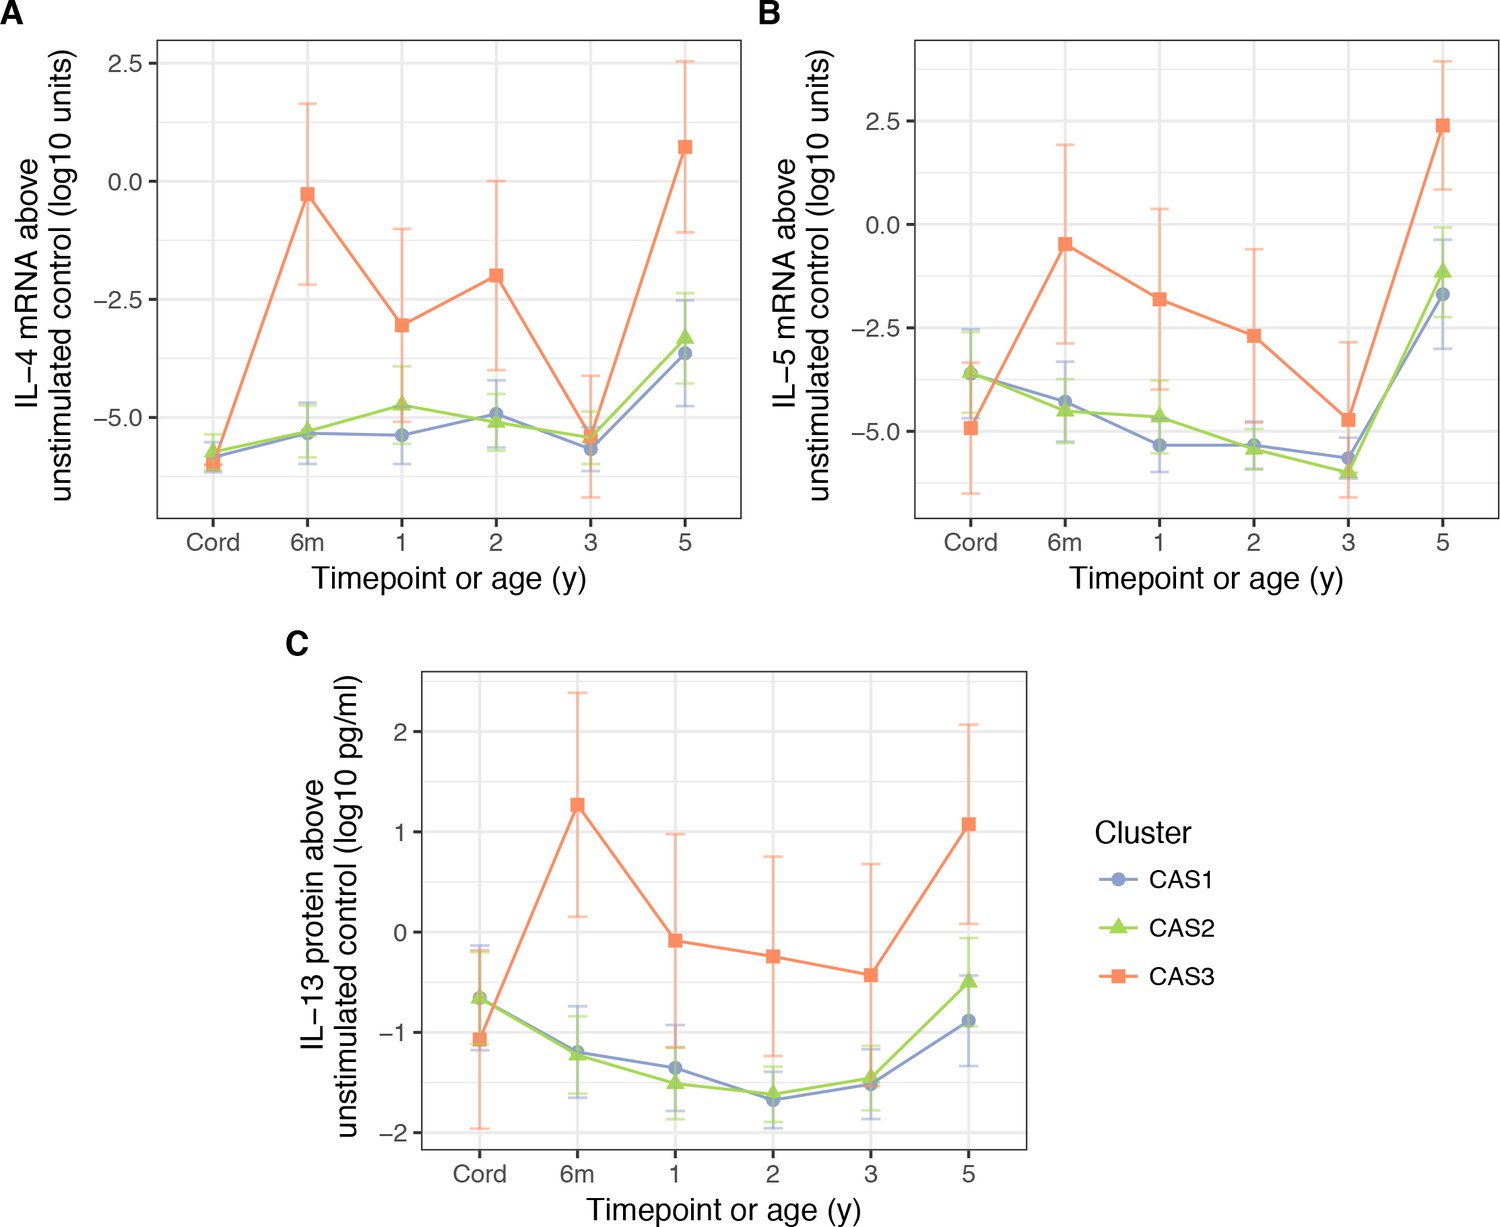
PBMC expression of IL-5.
(A) and IL-4 mRNA (B), as well as IL-13 protein (C), in response to stimulation HDM, stratified by cluster and time (CAS) Cord = cord blood sample collected at birth.Points indicate means; bars indicate 95% CI (t-distribution).
Figure 7
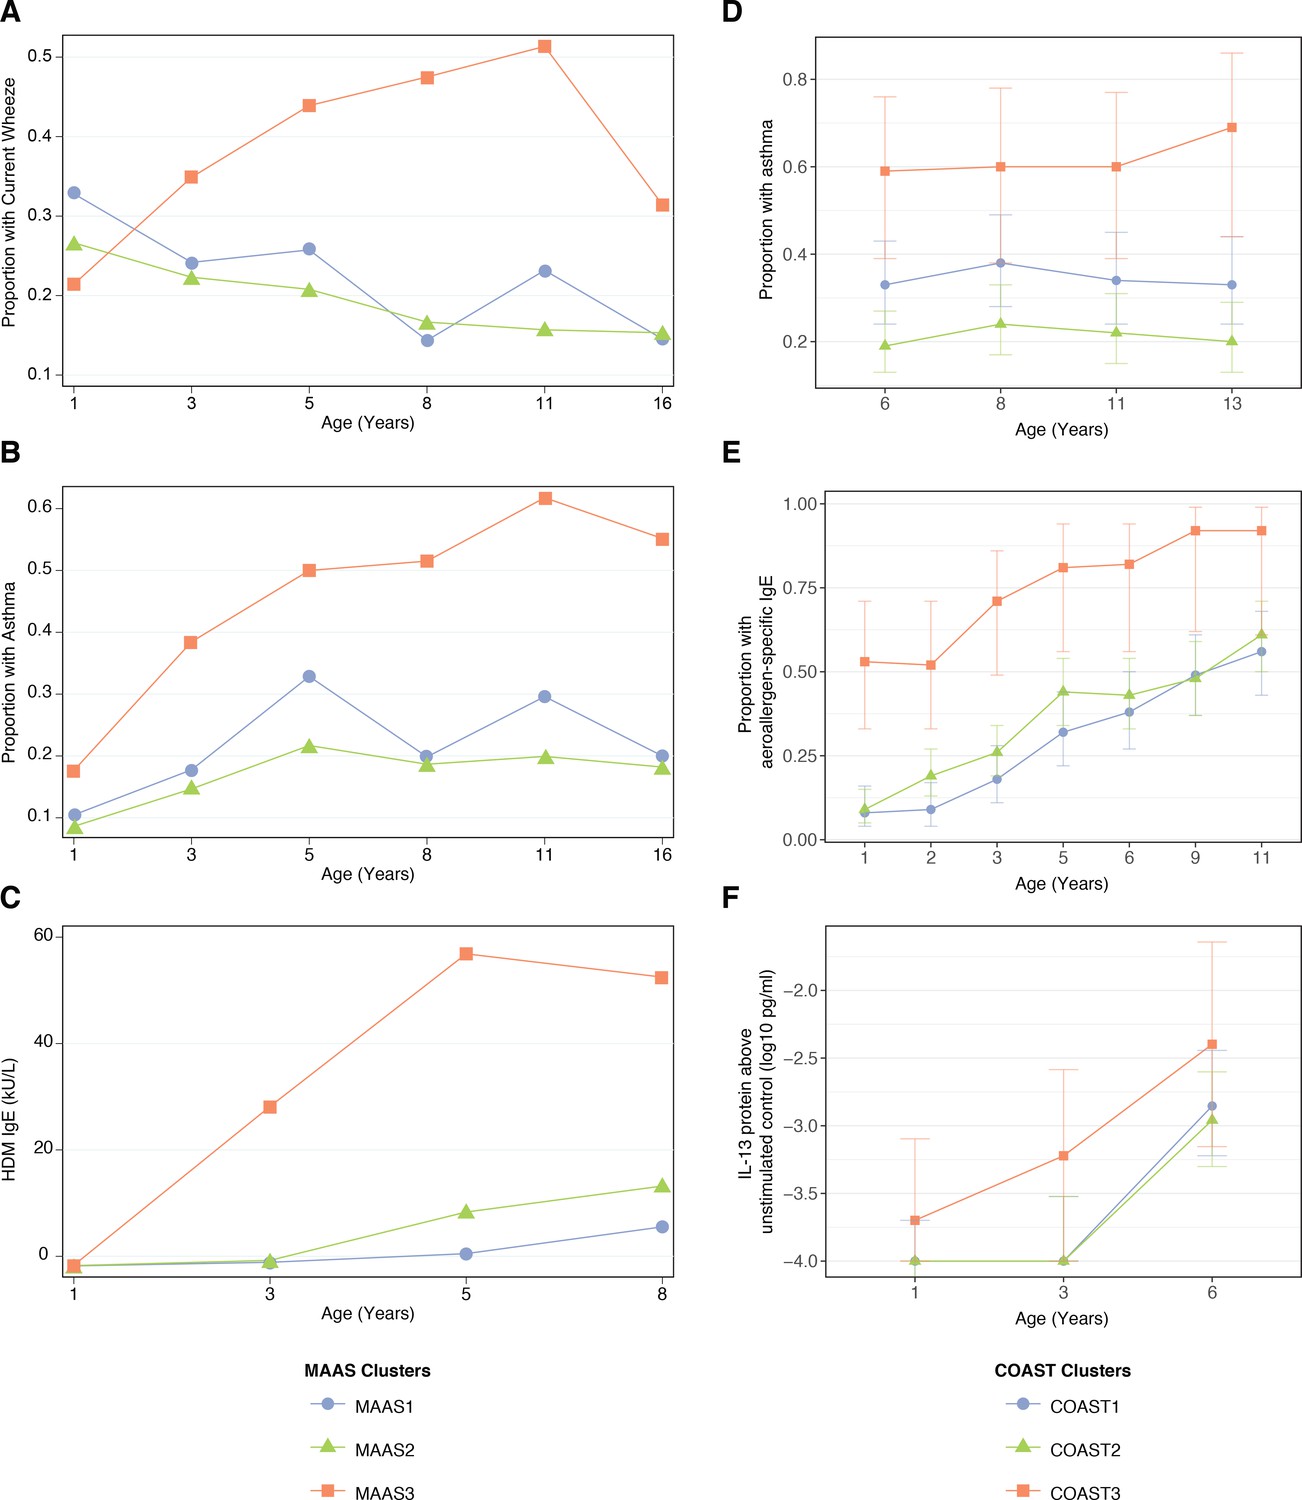
Description of npEM-derived clusters in external cohorts: in MAAS, incidence of wheeze.
(A), asthma diagnosis (B), and HDM IgE levels (C); in COAST, incidence of asthma diagnosis (D), proportion of individuals with detectable aeroallergen-specific IgE levels (E), and PBMC protein expression of IL-13 following HDM stimulation above unstimulated control (F) MAAS cohort (N = 934) was classified using npEM model from CAS, into MAAS1 (N = 199, 21%), MAAS2 (N = 692, 74%) and MAAS3 (N = 43, 5%); these correspond to CAS clusters CAS1, 2 and 3, respectively. COAST cohort (N = 285) was similarly classified into COAST1 (N = 105, 37%), COAST2 (N = 151, 53%) and COAST3 (N = 29, 10%).
Tables
Table 1
Comparison of selected demographic and clinical variables in CAS clusters
https://doi.org/10.7554/eLife.35856.013| Variable | Age (y) | Cas1 (N = 88) | Cas2 (N = 107) | Cas3 (N = 22) | P-value (unadjusted) | Feature? | |||
|---|---|---|---|---|---|---|---|---|---|
| Prop. (95% CI) | Prop. (95% CI) | Prop. (95% CI) | Overall | Cas1 vs. 2 | Cas1 vs. 3 | Cas2 vs. 3 | |||
| Sex = male | 55% (44–65%) | 51% (42–61%) | 86% (71–100%) | 7.3E-03 | 0.67 | 6.8E-03 | 3.7E-03 | Yes | |
| Maternal asthma | 51% (40–62%) | 41% (32–51%) | 59% (37–81%) | 0.19 | 0.19 | 0.63 | 0.16 | Yes | |
| Paternal asthma | 22% (13–30%) | 44% (35–54%) | 23% (3.7–42%) | 2.2E-03 | 1.3E-03 | 1 | 0.093 | Yes | |
| Wheeze | 1 | 33% (23–43%) | 30% (21–39%) | 55% (32–77%) | 0.092 | 0.76 | 0.084 | 0.046 | No |
| 5 | 25% (15–35%) | 21% (13–30%) | 76% (56–96%) | 7.1E-06 | 0.59 | 2.6E-05 | 3.4E-06 | No | |
| 10 | 12% (3.4–21%) | 18% (8.4–27%) | 50% (24–76%) | 3.1E-03 | 0.46 | 1.5E-03 | 0.011 | No | |
| Asthma | 5 | 15% (7–23%) | 13% (5.9–20%) | 52% (29–76%) | 4.1E-04 | 0.83 | 7.7E-04 | 2.1E-04 | No |
| 10 | 10% (2.3–18%) | 15% (6.1–23%) | 56% (30–81%) | 2.6E-04 | 0.59 | 1.8E-04 | 7.9E-04 | No | |
| Eczema | 6m | 39% (28–49%) | 45% (35–54%) | 91% (78–100%) | 2.4E-05 | 0.47 | 7.9E-06 | 9.0E-05 | Yes |
| 1 | 34% (24–44%) | 30% (21–39%) | 82% (64–99%) | 2.5E-05 | 0.54 | 7.2E-05 | 1.4E-05 | Yes | |
| 5 | 28% (18–37%) | 24% (16–33%) | 71% (50–92%) | 2.1E-04 | 0.73 | 3.3E-04 | 7.9E-05 | No | |
| Atopic rhinoconjunctivitis | 5 | 30% (20–40%) | 39% (29–49%) | 76% (56–96%) | 6.4E-04 | 0.21 | 2.7E-04 | 3.2E-03 | No |
| Mean (95% CI) | Mean (95% CI) | Mean (95% CI) | Overall | Cas1 vs. 2 | Cas1 vs. 3 | Cas2 vs. 3 | |||
| BMI (kg/m2) | 3 | 16 (16–17) | 16 (16–17) | 16 (16–17) | 0.86 | 0.65 | 0.68 | 0.8 | No* |
| 4 | 16 (16–17) | 16 (16–16) | 17 (16–17) | 0.59 | 0.76 | 0.32 | 0.39 | No | |
| 5 | 16 (16–16) | 16 (16–16) | 16 (15–17) | 0.71 | 0.56 | 0.48 | 0.67 | No | |
| 10 | 18 (17–19) | 18 (17–18) | 18 (17–19) | 0.89 | 0.75 | 1 | 0.62 | No | |
| Number of older siblings | 0 | 0.93 (0.72–1.1) | 0.53 (0.38–0.69) | 0.77 (0.32–1.2) | 4.5E-03 | 1.0E-03 | 0.37 | 0.25 | Yes |
| 2 | 0.85 (0.66–1) | 0.5 (0.34–0.65) | 0.77 (0.32–1.2) | 2.8E-03 | 6.5E-04 | 0.48 | 0.16 | Yes | |
| 5 | 0.68 (0.5–0.85) | 0.39 (0.25–0.54) | 0.67 (0.23–1.1) | 0.016 | 5.1E-03 | 0.75 | 0.12 | No | |
| Geom. mean (95% CI) | Geom. mean (95% CI) | Geom. mean (95% CI) | Overall | Cas1 vs. 2 | Cas1 vs. 3 | Cas2 vs. 3 | |||
| Vitamin D (nmol/L) | 1 | 60 (55–64) | 59 (55–63) | 59 (52–67) | 0.93 | 0.98 | 0.76 | 0.7 | No |
| 2 | 57 (54–61) | 58 (55–61) | 47 (40–55) | 0.012 | 0.82 | 5.4E-03 | 4.4E-03 | No | |
| 5 | 89 (83–95) | 84 (79–89) | 77 (69–84) | 0.057 | 0.46 | 0.016 | 0.056 | No | |
-
BMI = body mass index; feature?=whether variable was used as a clustering feature or not; geom. mean = geometric mean; prop. = proportion. For categorical variables, associations were tested using Fisher exact test; for continuous variables, Kruskal-Wallis and Mann-Whitney-Wilcoxon. Bold text indicates statistical significance (p<0.05); italics indicate near-significance (p<0.10). *Not used as clustering feature, as BMI is a derived variable. Height and weight at age three were used instead.
Table 2
Comparison of HDM-associated immunological variables in CAS clusters
https://doi.org/10.7554/eLife.35856.014| Variable | Age | Cas1 (N = 88) | Cas2 (N = 107) | Cas3 (N = 22) | P-value (unadjusted) | Feature? | |||
|---|---|---|---|---|---|---|---|---|---|
| Geom. mean (95% CI) | Geom. mean (95% CI) | Geom. mean (95% CI) | Overall | Cas1 vs. 2 | Cas1 vs. 3 | Cas2 vs. 3 | |||
| Total antibody | |||||||||
| IgE (kU/L) | 6m | 1.2 (0.69–2) | 2.2 (1.4–3.6) | 21 (12–35) | 1.2E-07 | 0.044 | 6.7E-08 | 2.2E-06 | Yes |
| 1 | 0.6 (0.29–1.3) | 2 (1.1–3.7) | 43 (17–109) | 2.0E-09 | 0.019 | 4.3E-09 | 5.3E-08 | Yes | |
| 2 | 6.6 (3.5–12) | 17 (12–25) | 187 (131–267) | 1.2E-11 | 0.044 | 4.2E-11 | 1.4E-10 | Yes | |
| 5 | 35 (23–55) | 60 (46–80) | 451 (278–731) | 2.2E-08 | 0.096 | 1.9E-08 | 1.5E-07 | No | |
| 10 | 85 (46–154) | 150 (103–217) | 800 (405–1.6E + 03) | 1.4E-04 | 0.11 | 1.3E-04 | 2.8E-04 | No | |
| HDM antibody | |||||||||
| IgE (kU/L) | 6m | 0.018 (0.016–0.02) | 0.019 (0.016–0.022) | 0.033 (0.019–0.059) | 1.9E-03 | 0.47 | 7.9E-04 | 4.2E-03 | Yes |
| 1 | 0.019 (0.017–0.023) | 0.019 (0.016–0.022) | 0.26 (0.075–0.93) | 1.3E-09 | 0.47 | 2.5E-07 | 4.5E-09 | Yes | |
| 2 | 0.024 (0.019–0.031) | 0.042 (0.029–0.06) | 7.1 (2.7–19) | 2.6E-16 | 0.078 | 2.5E-15 | 3.5E-13 | Yes | |
| 5 | 0.072 (0.041–0.13) | 0.23 (0.12–0.45) | 31 (7.8–127) | 4.2E-09 | 0.015 | 3.8E-09 | 5.1E-07 | No | |
| 10 | 0.37 (0.17–0.8) | 1.3 (0.51–3.4) | 52 (19–144) | 2.9E-06 | 0.068 | 5.7E-07 | 9.7E-05 | No | |
| IgG (mg/L) | 1 | 0.21 (0.2–0.23) | 0.23 (0.21–0.25) | 0.29 (0.21–0.39) | 0.042 | 0.34 | 0.012 | 0.07 | Yes |
| 2 | 0.32 (0.27–0.37) | 0.49 (0.41–0.59) | 0.89 (0.57–1.4) | 1.9E-06 | 2.1E-04 | 3.8E-06 | 7.0E-03 | Yes | |
| 5 | 0.55 (0.42–0.7) | 0.59 (0.46–0.74) | 1.7 (0.88–3.3) | 1.5E-03 | 0.67 | 6.4E-04 | 9.0E-04 | No | |
| 10 | 1.6 (1.3–1.9) | 2.1 (1.8–2.5) | 2.8 (1.9–4.2) | 1.0E-02 | 0.023 | 0.011 | 0.18 | No | |
| IgG4 (μg/L) | 6m | 1.5E-04 (1.5E-04–1.5E-04) | 1.7E-04 (1.3E-04–2.1E-04) | 4.6E-04 (9.0E-05–2.4E-03) | 4.9E-03 | 0.37 | 5.2E-03 | 0.024 | Yes |
| 1 | 1.5E-04 (1.5E-04–1.5E-04) | 6.9E-04 (3.2E-04–1.5E-03) | 0.081 (4.6E-03–1.4) | 1.8E-10 | 5.2E-04 | 6.6E-12 | 2.2E-05 | Yes | |
| 2 | 3.4E-04 (1.8E-04–6.6E-04) | 4.8 (1.7–13) | 61 (8.9–419) | 1.8E-25 | 1.5E-22 | 8.6E-18 | 9.8E-05 | Yes | |
| 5 | 2 (0.48–8.1) | 168 (111–256) | 539 (317–917) | 1.1E-15 | 1.3E-12 | 1.0E-08 | 1.9E-04 | No | |
| HDM cytokine response^ | |||||||||
| IL-13 protein (pg/ml)^ | 0 | 0.22 (0.066–0.73) | 0.22 (0.076–0.63) | 0.085 (0.011–0.66) | 0.68 | 0.76 | 0.41 | 0.45 | No |
| 6m | 0.064 (0.022–0.18) | 0.06 (0.025–0.14) | 19 (1.4–244) | 4.6E-06 | 0.98 | 1.7E-05 | 4.1E-06 | No | |
| 5 | 0.13 (0.046–0.37) | 0.32 (0.11–0.87) | 12 (1.2–117) | 2.1E-04 | 0.29 | 7.7E-05 | 5.1E-04 | No | |
| IL-5 protein (pg/ml)^ | 0 | 0.043 (0.018–0.11) | 0.026 (0.013–0.052) | 0.018 (5.0E-03–0.068) | 0.44 | 0.36 | 0.29 | 0.57 | No |
| 6m | 0.018 (9.2E-03–0.034) | 0.013 (8.9E-03–0.02) | 0.21 (0.012–3.7) | 7.9E-04 | 0.4 | 8.1E-03 | 3.5E-04 | No | |
| 5 | 0.028 (0.014–0.057) | 0.042 (0.02–0.087) | 2.3 (0.25–22) | 3.2E-06 | 0.45 | 5.7E-06 | 2.0E-05 | No | |
| IL-13 mRNA^ | 0 | 1.7E-03 (1.1E-04–0.026) | 6.0E-03 (4.8E-04–0.075) | 6.7E-03 (3.3E-05–1.4) | 0.85 | 0.6 | 0.68 | 0.94 | No |
| 6m | 1.0E-04 (8.8E-06–1.1E-03) | 3.2E-04 (3.8E-05–2.6E-03) | 2 (0.015–266) | 3.2E-04 | 0.5 | 1.7E-04 | 3.8E-04 | No | |
| 5 | 0.036 (1.6E-03–0.8) | 0.11 (8.8E-03–1.4) | 2.9E + 03 (742–1.1E + 04) | 6.8E-05 | 0.59 | 9.9E-05 | 2.5E-05 | No | |
| IL-4 mRNA^ | 0 | 1.4E-06 (6.9E-07–3.0E-06) | 1.9E-06 (7.8E-07–4.4E-06) | 1.0E-06 (1.0E-06–1.0E-06) | 0.71 | 0.65 | 0.6 | 0.47 | No |
| 6m | 4.6E-06 (1.0E-06–2.1E-05) | 5.1E-06 (1.4E-06–1.8E-05) | 0.54 (6.5E-03–44) | 6.2E-09 | 0.94 | 4.7E-07 | 1.0E-07 | No | |
| 5 | 2.3E-04 (1.7E-05–3.0E-03) | 4.7E-04 (5.3E-05–4.3E-03) | 5.3 (0.082–345) | 4.9E-04 | 0.72 | 4.5E-04 | 3.2E-04 | No | |
| IL-5 mRNA^ | 0 | 2.5E-04 (2.1E-05–2.9E-03) | 2.6E-04 (2.8E-05–2.5E-03) | 1.2E-05 (3.1E-07–4.6E-04) | 0.47 | 0.96 | 0.24 | 0.25 | No |
| 6m | 5.2E-05 (5.6E-06–4.8E-04) | 3.1E-05 (5.2E-06–1.8E-04) | 0.33 (1.3E-03–83) | 1.5E-04 | 0.85 | 2.3E-04 | 1.1E-04 | No | |
| 5 | 0.021 (9.9E-04–0.43) | 0.07 (5.7E-03–0.85) | 246 (7–8.7E + 03) | 1.3E-04 | 0.49 | 7.1E-05 | 1.1E-04 | No | |
| Prop. (95% CI) | Prop. (95% CI) | Prop. (95% CI) | Overall | Cas1 vs. 2 | Cas1 vs. 3 | Cas2 vs. 3 | |||
| HDM SPT past atopy threshold | |||||||||
| Wheal ≥ 2 mm | 6m | 2.3% (0–5.4%) | 1.9% (0–4.5%) | 14% (0–29%) | 0.043 | 1 | 0.054 | 0.035 | No* |
| 2 | 10% (3.8–17%) | 15% (8.1–22%) | 86% (71–100%) | 2.9E-12 | 0.39 | 8.2E-12 | 1.5E-10 | No* | |
| Wheal ≥ 3 mm | 5 | 13% (5.2–20%) | 28% (18–37%) | 81% (63–99%) | 1.5E-08 | 0.022 | 4.6E-09 | 1.0E-05 | No |
| 10 | 36% (23–49%) | 51% (38–63%) | 78% (57–99%) | 7.4E-03 | 0.11 | 2.7E-03 | 0.06 | No | |
-
Feature?=whether variable was used as a clustering feature or not; geom. mean = geometric mean; PBMC = peripheral blood mononuclear cells; prop. = proportion; SPT = skin prick or sensitisation test. For categorical variables, associations were tested using Fisher exact test; for continuous variables, Kruskal-Wallis and Mann-Whitney-Wilcoxon. Bold text indicates statistical significance (p<0.05); italics indicate near-significance (p<0.10). ^PBMC cytokine responses to HDM above unstimulated control; birth samples (age 0) taken from cord blood (CBMC). *Not used as clustering features, as these were derived variables; the variables from which they were derived (HDM IgE and IgG4) were used instead.
Table 3
Comparison of selected respiratory-disease-related variables in CAS clusters
https://doi.org/10.7554/eLife.35856.020| Variable | Age (y) | Cas1 (N = 88) | Cas2 (N = 107) | Cas3 (N = 22) | P-value (unadjusted) | Feature? | |||
|---|---|---|---|---|---|---|---|---|---|
| Mean (95% CI) | Mean (95% CI) | Mean (95% CI) | Overall | Cas1 vs. 2 | Cas1 vs. 3 | Cas2 vs. 3 | |||
| URI (events per y) | 1 | 2.9 (2.4–3.3) | 2.6 (2.2–3) | 2.5 (1.7–3.3) | 0.59 | 0.34 | 0.5 | 0.96 | Yes |
| 2 | 3.2 (2.6–3.7) | 2.6 (2.2–3) | 2.5 (1.2–3.8) | 0.19 | 0.19 | 0.12 | 0.34 | Yes | |
| 3 | 2.7 (2.2–3.2) | 2.8 (2.4–3.3) | 2.2 (1.3–3.2) | 0.45 | 0.41 | 0.59 | 0.24 | Yes | |
| 4 | 2.1 (1.7–2.6) | 2.2 (1.8–2.7) | 1.7 (0.77–2.7) | 0.5 | 0.94 | 0.26 | 0.27 | No | |
| 5 | 1.6 (1.1–2) | 1.5 (1.2–1.9) | 0.67 (0.2–1.1) | 0.081 | 0.76 | 0.047 | 0.026 | No | |
| LRI (events per y) | 1 | 1.6 (1.2–1.9) | 0.98 (0.76–1.2) | 2 (1.3–2.6) | 4.0E-03 | 0.021 | 0.17 | 2.6E-03 | Yes |
| 2 | 1.4 (0.98–1.7) | 1 (0.81–1.2) | 2.2 (1.6–2.9) | 2.5E-03 | 0.83 | 6.1E-03 | 2.0E-04 | Yes | |
| 3 | 1 (0.76–1.3) | 0.6 (0.4–0.8) | 1.8 (1.1–2.6) | 6.1E-04 | 0.02 | 0.039 | 2.7E-04 | Yes | |
| 4 | 0.87 (0.52–1.2) | 0.46 (0.3–0.63) | 2 (1.1–2.8) | 1.7E-05 | 0.3 | 3.5E-04 | 1.6E-06 | No | |
| 5 | 0.42 (0.24–0.6) | 0.36 (0.24–0.48) | 0.86 (0.44–1.3) | 0.019 | 1 | 0.011 | 7.5E-03 | No | |
| Wheezy LRI (wLRI, events per y) | 1 | 0.47 (0.3–0.63) | 0.24 (0.15–0.34) | 0.64 (0.19–1.1) | 0.054 | 0.036 | 0.61 | 0.065 | Yes |
| 2 | 0.68 (0.45–0.91) | 0.41 (0.26–0.56) | 1 (0.56–1.5) | 5.2E-03 | 0.063 | 0.066 | 1.7E-03 | Yes | |
| 3 | 0.59 (0.37–0.81) | 0.3 (0.17–0.44) | 1.4 (0.78–2.1) | 4.6E-05 | 0.065 | 2.5E-03 | 6.6E-06 | Yes | |
| 4 | 0.52 (0.25–0.79) | 0.32 (0.18–0.46) | 1.9 (0.95–2.8) | 4.5E-08 | 0.86 | 9.3E-07 | 3.3E-08 | No | |
| 5 | 0.28 (0.13–0.42) | 0.23 (0.13–0.33) | 0.76 (0.36–1.2) | 2.3E-03 | 0.99 | 2.0E-03 | 1.2E-03 | No | |
| Febrile LRI (fLRI, events per y) | 1 | 0.36 (0.22–0.51) | 0.28 (0.16–0.4) | 0.55 (0.28–0.81) | 0.025 | 0.24 | 0.071 | 6.4E-03 | Yes |
| 2 | 0.36 (0.23–0.5) | 0.33 (0.22–0.43) | 0.95 (0.46–1.4) | 0.01 | 1 | 6.1E-03 | 3.8E-03 | Yes | |
| 3 | 0.38 (0.21–0.55) | 0.16 (0.09–0.23) | 0.52 (0.13–0.92) | 0.06 | 0.063 | 0.44 | 0.04 | Yes | |
| 4 | 0.3 (0.13–0.47) | 0.15 (0.064–0.24) | 0.43 (0.16–0.7) | 0.021 | 0.18 | 0.091 | 4.9E-03 | No | |
| 5 | 0.19 (0.082–0.3) | 0.14 (0.06–0.21) | 0.19 (0–0.42) | 0.83 | 0.55 | 0.91 | 0.8 | No | |
| Prop. (95% CI) | Prop. (95% CI) | Prop. (95% CI) | Overall | Cas1 vs. 2 | Cas1 vs. 3 | Cas2 vs. 3 | |||
| >20% Streptococcus in first infection-naive NPA sample | 7w | 11% (0.34–23%) | 15% (3.3–26%) | 44% (3.9–85%) | 0.081 | 0.75 | 0.042 | 0.065 | No |
| 6m | 7.6% (1.6–14%) | 18% (10–26%) | 14% (0–31%) | 0.12 | 0.045 | 0.39 | 1 | No | |
| % Healthy NPAs with infection-associated MPGs | 0–2 | 49% (38–59%) | 32% (24–39%) | 62% (47–76%) | 1.2E-03 | 0.013 | 0.2 | 5.5E-04 | No |
| 2–4 | 46% (37–55%) | 44% (37–51%) | 45% (29–61%) | 0.9 | 0.67 | 0.92 | 0.8 | No | |
-
Feature?=whether variable was used as a clustering feature or not; geom. mean = geometric mean; ARI = acute respiratory infection (lower or upper); LRI = lower respiratory infection; MPG = microbiome profile group; NPA = nasopharyngeal aspirate; prop. = proportion; URI = upper respiratory infection; 7w = 7 weeks. For categorical variables, associations were tested using Fisher exact test; for continuous variables, Kruskal-Wallis and Mann-Whitney-Wilcoxon. Bold text indicates statistical significance (p<0.05); italics indicate near-significance (p<0.10). *Not used as clustering features, as these were derived variables; the variables from which they were derived (URI, LRI, wLRI, fLRI) were used instead.
Table 4
Analysis of selected predictors for age-5 wheeze within each CAS cluster, with demographic covariates (sex, BMI, parental history of asthma)
https://doi.org/10.7554/eLife.35856.021| Selected predictors for age-5 wheeze | |||||||||
|---|---|---|---|---|---|---|---|---|---|
| Cas1 (N = 88) Or (95% CI) | P-value | Cas2 (N = 107) Or (95% CI) | P-value | Cas3 (N = 22) Or (95% CI) | P-value | Or (95% CI) | P-value | ||
| LRI (events per y) | 1 | 0.97 (0.71–1.3) | 0.84 | 1 (0.61–1.5) | 0.99 | 0.48 (0.13–1.1) | 0.16 | 1 (0.81–1.2) | 0.92 |
| 2 | 1.2 (0.88–1.6) | 0.26 | 1.5 (0.97–2.5) | 0.069 | 0.99 (0.34–2.6) | 0.98 | 1.4 (1.1–1.7) | 5.3E-03 | |
| 3 | 2 (1.3–3.2) | 2.3E-03 | 2.6 (1.5–5.3) | 2.7E-03 | 0.98 (0.4–2.6) | 0.96 | 2 (1.5–2.7) | 3.8E-06 | |
| 4 | 2 (1.4–3.4) | 2.0E-03 | 3.6 (1.8–8.3) | 6.5E-04 | 1.9 (0.57–8.4) | 0.32 | 2.5 (1.8–3.6) | 1.5E-07 | |
| Wheezy LRI (events per y) | 1 | 1.3 (0.68–2.4) | 0.43 | 1.1 (0.35–3) | 0.83 | 2.6 (0.62–58) | 0.34 | 1.5 (0.98–2.3) | 0.06 |
| 2 | 1.2 (0.8–2) | 0.33 | 1.6 (0.89–2.9) | 0.12 | 2.4 (0.67–16) | 0.24 | 1.6 (1.2–2.2) | 5.6E-03 | |
| 3 | 2.8 (1.6–5.6) | 1.3E-03 | 3 (1.4–8) | 0.016 | 1.2 (0.43–4.6) | 0.76 | 2.7 (1.8–4.2) | 4.1E-06 | |
| 4 | 2.5 (1.5–5) | 4.0E-03 | 6.3 (2.5–21) | 6.8E-04 | 7.1 (1.2–169) | 0.1 | 3.9 (2.5–6.7) | 5.4E-08 | |
| Febrile LRI (events per y) | 1 | 1.6 (0.77–3.6) | 0.21 | 0.84 (0.28–1.9) | 0.71 | 7.3 (0.78–178) | 0.12 | 1.5 (0.93–2.4) | 0.098 |
| 2 | 1 (0.44–2.2) | 1 | 4.8 (1.8–15) | 3.9E-03 | 1.6 (0.48–10) | 0.5 | 2.3 (1.4–3.9) | 1.2E-03 | |
| 3 | 2 (1–4.8) | 0.08 | 4.3 (1.2–15) | 0.02 | 4.2 (0.55–519) | 0.37 | 2.4 (1.4–4.3) | 2.3E-03 | |
| 4 | 1.8 (0.97–4.1) | 0.092 | 2.6 (0.88–8.3) | 0.082 | 1.1 (0.11–18) | 0.93 | 2.2 (1.3–4) | 5.9E-03 | |
| Quartile of % healthy NPAs with infection-associated MPGs | 0–2 | 1 (0.54–1.8) | 0.98 | 1.3 (0.72–2.4) | 0.36 | NA | NA | 1.3 (0.89–1.8) | 0.19 |
| 2–4 | 0.45 (0.19–0.88) | 0.035 | 1 (0.51–2.1) | 0.9 | NA | NA | 0.8 (0.53–1.2) | 0.24 | |
| HDM IgE (kU/L)* | 6m | 8 (0.85–94) | 0.074 | 0.93 (0.14–3.6) | 0.92 | 3.4 (0.26–180) | 0.4 | 2.3 (0.99–5.8) | 0.054 |
| 1 | 1.5 (0.22–7.8) | 0.65 | 0.54 (0.039–2.3) | 0.51 | 39 (2.5–22000) | 0.082 | 2.7 (1.5–5) | 0.00089 | |
| 2 | 0.93 (0.28–2.5) | 0.89 | 2 (1.2–3.7) | 0.016 | 1.4 (0.38–4.8) | 0.62 | 2 (1.5–2.8) | 2.80E-05 | |
| 3 | 1.4 (0.68–2.9) | 0.32 | 1.5 (0.9–2.4) | 0.12 | 1.5 (0.4–5.2) | 0.55 | 1.7 (1.3–2.2) | 1.00E-04 | |
| 4 | 1.9 (0.94–4.1) | 0.086 | 1.9 (1.2–3.1) | 0.011 | 1.4 (0.31–5.5) | 0.64 | 1.9 (1.5–2.5) | 3.70E-06 | |
| HDM IgG4 (μg/L)* | 6m | NA (NA-NA) | 0.55 | 0.053 (NA-6.5e + 24) | 0.99 | 28 (1.7e-34-NA) | 0.99 | 1.4 (0.88–2.6) | 0.17 |
| 1 | NA (NA-NA) | 0.61 | 1.1 (0.8–1.5) | 0.5 | 0.9 (0.58–1.3) | 0.6 | 1.2 (1–1.4) | 0.053 | |
| 2 | 1.1 (0.71–1.6) | 0.67 | 1.1 (0.85–1.4) | 0.61 | 0.4 (0.038–1.2) | 0.26 | 1.1 (1–1.3) | 0.056 | |
| 3 | 1.1 (0.85–1.5) | 0.35 | 1.1 (0.77–2) | 0.64 | 0.94 (0.19–2.3) | 0.9 | 1.1 (0.98–1.2) | 0.1 | |
| 4 | 1.2 (0.98–1.5) | 0.082 | 0.89 (0.7–1.1) | 0.33 | 0.46 (0.031–5.4) | 0.53 | 1.1 (1–1.3) | 0.034 | |
| HDM IgG (mg/L)* | 1 | 25 (0.32–1.6E + 04) | 0.19 | 3.3 (0.16–46) | 0.38 | 5.6E-03 (8.4E-06–0.57) | 0.058 | 2 (0.31–11) | 0.44 |
| 2 | 0.8 (0.15–3.5) | 0.78 | 0.97 (0.24–3.7) | 0.96 | 0.79 (0.031–18) | 0.88 | 1.3 (0.6–2.9) | 0.48 | |
| 3 | 2.3 (0.14–35) | 0.54 | 0.48 (0.057–2.5) | 0.43 | 3.9 (0.26–96) | 0.34 | 2.1 (0.89–5) | 0.089 |
-
BMI = body mass index; HDM = house dust mite; LRI = lower respiratory infection. Association analyses performed via generalised linear models (GLM) with demographic covariates: age-5 wheeze ~predictor + sex (male) +BMI at age 3 + paternal history of asthma +maternal history of asthma. Bold text indicates statistical significance (p<0.05); italics indicate near-significance (p<0.10). *Odds ratio (OR) is for every 10-fold increase in IgE, IgG4 or IgG.
Table 5
Key findings from cluster analysis
https://doi.org/10.7554/eLife.35856.024| Certain childhood populations may be broadly split into three clusters, each representing a unique trajectory of immune function and susceptibility to respiratory infections: low-risk non- atopic Cluster 1 with transient wheeze; low-risk but allergy-susceptible Cluster 2 with mixed wheeze; and strongly-atopic high-risk Cluster 3 with persistent wheeze. |
| Cluster 3 is consistent with an early-sensitised and multi-sensitised phenotype. |
| HDM hypersensitivity is an important predictor of wheeze in allergic or allergy -susceptible individuals. |
| Food and peanut hypersensitivities are important contributors to membership in high-risk Cluster 3. This may be pathophysiologically related to eczema, multi-sensitisation and the atopic march. |
| In CAS, IgG4 flags for clusters with susceptibility to atopic disease (CAS2 and CAS3), while early and multiple-allergen elevation in IgE predicts frank atopic disease. The pathophysiological role of IgG4 remains unclear. |
| Allergic and infective processes act additively to intensify airway inflammation during respiratory pathogen clearance. Some (Cluster 3) may be more susceptible to this effect than others that lack strong allergic sensitisation (Cluster 1). |
| Tests for atopy (IgE, SPT, cytokines) do not overlap perfectly. Therefore, atopy may be better defined by the composite result from a battery of tests encapsulated in a predictive model, rather than just a single test or threshold. |
| The microbiome acts differently on asthma risk depending on cluster membership. In CAS, early-life asymptomatic colonisation with infection-associated MPGs is associated with risk of persistent wheeze in allergy-susceptible clusters (CAS2, CAS3), while it is potentially protective in non-atopic children (CAS1) |
| Different childhood populations may share similar trajectories of asthma susceptibility, but there may be subtle differences in terms of the types of tests, allergens, or biological signals that are most informative (SPT, IgE, cytokines, etc.). |
Key resources table
| Reagent type (species) or resource | Designation | Source or reference | Identifiers |
|---|---|---|---|
| Biological sample (Homo sapiens) | Childhood Asthma Study (CAS) | DOI:10.1016/j.jaci.2005.06.038 | Microbiome sequencing data: NCBI GenBank SRP056779 |
| Biological sample (Homo sapiens) | Childhood Origins of Asthma Study (COAST) | PMID:12688623 | NA |
| Biological sample (Homo sapiens) | Manchester Asthma and Allergy Study (MAAS) | PMID:12688622 | NA |
| Software, algorithm | The R project for Statistical Computing | ISBN:3-900051-07-0 | RRID:SCR_001905 |
| Software, algorithm | ggplot2 | ISBN:978-3-319-24277-4 | RRID:SCR_014601 |
| Software, algorithm | mixtools | DOI:10.18637/jss.v032.i06 | NA |
| Software, algorithm | rpart | Therneau and Atkinson, 2015. Package 'rpart'. URL: https://cran.r-project.org/web/packages/rpart/rpart.pdf | NA |
| Software, algorithm | epiDisplay | Chongsuvivatwong, 2015. Package 'epiDisplay' URL: https://cran.r-project.org/web/packages/epiDisplay/epiDisplay.pdf | NA |
Additional files
-
Supplementary file 1
All table supplements
- https://doi.org/10.7554/eLife.35856.025
-
Supplementary file 2
Comparison of variables (respiratory, immunological, clinical) across CAS clusters.
Analogous to Table Supplement 3.
- https://doi.org/10.7554/eLife.35856.026
-
Supplementary file 3
Predictors for age-five wheeze within each CAS cluster, with demographic covariates (sex, BMI, parental history of asthma).
Analogous to Table Supplement 7.
- https://doi.org/10.7554/eLife.35856.027
-
Transparent reporting form
- https://doi.org/10.7554/eLife.35856.028
Download links
A two-part list of links to download the article, or parts of the article, in various formats.
Downloads (link to download the article as PDF)
Open citations (links to open the citations from this article in various online reference manager services)
Cite this article (links to download the citations from this article in formats compatible with various reference manager tools)
Trajectories of childhood immune development and respiratory health relevant to asthma and allergy
eLife 7:e35856.
https://doi.org/10.7554/eLife.35856


