A Rho signaling network links microtubules to PKD controlled carrier transport to focal adhesions
- University of Stuttgart, Germany
Figures
Figure 1 with 1 supplement
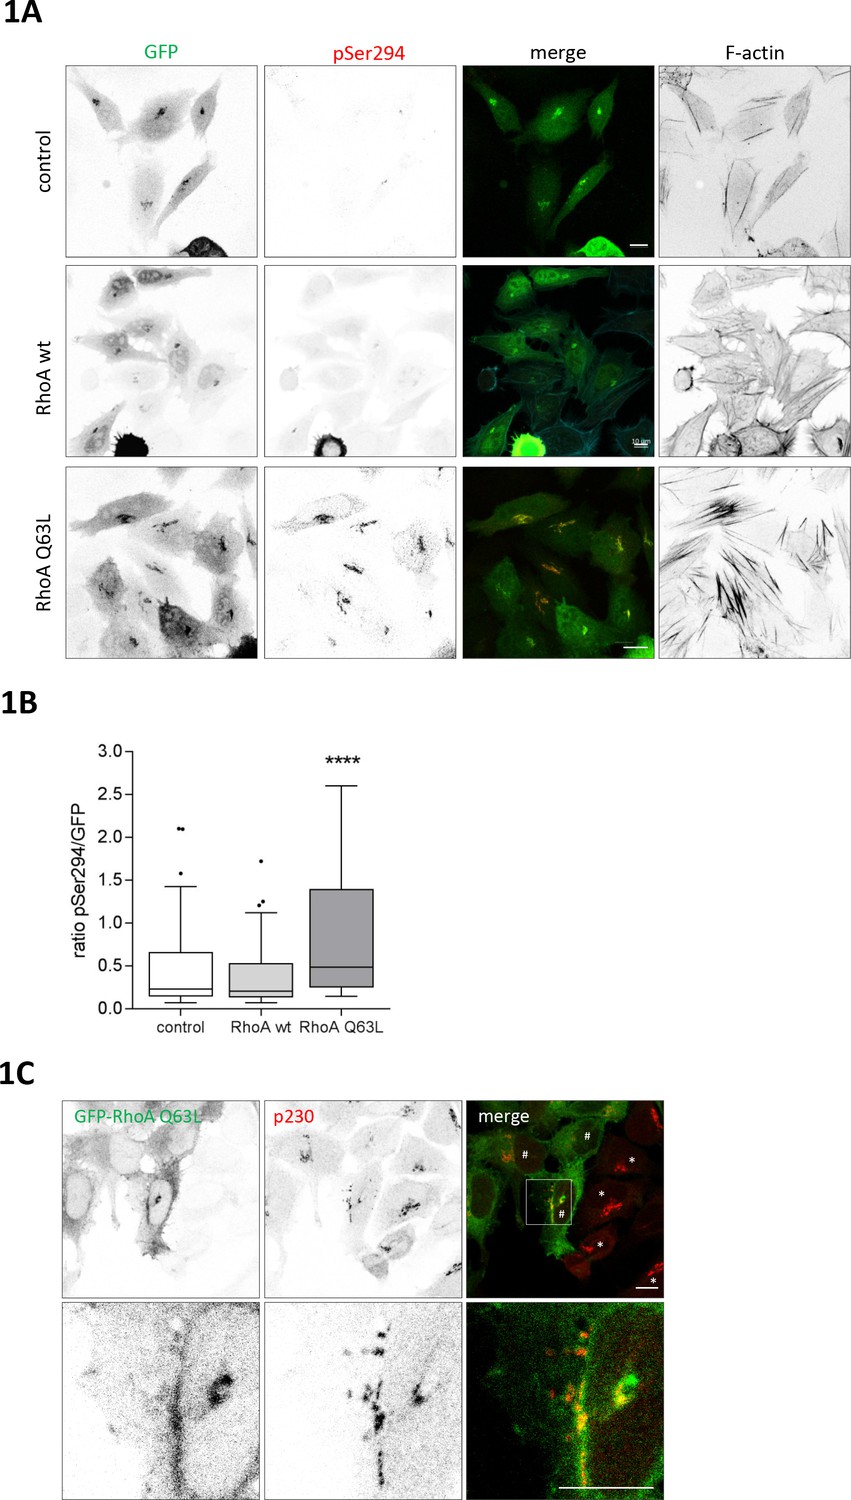
RhoA activates PKD at the TGN.
HeLa cells were transfected with G-PKDrep plus control vector, or a plasmid encoding HA-tagged RhoA wt or RhoA Q63L. One day after transfection cells were fixed and stained for G-PKDrep phosphorylation (pSer294) and F-actin (Alexa633-labelled phalloidin). Images were quantified by ratiometric calculation of GFP and Alexa546-labelled pSer294 signal. (A) Shown are representative confocal images, scale bar 10 µm. (B) The box plot shows the results of three independent experiments. Center lines show the medians; box limits indicate the 25th and 75th percentiles as determined by GraphPad Prism 7 software; whiskers extend 1.5 times the interquartile range from the 25th and 75th percentiles, outliers are represented by dots. n = 72 sample points each. The significance of differences was analyzed by a one-way ANOVA (Kruskal-Wallis test) followed by a Dunn’s multiple comparison test. ****p<0.0001 (control vs. RhoA Q63L). (C) HeLa cells were transfected with a plasmid encoding GFP-tagged RhoA Q63L, fixed 24 hr later, and stained for the trans Golgi protein p230 (red). Shown is a confocal image, scale bar 10 µm. Yellow regions indicate co-localization. * indicates cells with a compact Golgi complex, # indicates cells with a fragmented Golgi complex.
Figure 1—figure supplement 1
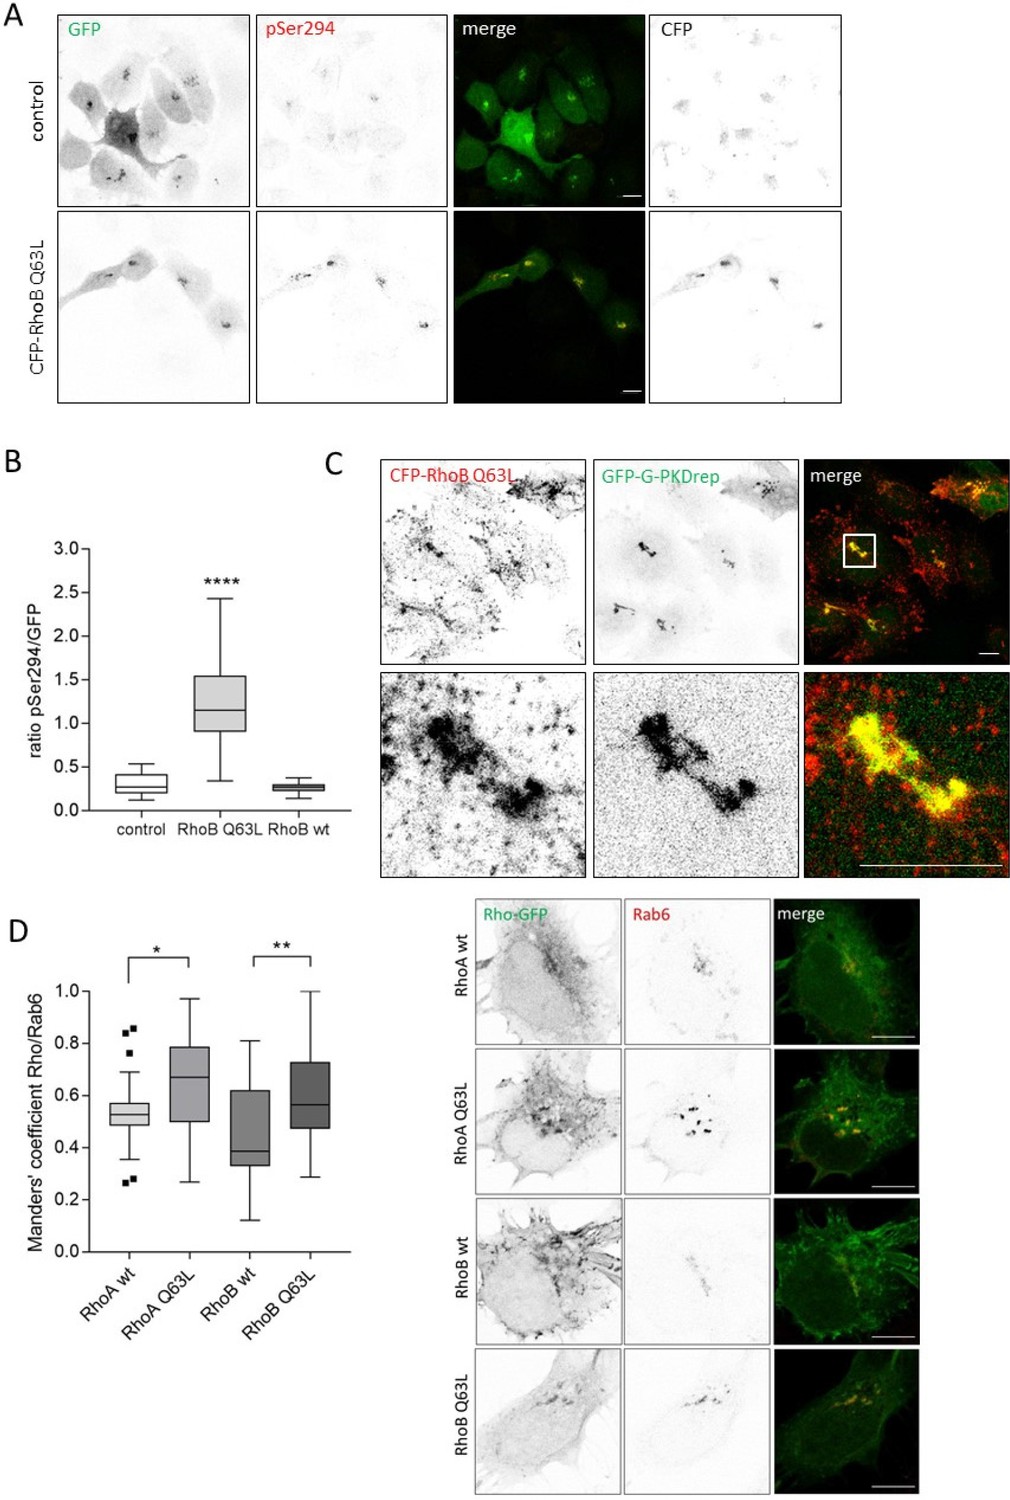
RhoB activates PKD at the TGN.
HeLa cells were transfected with G-PKDrep plus control vector or a plasmid encoding CFP-tagged RhoB Q63L. One day after transfection cells were fixed and stained for G-PKDrep phosphorylation (pSer294). Images were quantified by ratiometric calculation of GFP and Alexa546-labelled pSer294 signal. (A) Shown are representative confocal images, scale bar 10 µm. (B) The box plot shows the results of a representative experiment. Center lines show the medians; box limits indicate the 25th and 75th percentiles as determined by GraphPad Prism 7 software; whiskers extend 1.5 times the interquartile range from the 25th and 75th percentiles, outliers are represented by dots. n = 31, 28, 28 sample points. Statistical analysis was done using a one-way ANOVA followed by a Dunn’s multiple comparison test. ****p<0.0001 for control vs. RhoB Q63L. (C) HeLa cells were transfected with a plasmid encoding CFP-tagged RhoB Q63L plus GFP-tagged G-PKDrep and fixed 24 hr later (red). Shown is a confocal image, scale bar 10 µm. Yellow regions indicate co-localization. (D) Co-localization of GFP-tagged RhoA and RhoB wt and Q63L with Rab6. HeLa cells were transfected with the indicated plasmids, fixed 24 hr later, and stained for Rab6 (Alexa 633). Left panel: The box plot shows the co-localization results of two independent experiments. Center lines show the medians; box limits indicate the 25th and 75th percentiles as determined by GraphPad Prism 7 software; whiskers extend 1.5 times the interquartile range from the 25th and 75th percentiles, outliers are represented by dots. n = 52, 61, 56, 51 sample points. Statistical analysis was done using a one-way ANOVA (Kruskal Wallis) followed by a Dunns multiple comparison test. *p<0.05. **p<0.01. Right panel: Shown are representative confocal images, scale bar 10 µm.
Figure 2 with 3 supplements
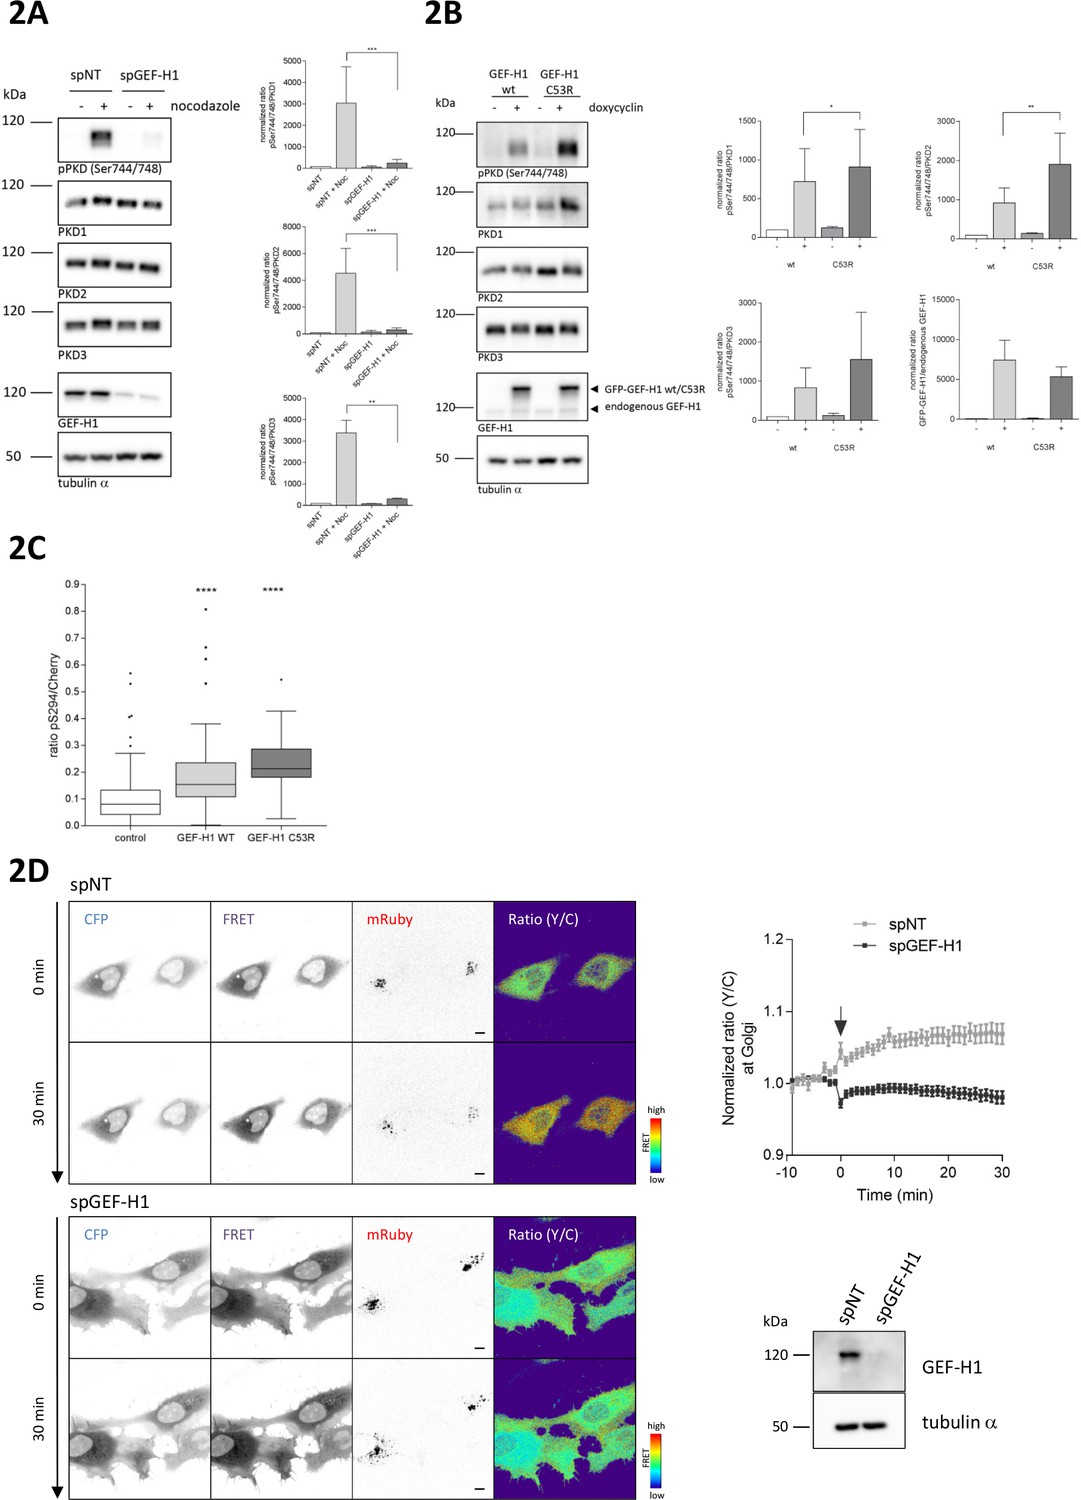
Nocodazole-mediated PKD activation at the TGN requires GEF-H1.
(A) HEK293T cells were transfected with spGEF-H1, spNT was used as a control. Three days after transfection cells were stimulated with nocodazole for 60 min, lysed and analyzed for PKD activity (pPKD (Ser744/748) and expression of PKD1, 2, and 3. Detection of alpha tubulin served as a loading control. Successful depletion of GEF-H1 was verified by detection with a GEF-H1 specific antibody. Shown is a representative Western blot. The integrated density of the pPKD and PKD1-3 signal was measured, corrected for background signals and the ratio (pPKD/PKD) calculated. Data were normalized to the control (spNT -nocodazole), which was set to 100. The graphs show the mean ± SEM of three independent experiments. The significance of differences was analyzed by a Ratio paired t-test (two-tailed). ***p=0.0007 (ratio pPKD Ser744/748/PKD1) and p=0.0002 (ratio pPKD Ser744/748/PKD2), **p=0.0014 (ratio pPKD Ser744/748/PKD3). (B) FlpIn T-Rex 293 EGFP-GEF-H1 wt or FlpIn T-REx 293 EGFP-GEF-H1 C53R cells were left untreated (-) or treated with doxycyline for 18 hr (+). Cells were lysed and analysed for PKD activity, PKD1-3 expression and endogenous as well as ectopic GEF-H1 expression. Detection of alpha tubulin served as loading control. Shown is a representative Western blot. Quantification of Western blot data was done as described in Figure 2A. Data were normalized to the control (GEF-H1 wt untreated), which was set to 100. The graphs show the mean ± SEM of three independent experiments. The significance of differences was analyzed by a Ratio paired t-test (two-tailed). *p=0.0365 (ratio pPKD Ser744/748/PKD1) and **p=0.0023 (ratio pPKD Ser744/748/PKD2). (C) FlpIn T-Rex HeLa EGFP-GEF-H1 wt or EGFP-GEF-H1 C53R cells were transfected with a Cherry-tagged G-PKDrep. One day after transfection cells expression of GEF-H1-GFP was induced by doxycyline. One day later, cells were fixed and stained for G-PKDrep phosphorylation (pSer294). Images were quantified by ratiometric calculation of Cherry and Alexa633-labelled pSer294 signal. Cells without doxycycline treatment were used as control. The box plot shows the results of three independent experiments. Center lines show the medians; box limits indicate the 25th and 75th percentiles as determined by GraphPad Prism 7 software; whiskers extend 1.5 times the interquartile range from the 25th and 75th percentiles, outliers are represented by dots. n = 89, 56, 23 sample points. The significance of differences was analyzed by a one-way ANOVA (Kruskal-Wallis test) followed by a Dunns multiple comparison test. ****p<0.0001 (control vs GEF-H1 wt or GEF-H1 C53R). (D) HeLa cells were transfected with the indicated siRNAs. Two days later, cells were transfected with the RhoA Biosensor along with mRuby-Golgi-7 (ratio 6:1) and, after 24 hr, stimulated with nocodazole and imaged. Left panel, representative images taken at 0 and 30 min of stimulation are shown; scale bar 10 µm. Right panel, the graph shows the mean ± SEM of at least 40 cells imaged in two independent experiments. The arrow indicates the time point of nocodazole stimulation. Successful depletion of GEF-H1 was verified by Western Blot analysis. Detection of alpha tubulin served as a loading control.
Figure 2—figure supplement 1
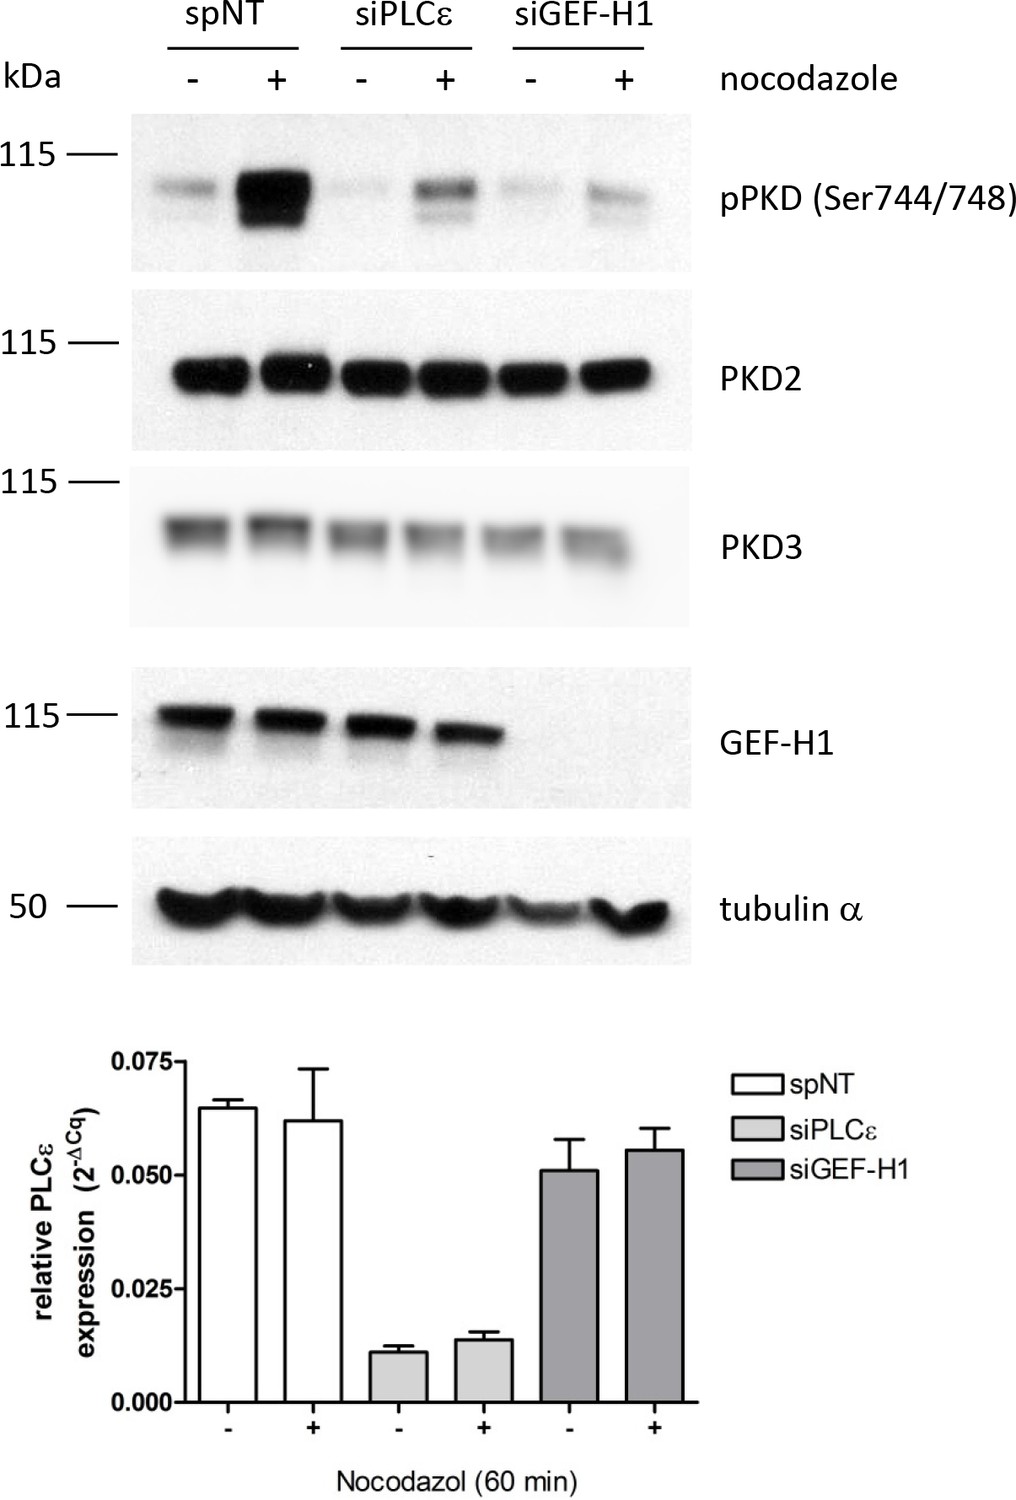
Validation of the requirement of PLCε and GEF-H1 for nocodazole-induced PKD activation.
HEK293T cells were transfected with single siRNAs specific for GEF-H1 or PLCε, spNT was used as a control. Three days after transfection cells were stimulated with nocodazole for 60 min, lysed and analyzed for PKD activity (pPKD Ser744/748) and expression of PKD2 and PKD3. Detection of alpha tubulin served as a loading control. GEF-H1 depletion was verified by immunoblotting using a specific antibody. Successful depletion of PLCε was verified by RT-qPCR. Relative expression was calculated by normalization to actin using the ΔCq method.
Figure 2—figure supplement 2
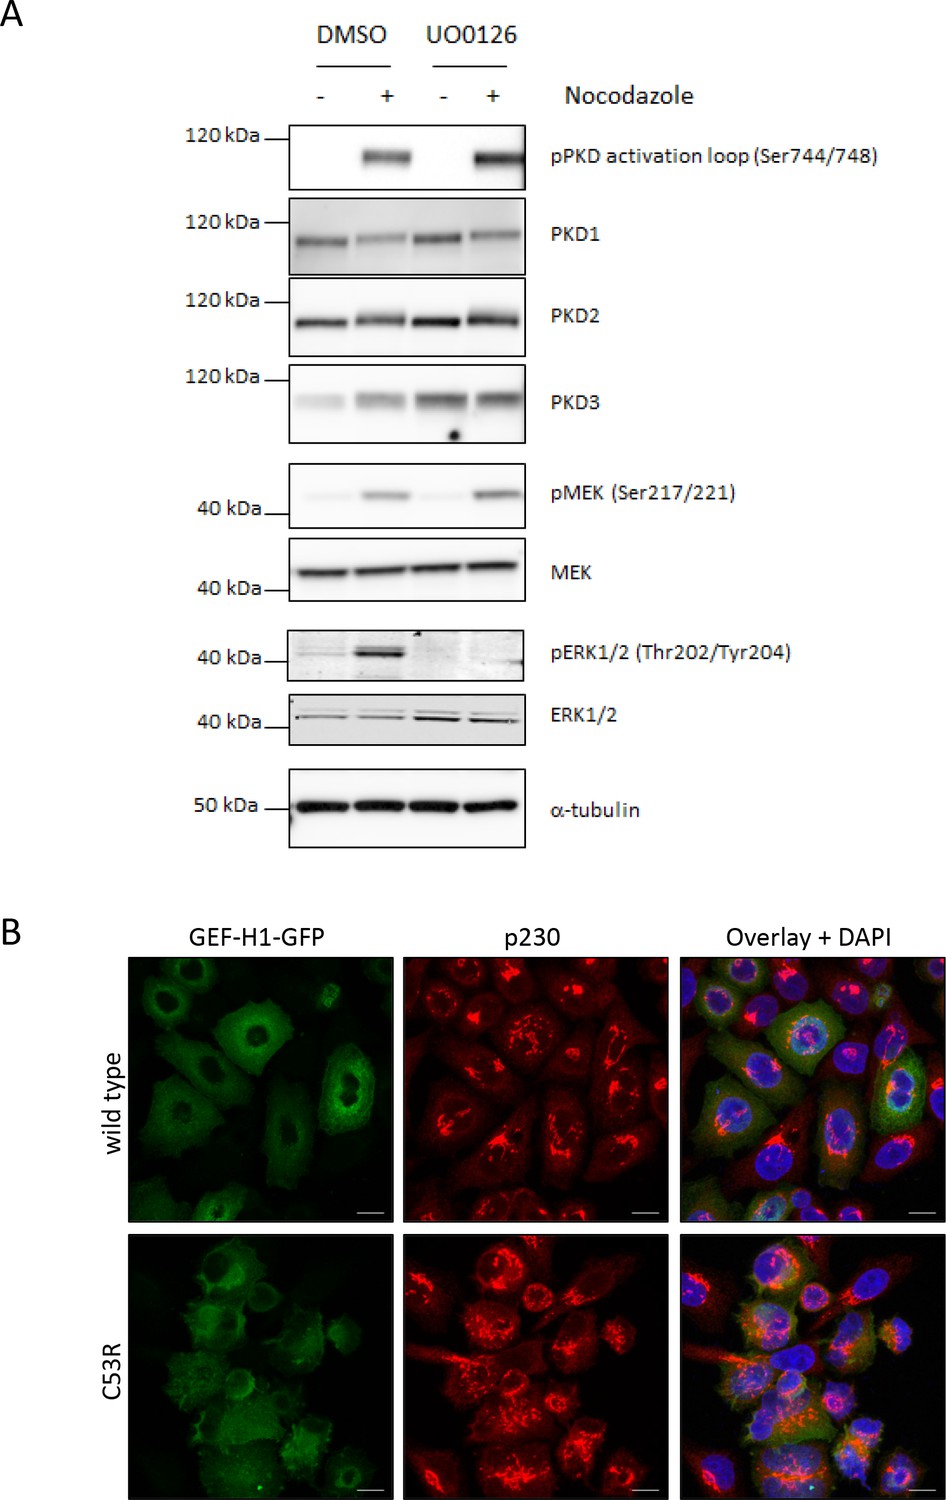
GEF-H1 mediated PKD activation is independent of ERK
(A) Nocodazole-mediated PKD activation is independent of the MAPK pathway. HEK293 cells were left untreated (-) or stimulated with nocodazole for 30 min. Prior to nocodazole stimulation cells were treated with DMSO or UO0126 (10 µM) for one hour. Cells were lysed and analyzed for phosphorylation and expression of PKD1-3, MEK1/2, and ERK1/2. Detection of tubulin served as a loading control. (B) Localization of GEF-H1 wt and GEF-H1 C53R. FlpIN T-REx Hela EGFP-GEF-H1 wt or C53R cells were treated with doxycycline to induce expression of GFP-GEF-H1. 24 hr later cells were fixed and stained for p230. Shown are representative confocal images, scale bar 10 µm.
Figure 2—figure supplement 3

The RhoA biosensor localizes to the Golgi complex.
HeLa cells were transfected with plasmids encoding the RhoA Biosensor and mRuby-Golgi-7 (ratio 6:1). Cells were imaged one day later at the Spinning disc microscope. Scale bar 10 µm.
Figure 3 with 2 supplements
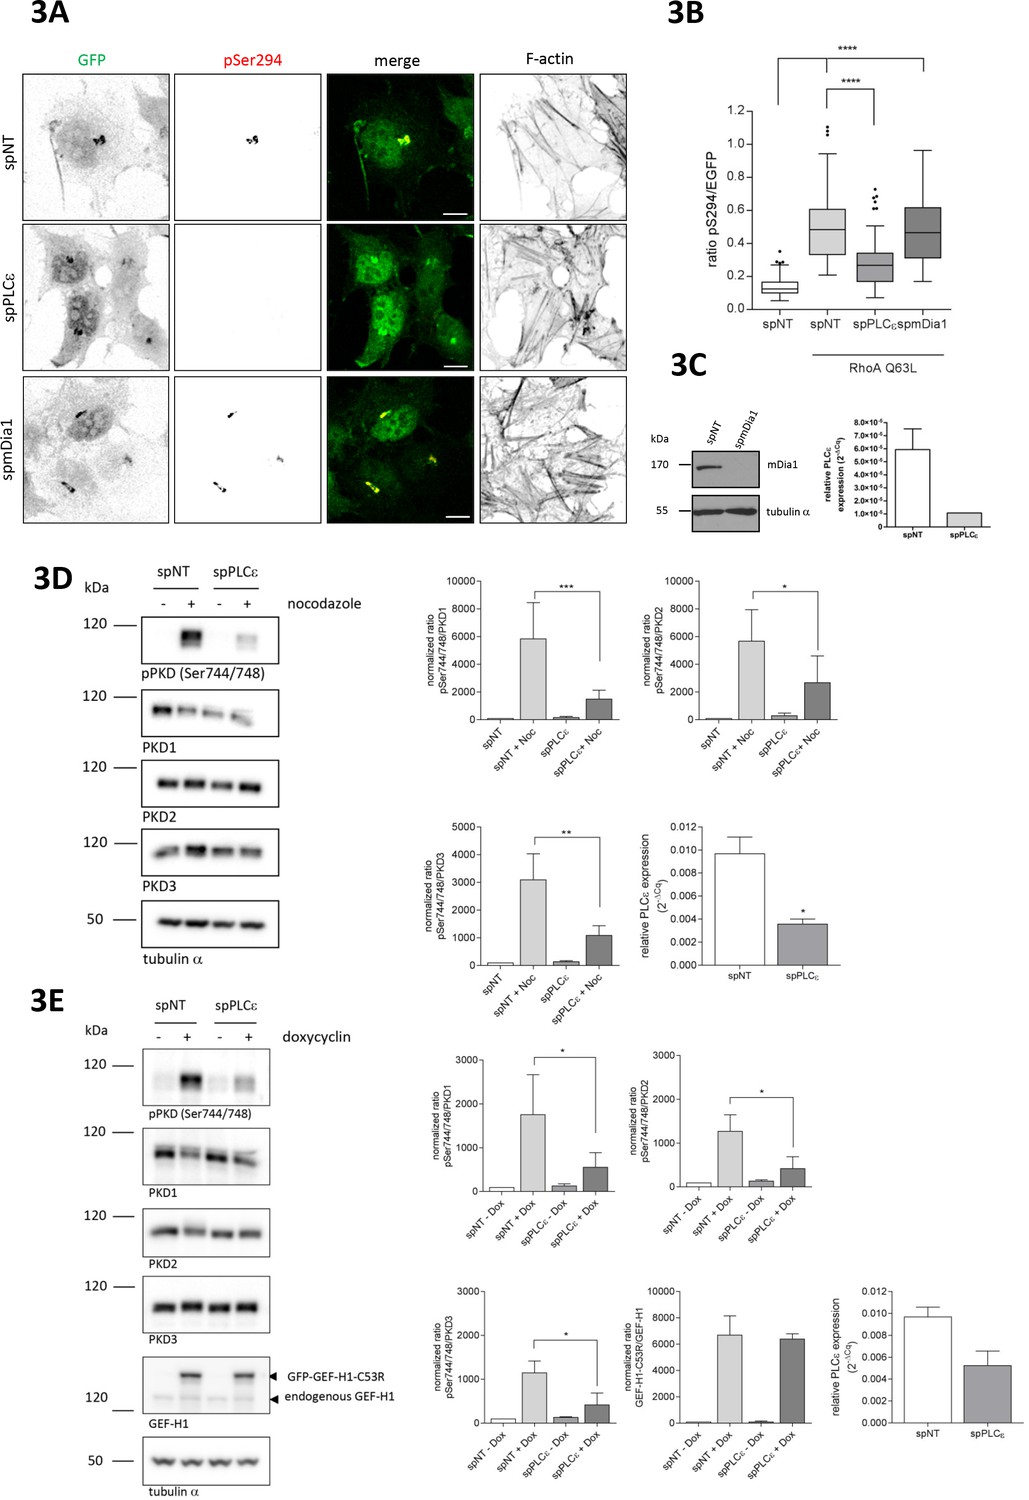
The Rho effector PLCε is required for GEF-H1 mediated PKD activation at the TGN.
(A) HeLa cells were transfected with spRNAs as indicated, spNT was used as a control. Two days after transfection cells were transfected with G-PKDrep and RhoA Q63L and, after 24 hr, fixed, stained and analyzed as described in Figure 1A. Shown are representative confocal images, scale bar 10 µm. (B) The box plot shows the results of three independent experiments. Center lines show the medians; box limits indicate the 25th and 75th percentiles as determined by GraphPad Prism 7 software; whiskers extend 1.5 times the interquartile range from the 25th and 75th percentiles, outliers are represented by dots. n = 90 sample points each. The significance of differences was analyzed by a one-way ANOVA followed by a Dunns multiple comparison test. ***p<0.0001. (C) Left panel, silencing efficiency of mDia1 was analyzed in lysates by immunoblotting using a mDia1-specific antibody. Equal loading was verified by detection of alpha tubulin. Right panel, successful depletion of PLCε was verified by RT-qPCR. Relative expression was calculated by normalization to GAPDH using the ΔCq method. Shown is the mean ± SEM of two independent experiments. (D) Left panel, HEK293T cells were transfected with the spPLCε, spNT was used as a control. Three days post transfection cells were left untreated or stimulated with nocodazole for 60 min. Detection of active PKD and expression of PKD1-3 was performed in cell lysates using specific antibodies. Equal loading was verified by detection of alpha tubulin. Shown is a representative Western blot. Right panel, quantification of Western blot data was done as described in Figure 2A. Data were normalized to the control (untreated spNT cells), which was set to 100. The graphs show the mean ± SEM of three independent experiments. The significance of differences was analyzed by a Ratio paired t-test (two-tailed). ***p=0.0007 (ratio pPKD Ser744/748/PKD1), *p=0.0334 (ratio pPKD Ser744/748/PKD2), and **p=0.0026 (ratio pPKD Ser744/748/PKD3). Successful depletion of PLCε was verified by RT-qPCR. Relative expression was calculated by normalization to Actin using the ΔCq method. Shown is the mean ± SEM of three independent experiments. The significance of differences was analyzed by a Ratio paired t-test (two-tailed). *p=0.0157 (E) Left panel, FlpIn T-REx 293 EGFP-GEF-H1 C53R cells were transfected with spPLCε, spNT was used as a control. Two days later, GFP-GEF-H1 C53R expression was induced by doxycycline treatment. After one day, cells were lysed and analysed for PKD activity, PKD1-3 expression and endogenous as well as ectopic GEF-H1 expression. Detection of alpha tubulin served as a loading control. Shown is a representative Western blot. Right panel, quantification of Western blot data was done as described in Figure 2A. Data were normalized to the control (spNT cells without doxycycline), which was set to 100. The graphs show the mean ± SEM of three independent experiments. The significance of differences was analyzed by a Ratio paired t-test (two-tailed). *p=0.0266 (ratio pPKD Ser744/748/PKD1), p=0.0106 (ratio pPKD Ser744/748/PKD2), and p=0.0152 (ratio pPKD SerS744/748/PKD3). Successful depletion of PLCε was verified by RT-qPCR. Relative expression was calculated by normalization to Actin using the ΔCq method. Shown is the mean ± SEM of three independent experiments.
Figure 3—figure supplement 1
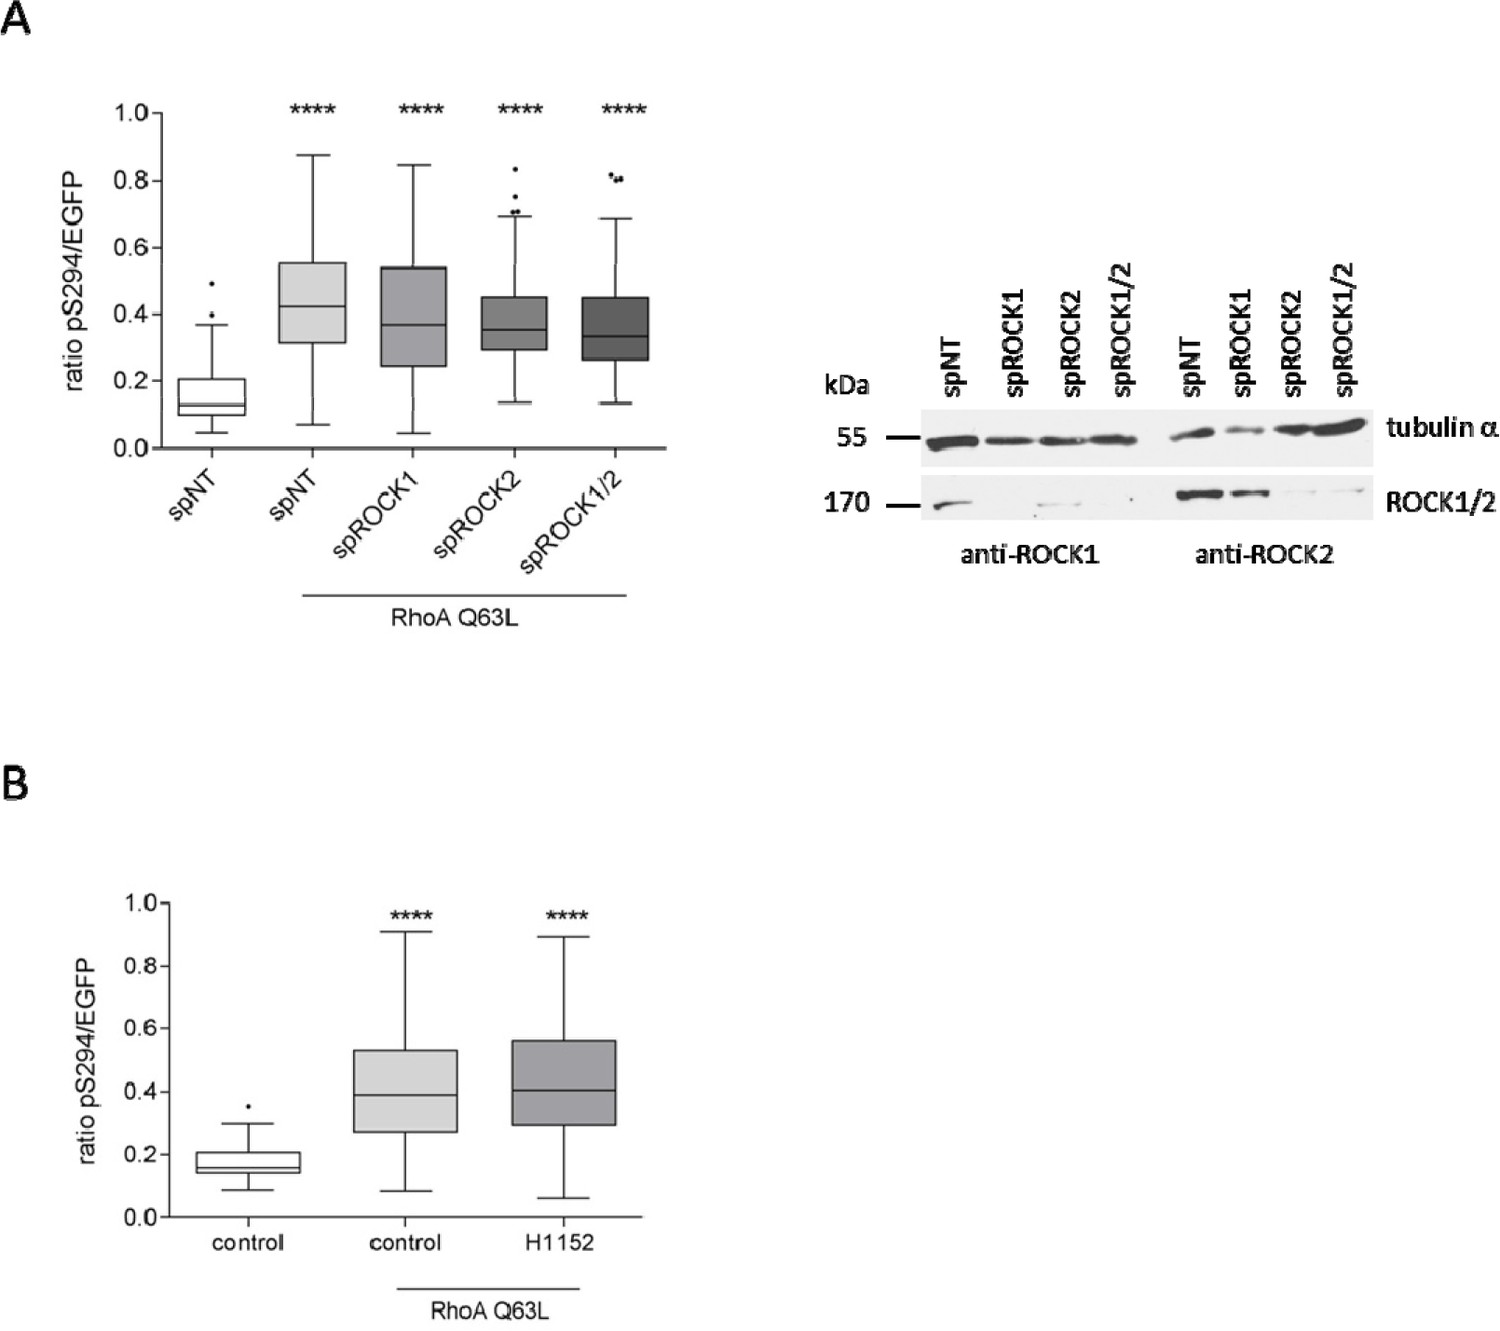
ROCK1 and ROCK2 are not involved in PKD activation at the TGN.
(A) HeLa cells were transfected with the indicated spRNAs, spNT was used as a control. Two days after transfection cells were transfected with G-PKDrep and RhoA Q63L and, after 24 hr, fixed, stained and analyzed as described in Figure 1A. The box plot shows the results of three independent experiments. Center lines show the medians; box limits indicate the 25th and 75th percentiles as determined by GraphPad Prism 7 software; whiskers extend 1.5 times the interquartile range from the 25th and 75th percentiles, outliers are represented by dots. n = 90 sample points each. The significance of differences was analyzed by a one-way ANOVA followed by a Dunns multiple comparison test. ****p<0.0001. Right panel, successful depletion of ROCK1 and ROCK2 were verified by immunoblotting using specific antibodies. Alpha tubulin detection served as a loading control. (B) HeLa cells were transfected with G-PKDrep and RhoA Q63L. After 24 hr, cells were treated with DMSO or with 10 µM H1152 for 6 hr. Subsequently, cells were fixed, stained and analysed as described in Figure 1A. The box plot shows the results of three independent experiments. Center lines show the medians; box limits indicate the 25th and 75th percentiles as determined by GraphPad Prism 7 software; whiskers extend 1.5 times the interquartile range from the 25th and 75th percentiles, outliers are represented by dots. n = 90, 60, 61 sample points. The significance of differences was analyzed by a one-way ANOVA followed by a Dunn’s multiple comparison test. ****p<0.0001.
Figure 3—figure supplement 2
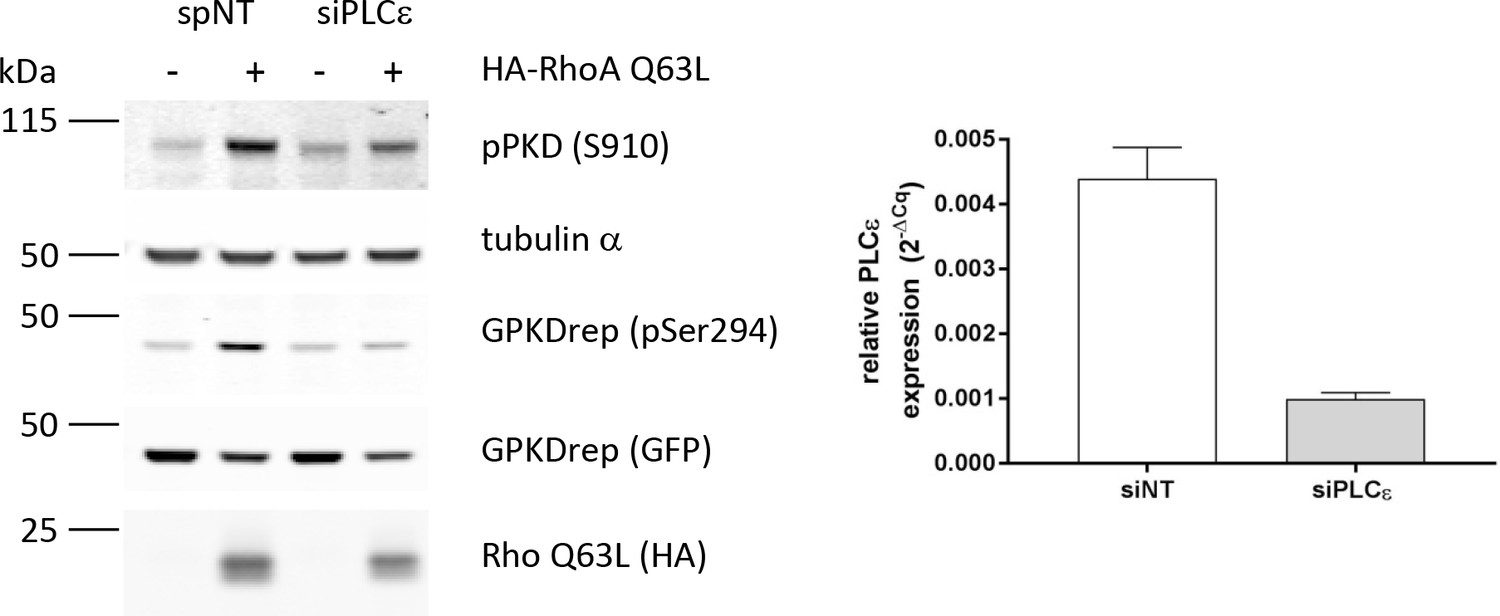
Validation of PLCε as Rho-effector protein in PKD activation at the TGN using an independent siRNA.
Left panel, HEK293T cells were transfected with a PLCε-specific single siRNA, spNT was used as a control. Two days after transfection cells were transfected with G-PKDrep plus an empty vector or HA-tagged RhoA Q63L. 24 hr later, cells were lysed and phosphorylation plus expression of G-PKDrep was analyzed by Western blotting using the pSer294-specific and GFP-specific antibody, respectively. Expression of RhoA Q63L was verified using a HA-specific antibody. Activity of endogenous PKD was detected using the pSer910 antibody. Detection of alpha tubulin served as a loading control. Right panel, successful depletion of PLCε was controlled by quantitative RT-PCR. The graph shows a representative experiment.
Figure 4 with 1 supplement
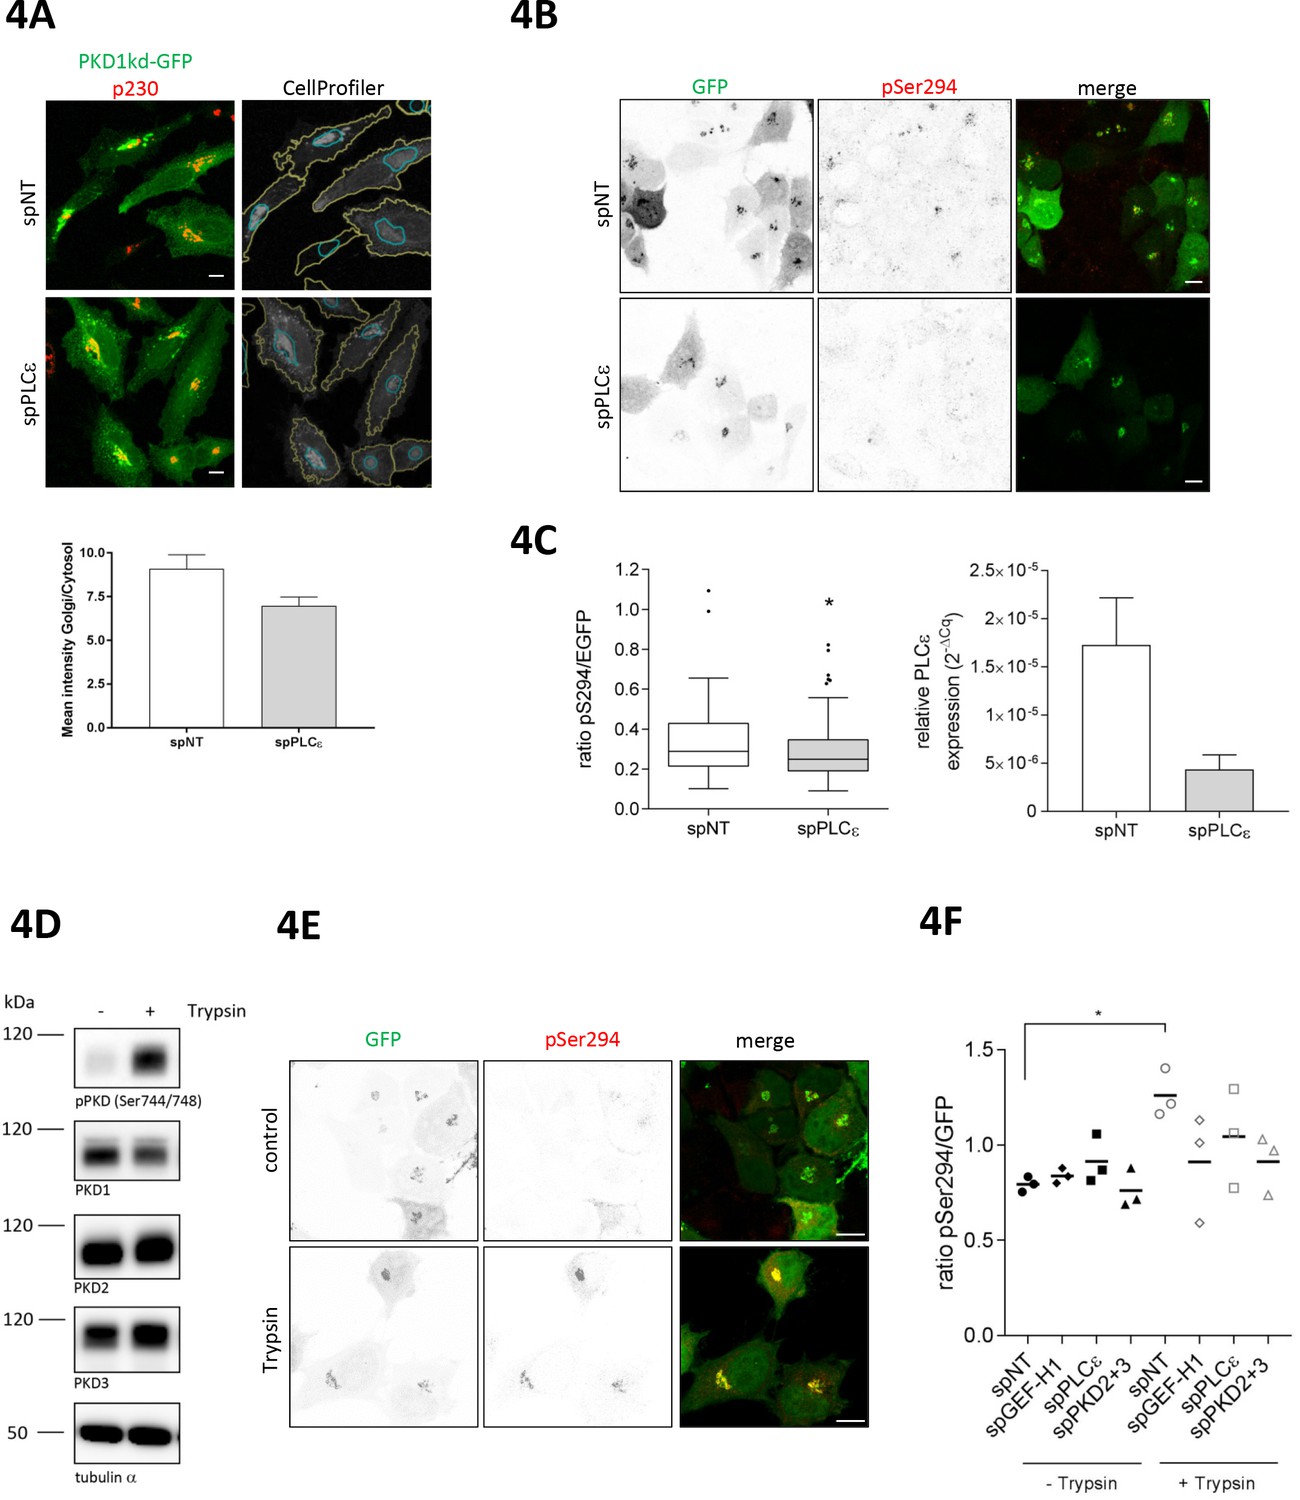
PLCε is required for basal and trypsin-induced PKD activity at the TGN.
(A) Top panel, HeLa cells were transfected with spPLCε, spNT was used as a control. Two days later, cells were transfected with a plasmid encoding PKD1kd-GFP. After 24 hr, cells were fixed and stained for p230. Representative confocal images are shown; scale bar 10 µm. CellProfiler images show the masks defining the Golgi complex (blue) and the cytosol (yellow) merged with the PKD1kd-GFP image (shown in greyscale). Bottom panel, the fluorescence intensities of the GFP signal were measured under both masks and the Golgi/Cytosol ratio was calculated for each cell. The graph shows the mean ± SEM of at least 150 cells analysed. (B) HeLa cells were transfected with siRNAs as described in E. Two days later, cells were transfected with G-PKDrep. Visualization and analysis of G-PKDrep phosphorylation was performed as described in Figure 1A. Shown are representative confocal images, scale bar 10 µm. (C) Left panel, the box plot shows the results of three independent experiments. Center lines show the medians; box limits indicate the 25th and 75th percentiles as determined by GraphPad Prism 7 software; whiskers extend 1.5 times the interquartile range from the 25th and 75th percentiles, outliers are represented by dots. n = 114, 104 sample points. The significance of differences was analyzed by a two-tailed t-test (Mann-Whitney test), *p<0.05. Right panel, successful depletion of PLCε was verified by RT-qPCR. Relative expression was calculated by normalization to GAPDH using the ΔCq method. Shown is the mean ± SEM of two independent experiments. (D) HEK293T cells were left untreated or stimulated with trypsin. Cells were lysed and detection of active PKD (pPKD Ser744/748) and expression of PKD1-3 was performed using specific antibodies. Equal loading was verified by detection of alpha tubulin. (E, F) HeLa cells were transfected with spRNAs as indicated, spNT was used as a control. Two days after transfection cells were transfected with G-PKDrep. 24 hr later, cells were left untreated or stimulated with trypsin, fixed, stained and analyzed as described in Figure 1A. (E) Shown are representative confocal images of the spNT control, scale bar 10 µm. (F) The scatter dot blot shows the result of three independent experiments, line indicates the mean. Each dot represents one experiment with at least 30 cells analysed. The significance of differences was analyzed by a one-way ANOVA (Friedman test) followed by a Dunn’s multiple comparison test. *p=0.0306 (spNT – trypsin vs. spNT + trypsin). All other comparisons were not significant. Successful depletion of the proteins was verified by Western blot or RT-qPCR (data not shown).
Figure 4—figure supplement 1
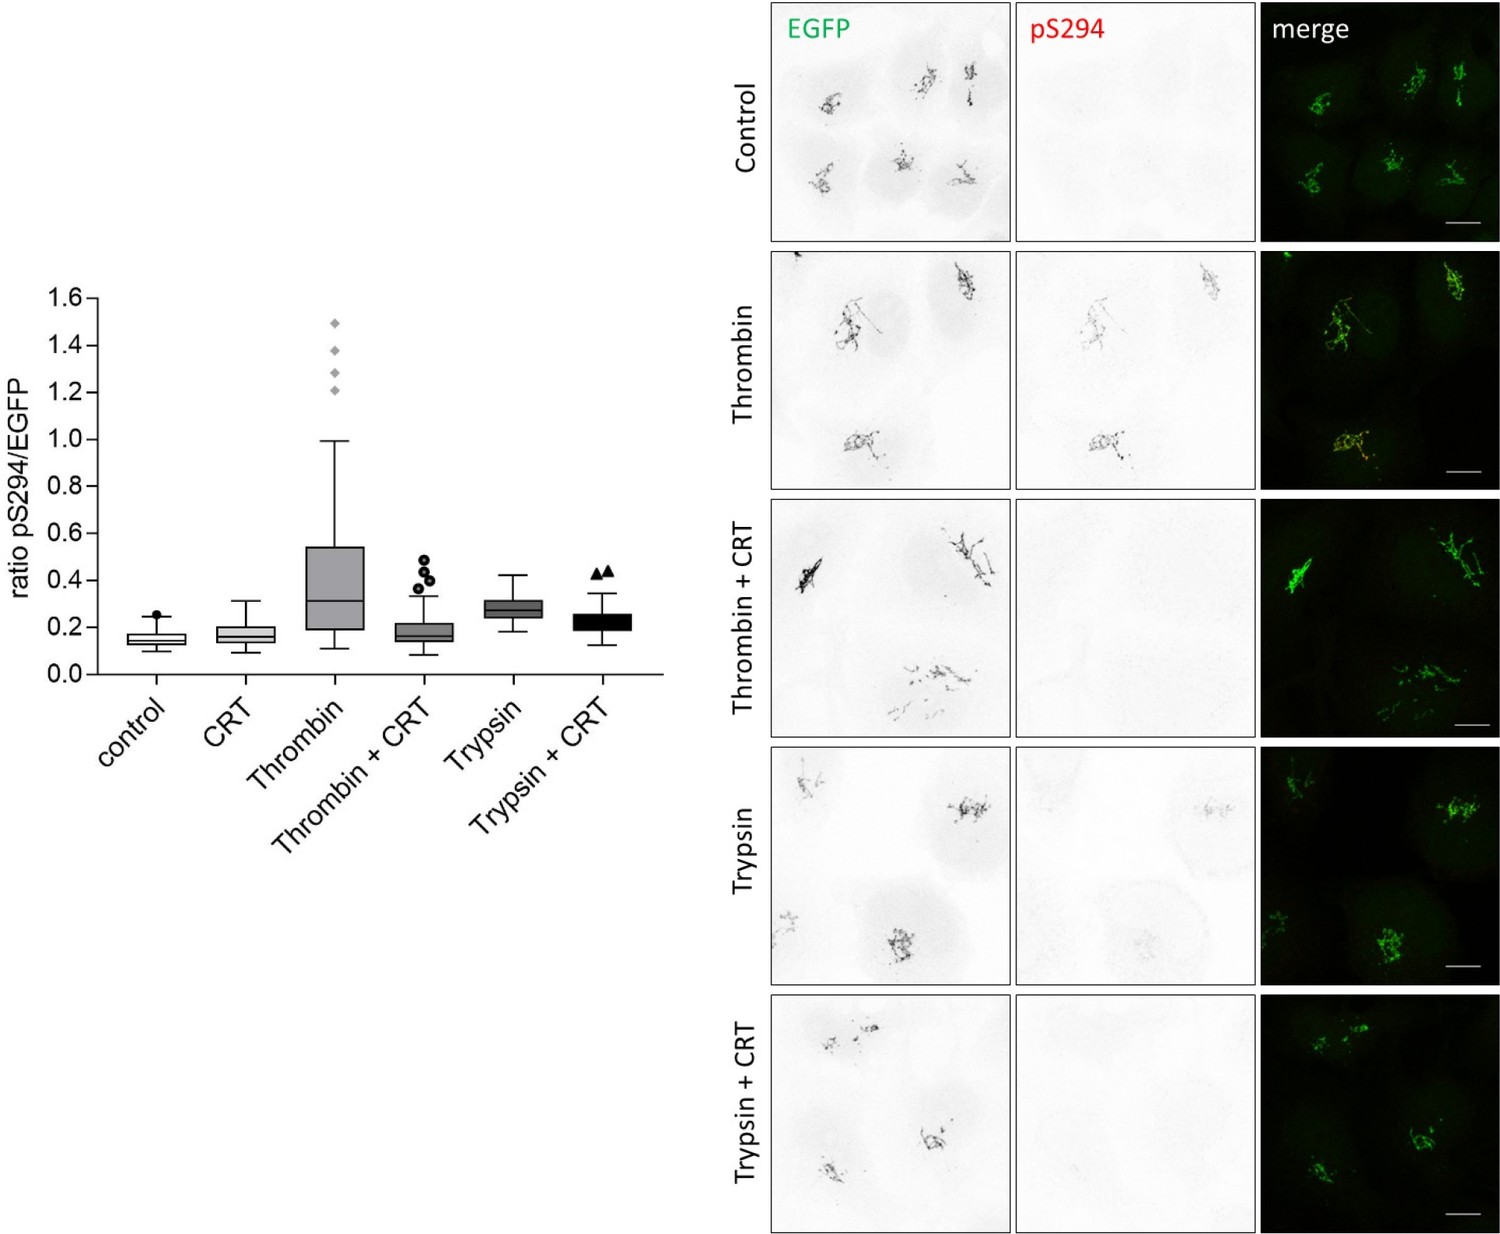
PAR stimulation through thrombin and trypsin activates PKD at the Golgi.
HeLa cells were transfected with G-PKDrep. 24 hr later, cells were starved in serum free medium and treated with CRT0066101 at 5 µM for one hour, DMSO was used as a control. Subsequently, cells were treated with thrombin (10 nM) or trypsin (10 nM) for 5 min. Cells were fixed and stained for G-PKDrep phosphorylation (pSer294). Images were quantified by ratiometric calculation of GFP and Alexa546-labelled pSer294 signal. Shown are representative confocal images, scale bar 10 µm. The box plot shows the results of a representative experiment. Center lines show the medians; box limits indicate the 25th and 75th percentiles as determined by GraphPad Prism 7 software; whiskers extend 1.5 times the interquartile range from the 25th and 75th percentiles, outliers are represented by dots. n = 39, 38, 58, 50, 38, 48 sample points each.
Figure 5
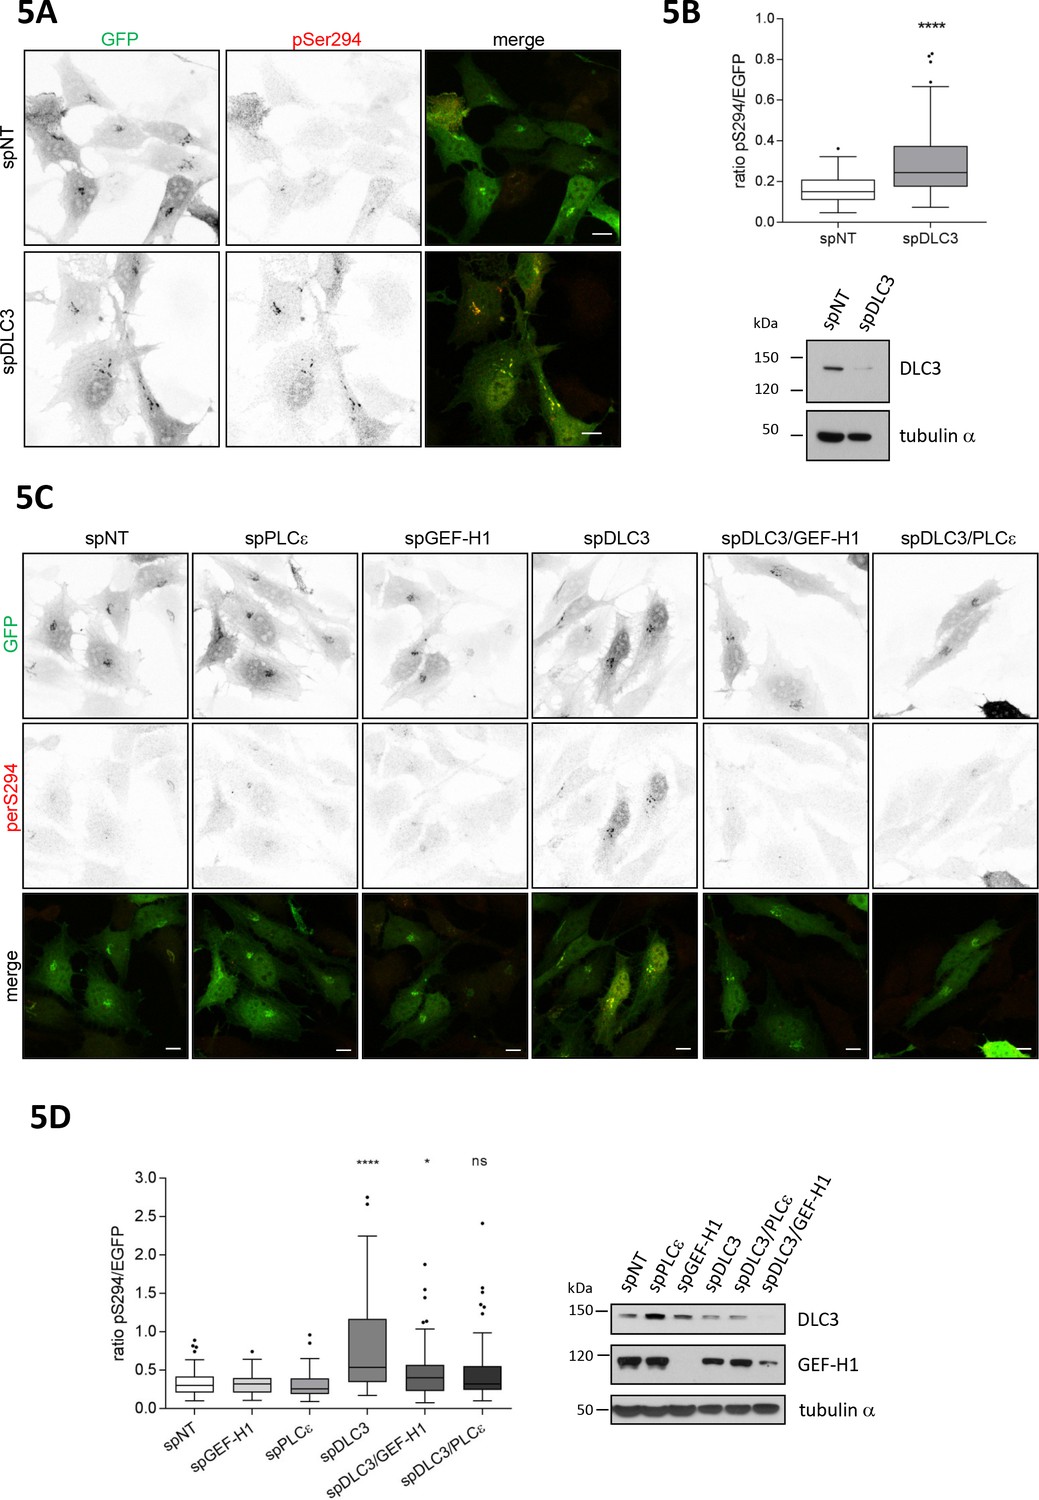
Loss of the RhoGAP DLC3 promotes PKD activation at the TGN.
(A) HeLa cells were transfected with spRNAs as indicated. Two days after transfection cells were transfected with G-PKDrep and, after 24 hr, fixed, stained and analyzed by ratiometric measurement as described in Figure 1A. Representative confocal images are shown, scale bar 10 µm. (B) Top panel, the box plot shows the results of three independent experiments. Center lines show the medians; box limits indicate the 25th and 75th percentiles as determined by GraphPad Prism 7 software; whiskers extend 1.5 times the interquartile range from the 25th and 75th percentiles, outliers are represented by dots. n = 90 sample points each. The significance of differences was analyzed by a two-tailed t-test (Mann-Whitney test). ****p<0.0001. Bottom panel, silencing efficiency of DLC3 was analyzed in lysates by immunoblotting using a DLC3-specific antibody. Equal loading was verified by detection of alpha tubulin. (C) Cells were transfected with spRNAs as indicated. Two days after transfection cells were transfected with G-PKDrep and, after 24 hr, fixed, stained and analyzed by ratiometric imaging as described in 1A. Representative confocal images are shown, scale bar 10 µm. (D) The box plot shows the results of three independent experiments. Center lines show the medians; box limits indicate the 25th and 75th percentiles as determined by GraphPad Prism 7 software; whiskers extend 1.5 times the interquartile range from the 25th and 75th percentiles, outliers are represented by dots. n = 83, 73, 73, 75, 73, 75 sample points. The significance of differences was calculated by a one-way ANOVA (Kruskal-Wallis test) followed by a Dunn’s multiple comparison test. ****p<0.0001, *p=0.0393. ns, not significant. Right panel, silencing efficiency of GEF-H1 and DLC3 were verified in lysates by immunoblotting using specific antibodies. Detection of alpha tubulin served as a loading control.
Figure 6 with 1 supplement
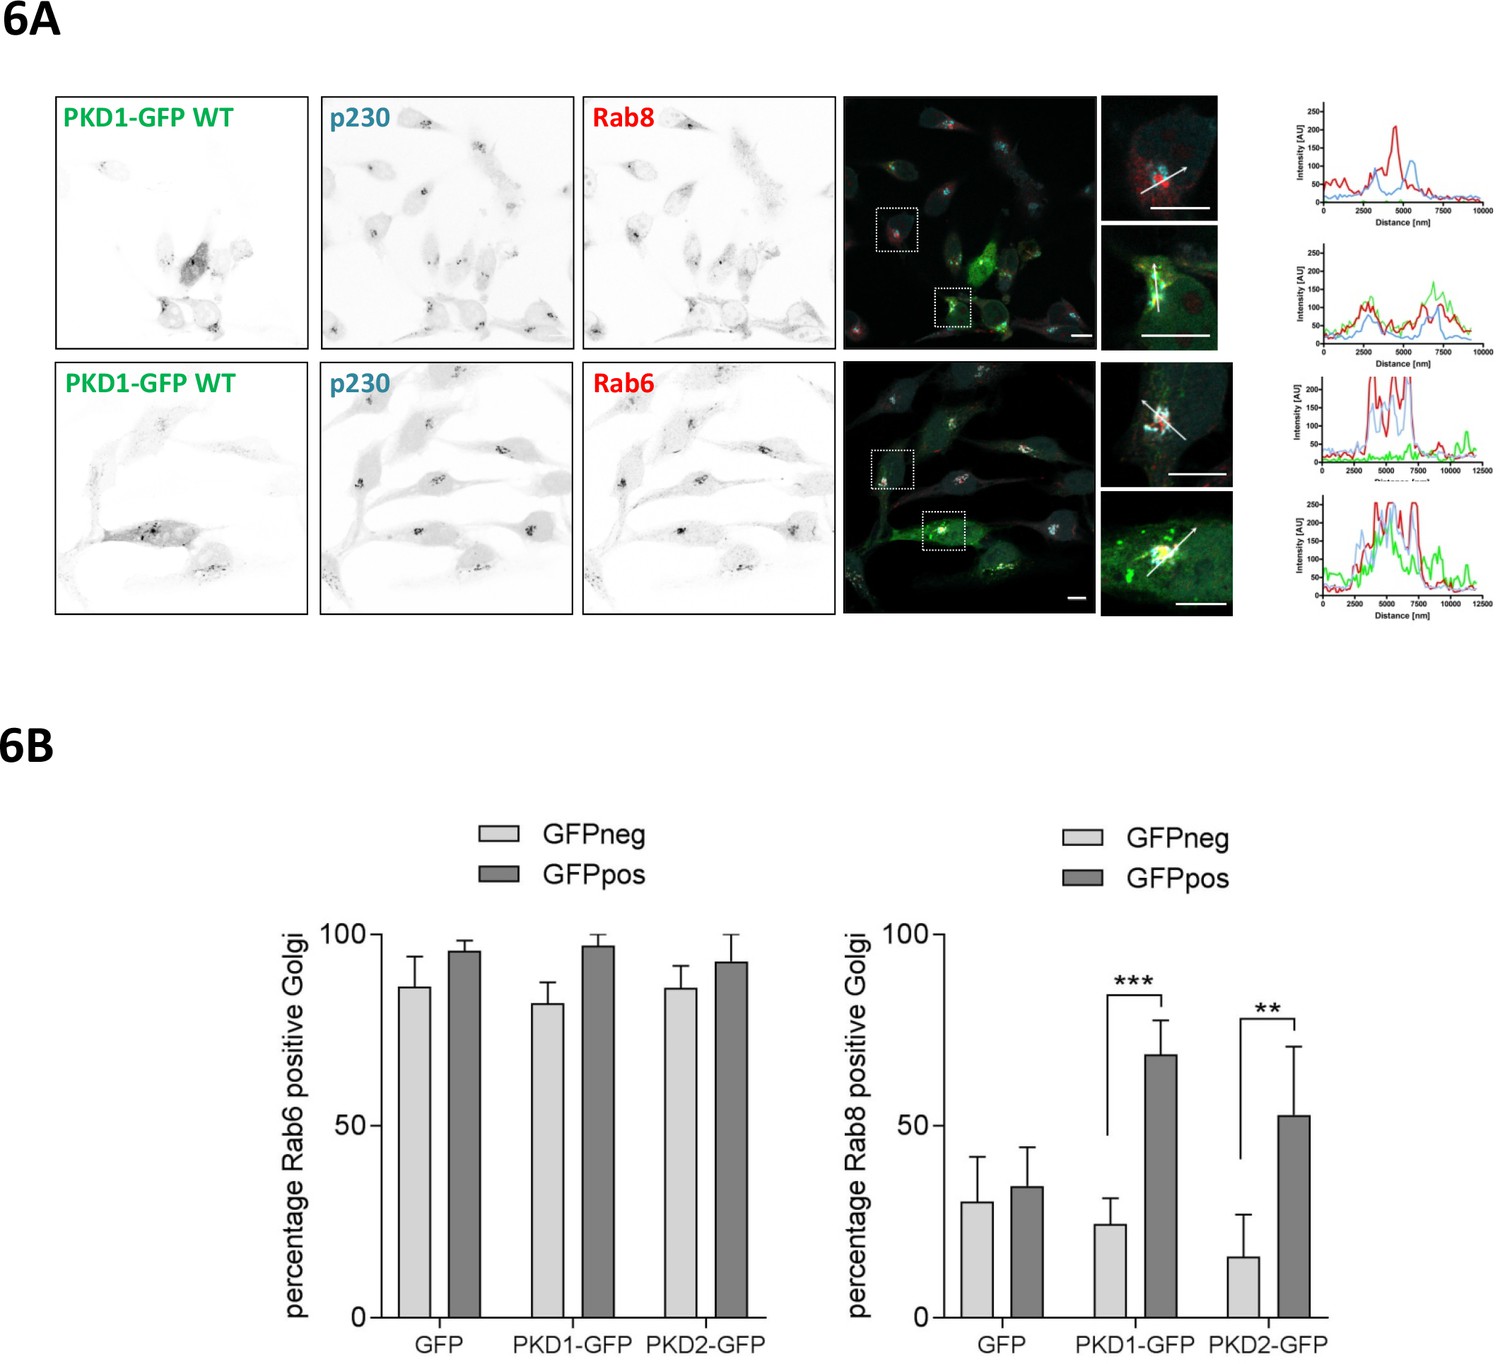
PKD recruits Rab8 to the TGN and co-localizes with Rab6.
(A) HeLa cells were transfected with a plasmid encoding wt PKD1-GFP. One day after transfection, cells were fixed and stained for Rab8 (top panel) or Rab6 (bottom panel) plus p230 and analyzed by confocal microscopy. Scale bar 10 µm. Right panel, in the histogram (profile scan) the fluorescence intensities of the three signals along the white line are depicted. (B) HeLa cells were transfected with an empty GFP vector, PKD1-GFP or PKD2-GFP constructs and stained for Rab6 or Rab8 and the TGN marker protein p230. Co-localization analysis of Rab8 or Rab6 with the TGN in GFP positive and GFP negative cells was performed using Cell Profiler software as described in the material and methods section. The graph shows the mean ± SEM of three independent experiments. Significance of differences was analyzed by a two-way RM ANOVA followed by a Bonferroni’s multiple comparison test. ***p=0.0004, **p=0.001.
Figure 6—figure supplement 1
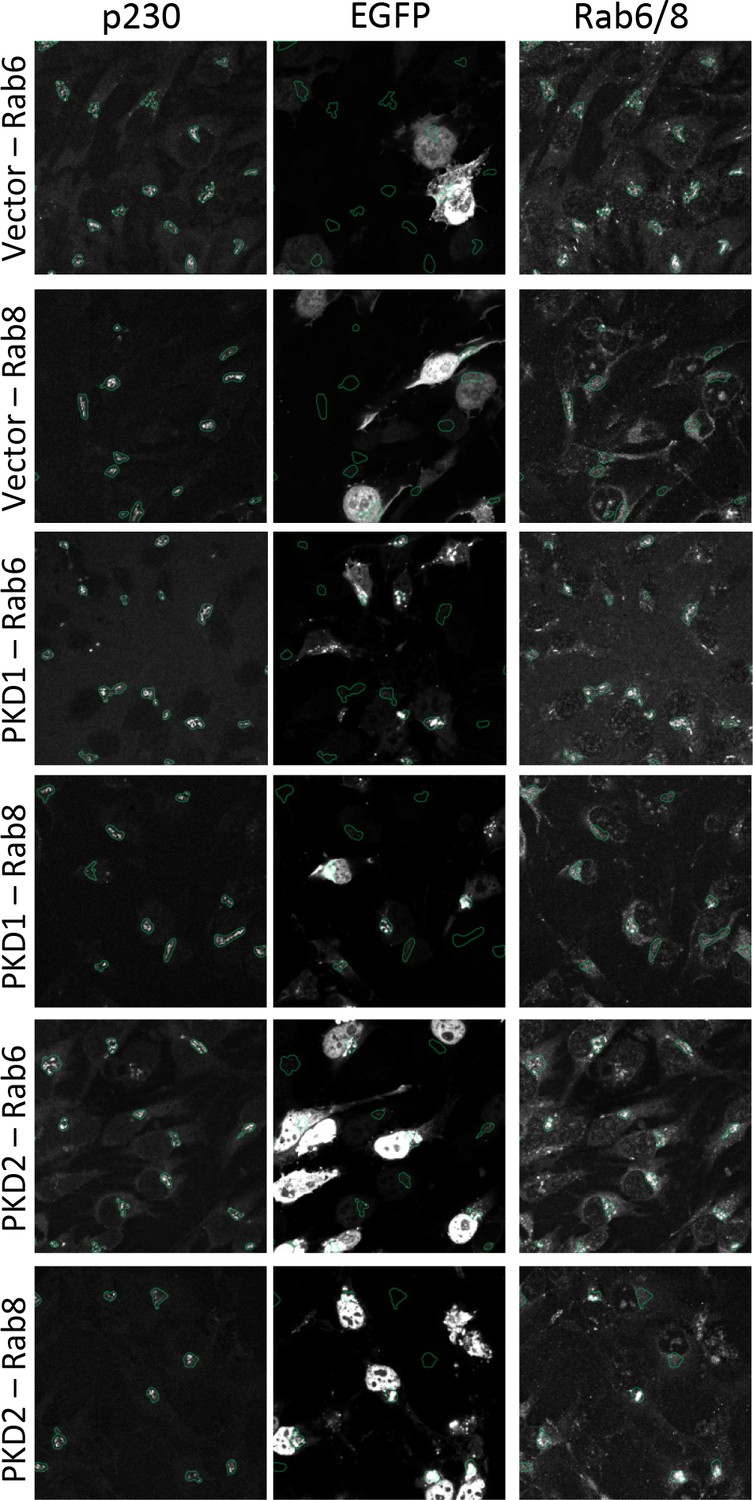
PKD co-localizes with Rab6 and Rab8 at the Golgi compartment.
HeLa cells were transfected with a GFP control vector or GFP-tagged versions of PKD1 or PKD2. 24 hr later cells were fixed and stained for p230 and Rab6 or Rab8 according to the protocol for indirect immunofluorescence. Images were acquired as described in the methods section. Shown are the different channels overlaid with the segmentation mask of the Golgi complex generated in CellProfiler.
Figure 7 with 2 supplements
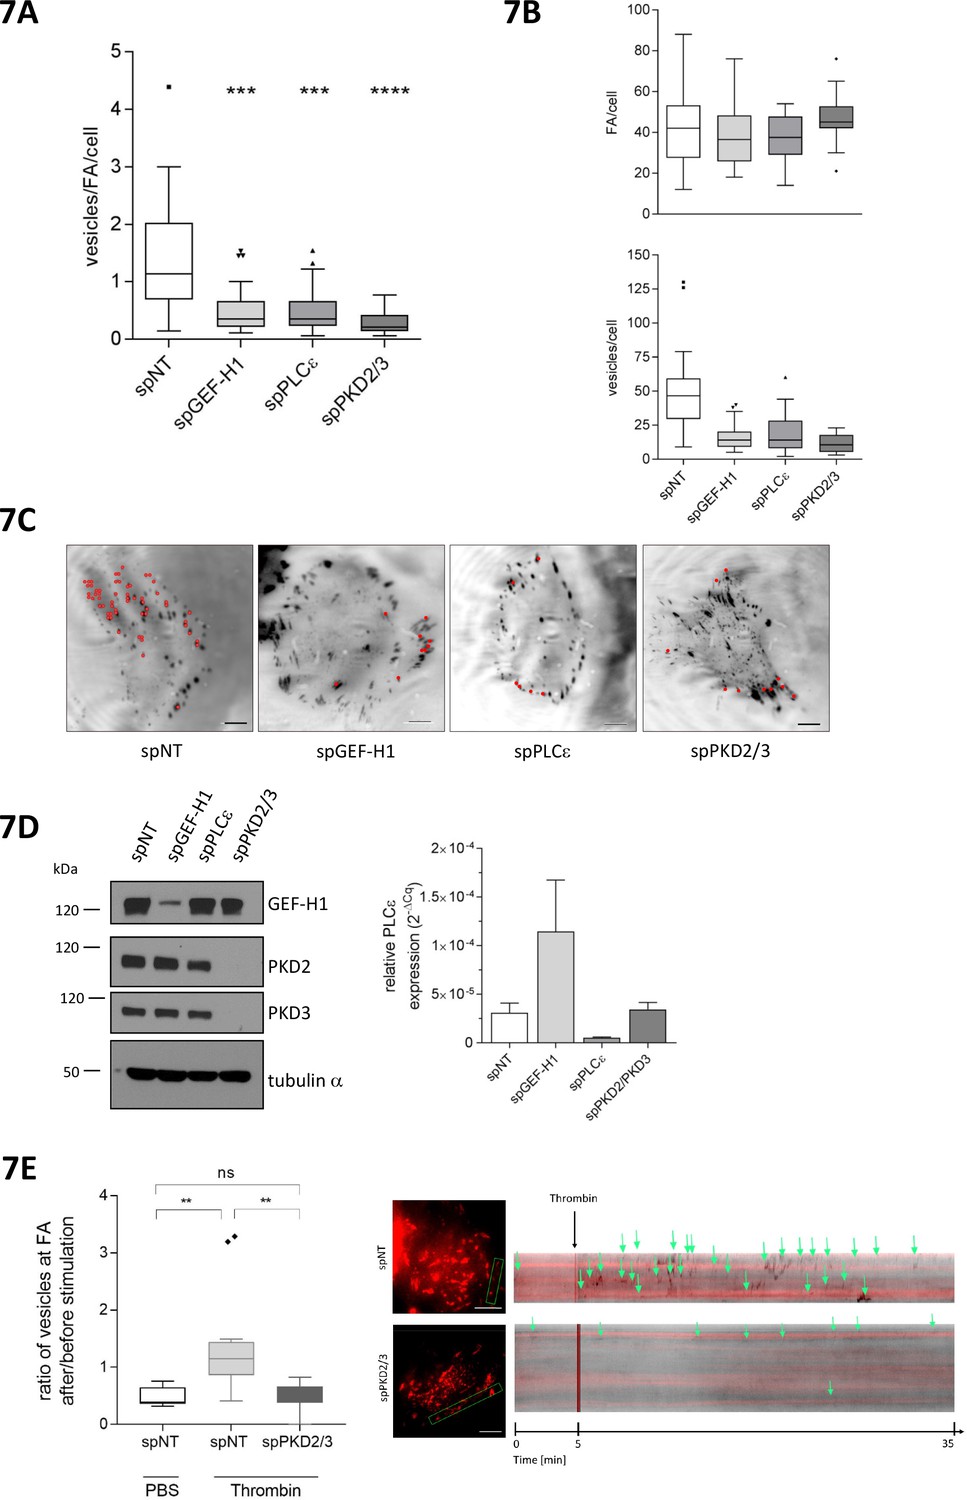
GEF-H1, PLCε and PKD are required for localized delivery of Rab6 to FAs.
(A, B, C, D, E) Cells were transfected with spRNAs as indicated. Two days later cells were transfected with plasmids encoding GFP-tagged Rab6 and DsRed2-tagged paxillin. After 24 hr cells were analyzed at a TIRF-equipped Spinning disc microscope. The amount of Rab6-positive vesicles arriving at FAs was assessed within a two minute time interval. (A) The box plot shows the results of three independent experiments. Center lines show the medians; box limits indicate the 25th and 75th percentiles as determined by GraphPad Prism 7 software; whiskers extend 1.5 times the interquartile range from the 25th and 75th percentiles, outliers are represented by dots. n = 26, 26, 26, 20 sample points. The significance of differences was assessed by a one-way ANOVA (Kruskal Wallis test) followed by a Dunn’s multiple comparison test. ****p<0.0001, ***p=0.002. (B) Top panel, number of FAs per cell. Bottom panel, number of vesicles arriving at FAs within two minutes. Center lines show the medians; box limits indicate the 25th and 75th percentiles as determined by GraphPad Prism 7 software; whiskers extend 1.5 times the interquartile range from the 25th and 75th percentiles, outliers are represented by dots. n = 26, 26, 26, 20 sample points. (C) Representative TIRF images. Red dots indicate Rab6-positive vesicles arriving at FAs within the two minute time interval. Scale bar 10 µm. (D) Left panel, silencing efficiency of GEF-H1, PKD2 and PKD3 was analyzed in lysates by immunoblotting using specific antibodies. Equal loading was verified by detection of alpha tubulin. Right panel, successful depletion of PLCε was verified by RT-qPCR. Relative expression was calculated by normalization to actin using the ΔCq method. (E) Cells were imaged 5 min prior to stimulation with thrombin or PBS (as a control). After addition of the reagent, imaging was continued for 30 min. Left panel: The box plot shows the result of three independent experiments. The vesicles arriving at FAs per minute before and after stimulation were calculated and presented as ratio ‘number of vesicles at FA after/before stimulation’. Center lines show the medians; box limits indicate the 25th and 75th percentiles as determined by GraphPad Prism 7 software; whiskers extend 1.5 times the interquartile range from the 25th and 75th percentiles, outliers are represented by dots. n = 7, 12, 10 sample points (cells analyzed). The significance of differences was assessed by a one-way ANOVA (Kruskal Wallis test) followed by a Dunn’s multiple comparison test. **p<0.01, ns not significant. Right panel: Representative TIRF kymographs of spNT and spPKD2/3 cells. Arrows indicate vesicles arriving at FAs.
Figure 7—figure supplement 1
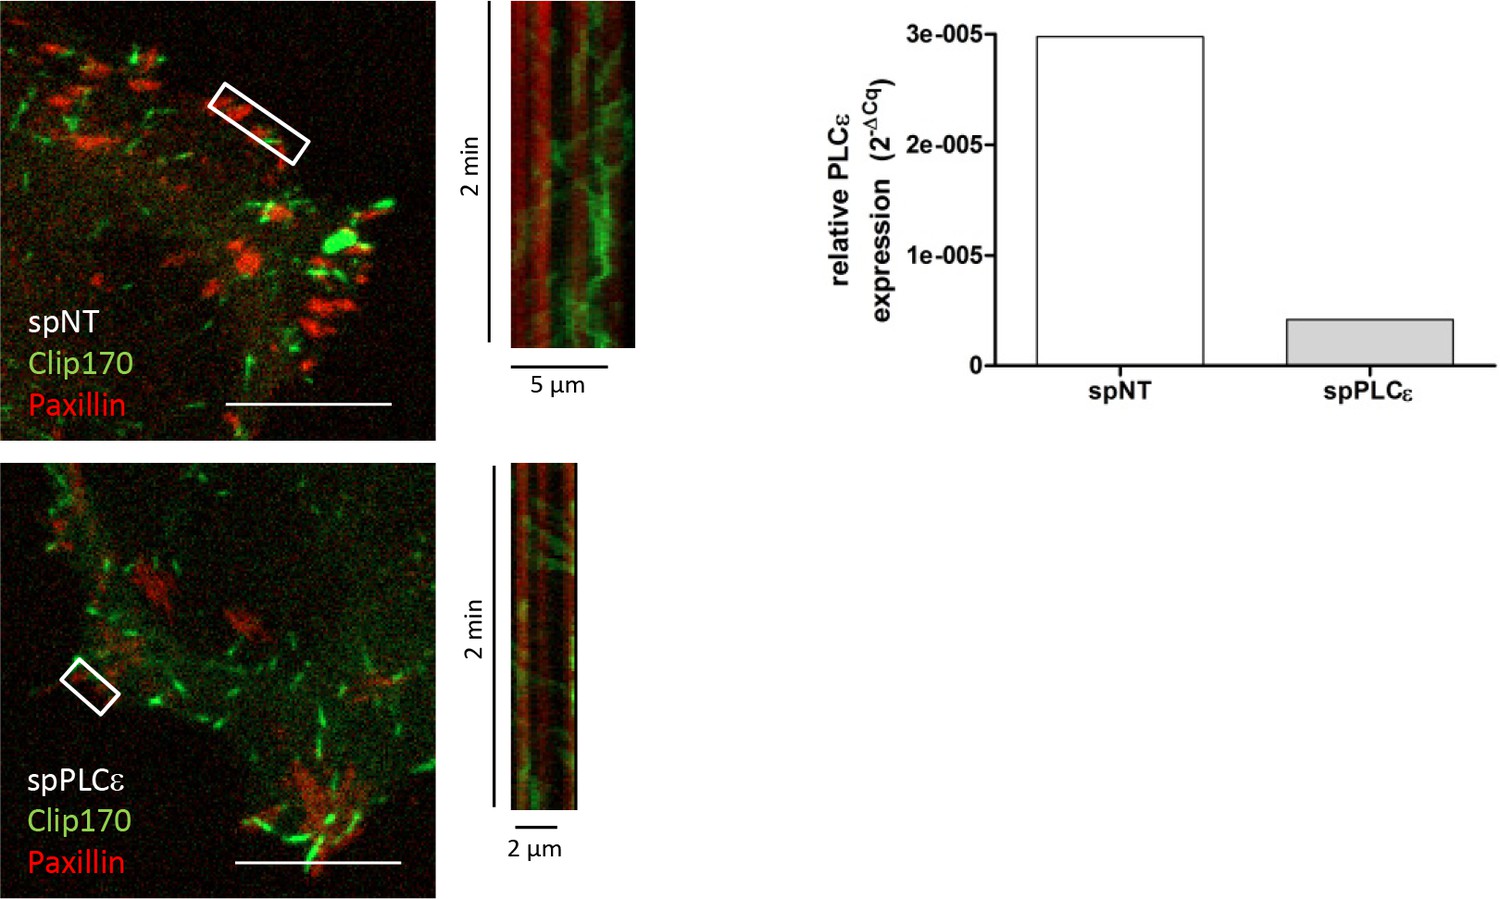
PLCε knockdown does not impair microtubule-FA interaction.
HeLa cells were transfected with spRNAs as indicated. Two days later cells were transfected with plasmids encoding GFP-tagged Clip170 and DsRed2-tagged paxillin. After 24 hr cells were analyzed at a Spinning disc microscope in phenolred-free RPMI supplemented with 10% FCS as described in the material and methods section. Shown are merged channel images at time point zero. The kymographs represent the intensity change in the selected lines over a 2 min time interval. Kymograph lines are illustrated by a white rectangular frame. Scale bar 10 µm. Right panel, successful depletion of PLCε was verified by RT-qPCR. Relative expression was calculated by normalization to actin using the ΔCq method.
Figure 7–video 1
Loss of GEF-H1, PLCε, or PKD impairs the localized delivery of Rab6-positive vesicles to FAs.
HeLa cells were transfected with spRNAs as indicated. Two days later cells were transfected with plasmids encoding GFP-tagged Rab6A (green) and DsRed2-tagged paxillin (red). After 24 hr, cells were imaged in phenolred-free RPMI supplemented with 10% FCS at the Spinning disk microscope as described in the material and methods section. Stacks were acquired simultaneously in green and red channels each second for a time interval of 2 min. The movies show the 3D rendering of the merged channel image with 10 frames per second speed. Scale bar 10 µm.
Figure 8 with 1 supplement

The Rho signaling pathway controls vesicle fission and cargo transport at the level of the TGN.
(A) HeLa cells were transfected with a construct encoding Str-KDEL-TNFα-SBP-mCherry together with Rab6-GFP. 24 hr later, biotin was added for 35 min followed by fixation. Cells were stained for p230 and analyzed by confocal microscopy. Shown is a maximum intensity projection, scale bar 10 µm. (B, C, D) HeLa cells were transfected with spRNAs as indicated, spNT was used as a control. (B, C) Two days later cells were transfected with plasmids encoding Str-KDEL-TNFα-SBP-mCherry and Rab6-GFP and, after 24 hr, biotin was added and cells were subjected to the RUSH assay as described in the material and methods section. After fixation, cells were stained for p230. Shown are representative confocal images, scale bar 10 µm. (C) Left panel, the scatter dot blot shows the result of three independent experiments, line indicates the mean. Each dot represents one experiment with at least 190 cells analysed. The significance of differences was analyzed by a one-way ANOVA followed by a Holm-Sidak’s multiple comparison test, **p=0.0065. All other comparisons were not significant. Right panel, successful depletion of the proteins was verified by RT-qPCR. Relative expression was calculated by normalization to actin using the ΔCq method. The graphs represent the mean ± SEM of three independent experiments. (D) HeLa cells were transfected with a plasmid encoding Str-KDEL-TNFα-SBP-mCherry and release from the ER was induced by biotin addition 24 hr later. The graph shows integrated fluorescence intensity in the Golgi region at each time point, corrected for background and normalized to the maximum value. Curves depict the measurement of at least 22 cells of a representative experiment. Error bars, SEM.
Figure 8–video 1
Loss of GEF-H1, PLCε, or PKD blocks transport of TNFα at the Golgi complex.
HeLa cells were transfected with spRNAs as indicated. Two days later cells were transfected with a plasmid encoding Str-KDEL-TNFα-SBP-mCherry. After 24 hr, cells were imaged in biotin-free FluoroBrite DMEM medium supplemented with 10% FCS at the Spinning disk microscope as described in the material and methods section. Stacks were acquired every minute. The movie replays at a speed of 10 frames per second. Scale bar 10 µm.
Figure 9

Schematic illustration of the Rho signaling pathway at the TGN.
GPCR signaling activates GEF-H1 by releasing it from microtubules. GEF-H1 in turn promotes an increase in cellular RhoA activity. At the TGN, active RhoA binds to its effector PLCε, which hydrolyzes PtdIns(4)P to generate DAG and IP2. DAG recruits and activates nPKCs and PKD, which gets further activated by nPKC-mediated phosphorylation. The activation of PKD by RhoA is counterbalanced by the RhoGAP DLC3. Active PKD recruits Rab8 to TGN membranes and induces the fission of Rab6-positive vesicles containing cargo such as TNFα destined for FA-targeted transport along microtubules.
Tables
Key resources table
| Reagent type (species) or resource | Designation | Source or reference | Identifiers | Additional information |
|---|---|---|---|---|
| Cell line (human) | HEK293T | ATCC | ATCC Cat# CRL-3216, RRID:CVCL_0063 | |
| Cell line (human) | Flp-In T-Rex-293 | Thermo Fisher Scientific | RRID:CVCL_U427 | |
| Cell line (human) | Flp-In T-Rex-HeLa | other | generated by Elena Dobrikova and Matthias Gromeier, Duke University Medical Center, Durham, NC, USA | |
| Cell line (human) | HeLa | ATCC | ATCC Cat# CRM-CCL-2, RRID:CVCL_0030 | |
| Recombinant DNA reagent | pEGFP-N1-PKD1 wt/K612W | DOI: 10.1038/ncb1289 | ||
| Recombinant DNA reagent | pEGFP-N1-PKD2 | DOI: 10.1038/ncb1289 | ||
| Recombinant DNA reagent | pCMV5-EGFP-GEF -H1 wt | DOI: 10.1038/ncb773 | ||
| Recombinant DNA reagent | pCMV5-EGFP-GEF -H1 C53R | DOI: 10.1038/ncb773 | ||
| Recombinant DNA reagent | pTriEx-RhoA FLARE.sc | DOI: 10.1038/nature04665 | Addgene #12150 | |
| Recombinant DNA reagent | mRuby-Golgi-7 | Addgene #55865 | ||
| Recombinant DNA reagent | Rab6a-GFP | other | provided by Francis Barr, Oxford University | |
| Recombinant DNA reagent | DsRed2-Paxillin | DOI: 10.1038/ncb1094 | ||
| Recombinant DNA reagent | G-PKDrep | doi: 10.1111/j.1600– 0854.2009.00918.x | ||
| Recombinant DNA reagent | Clip170-GFP | other | provided by Niels Galjart, Erasmus Medical Center, Rotterdam | |
| Recombinant DNA reagent | pcDNA5/FRT/TO-EGFP -GEF-H1 wt/C53R | this paper | ||
| Recombinant DNA reagent | pECFP-Endo/RhoB | Clontech | Clontech #6934–1 | |
| Recombinant DNA reagent | pECFP-Endo/Rhob Q63L | this paper | site-directed mutagenesis using pECFP-RhoB as a template | |
| Recombinant DNA reagent | pEGFP-RhoB | this paper | subcloned from pECFP-Endo/RhoB | |
| Recombinant DNA reagent | pEGFP-RhoB Q63L | this paper | subcloned from pECFP-Endo/RhoB Q63L | |
| Recombinant DNA reagent | pEGFP-RhoA | DOI: 10.1242/jcs.163857 | ||
| Recombinant DNA reagent | pEGFP-RhoA Q63L | DOI: 10.1242/jcs.163857 | ||
| Recombinant DNA reagent | pcDNA3.1-HA-RhoA Q63L | DOI: 10.1242/jcs.163857 | ||
| Recombinant DNA reagent | pcDNA3.1-HA-RhoA | DOI: 10.1242/jcs.163857 | ||
| Recombinant DNA reagent | Str-KDEL-TNFa-SBP- mCherry | Addgene #65279 | ||
| Recombinant DNA reagent | pOG44 | Thermo Fisher Scientific | Thermo Fisher Scientific V600520 | |
| Antibody | p230 | BD Biosciences | BD Biosciences Cat# 611280, RRID:AB_398808 | |
| Antibody | GFP | Roche | Sigma-Aldrich Cat# 11814460001, RRID:AB_390913 | |
| Antibody | TGN46 | Bio-Rad/AbD Serotec | Bio-Rad/AbD Serotec Cat# AHP500, RRID:AB_324049 | |
| Antibody | alpha-tubulin | Millipore | Millipore Cat# 05–829, RRID:AB_310035 | |
| Antibody | DLC3 | Santa Cruz Biotechnology | Santa Cruz Biotechnology Cat# sc-166725, RRID:AB_2197829 | |
| Antibody | PKD1 | Cell Signaling | Cell Signaling Technology Cat# 2052, RRID:AB_2268946 | |
| Antibody | PKD2 | Cell Signaling | Cell Signaling Technology Cat# 8188S, RRID:AB_10829368 | |
| Antibody | PKD3 | Cell Signaling | Cell Signaling Technology Cat# 5655S, RRID:AB_10695917 | |
| Antibody | GEF-H1 | Cell Signaling | Cell Signaling Technology Cat# 4076, RRID:AB_2060032 | |
| Antibody | phospho-PKD (Ser744/748) | Cell Signaling | Cell Signaling Technology Cat# 2054S, RRID:AB_2172539 | |
| Antibody | Rab8 | Cell Signaling | Cell Signaling Technology Cat# 6975S, RRID:AB_10827742 | |
| Antibody | Rab6 | Cell Signaling | Cell Signaling Technology Cat# 9625S, RRID:AB_10971791 | |
| Antibody | pS910 | DOI: 10.1083/jcb.200110047 | ||
| Antibody | ERK1/2 | Cell Signaling | Cell Signaling Technology Cat# 9107S, RRID:AB_10695739 | |
| Antibody | MEK1/2 | Cell Signaling | Cell Signaling Technology Cat# 8727, RRID:AB_10829473 | |
| Antibody | pERK1/2 (Thr202/Tyr204) | Cell Signaling | Cell Signaling Technology Cat# 4094S, RRID:AB_10694057 | |
| Antibody | pMEK1/2 (Ser2017/221) | Cell Signaling | Cell Signaling Technology Cat# 9154, RRID:AB_2138017 | |
| Antibody | ROCK1 | Millipore | Millipore Cat# 04–1121, RRID:AB_1977472 | |
| Antibody | ROCK2 | BD Biosciences | BD Biosciences Cat# 610623, RRID:AB_397955 | |
| Antibody | pS294 | DOI: 10.1038/ncb1289 | IF 1:750 | |
| Antibody | HRP goat anti-rabbit | Dianova | Jackson ImmunoResearch Labs Cat# 111-035-144, RRID:AB_2307391 | |
| Antibody | HRP goat anti-mouse | Dianova | Jackson ImmunoResearch Labs Cat# 115-035-062, RRID:AB_2338504 | |
| Antibody | Alexa Fluor labelled secondary antibodies | Thermo Fisher Scientific | Thermo Fisher Scientific | |
| Sequence-based reagent | ON-Targetplus smartpools | Dharmacon | Dharmacon | |
| Sequence-based reagent | Silencer select siPLCe | Thermo Fisher Scientific | Thermo Fisher Scientific s27660 | |
| Sequence-based reagent | Silencer select siGEF-H1 | Thermo Fisher Scientific | Thermo Fisher Scientific s17546 | |
| Sequence-based reagent | Quantitect primers for RT-PCR | Qiagen | Qiagen | |
| Peptide, recombinant protein | Trypsin | Thermo Fisher Scientific | Thermo Fisher Scientific 15090046 | |
| Peptide, recombinant protein | Thrombin | Millipore | Millipore 605195 | |
| Commercial assay or kit | QuantiTect SYBR Green RT-PCR Kit | Qiagen | Qiagen 204243 | |
| Commercial assay or kit | Rneasy plus Kit | Qiagen | Qiagen 74104 | |
| Chemical compound, drug | Nocodazole | Sigma-Aldrich | Sigma-Aldrich M1404 | |
| Chemical compound, drug | CRT0066101 | Tocris Bioscience | Tocris Bioscience 4975 | |
| Chemical compound, drug | H1152 | Enzo Life Science | Enzo Life Science ALX-270–423 M001 | |
| Chemical compound, drug | UO126 | Cell Signaling | Cell Signaling #9903 | |
| Chemical compound, drug | Blasticidin | Thermo Fisher Scientific | Thermo Fisher Scientific R21001 | |
| Chemical compound, drug | Hygromycin B | Thermo Fisher Scientific | Thermo Fisher Scientific 10687010 | |
| Chemical compound, drug | Doxycyclin | Sigma-Aldrich | Sigma-Aldrich D9891 | |
| Chemical compound, drug | Zeocin | Thermo Fisher Scientific | Thermo Fisher Scientific R25001 | |
| Chemical compound, drug | Collagen R | Serva | Serva 47254 | |
| Chemical compound, drug | Biotin | Sigma-Aldrich | Sigma-Aldrich B4501 | |
| Chemical compound, drug | Blocking reagent | Roche | Roche 11096176001 | |
| Software, algorithm | Cell Profiler | http://cellprofiler.org | CellProfiler Image Analysis Software, RRID:SCR_007358 | |
| Software, algorithm | GraphPad Prism | GraphPad Prism (https://graphpad.com) | Graphpad Prism, RRID:SCR_002798 | |
| Software, algorithm | Image Studio Lite 4.0 | https://www.licor.com/bio/products/software/image_studio_lite/?utm_source=BIO+Blog&utm_medium=28Aug13post&utm_content=ISLite1&utm_campaign=ISLite | Image Studio Lite, RRID:SCR_014211 |
Additional files
-
Transparent reporting form
- https://doi.org/10.7554/eLife.35907.022
Download links
A two-part list of links to download the article, or parts of the article, in various formats.
Downloads (link to download the article as PDF)
Open citations (links to open the citations from this article in various online reference manager services)
Cite this article (links to download the citations from this article in formats compatible with various reference manager tools)
A Rho signaling network links microtubules to PKD controlled carrier transport to focal adhesions
eLife 7:e35907.
https://doi.org/10.7554/eLife.35907


