Systematic perturbation of retroviral LTRs reveals widespread long-range effects on human gene regulation
- Stanford University School of Medicine, United States
Figures
Figure 1 with 1 supplement
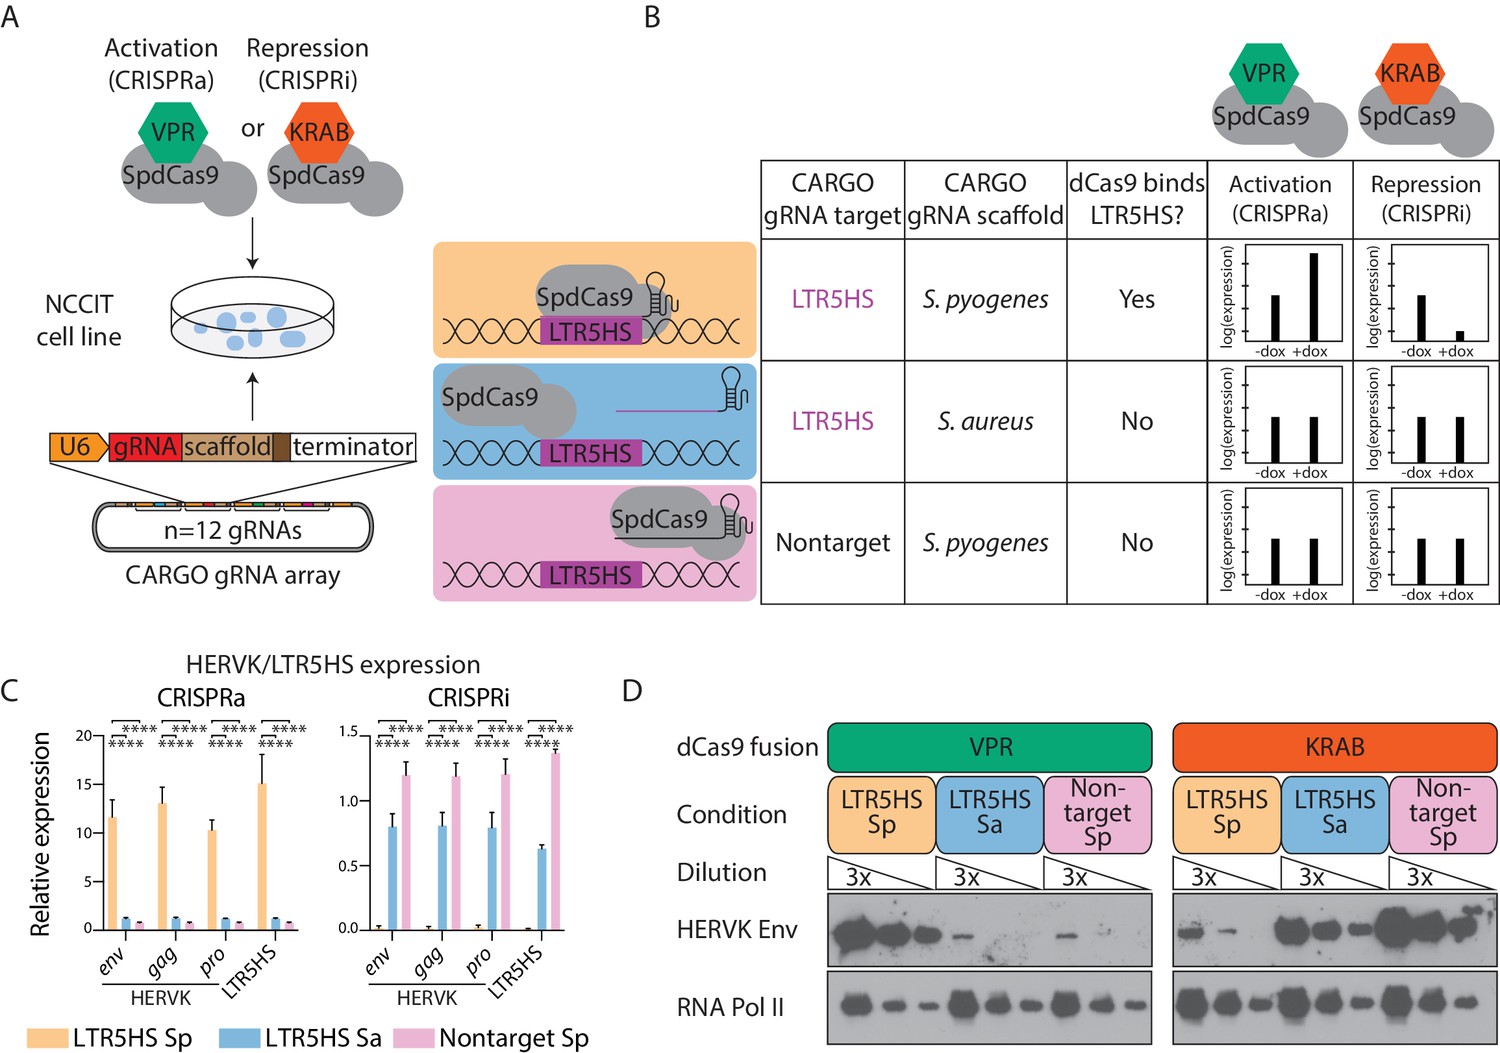
Control of HERVK/LTR5HS expression by CARGO-CRISPRa/CRISPRi.
(A) Schematic of experimental strategy for generation of NCCIT human embryonal carcinoma cell lines expressing CARGO arrays and indicated S. pyogenes dCas9 fusion proteins (SpdCas9). CARGO array schematic adapted from (Gu et al., 2018). (B) Design of three CARGO arrays used in this study. CARGO arrays contain 12 distinct transcriptional units expressing gRNAs targeting LTR5HS or nontargeting gRNAs, with a scaffold sequence from the indicated bacterial species. Predicted effect of each CARGO-SpdCas9 combination on HERVK expression is shown. (C–D) RT-qPCR (C) or western blot (D) analysis of LTR5HS or HERVK proviral genes in NCCIT cells induced with dCas9-VPR (CRISPRa) or dCas9-KRAB (CRISPRi) and one of three CARGO arrays. In (C), error bars show standard deviation, and expression is shown relative to RPL13A, and normalized such that the average of LTR5HS Sa and nontarget Sp conditions is set to 1. ****p value < 0.0001, one-sided t-test. In (D), different exposure times have been used in left and right WB panels to allow for visualization of protein level changes upon CRISPRa and CRISPRi, respectively.
Figure 1—figure supplement 1
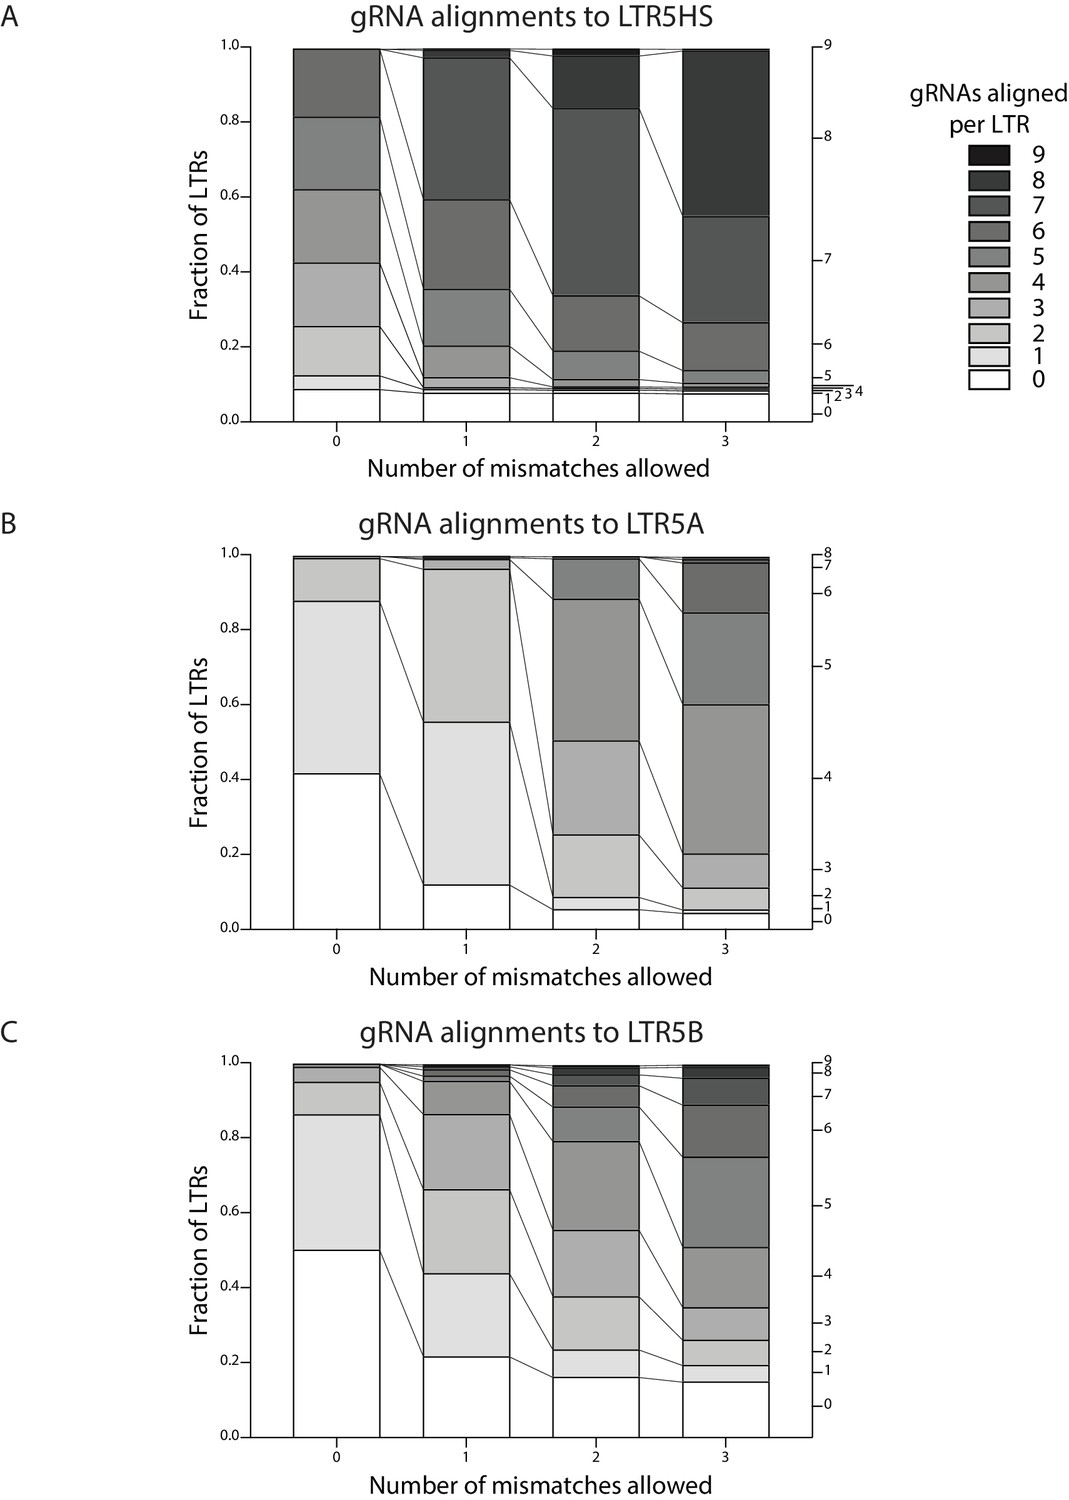
In silico binding predictions of LTR5HS targeting by gRNAs.
(A–C) fraction of LTR5HS (A), LTR5A (B), or LTR5B (C) computationally predicted to be bound by number of distinct gRNAs indicated at right, with 0–3 (as indicated) base pairing mismatches permitted between gRNA sequence and LTR sequence. Stacked boxes are shaded from white (0 gRNAs aligned) to black (9 gRNAs aligned).
Figure 2 with 3 supplements
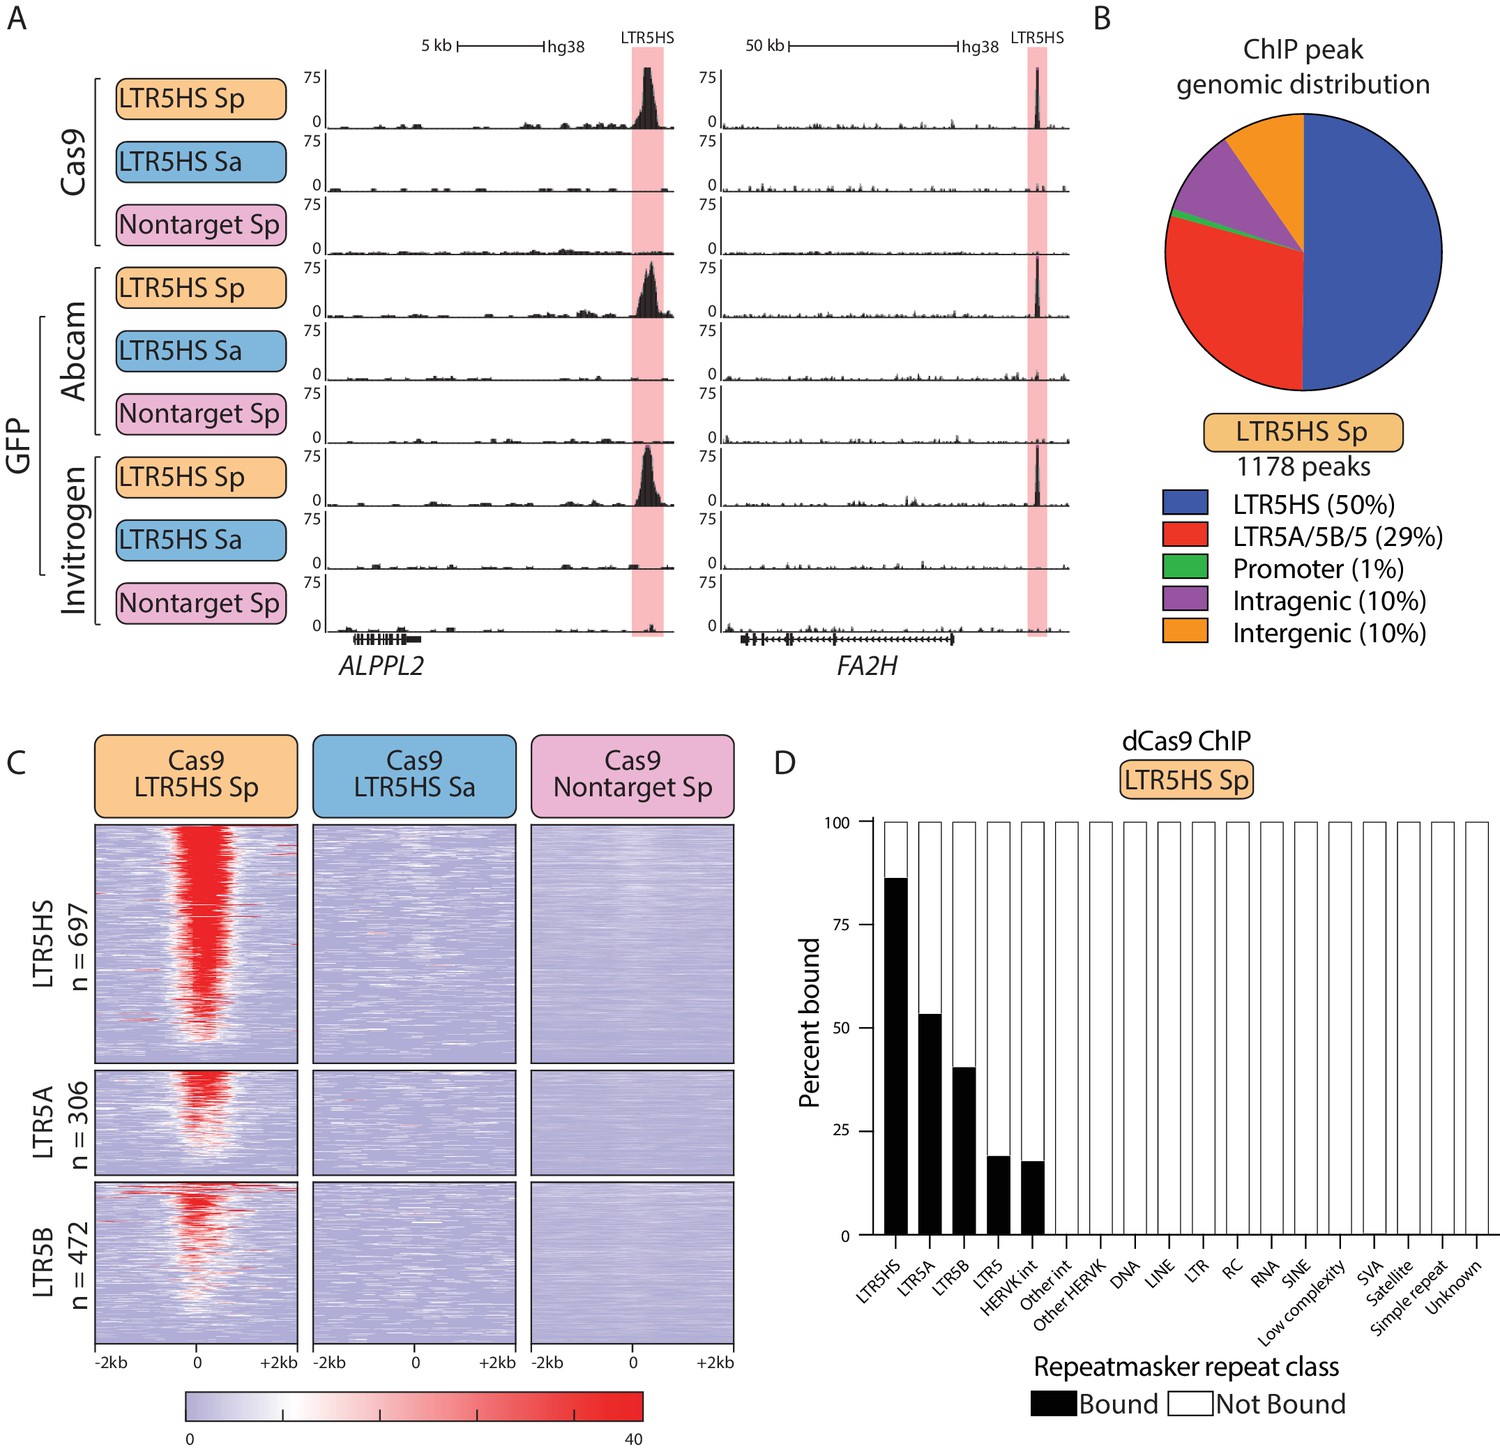
Robust and selective dCas9 targeting to LTR5HS via CARGO.
(A) Representative UCSC hg38 genome browser tracks showing ChIP-seq profiles for dCas9 performed with three different antibodies (Cas9, GFP Abcam, GFP Invitrogen) from NCCIT cells expressing one of the three CARGO arrays (LTR5HS Sp, LTR5HS Sa, nontarget Sp; colored as in Figure 1). Regions around LTR5HS insertions are highlighted in pink. (B) Distribution of dCas9 LTR5HS ChIP-seq peaks called with all three antibodies over HERVK LTRs and known genomic features. (C) Heat maps of normalized ChIP-seq signal with three different CARGO arrays using Cas9 antibody. Each row represents a 4 kb window (2 kb in each direction) centered at the middle of the indicated HERVK LTR, with number of insertions of each class shown. Heat map of each LTR is sorted by Cas9 LTR5HS Sp ChIP average signal. (D) Percent of each Repeatmasker hg38 repeat class bound by dCas9 ChIP-seq peaks called with all three antibodies. Int, internal proviral sequences; RC, rolling circle; SVA, SINE/VNTR/Alu.
Figure 2—figure supplement 1
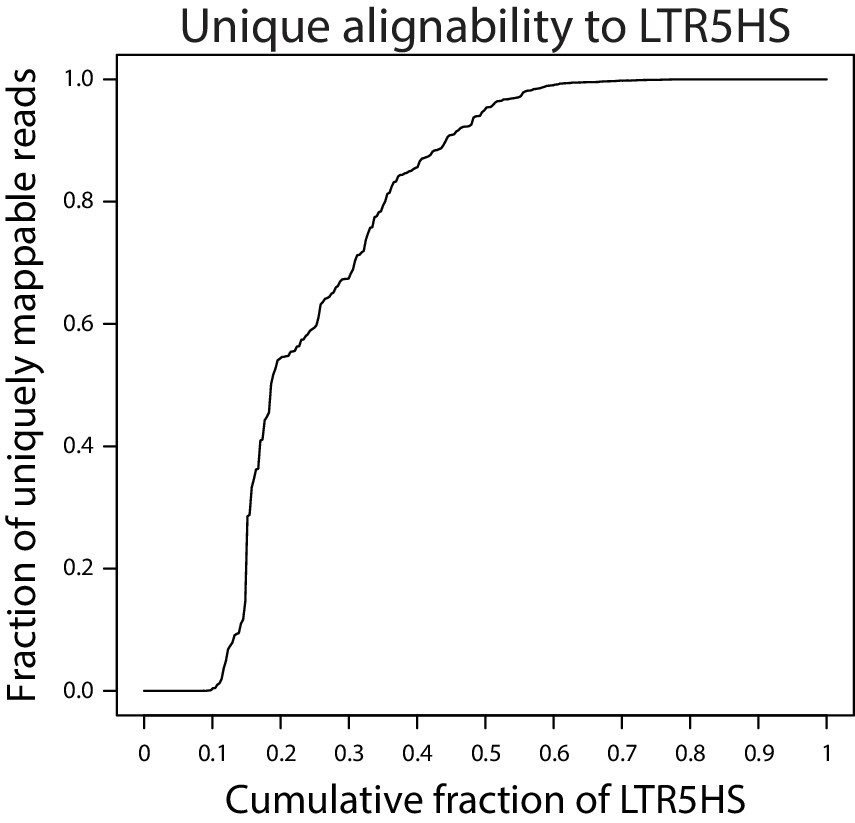
Unique mappability to LTR5HS.
Plot showing fraction of sequencing reads uniquely mappable to LTR5HS by the indicated cumulative fraction of LTR5HS insertions.
Figure 2—figure supplement 2
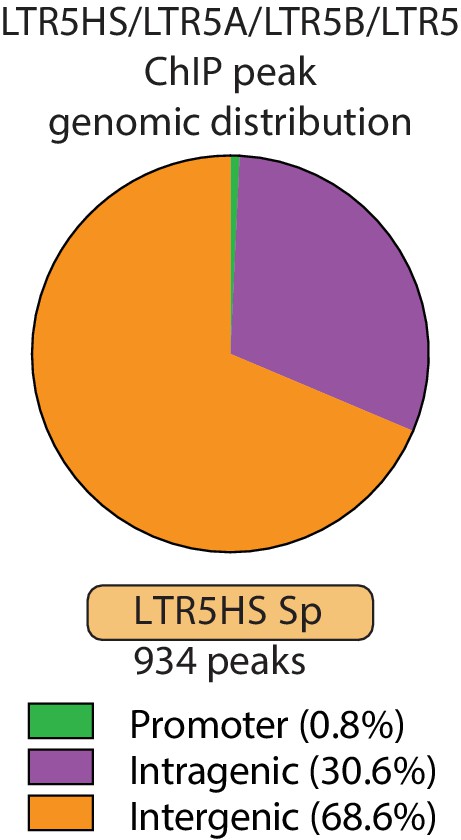
Genomic distribution of dCas9-bound HERVK LTR5.
Distribution of HERVK LTR peaks bound by dCas9 called with all three antibodies (one against Cas9, two against GFP) over known genomic features.
Figure 2—figure supplement 3
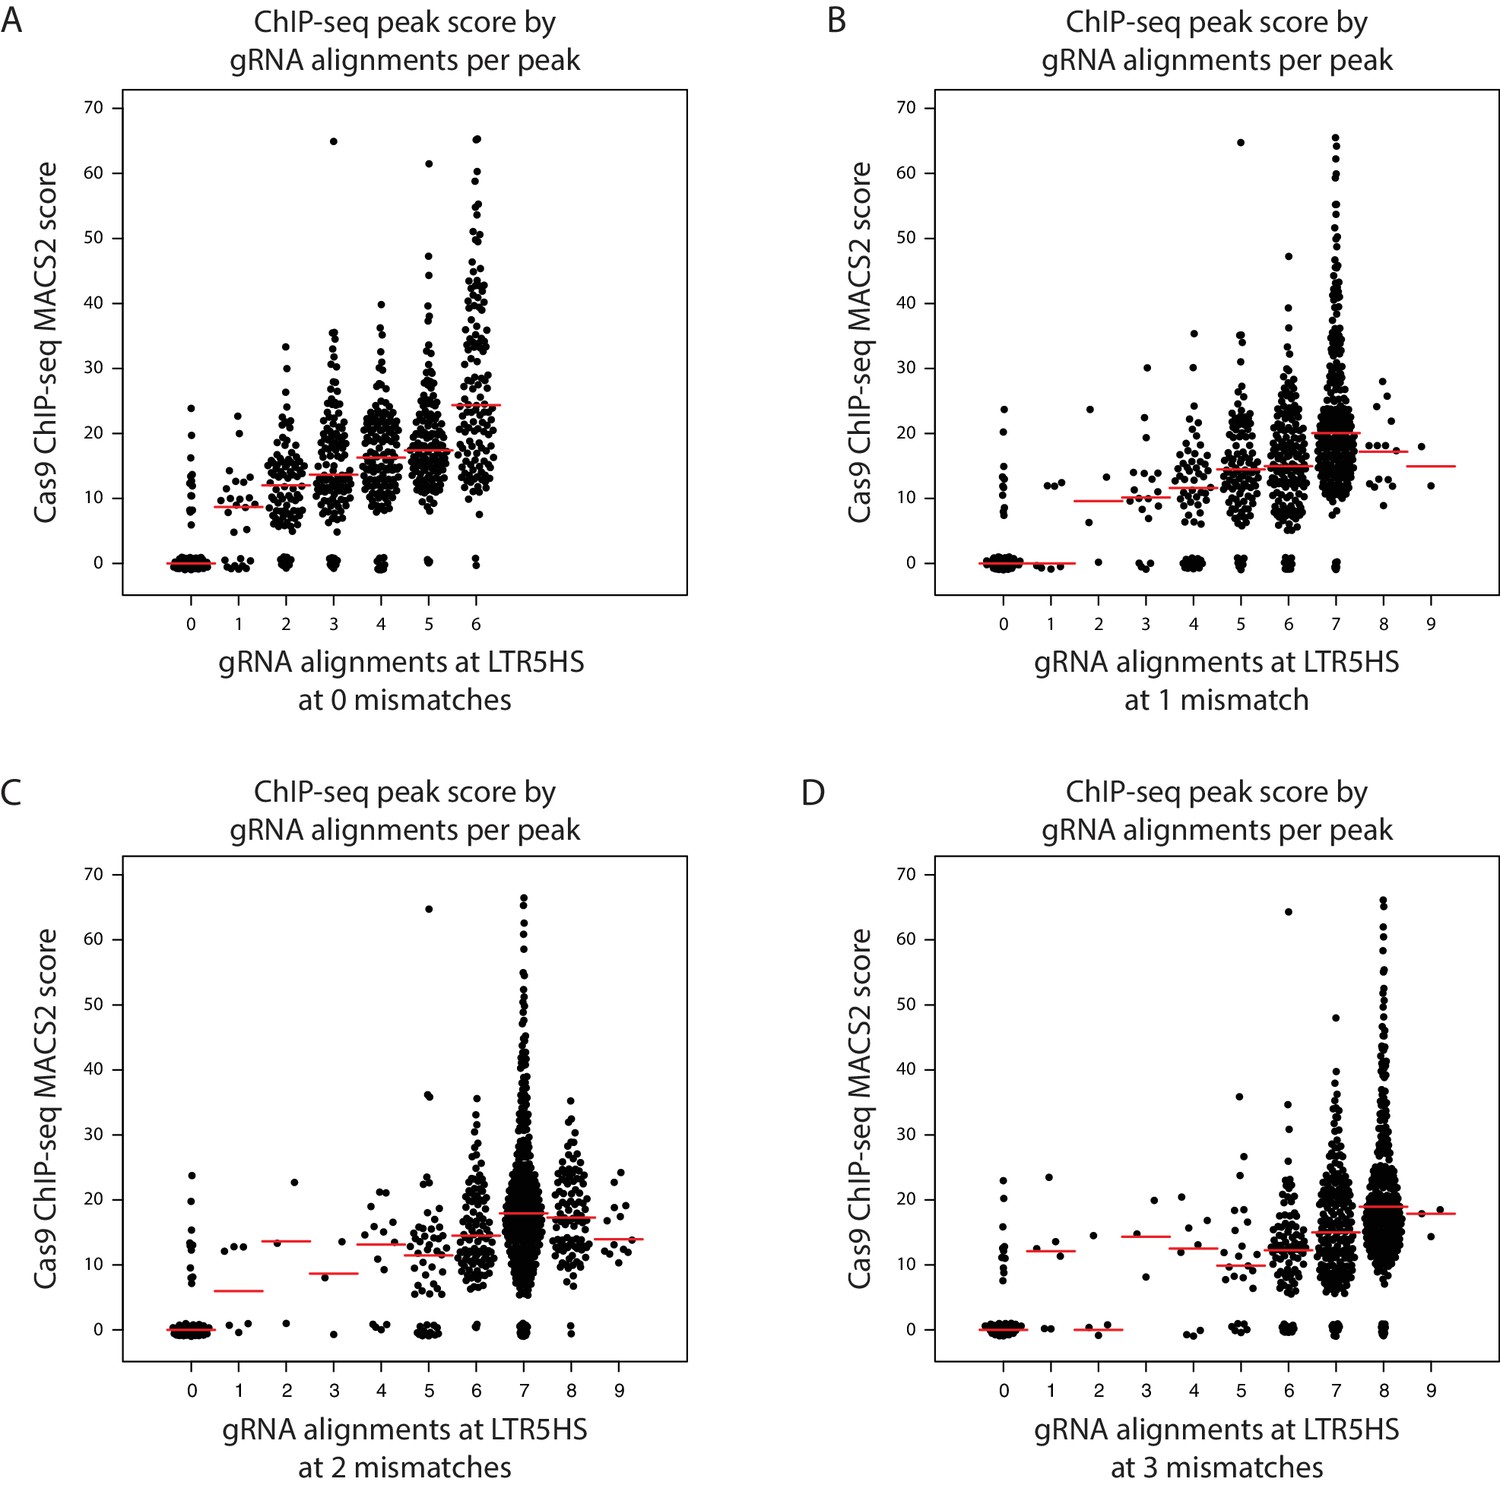
Correlation between gRNA alignments to LTR5HS and ChIP-seq score at LTR5HS.
(A–D) Violin point plots showing MACS2 score of dCas9 ChIP at each LTR5HS insertion vs. number of gRNA computational alignments at the same insertion, at 0 (A), 1 (B), 2 (C), or 3 (D) mismatches allowed between gRNA sequence and LTR sequence. Pseudorandom noise (< 1 MACS2 score unit) is added vertically for easier visibility of points for which MACS2 score = 0.
Figure 3
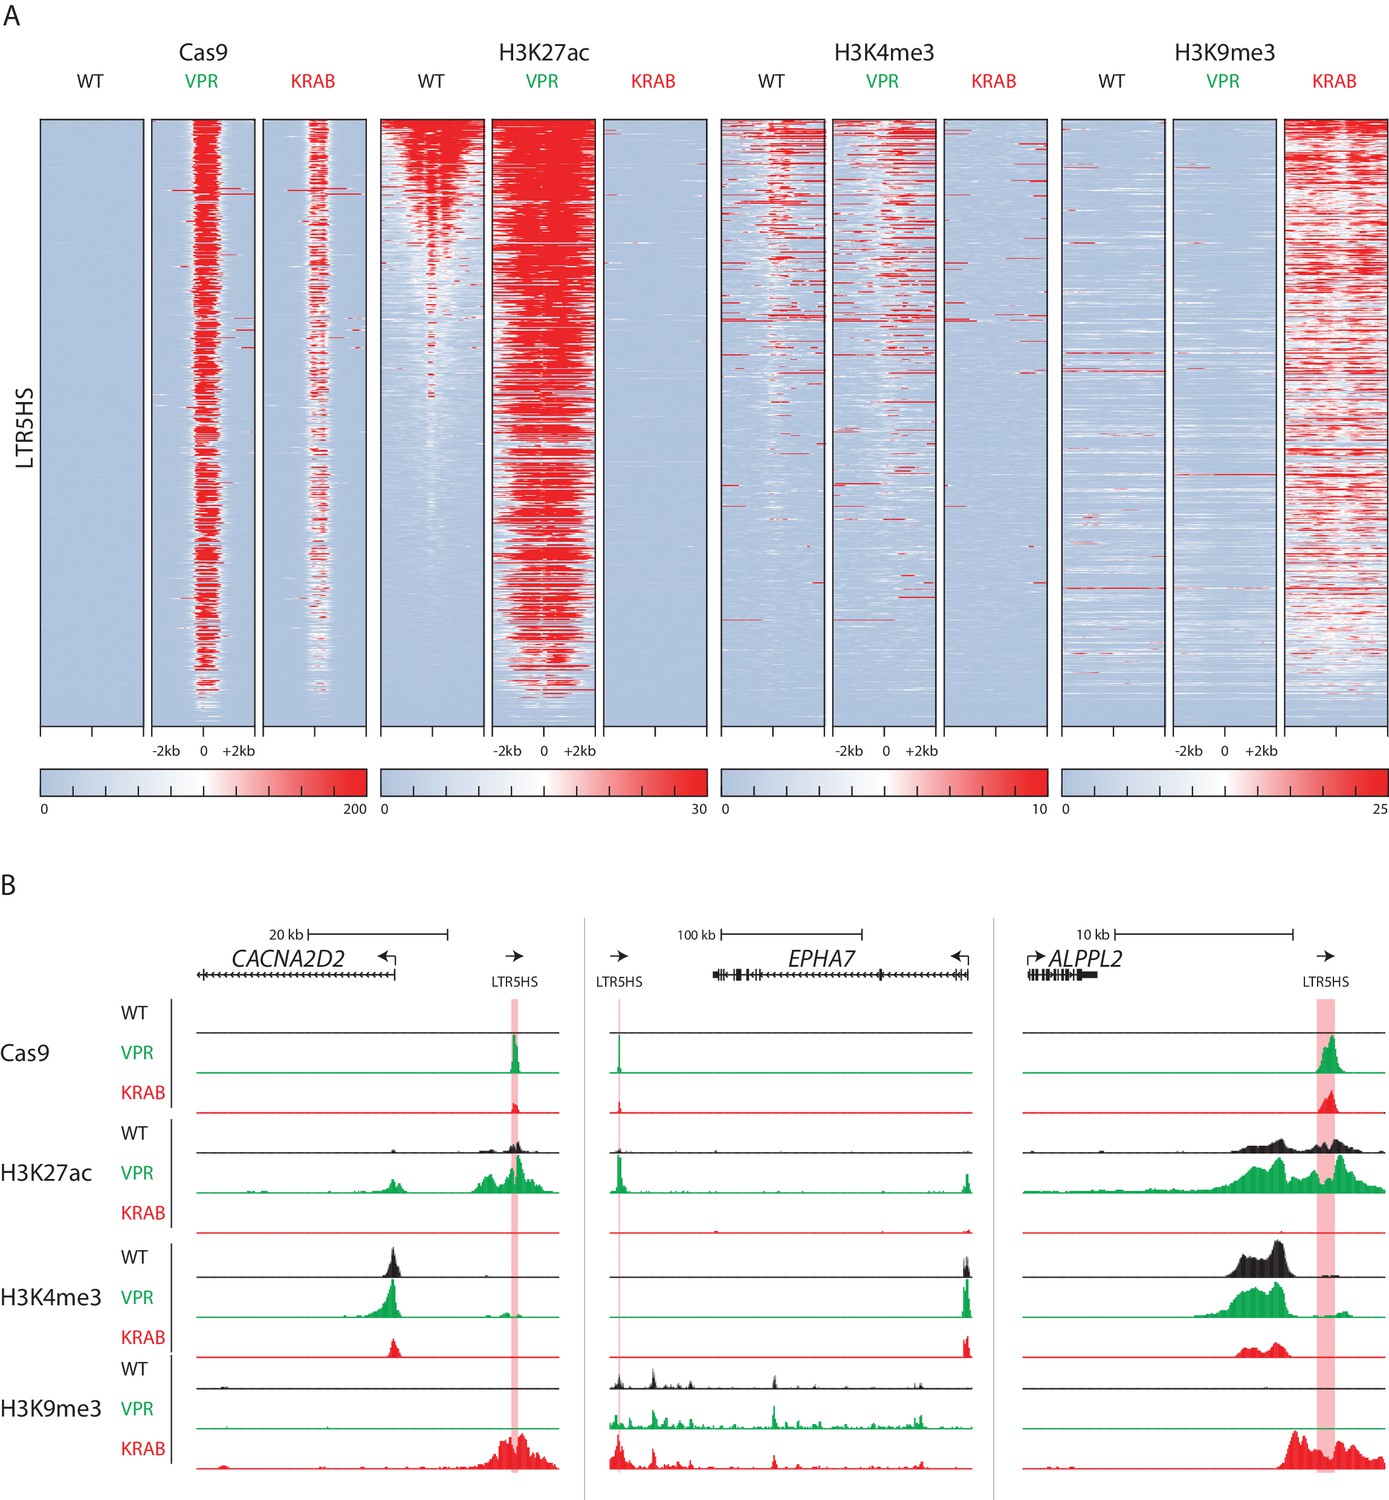
Changes in LTR5HS chromatin landscape upon CARGO-CRISPRa/CRISPRi.
(A) Heat maps of normalized ChIP-seq signal using antibodies against Cas9, H3K27ac, H3K4me3, or H3K9me3. Heat maps for each antibody show wild type NCCIT or NCCIT cells expressing dCas9-VPR or dCas9-KRAB fusion along with LTR5HS Sp CARGO array. Each row represents a 4 kb window (2 kb in each direction) centered at the middle of HERVK LTR5HS. All heat maps are sorted by H3K27ac signal in WT NCCIT. (B) UCSC hg38 genome browser tracks showing ChIP-seq profiles for Cas9, H3K27ac, H3K4me3, and H3K9me3, in WT NCCIT, CRISPRa targeting condition (dCas9-VPR), and CRISPRi targeting condition (dCas9-KRAB). LTR5HS insertions are highlighted in pink. Arrows show direction of transcription of coding genes and LTR5HS elements.
Figure 4 with 1 supplement
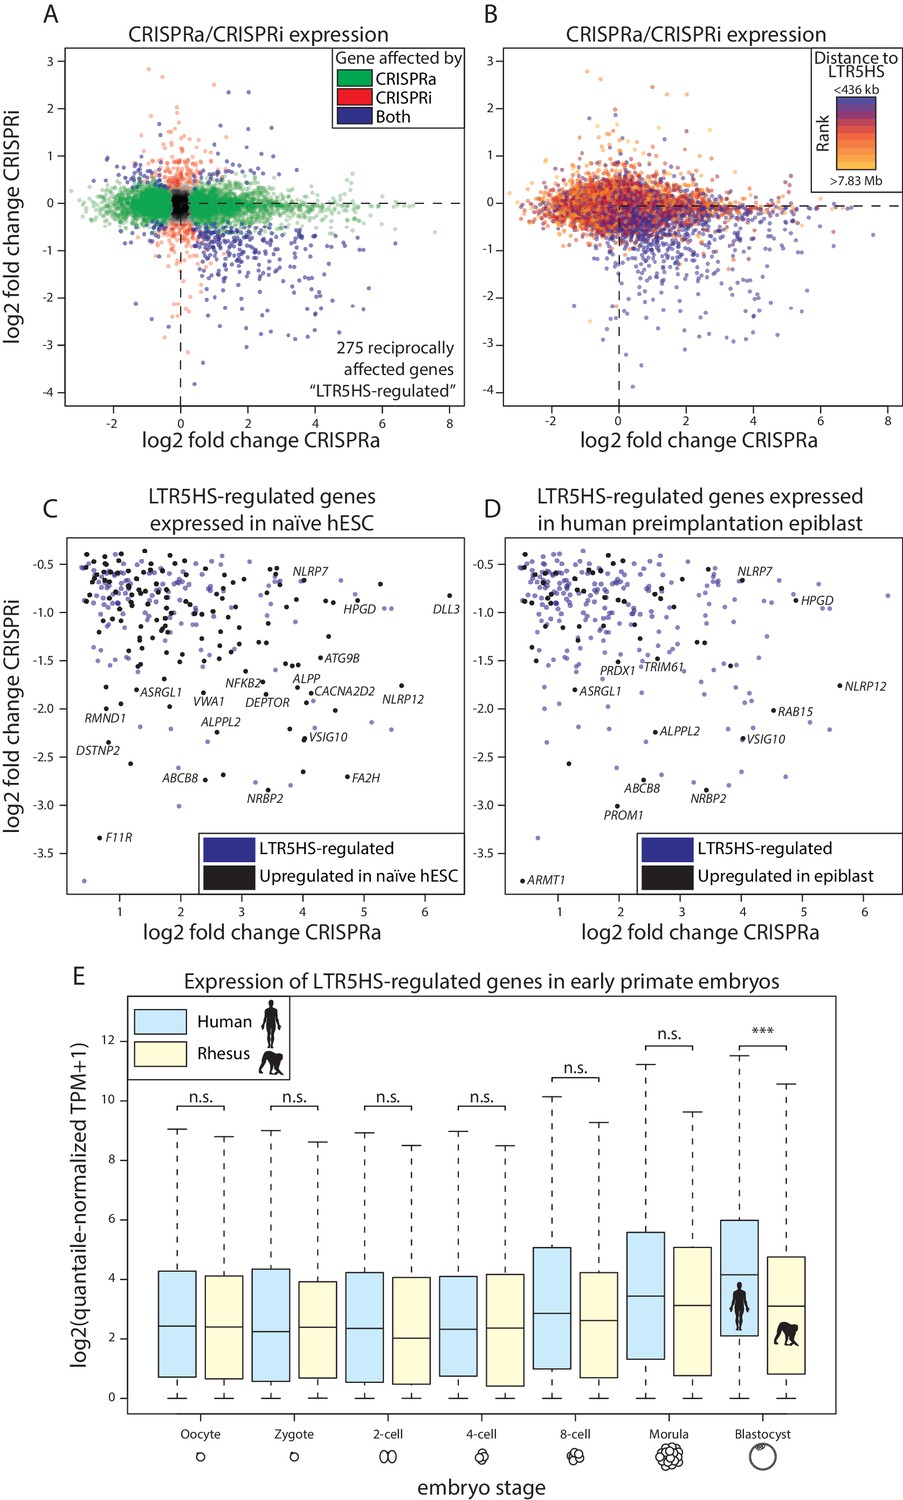
Reciprocal effects of LTR5HS CARGO-CRISPRa/CRISPRi on host gene expression.
(A) Gene expression log2 fold change of CRISPRi (recruitment vs. control) vs. log2 fold change of CRISPRa (recruitment vs. control). Green, genes affected by CRISPRa alone; red, genes affected by CRISPRi alone; blue, genes affected by both CRISPRa and CRISPRi. Dotted line at lower right quadrant delineates LTR5HS-regulated transcripts reciprocally upregulated by CRISPRa and downregulated by CRISPRi. (B) Plot as in (A), with genes separated into deciles by distance from nearest LTR5HS insertion. Blue, nearest decile; orange, farthest decile. Distance bins for nearest and farthest decile are shown above and below legend, respectively. (C–D) Lower right quadrant of LTR5HS-regulated transcripts in (A), with genes significantly upregulated in (C) naïve versus primed hESC or (D) human preimplantation epiblast shown in black. Data from (Takashima et al., 2014; Theunissen et al., 2016; Yan et al., 2013). (E) Log2-transformed expression of LTR5HS-regulated transcripts in single cells of early human and rhesus macaque embryos at indicated stages of embryogenesis. Plots show median (center line), with interquartile range (box) and whiskers show points within 1.5x the interquartile range. ***p value < 0.001; n.s. not significant, Wilcoxon-Mann-Whitney test. Of the 275 LTR5HS-regulated transcripts, 193 are one-to-one orthologous genes between human and rhesus. Only expression of these genes was considered in this analysis.
Figure 4—figure supplement 1
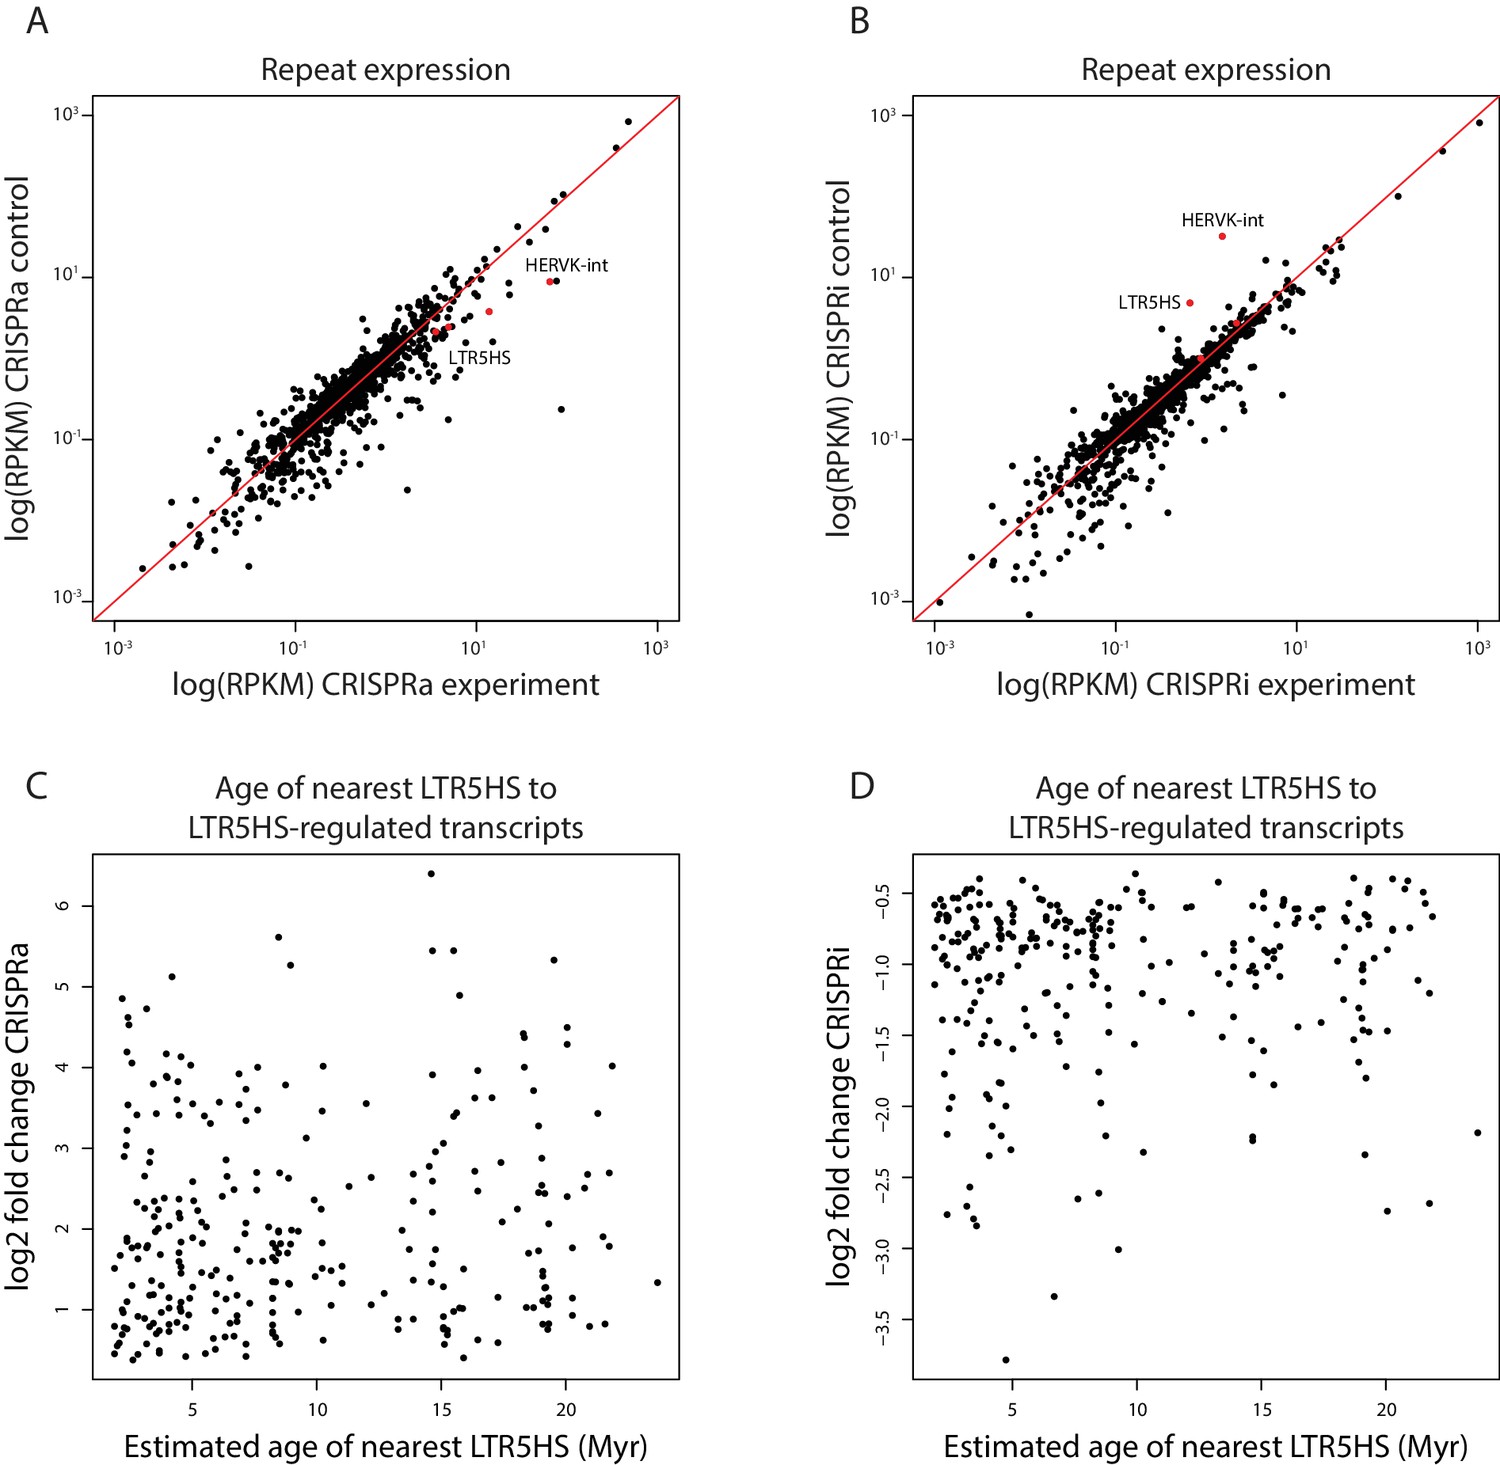
Additional CRISPRa/CRISPRi RNA-seq analyses.
(A and B) Transcriptome analysis of all Repeatmasker sequences, where control (LTR5HS Sa and nontarget Sp) is shown vs. recruitment (LTR5HS Sp) for CRISPRa (A) and CRISPRi (B). LTR5HS and HERVK signals are shown in red. (C–D) log2 fold change of CRISPRa (recruitment vs. control; C) or CRISPRi (recruitment vs. control; D) vs. estimated age of nearest LTR5HS from (Subramanian et al., 2011).
Figure 5 with 3 supplements
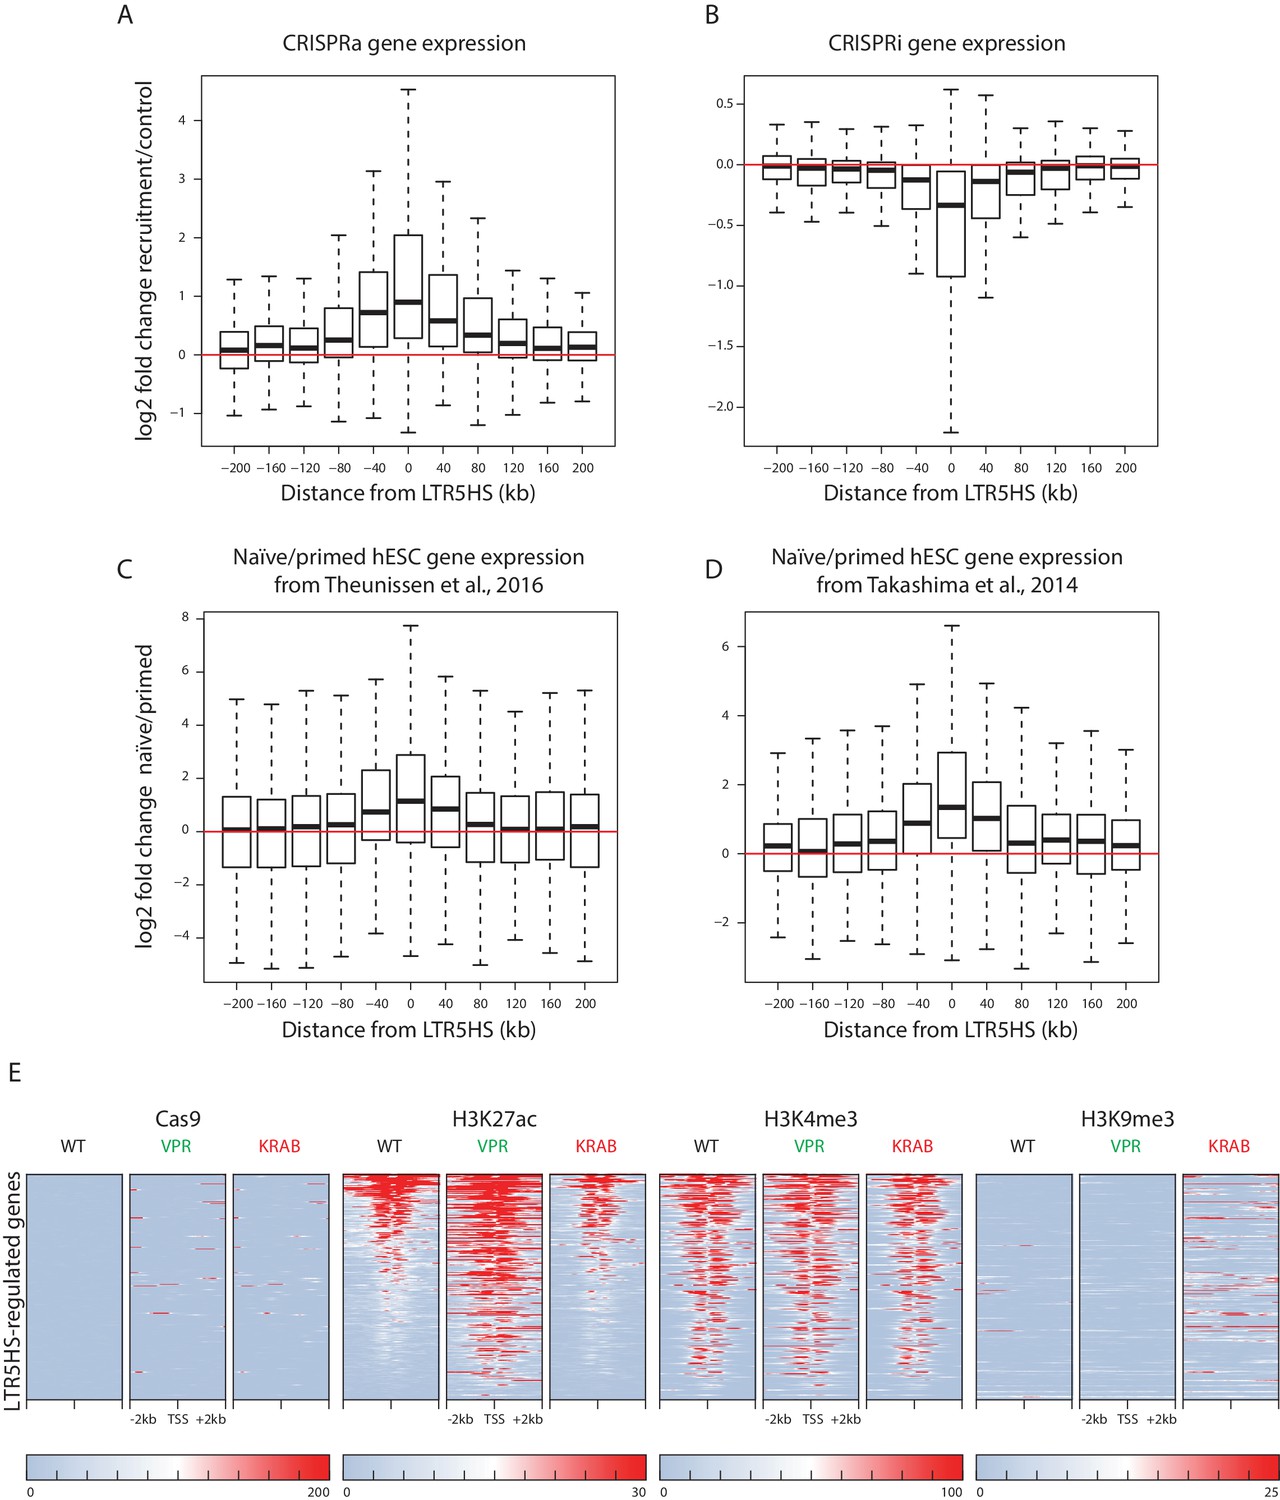
LTR5HS activation or repression affects host gene expression over long genomic distances.
(A–B) Box plots of log2 fold change in gene expression between recruitment (LTR5HS Sp) and control (LTR5HS Sa and nontarget Sp) arrays in NCCIT cells induced with CRISPRa (A) or CRISPRi (B). (C–D) Box plots of log2 fold change in gene expression between naïve and primed hESC, using data from (Theunissen et al., 2016) (C) and (Takashima et al., 2014) (D). For all box plots, genes are binned into 40 kb bins centered around the indicated integer by distance from the TSS to the center of the nearest LTR5HS insertion. Plots show median (center line), with interquartile range (box), and whiskers show points within 1.5x the interquartile range. Statistical significance analysis of observed changes for each bin and additional bins located at distances further away from LTR5HS is presented in Supplementary file 1. (E) Heat maps of normalized ChIP-seq signal using antibodies against Cas9, H3K27ac, H3K4me3, or H3K9me3. Heat maps for each antibody show wild type NCCIT or NCCIT cells expressing dCas9-VPR or dCas9-KRAB fusion along with LTR5HS Sp CARGO array. Each row represents a 4 kb window (2 kb in each direction) centered around the TSS of the 275 LTR5HS-regulated genes (i.e. blue points in lower right quadrant of Figure 4A). All heat maps are sorted by H3K27ac signal in WT NCCIT.
Figure 5—figure supplement 1
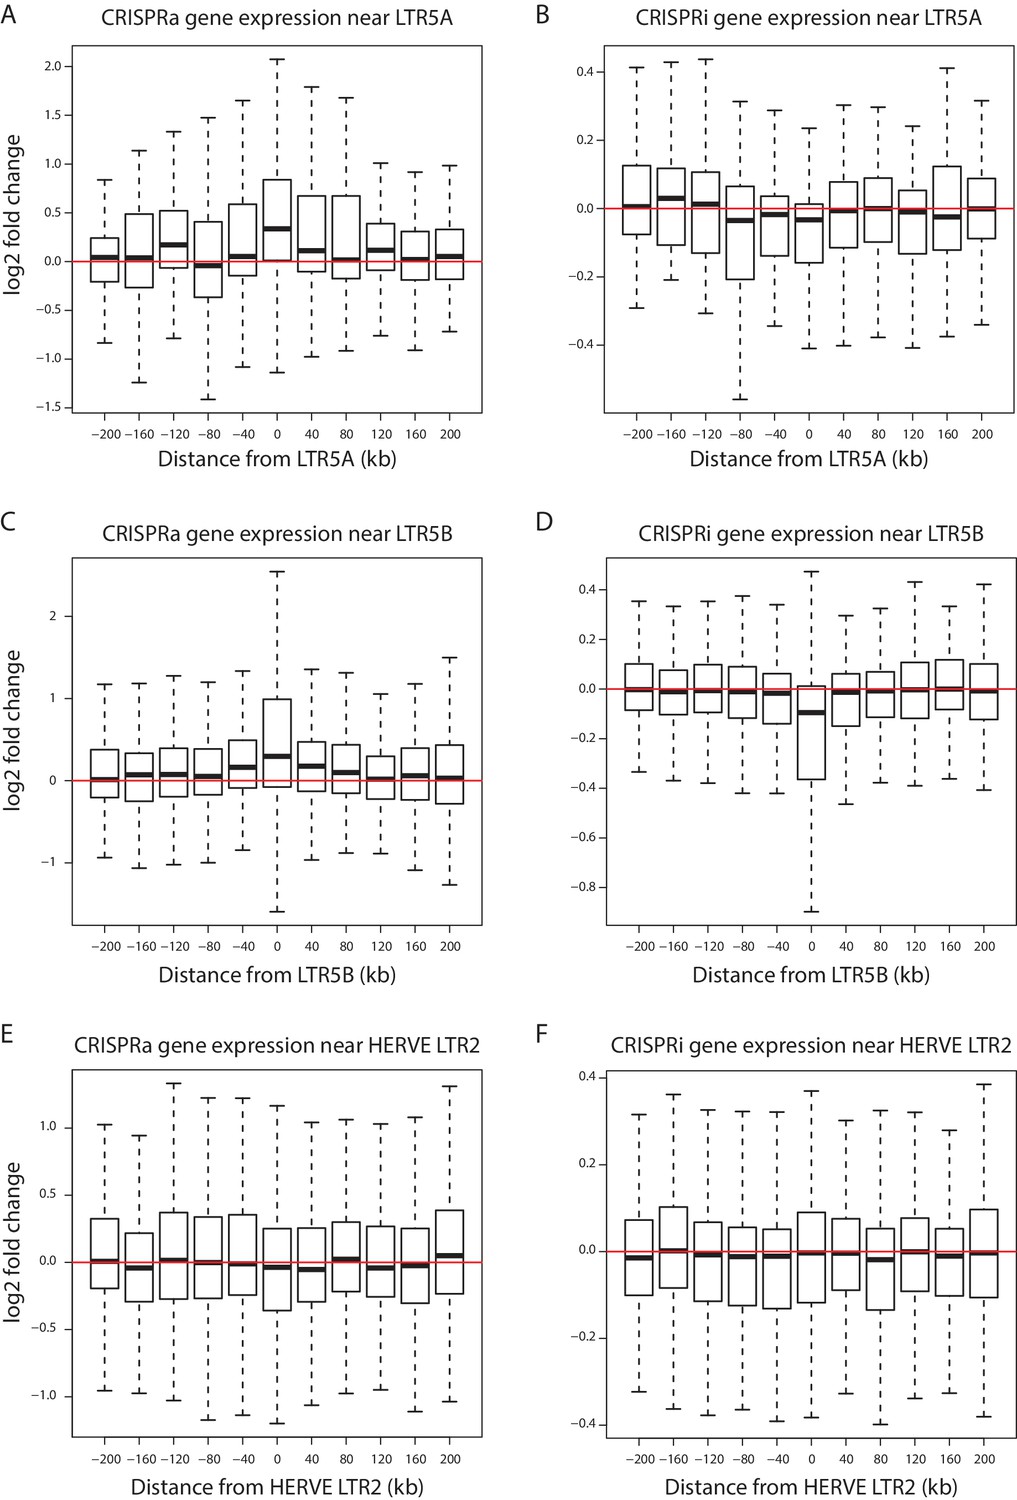
Expression changes in relation to distance from LTR5A, LTR5B, and HERVE LTR2.
(A–F) Box plots of log2 fold change in gene expression between recruitment (LTR5HS Sp) and control (LTR5HS Sa and nontarget Sp) arrays in NCCIT cells induced with CRISPRa (A, C, and E) or CRISPRi (B, D, and F). Genes are binned into 40 kb bins centered around the indicated integer by distance from the TSS to the center of the nearest LTR5A (A–B), LTR5B (C–D), or HERVE LTR2 (E–F) insertion. Plots show median (center line), with interquartile range (box), and whiskers show points within 1.5x the interquartile range.
Figure 5—figure supplement 2
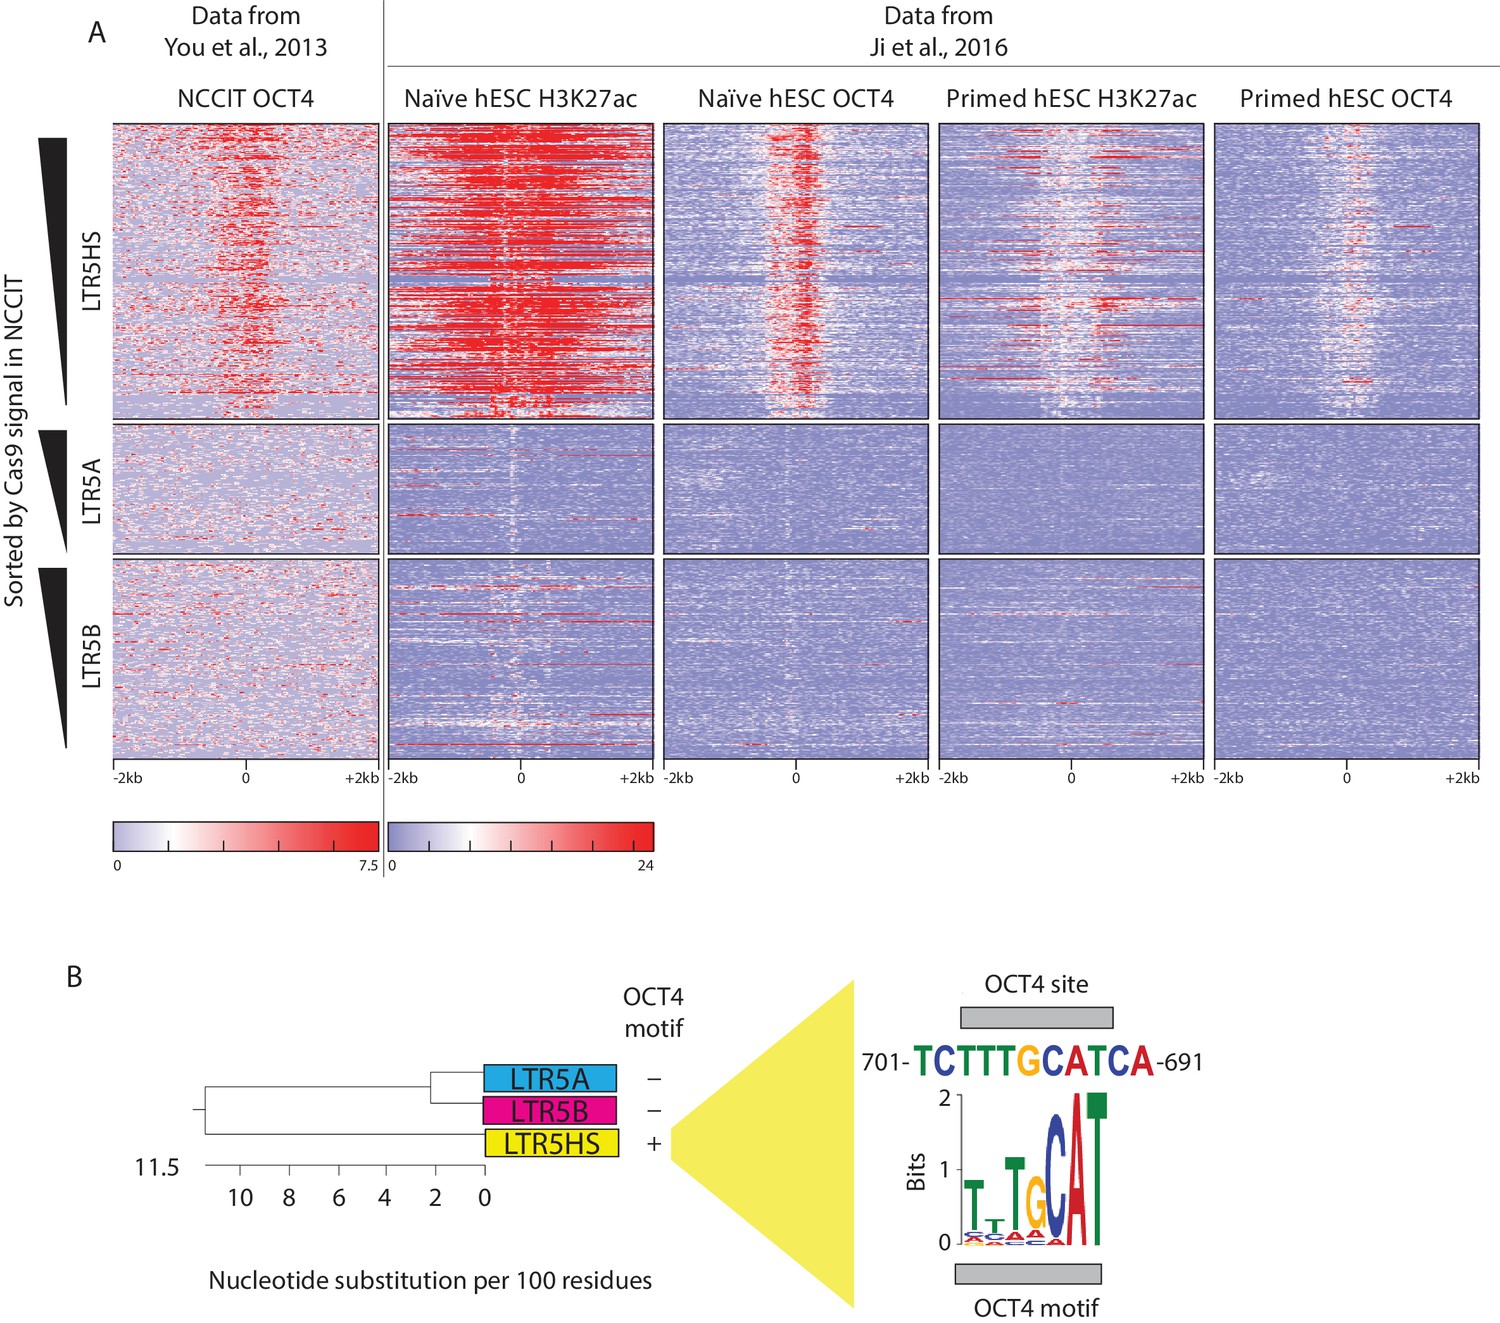
OCT4 and H2K27ac enrichments at HERVK LTR5 subclasses.
(A) Heat maps of normalized OCT4 or H3K27ac ChIP-seq signal in the indicated cell type and condition. Each row represents a 4 kb window (2 kb in each direction) centered at the middle of the indicated HERVK LTR. Heat map of each LTR is sorted by Cas9 LTR5HS Sp ChIP mean signal in NCCIT as in Figure 2C. Data are from (You et al., 2013) and (Ji et al., 2016). (B) Left, phylogenetic relationship of HERVK (HML-2) LTR5 subclasses. Presence or absence of Oct4 motif in LTR sequence is shown. Right, conserved OCT4 site in LTR5HS with position weight matrix of OCT4 binding motif shown for comparison. Panel adapted from (Grow et al., 2015).
Figure 5—figure supplement 3
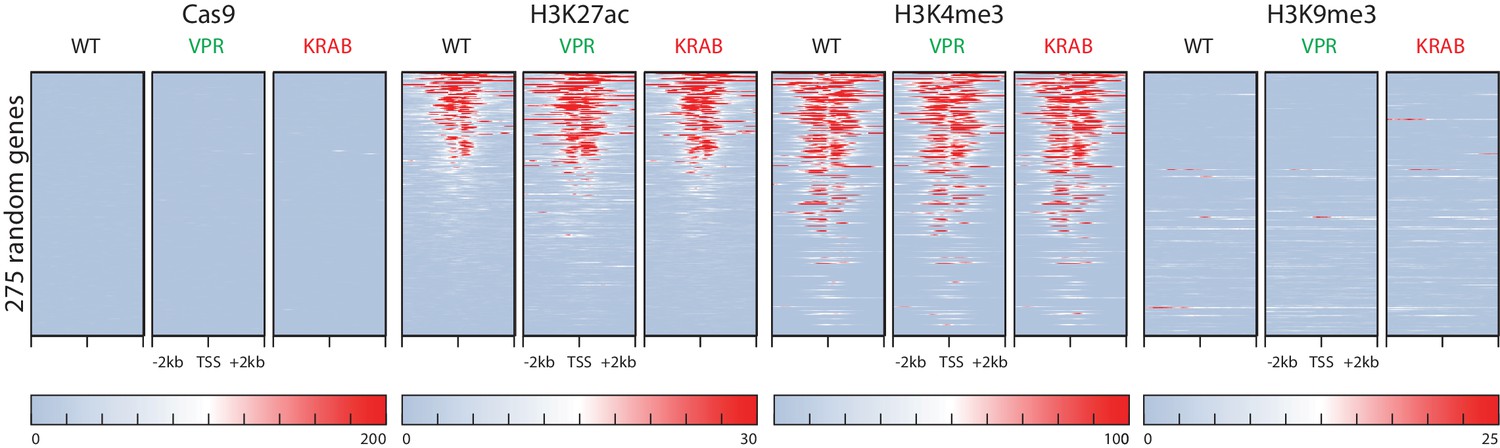
ChIP-seq heat maps for 275 randomly selected genes.
Heat maps of normalized ChIP-seq signal using antibodies against Cas9, H3K27ac, H3K4me3, or H3K9me3. Heat maps for each antibody show wild type NCCIT or NCCIT cells expressing dCas9-VPR or dCas9-KRAB fusion along with LTR5HS Sp CARGO array. Each row represents a 4 kb window (2 kb in each direction) centered around the TSS of the 275 randomly selected genes, as a control for the analysis shown in Figure 5E. All heat maps are sorted by H3K27ac signal in WT NCCIT.
Figure 6 with 1 supplement

Contribution of LTR5HS sequences to chromatin marking and host gene expression.
(A) ChIP-qPCR analysis for H3K27ac and H3K4me1 on multiple clonal lines with or without the LTR5HS deletions at indicated gene loci. Regions directly flanking the LTR5HS were analyzed for ChIP signal enrichment over two negative regions. Average signals obtained across indicated number of clones are shown. (B) RT-qPCR analysis of LTR5HS-regulated transcripts in multiple clonal lines with or without the LTR5HS deletions at indicated gene loci. Average expression of each gene across indicated number of clones is shown, measured relative to two housekeeping genes, RPL13A and TBP. Above each plot in (B), diagram showing TSS and nearest LTR5HS is shown to scale. Arrows show direction of transcription of coding genes and LTR5HS elements. For both (A) and (B), clones are either WT (black) or deleted for the nearest LTR5HS (LTR5HS highlighted in pink and marked with an ‘X’ in top panels of [B]) by CRISPR/Cas9 genome editing (gray). Error bars show standard deviation. *p value < 0.05; **p < 0.01; ***p < 0.001; ****p < 0.0001, one-sided t-test.
Figure 6—figure supplement 1
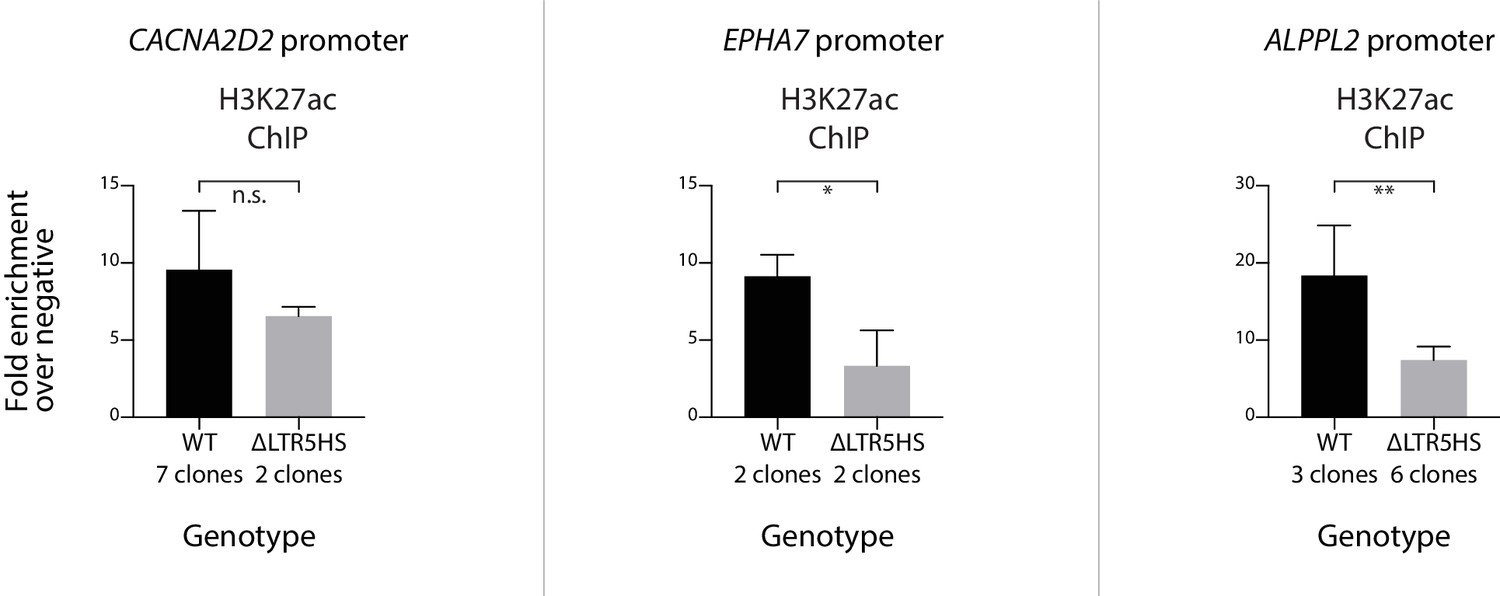
ChIP-qPCR analysis at promoters of LTR5HS-regulated genes upon deletion of nearest LTR5HS insertion.
ChIP-qPCR analysis for H3K27ac in NCCIT clonal cell lines at the promoter of the indicated gene. Average ChIP fold enrichment over two negative ChIP regions across indicated number of clones is shown. Clones are the same as in Figure 6A, either WT (black) or deleted for the nearest LTR5HS (LTR5HS highlighted in pink and marked with an ‘X’ in top panels of [B]) by CRISPR/Cas9 genome editing (gray). Error bars show standard deviation. *p value < 0.05; **p < 0.01; n.s. not significant; one-sided t-test.
Additional files
-
Supplementary file 1
Excel file of statistical analysis for Figure 5
- https://doi.org/10.7554/eLife.35989.018
-
Supplementary file 2
Excel file of antibodies, primers, and gRNAs used in this study
- https://doi.org/10.7554/eLife.35989.019
-
Supplementary file 3
Text file of analyzed RNA-seq data generated in this study.
Includes gene name; log2 fold change and adjusted p-value for CRISPRa and CRISPRi; hg38 coordinates of the nearest LTR5HS insertion to the TSS of the gene; and distance between the TSS and the LTR5HS.
- https://doi.org/10.7554/eLife.35989.020
-
Supplementary file 4
Text file of analyzed RNA-seq data from (Wang et al., 2017; Yan et al., 2013).
Includes gene name (for all 15090 genes with one-to-one orthology between human and rhesus); Boolean field indicating whether the gene is one of the 193 LTR5HS-regulated transcripts with one-to-one-orthology, which are plotted in Figure 4E; TPM values for oocyte, zygote, 2-cell, 4-cell, and 8-cell stages, morula, and blastocyst of both human and rhesus.
- https://doi.org/10.7554/eLife.35989.021
-
Supplementary file 5
BED of dCas9 ChIP-seq peaks for LTR5HS S. pyogenes (i.e. targeting) condition in Figure 2.
Includes hg38 coordinates and MACS2 score for each peak.
- https://doi.org/10.7554/eLife.35989.022
-
Transparent reporting form
- https://doi.org/10.7554/eLife.35989.023
Download links
A two-part list of links to download the article, or parts of the article, in various formats.
Downloads (link to download the article as PDF)
Open citations (links to open the citations from this article in various online reference manager services)
Cite this article (links to download the citations from this article in formats compatible with various reference manager tools)
Systematic perturbation of retroviral LTRs reveals widespread long-range effects on human gene regulation
eLife 7:e35989.
https://doi.org/10.7554/eLife.35989


