Developmentally regulated H2Av buffering via dynamic sequestration to lipid droplets in Drosophila embryos
- University of Rochester, United States
Figures
Figure 1

H2Av can translocate from lipid droplets (LDs) to nearby nuclei.
In NC13 embryos expressing H2Av-paGFP, a region enriched for LDs was photoactivated by exposure to 405 nm light (Dashed box, A’). (A) Prior to photoactivation, (A’) ~30 s post-photoactivation, (A’') ~8 min post-photoactivation. The majority of H2Av-paGFP dissipates from LDs and accumulates preferentially in nuclei immediately adjacent to the photoactivated region. White arrowheads indicate autofluorescent yolk particles within the embryo and are not indicative of H2Av-paGFP signal. Scale bar represents 10 μm.
Figure 2

A photoswitchable H2Av-Dendra2 for in-vivo H2Av tracking.
(A) Generation of a transgene containing H2Av-Dendra2 under endogenous regulation. The endogenous H2Av genomic region (~4 Kb) was amplified via PCR and the Dendra2 protein coding sequence (Evrogen) was inserted, in frame, at the end of the fourth exon, prior to the stop codon. White boxes represent coding exons. Grey boxes represent UTRs. Scale represents approximately 1 Kb. (B,C) Expression of H2Av-Dendra2 in NC13 embryos. Embryos expressing H2Av-Dendra2 prior to (B) and after (C) photoswitching. Different channels represent non-photoswitched H2Av-Dendra2 (green, [B,C]) and photoswitched H2Av-Dendra2 (red, [B’, C’]). Substantial photoswitching is achieved via exposure of a region of interest (dashed box) to 405 nm light. Scale bar represents 20 μm.
Figure 3 with 1 supplement

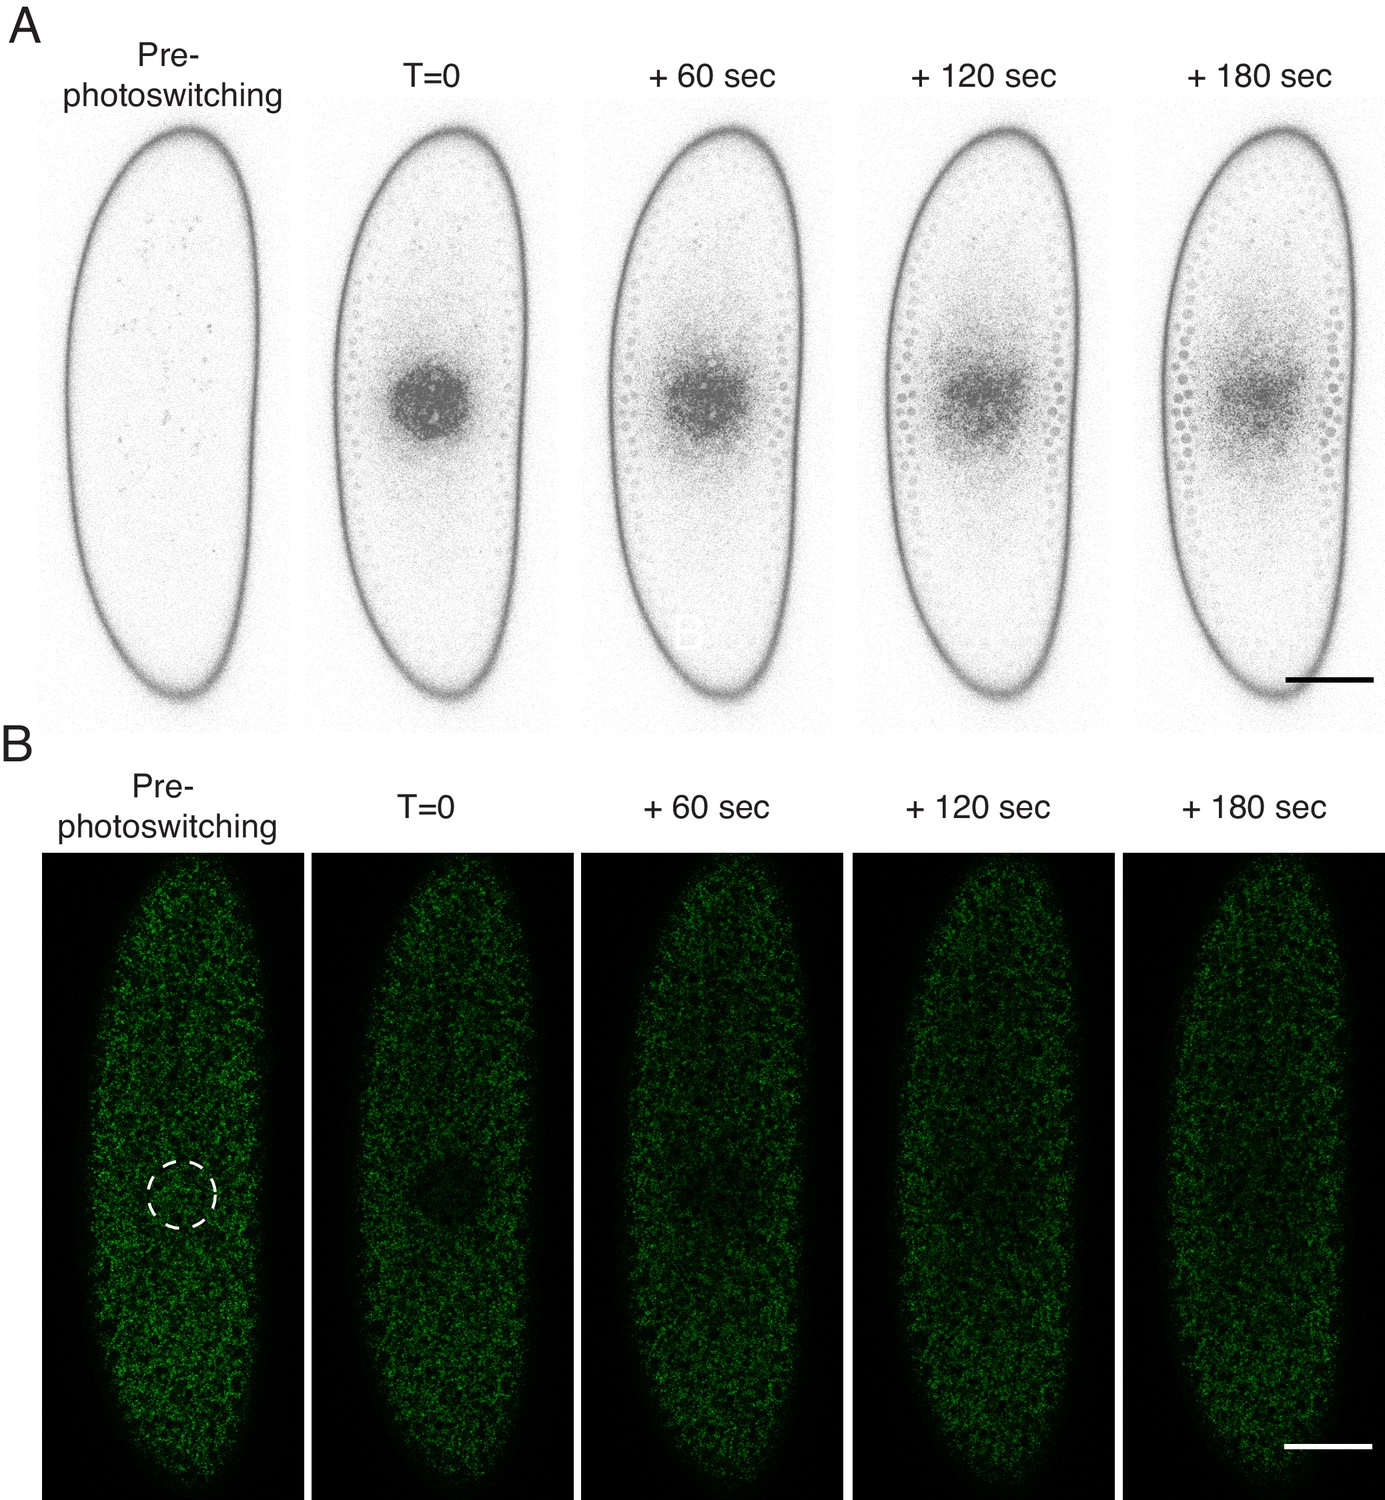
H2Av is rapidly lost from LDs throughout early embryogenesis.
(A) Scheme of experimental design. (Left) Photoswitching of LD-enriched regions is achieved by focusing just below the embryo surface. Dashed line represents plane of view. (Right) When viewing the embryo at this focal plane, nuclei are visible at the periphery (blue) and LDs are present throughout the focal plane (yellow). (B) After photoswitching, H2Av-Dendra2 signal is rapidly lost from the photoswitched region, appearing to spread throughout the embryo. Red channel (photoswitched H2Av-Dendra2) is shown. Images of NC13 embryos were taken every 60 s post-photoswitching (See also Figure 3—figure supplement 1). Scale bar represents 50 μm. (C) Quantitation of fluorescent signal within the photoswitched region shows rapid loss of signal over time. Values represent the percentage of initial fluorescence remaining within the photoswitched region at the indicated time points. Colors represent different ages of embryos. Five embryos per stage were quantified. Error bars represent SD.
Figure 3—figure supplement 1
H2Av is dynamically associated with LDs.
(A) After photoswitching, H2Av-Dendra2 signal is rapidly lost from the photoswitched region, appearing to spread throughout the embryo. Shown are images from the red channel as in Figure 3B, but pixels have been inverted and brightness increased linearly across the whole image for better visualization. Scale bar represents 50 μm. (B) Photoswitching was performed in cleavage stage embryos and non-photoswitched H2Av-Dendra2 (green) signal was monitored post-photoswitching: green signal accumulates in the photoswitched region over time. Scale bar represents 50 μm.
Figure 4 with 1 supplement
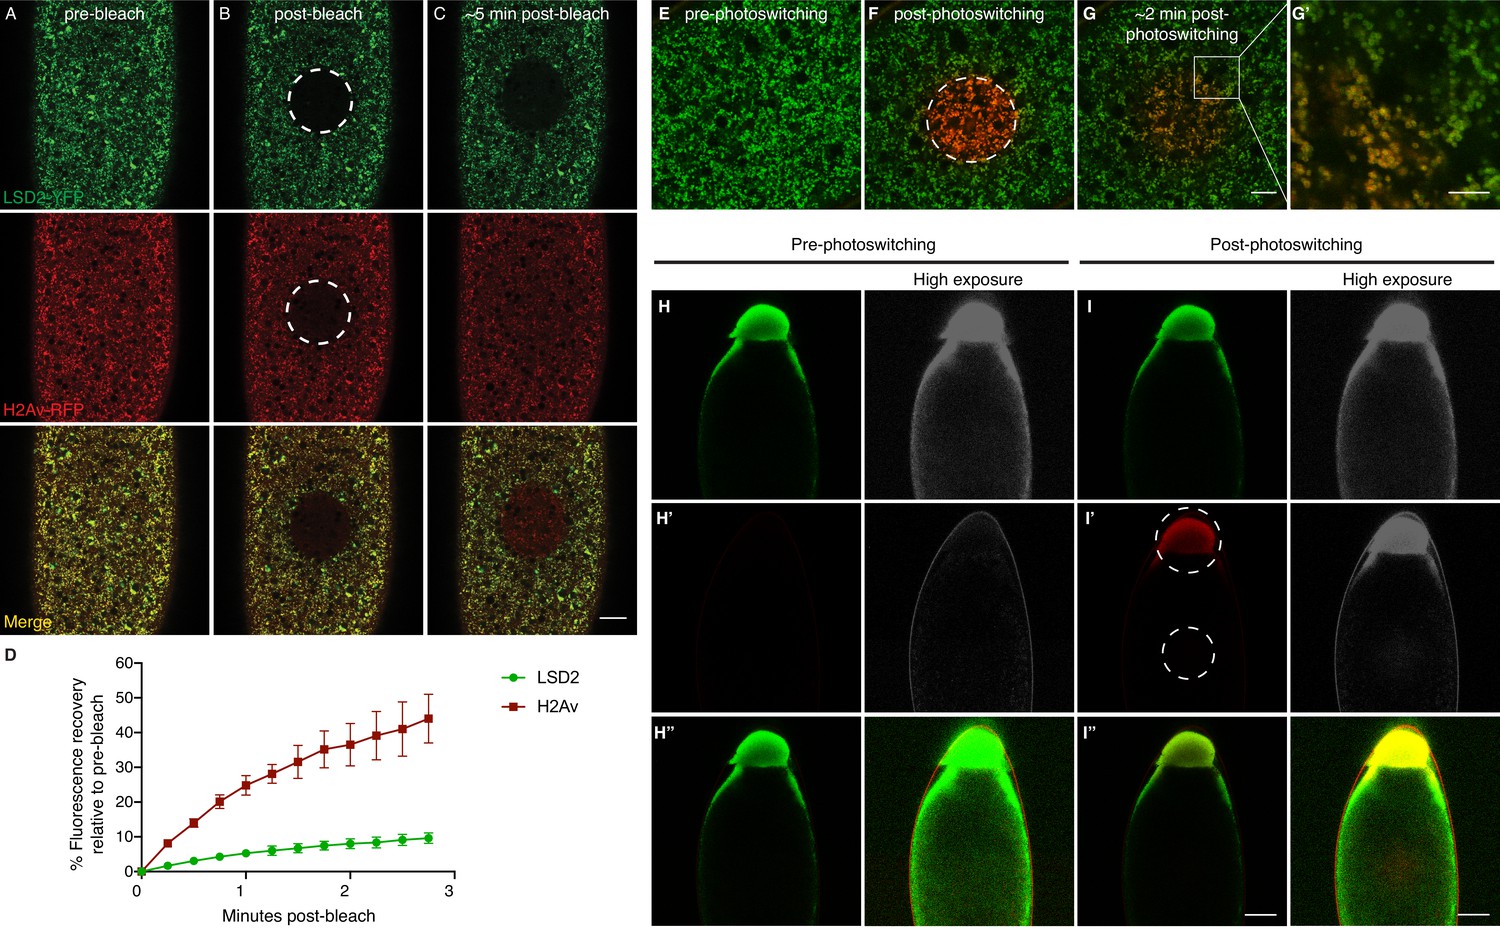
H2Av exchanges between LDs via a cytoplasmic route.
(A–C) Fluorescence Recovery After Photobleaching (FRAP) in cleavage stage embryos expressing LSD2-YFP (green), a LD marker, and H2Av-mRFP. Photobleaching was induced in LD enriched regions near the embryonic surface (dashed circle) and recovery was monitored over time. (A) Pre-bleach, (B) immediately post-bleach, (C) ~5 min post-bleach. Scale bar represents 20 μm. (D) Quantitation of FRAP experiments in A-C. N = 3. Error bars represent SD. See also Figure 4—figure supplement 1. (E–G) Photoswitching was induced in cleavage stage embryos expressing H2Av-Dendra2. Within minutes, colocalization (yellow) of non-photoswitched (green) and photoswitched (red) H2Av-Dendra2 is evident. Scale bar represents 10 μm. (G’) Colocalization shows the ring pattern characteristic of LD proteins. Scale bar represents 5 μm. (H–I) Photoswitching in centrifuged embryos expressing H2Av-Dendra2. Photoswitching was induced either at the LD layer or in cytoplasmic regions (dashed circles, I’). A weak, but specific, cytoplasmic population of H2Av-Dendra2 is evident under high exposure. In centrifuged wild-type embryos, no signal is observed after similar exposure to 405 nm light (not shown). Scale bar represents 10 μm.
Figure 4—figure supplement 1
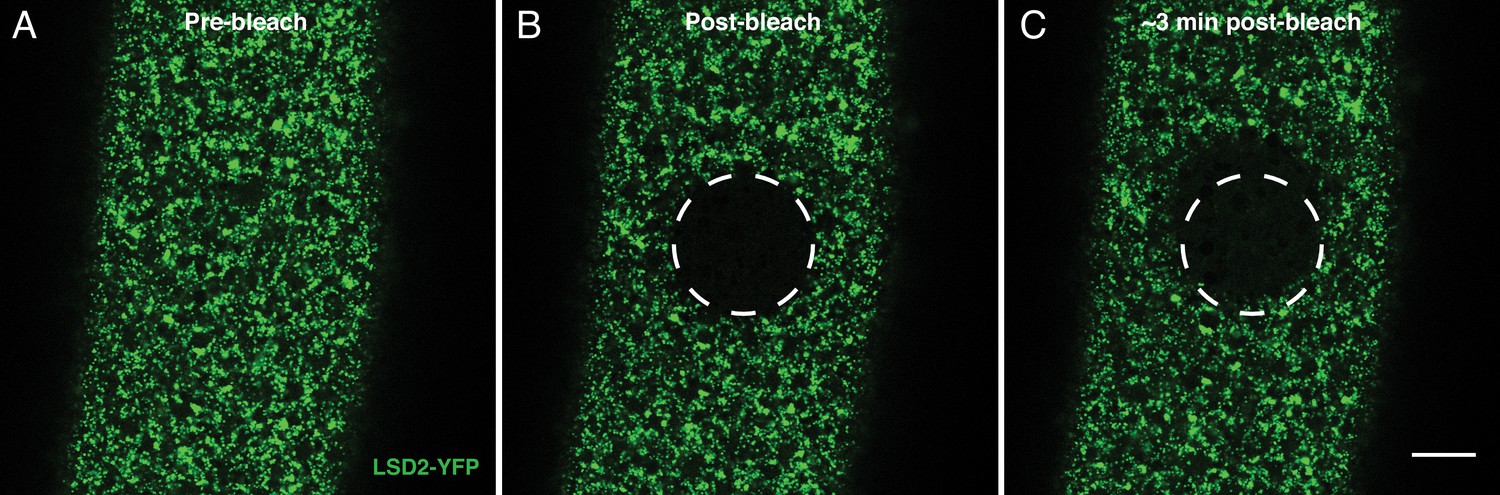
Observed H2Av dynamics do not result from cytoplasmic streaming.
FRAP experiments in cleavage stage embryos occasionally show large-scale movement within the cytoplasm, likely due to cytoplasmic streaming. (A-C) FRAP experiment in a cleavage stage embryo expressing LSD2-YFP. Over time, streaming within the embryo is apparent as the bleached region relocates out of the photobleached area. Importantly, signal still fails to substantially recover just as in Figure 4A–C. Scale bar represents 20 μm.
Figure 5 with 1 supplement
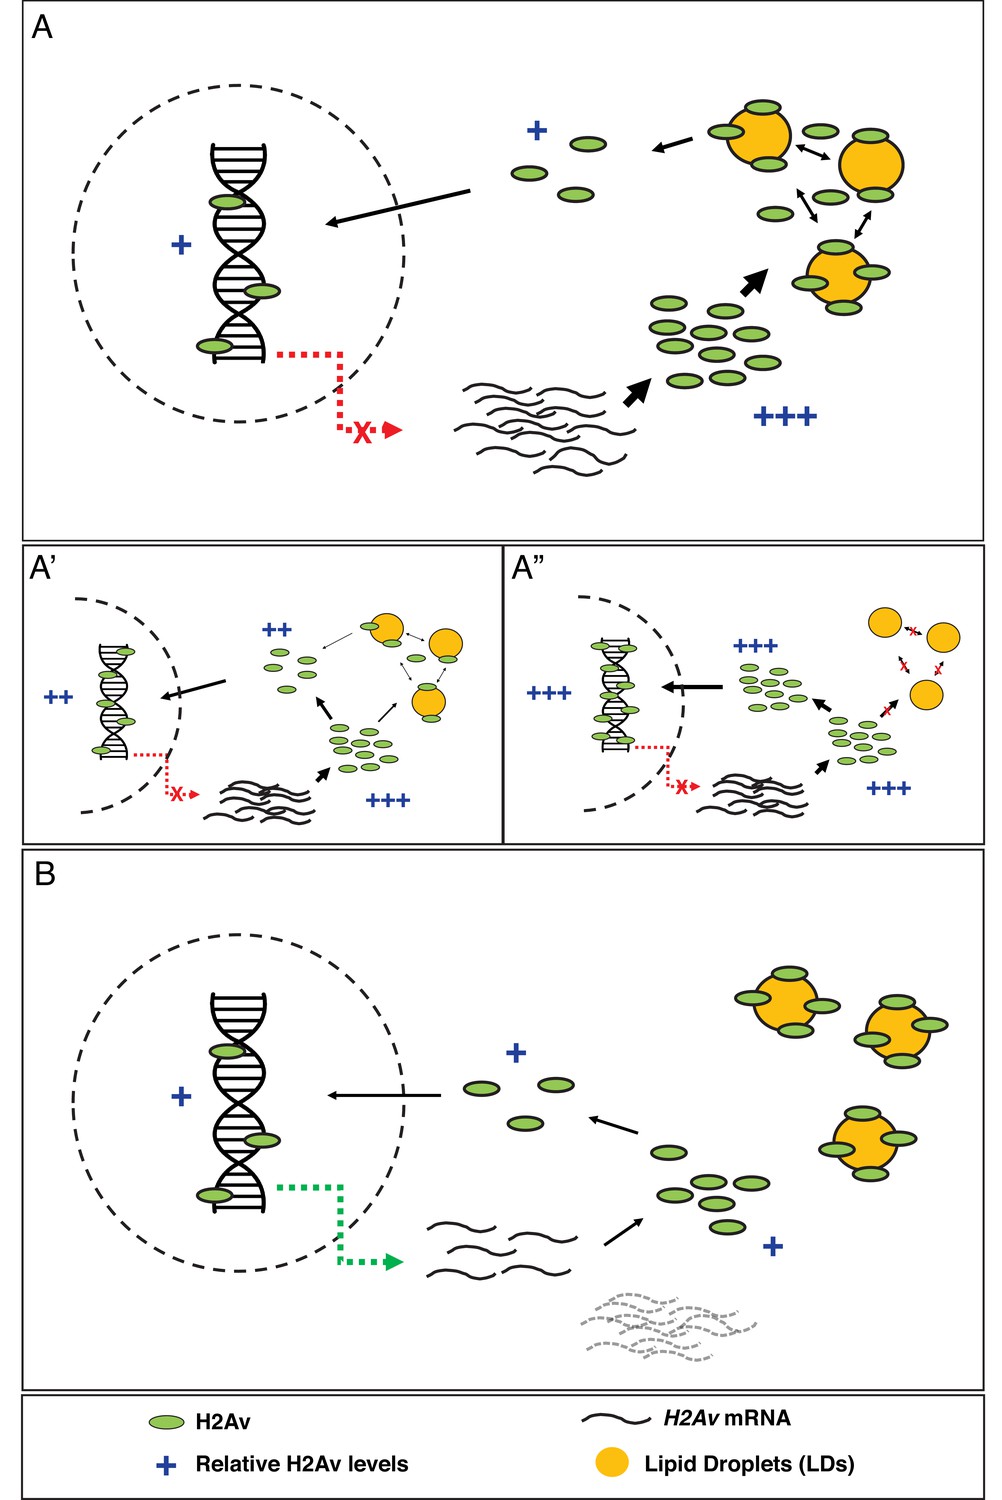
Model: LDs constitute the major regulator of H2Av protein levels both free in the cytoplasm and in the nucleus.
(A) In early Drosophila embryos, LDs are the main H2Av regulator. H2Av mRNA levels are stable; these represent maternal mRNAs, and there is no zygotic contribution (red dashed line). H2Av synthesized in excess is buffered by LDs, limiting the amount of H2Av available free in the cytoplasm for subsequent nuclear import and deposition onto chromatin. (A’,A”) Reduction in buffering capacity reduces the amount of available H2Av, resulting in reduced nuclear import and deposition onto chromatin. (A’) 1x Jabba and (A”) 0x Jabba. (B) H2Av buffering by LDs is dramatically reduced at the midblastula transition (MBT). Maternal H2Av mRNA stores (black dashed lines) are degraded, and zygotic H2Av transcription is activated (green dashed line), resulting in overall lower H2Av protein production. LD mediated H2Av buffering ceases, and H2Av is neither lost from nor transiently sequestered to LDs. Width of black arrows indicate H2Av flux at each step of regulation. See also Figure 5—figure supplement 1.
Figure 5—figure supplement 1
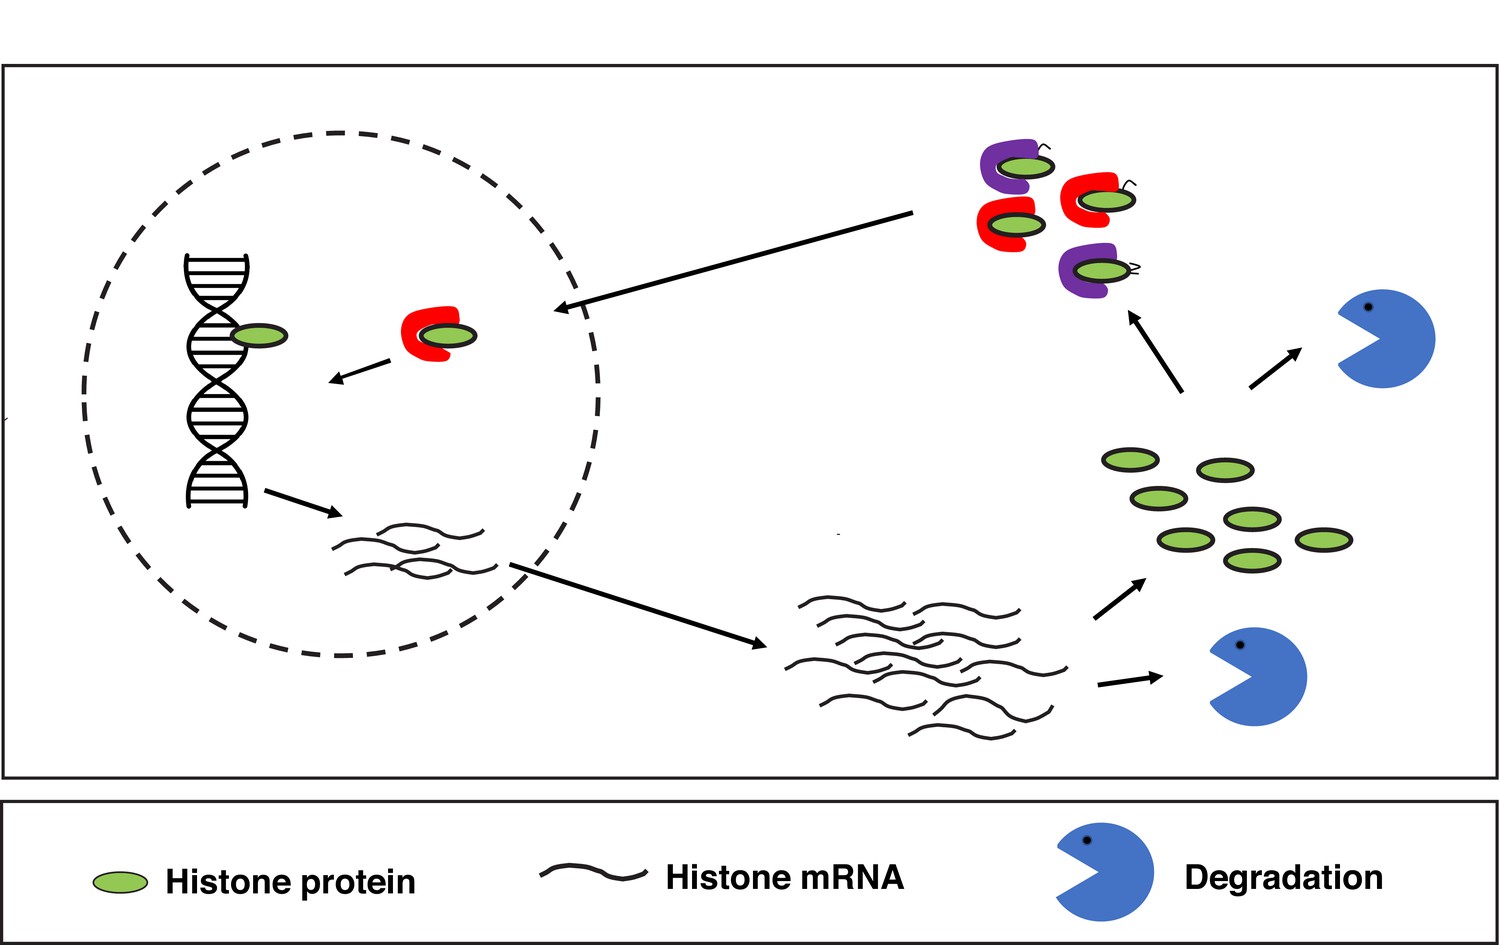
In most cells, histones are regulated at multiple steps.
Such regulation of histone abundance/deposition onto chromatin occurs transcriptionally, post-transcriptionally (e.g. degradation of mRNA), and post-translationally (e.g. protein degradation, post-translational modifications, and histone chaperone function). Red and purple objects represent canonical histone chaperones.
Figure 6
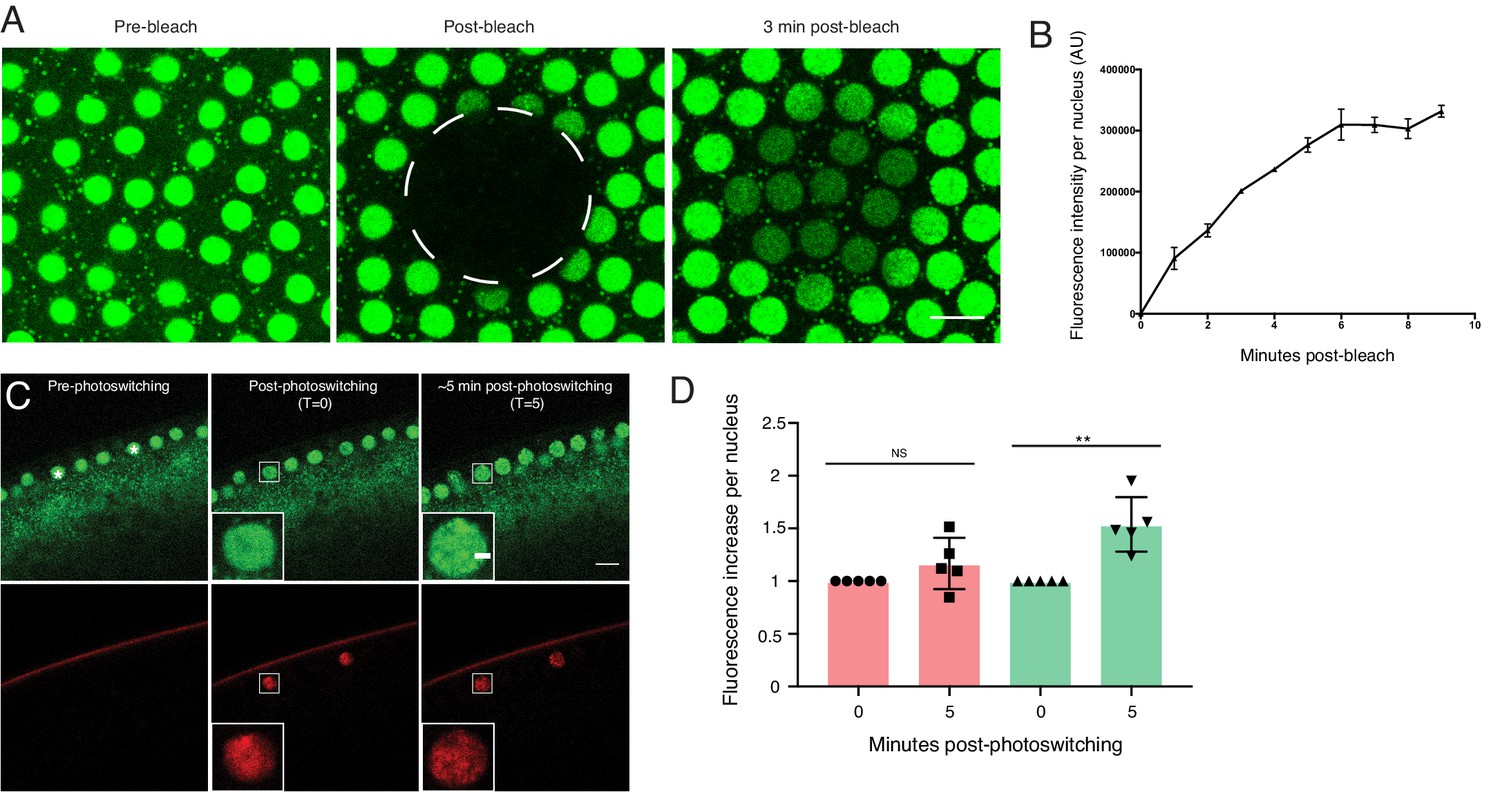
Nuclear H2Av levels are driven by nuclear import.
(A,B) A region encompassing several nuclei was photobleached in NC13 embryos expressing H2Av-GFP, and nuclear signal was monitored over time. (A) Representative images of a FRAP experiment in NC13 embryos. White dashed circle indicates area of bleaching. Scale bar represents 10 μm. (B) Quantitation of fluorescence intensity per nucleus after bleaching. Five nuclei were averaged per embryo. N = 3 embryos. (C) Photoswitching was induced in single nuclei (white asterisks) in NC13 embryos. Scale bars represent 10 and 2 μm (inlay). (D) Quantitation of changes in fluorescent signal within individual nuclei ~5-min post-photoswitching. Two nuclei were averaged per embryo, N = 5 embryos. For T = 0 vs. T = 5 in the red channel, p=0.1639. For T = 0 vs. T = 5 in the green channel, p=0.0017. All error bars represent SD. All p values were calculated using an unpaired student t-test.
Figure 7
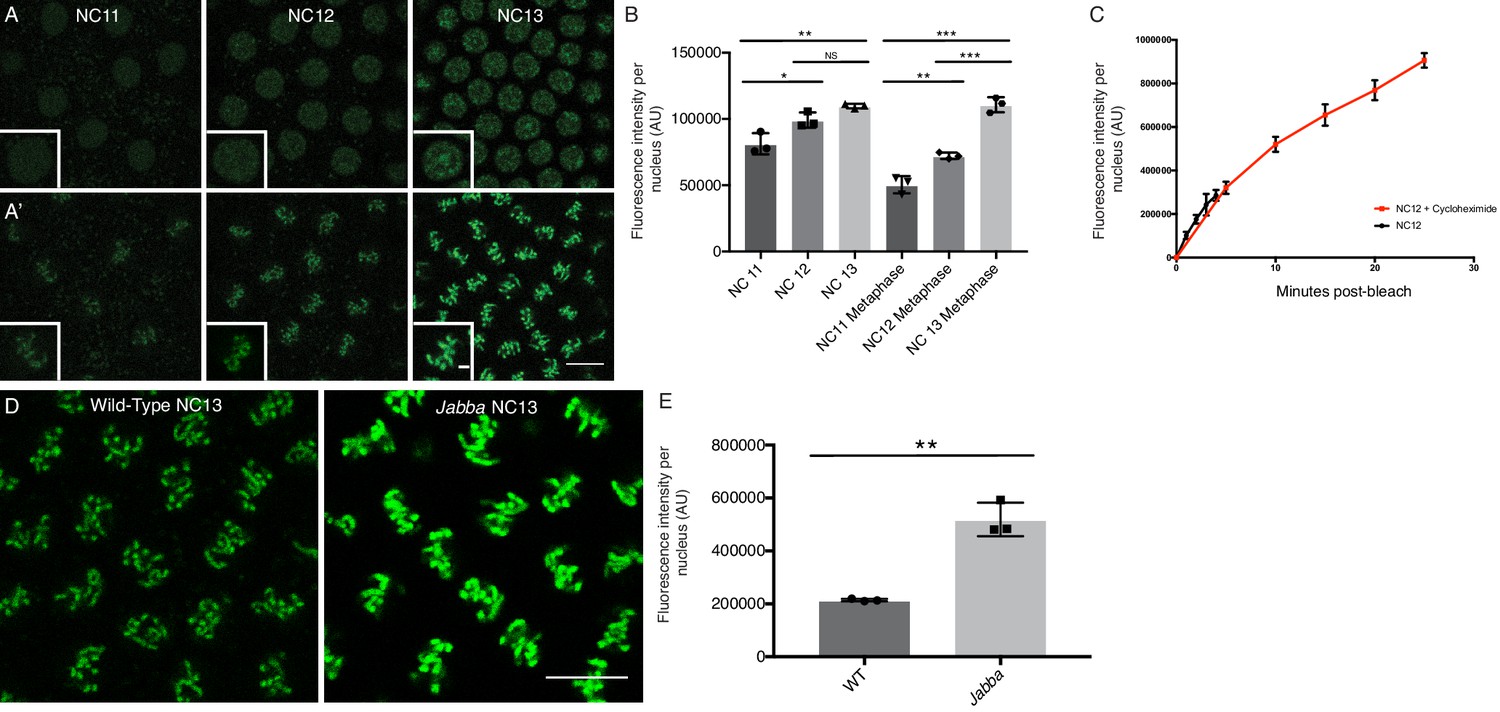
Nuclear H2Av is chromosome associated and scales with interphase length.
(A) NC11-NC13 embryos expressing H2Av-GFP in interphase (A) or metaphase (A’). Scale bars represent 10 and 2 μm (inlay). (B) Quantitation of total nuclear H2Av-GFP fluorescent signal per nucleus in interphase and metaphase of NC11-NC13 embryos. Five nuclei were averaged per embryo, N = 3 embryos. NC11 vs NC12, p=0.0254; NC11 vs. NC13, p=0.0048; NC12 vs NC13, p=0.1214, NC11 metaphase vs. NC12 metaphase, p=0.0060; NC11 metaphase vs. NC13 metaphase, p=0.0001; NC12 metaphase vs. NC13 metaphase, p=0.0007. All p values were calculated using a two-way ANOVA followed by Tukey’s test. (C) Quantitation of FRAP experiments performed as described in Figure 6A on NC12 embryos injected with cycloheximide (red) or not (black). Nuclear levels continue to rise throughout a prolonged interphase. Five nuclei were averaged per embryo, N = 3 embryos. (D) Relative H2Av-GFP signal on metaphase chromosomes in NC13 wild-type and Jabba embryos. Scale bar represents 10 μm. (E) Quantitation of total signal within an equally sized ROI encompassing individual metaphase chromosomes. Five nuclei were averaged per embryo, N = 3 embryos. WT vs. Jabba, p=0.0011. All p values were calculated using an unpaired student t-test. All error bars represent SD.
Figure 8
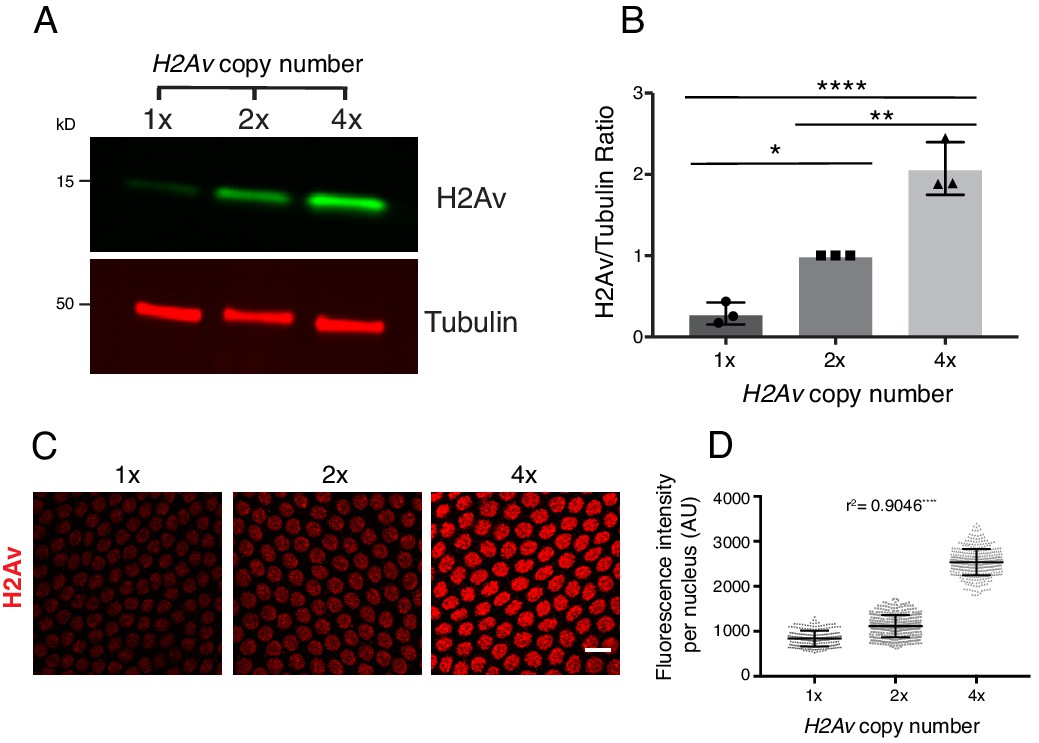
Total and nuclear H2Av levels are determined by H2Av gene dosage.
(A) Global H2Av protein levels scale with H2Av gene dosage. Total protein from equal numbers of NC14 embryos laid by mothers with either 1, 2, or 4 copies of the H2Av gene were separated by SDS PAGE and transferred to membranes. Membranes were probed for H2Av (green) and for tubulin (red), as a loading control. (B) Quantitation of (A) expressed as the H2Av/tubulin ratio. N = 3. 1x vs. 2x, p=0.0120; 2x vs. 4x, p=0.0016; 1x vs. 4x, p<0.0001. All p values were calculated using one-way ANOVA followed by Tukey’s test. (C) Anti-H2Av immunostaining of NC13 embryos shows that nuclear H2Av levels scale with H2Av gene dosage. (D) Quantitation of (C) showing total fluorescence intensity within individual nuclei (grey dots) in embryos of varying H2Av gene dosage. To test for a relationship between nuclear H2Av levels and H2Av gene dosage, a one-way ANOVA was performed followed by a test for linear trend in Prism (GraphPad). Nuclei within a single embryo were averaged, three embryos were analyzed per replicate, N = 3. r2 = 0.9046. p<0.0001. All error bars represent SD.
Figure 9 with 1 supplement
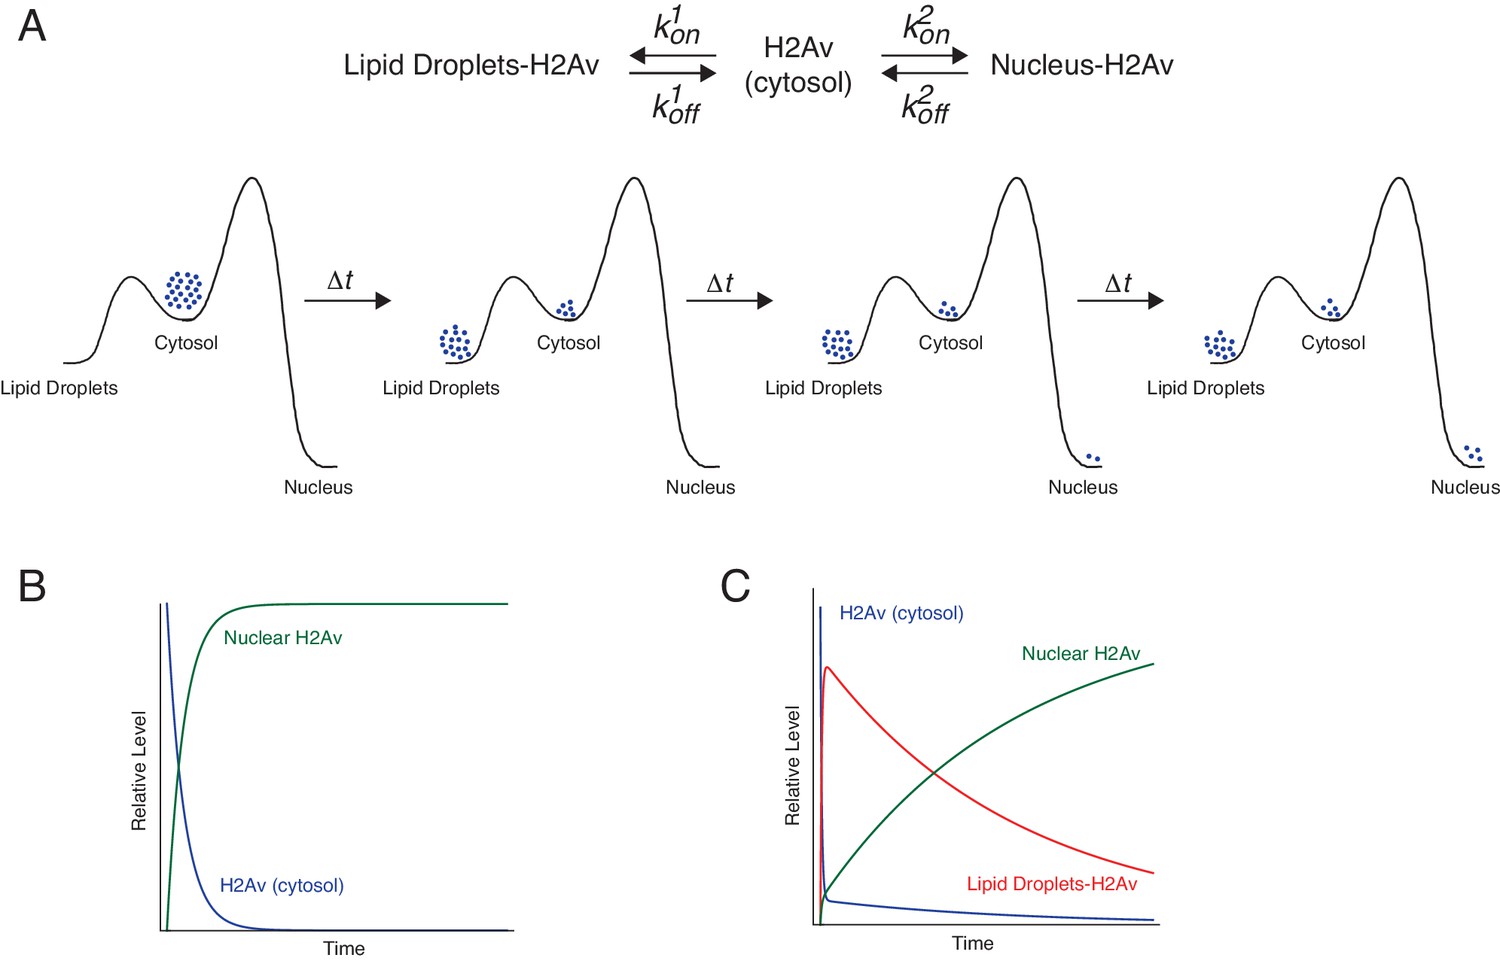
Proposed kinetic model for LD-mediated H2Av buffering.
(A) Proposed kinetic model for the buffering effects of LDs on nuclear incorporation of H2Av. (Top) H2Av free in the cytosol binds LDs with on rate k1on and off rate k1off and binds to DNA with on rate k2on and off rate k2off. (Bottom) With k1on >k2on, a rapid pre-equilibration of H2Av between the cytoplasm and LDs is established (Left). Over time, however, nuclear H2Av gradually accumulates as its relative energy is lower than H2Av bound to LDs (Right). (B) Model showing how free H2Av (Blue) and DNA-bound H2Av (Green) levels change over time in the absence of LDs. (C) Model with same parameters as (B) showing changes in free H2Av (Blue), DNA-bound H2Av (Green), and LD-bound H2Av (Red) in the presence of LDs. With LDs, nuclear accumulation of H2Av is dramatically slowed (green line in B vs. C). For full derivation of model, see Appendix 1. See also Figure 9—figure supplement 1.
Figure 9—figure supplement 1
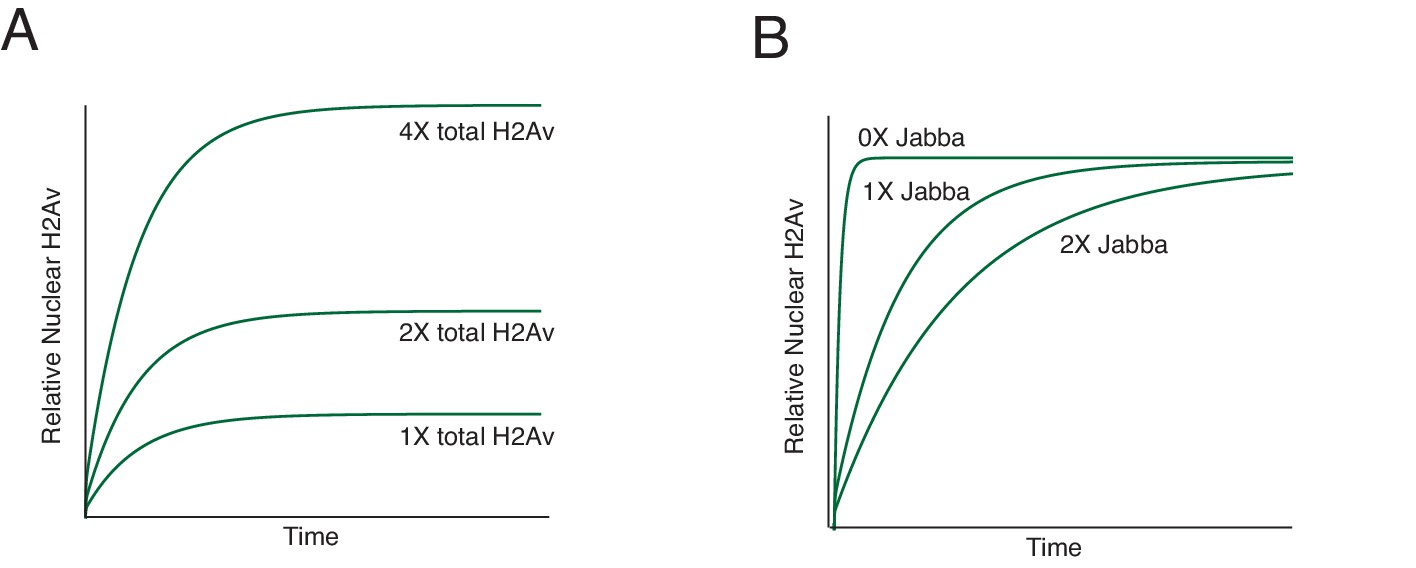
Effects of H2Av levels and Jabba dosage on nuclear H2Av accumulation as predicted by the model in Figure 9.
(A) As total H2Av levels increase, the relative levels of DNA-bound H2Av increase proportionally at all time points. (B) As levels of H2Av-binding sites on LDs increase (i.e. with increased Jabba dosage), formation of DNA-bound H2Av slows down, although the final nuclear level remains constant. See also Appendix 1 for derivations.
Figure 10
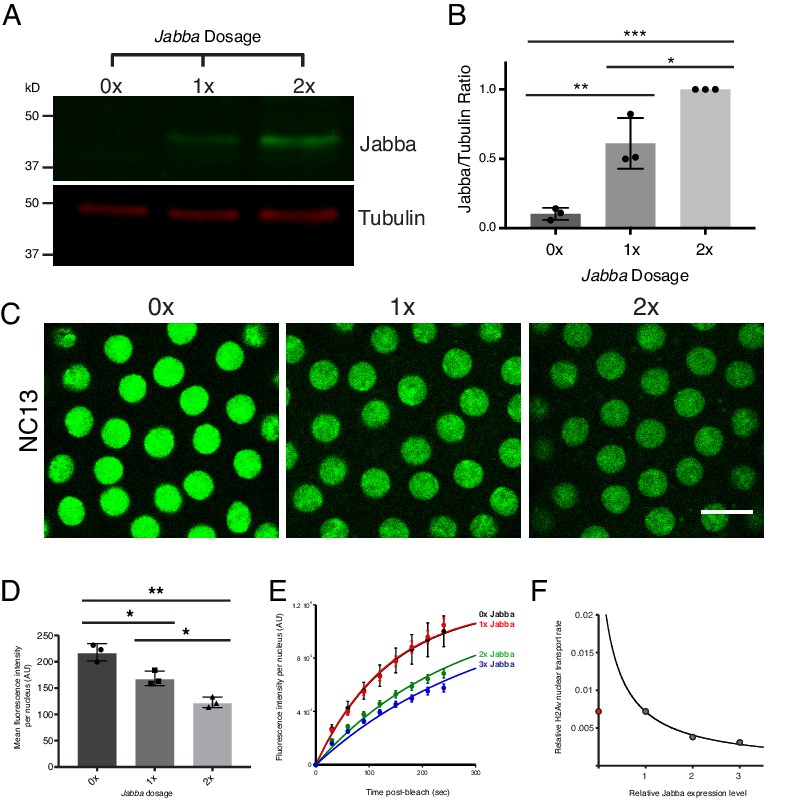
Reduction in buffering capacity increases nuclear H2Av.
(A) Jabba protein levels scale with Jabba gene dosage. Total protein from equal numbers of NC14 embryos laid by mothers with either 0, 1, or 2 copies of the Jabba gene were separated by SDS PAGE and transferred to membranes. Membranes were probed for Jabba (green) and tubulin (red). (B) Quantitation of (A) expressed as the Jabba/tubulin ratio. N = 3. 0x vs. 1x, p=0.0030; 1x vs. 2x, p=0.0110; 0x vs. 2x, p=0.0001. All p values were calculated using one-way ANOVA followed by Tukey’s test. (C) Nuclear H2Av levels inversely scale with Jabba dosage. Equally timed NC13 embryos expressing H2Av-GFP and varying copies of Jabba. Scale bar represents 10 μm. (D) Quantitation of total fluorescence within individual nuclei in NC13 embryos of varying Jabba dosage. Five nuclei were averaged per embryo. N = 3 embryos. 0x vs. 1x, p=0.0200; 1x vs. 2x, p=0.0264; 0x vs. 2x, p=0.0018. All p values were calculated using two-way ANOVA followed by Tukey’s test. All error bars represent SD. (E) FRAP experiments show higher rates of H2Av-GFP nuclear recovery with reduced Jabba dosage. FRAP was performed near the surface of NC13 embryos expressing H2Av-GFP and nuclear recovery was monitored over time. Colors represent different Jabba dosages. Data points were fit to an exponential curve. (F) Rate constants derived from (E) plotted as a function of relative Jabba expression levels. The curve is calculated for the predicted relationship between rate constants and fitted for 1x, 2x, and 3x Jabba dosage (grey data points). 0x Jabba is plotted in red and omitted from curve (see main text).
Figure 11 with 3 supplements

H2Av buffering by LDs is developmentally regulated.
(A) FRAP experiments show reduced nuclear import of H2Av in NC14 compared to NC13. FRAP was performed near the surface of NC13 and NC14 embryos expressing H2Av-GFP, and nuclear recovery was monitored over time. Scale bar represents 10 μm. (B) Quantitation of (A). Total fluorescence intensity per nucleus ~5 min post-bleaching was measured. Ten nuclei were averaged per embryo. N = 3 embryos. NC13 vs. NC14, p=0.0031. The p value was calculated using an unpaired student t-test. See also Figure 11—figure supplement 1. (C) In situ hybridization shows decreased H2Av mRNA levels at NC14. Representative images of embryos probed with anti-sense H2Av mRNA (purple). As a control, embryos were also probed with sense H2Av mRNA (far right). (D) H2Av-Dendra2 loss from LDs is dramatically reduced in mid-NC14 embryos. Photoswitching was induced in mid-NC14 embryos as in Figure 3B and fluorescent signal within the photoswitched region was monitored over time (see also Figure 11—figure supplement 2). (E) Representation of data from (D) and Figure 3C showing the percentage of fluorescence signal remaining within the photoswitched region over time in the indicated stages/genotypes. N = 5 embryos per stage. (F) Data from (E) plotted as total percentage of fluorescent signal lost from the photoswitched region ~3 min post-photoswitching across early development. AEF = After Egg Fertilization. (G) Transition in H2Av buffering is determined by the nuclear:cytoplasmic (N:C) ratio. Photoswitching experiments were performed in haploid embryos. Quantitation of the percent fluorescence in the photoswitched region reveals that the transition in H2Av buffering is delayed until mid-NC15 in haploid embryos. N = 3 embryos per stage. All error bars represent SD. See also Figure 11—figure supplement 3.
Figure 11—figure supplement 1
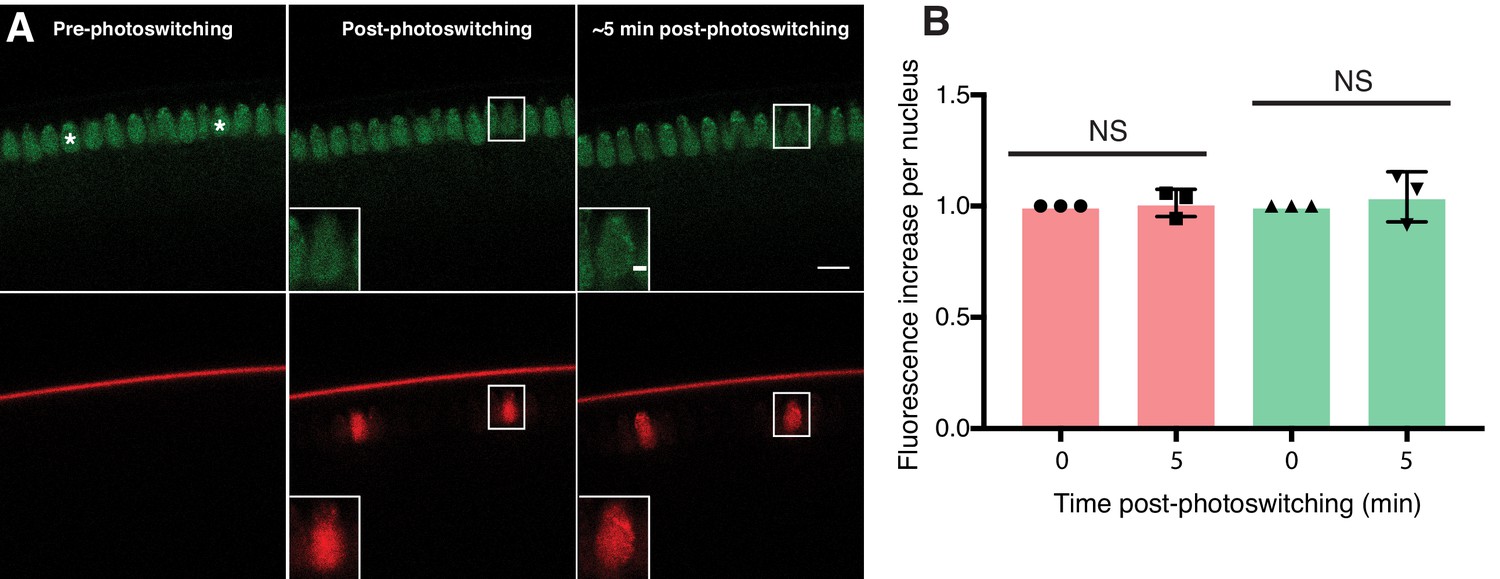
Nuclear export of H2Av is minimal in NC14.
(A) Photoswitching was induced in single nuclei (white asterisks) in mid-stage NC14 embryos and signal within nuclei was monitored over time. After 5 min, no significant loss of H2Av-Dendra2 signal is evident, consistent with findings in NC13. Scale bars represent 10 and 2 μm (inlay) (B) Quantitation of fluorescent signal within individual nuclei immediately post-photoswitching or ~5 min post-photoswitching. Two nuclei were averaged per embryo, N = 3 embryos. For T = 0 vs. T = 5 in the red channel, p=0.7085. For T = 0 vs. T = 5 in the green channel, p=0.5573. All p values were calculated using an unpaired student t-test. Error bars represent SD.
Figure 11—figure supplement 2
H2Av-Dendra2 loss from LDs is reduced in mid-NC14.
In mid-NC14, loss of H2Av-Dendra2 signal from LDs is drastically reduced. Experiment/images are the same as in Figure 11D but pixels have been inverted and brightness increased linearly across the whole image for better visualization. Scale bar represents 50 μm.
Figure 11—figure supplement 3
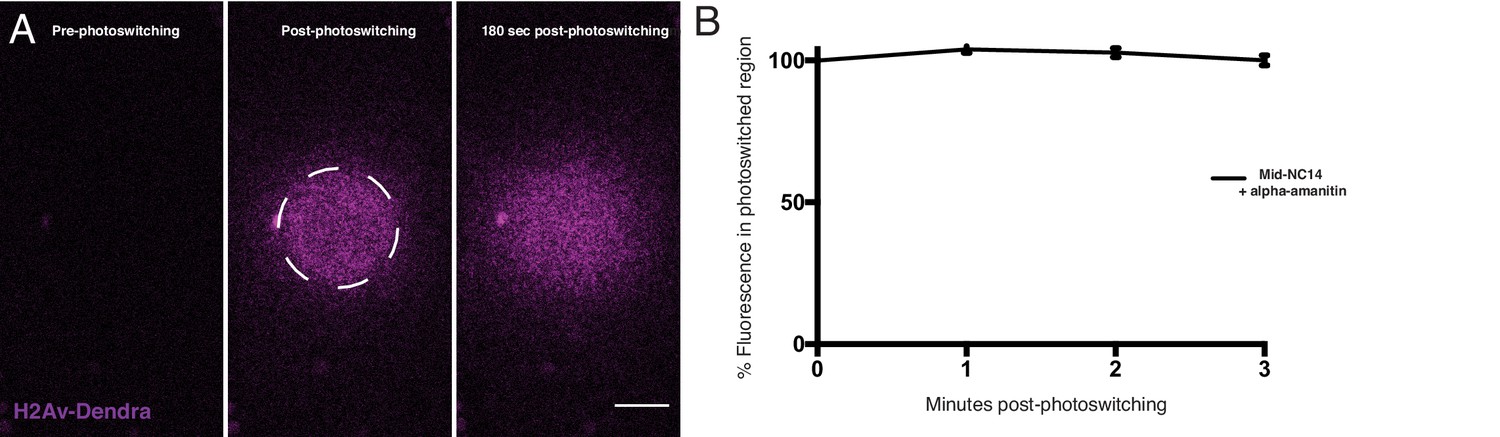
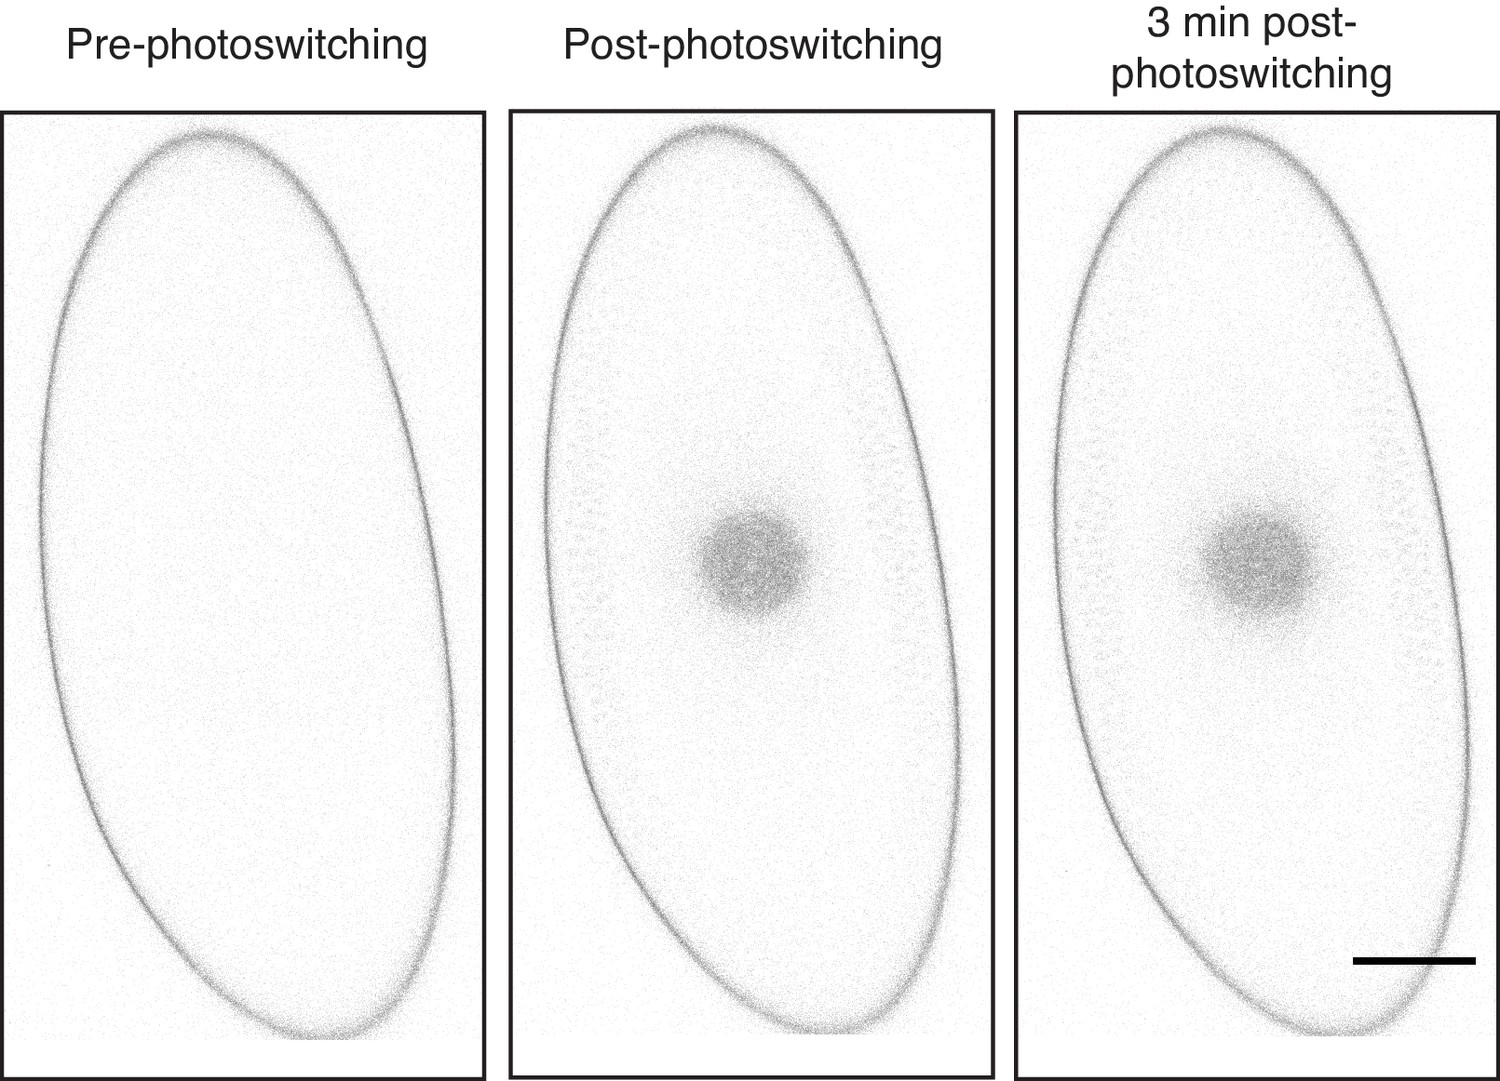
Zygotic transcription is not required for transition in H2Av dynamics.
Embryos laid by H2Av-Dendra2 expressing mothers were injected with α-amanitin and photoswitching was induced. (A) Images from a photoswitching experiment in a mid-NC14 embryo that had been injected with α-amanitin. Scale bar represents 20 μm (B) Quantitation of experiments in (A) showing percent fluorescence remaining within the photoswitched region post-photoswitching. Error bars represent SD.
Videos
Video 1
LDs show little movement and minimal LD-LD contact during cleavage stages.
Video shows a composite of two sequences from the same embryo. Images were taken every 15 s. Playback speed is 7 frames/s. Left: video showing a FRAP experiment in embryos expressing the LD marker LSD2-YFP. Scale bar represents 20 μm. Top right video highlights a region of the embryo away from the bleached region. Although little motion is observed in these early stages, LDs move actively along microtubules from NC10 onwards (Welte, 2015). Even then, however, motion is perpendicular to the plane of focus shown here and thus would not account for lateral spread or exchange within the plane.
Tables
Key resources table
| Reagent type | Designation | Source or reference | Identifiers | Additional information |
|---|---|---|---|---|
| Gene (D. melanogaster) | His2Av | NA | FBgn0001197 | |
| Gene (D. melanogaster) | Jabba | NA | FBgn0259682 | |
| Gene (D. melanogaster) | halo | NA | FBgn0001174 | |
| Gene (D. melanogaster) | LSD-2 | NA | FBgn0030608 | |
| Genetic reagent (D. melanogaster) | H2Av810 | Bloomington Drosophila Stock Center | BDSC:9264; FLYB: FBst0009264 | |
| Genetic reagent (D. melanogaster) | H2Av-GFP | Bloomington Drosophila Stock Center | BDSC:24163; FLYB: FBst0024163 | |
| Genetic reagent (D. melanogaster) | H2Av-mRFP | Bloomington Drosophila Stock Center | BDSC:23650; FLYB: FBst0023650 | |
| Genetic reagent (D. melanogaster) | ms(3)K81 | Bloomington Drosophila Stock Center | BDSC:53252; FLYB: FBst0005352 | |
| Genetic reagent (D. melanogaster) | H2Av-paGFP | other | FLYB: FBtp0020089 | Described in (Post et al., 2005) |
| Genetic reagent (D. melanogaster) | LSD2-YFP | Kyoto Stock Center | DGRC:115301; FLYB: FBti0143786 | |
| Genetic reagent (D. melanogaster) | JabbaDL, Jabbazl01 | other | FLYB: FBal0280317; FBal0280318 | Previously generated Jabba null alleles. Described in (Li et al., 2012). |
| Genetic reagent (D. melanogaster) | Df(2L)ΔhaloAJ | other | FLYB: FBab0047638 | Small deletion encompassing the halo gene. Described in (Arora et al., 2016). |
| Genetic reagent (D. melanogaster) | H2Av-Dendra2 | this paper | genomic H2Av region (~4 kb), Dendra2 inserted downstream of exon 4, cloned into pattB, genomic insertion site 68A4 | |
| Genetic reagent (D. melanogaster) | gH2Av | this paper | genomic H2Av region (~4 kb), cloned into pattB, genomic insertion site 68A4 | |
| genetic reagent (D. melanogaster) | gJabba | this paper | genomic Jabba region (~5.3 kb). Insertion site 68A4 | |
| Antibody | anti-H2AvD (rabbit polyclonal) | Active Motif | Cat. No. 39715 | (1:1000 immunostain) (1:2500 WB) |
| Antibody | anti-Jabba (rabbit polyclonal) | this paper | raised against in-vitro synthesized peptide encoded in exon 5 of Jabba followed by affinity purification | |
| Antibody | anti-alpha tubulin (mouse monoclonal) | Cell Signaling | Cat. No. #3873 | (1:10,000) |
| Antibody | IRDye secondaries 800CW or 680RD | Li-COR | (1:10,000) | |
| Antibody | Alexa 594 secondary | ThermoFisher | Cat. No. A-11012 | (1:1000) |
| Commercial kit | mMESSAGE mMACHINE T7 | Ambion Inc. | Cat. No. AM1344 (Fisherscientific) | |
| Drug | α-amanitin | Sigma | Cat. No. A2263 | (500 µg/mL) |
| Drug | cycloheximide | Sigma | Cat. No. C7698 | (1 mg/mL) |
Additional files
-
Transparent reporting form
- https://doi.org/10.7554/eLife.36021.021
Download links
A two-part list of links to download the article, or parts of the article, in various formats.
Downloads (link to download the article as PDF)
Open citations (links to open the citations from this article in various online reference manager services)
Cite this article (links to download the citations from this article in formats compatible with various reference manager tools)
Developmentally regulated H2Av buffering via dynamic sequestration to lipid droplets in Drosophila embryos
eLife 7:e36021.
https://doi.org/10.7554/eLife.36021


