A positive-feedback-based mechanism for constriction rate acceleration during cytokinesis in Caenorhabditis elegans
- University of California, San Diego, United States
Figures
Figure 1 with 3 supplements
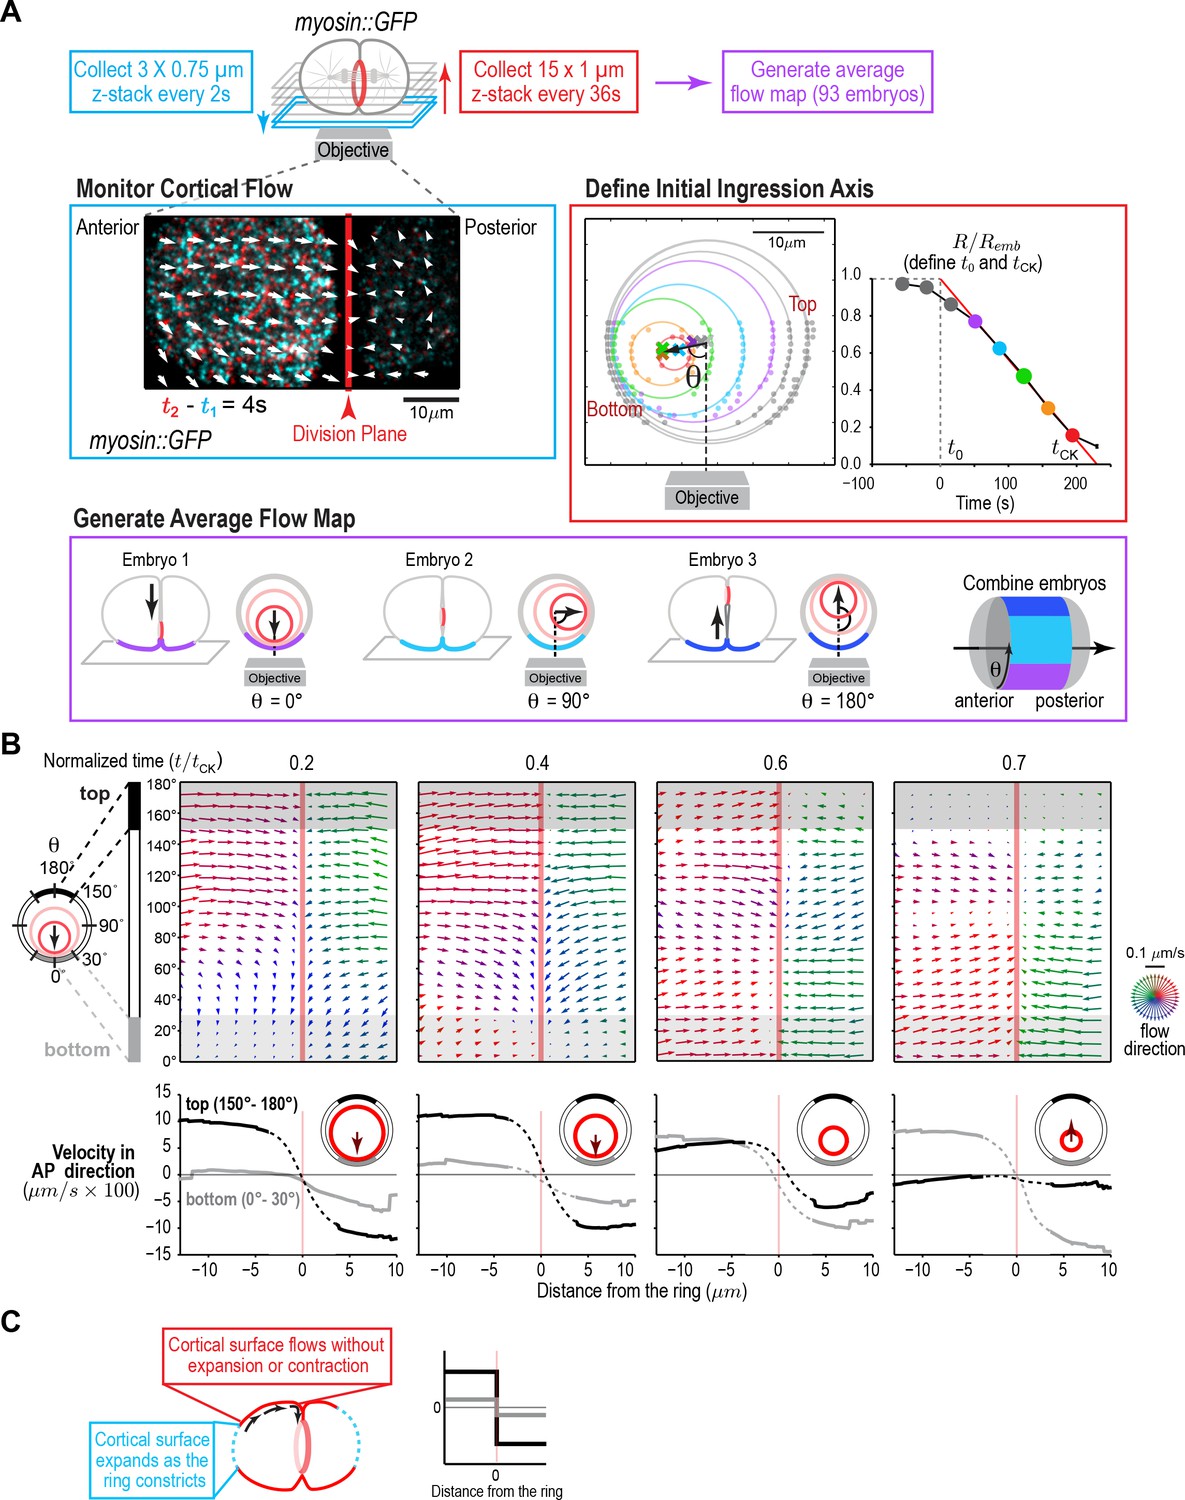
A quantitative map of cortical surface dynamics during the first cytokinesis in the C. elegans embryo reveals that the cortical surface at the cell poles expands as the ring constricts.
(A) (top) Schematic of the experimental procedure. (middle, left) Superposition of images of the cortex acquired 4 s apart. Arrows indicate cortical flow (magnified 2.5X). (middle, right) The initial ingression axis, t0, and tCK were defined as shown for a representative embryo. The angle θ specifies the position of the imaged cortex relative to the initial furrow ingression axis. Image and quantification are representative of the 93 imaged embryos. (bottom) Angular position was used to combine data from 93 embryos to generate an average flow map. (B) (top) Average flow at the indicated timepoints. Arrows show direction and magnitude of the displacement in 1 s (magnified 20X). (middle) Graphs are average velocity in the A-P direction versus position along the A-P axis for the cortex on the top (black) and bottom (grey) of the embryo (shaded in flow maps). Surface movement changes direction across the division plane, the apparent velocity gradient close to the division plane is a projection artifact due to the fact that the cortical surface turns inwards as it approaches the furrow from either side (dotted regions on velocity curves). (C) Schematics show the predicted cortical velocity profile along the AP axis if surface is gained at the poles; velocity would be constant in magnitude within the flow map region with opposite directions on the two sides of the ring, as is experimentally observed.
Figure 1—figure supplement 1

Actin and myosin move together with the cortical surface during cytokinesis.
(A) Schematic of the single-copy nmy-2::gfp transgene inserted into a specific locus on chromosome II. Cb unc-119, the unc-119 coding region from the related nematode C. briggsae, was used as a transformation marker. The transgene was re-encoded while maintaining amino acid sequence in the indicated region to render it resistant to RNAi targeting the endogenous gene for other experiments, this feature was not used in the experiments in this manuscript. (B) Compression biases the direction of contractile ring closure. Graph plotting the probability that the angle between the objective axis and the initial ingression axis falls in the indicated range for embryos mounted with more (red) or less (grey) compression. Due to this bias, embryos were mounted using the low compression conditions shown in grey. (C) Actin and myosin move together with the cortical surface during cytokinesis. The white line in the center of the image (top) indicates the region used for the kymograph (bottom). Image is representative of five imaged embryos. Scale bar is 10 µm.
Figure 1—figure supplement 2
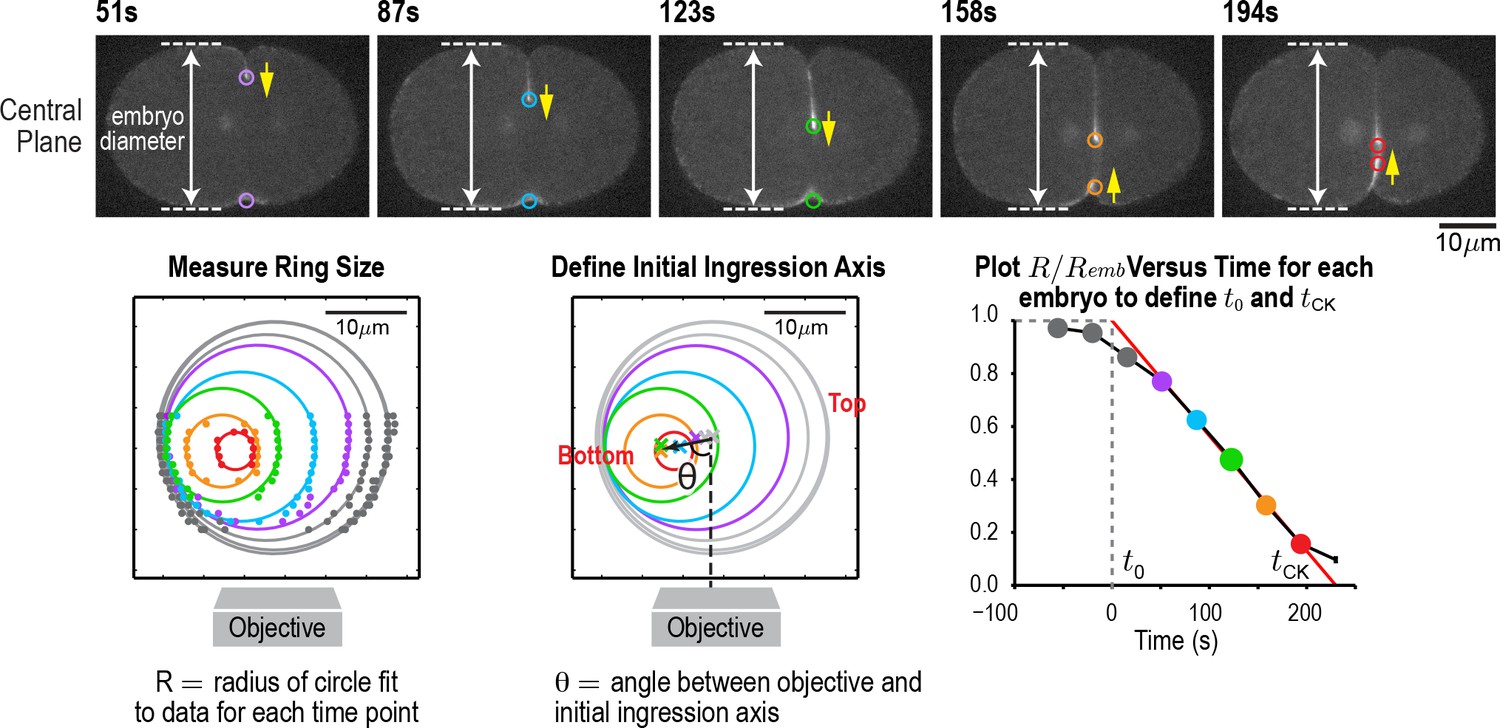
An automated method for monitoring contractile ring closure.
(top) Central plane images of the embryo in Figure 1A. Panels on the lower left and lower right are reproduced from Figure 1A for comparison. An automated algorithm was used to identify the edges of the embryo (dashed lines) and the position of the contractile ring (colored circles) in each z-plane. Yellow arrows mark the direction of furrow ingression and illustrate how the furrow initially ingresses from the top and then changes directions to ingress from the bottom during the second half of cytokinesis. (lower left) Points marking contractile ring position in the z-planes were projected onto an end-on view of the division plane. Data for different timepoints in this representative embryo are shown in colors corresponding to the circles in the central plane images. Ring sizes were measured by fitting circles to the data. (middle) The initial axis of contractile ring closure was defined by the angle θ between the objective axis and a line fit through the centers of the contractile rings with a normalized size >0.3. (right) = A plot of normalized ring size versus time for this embryo defines t0 and tCK as the times when a line fit through the points corresponding to ring sizes between 0.3 and 0.8 crossed 1 and 0, respectively. Scale bar is 10 µm.
Figure 1—figure supplement 3
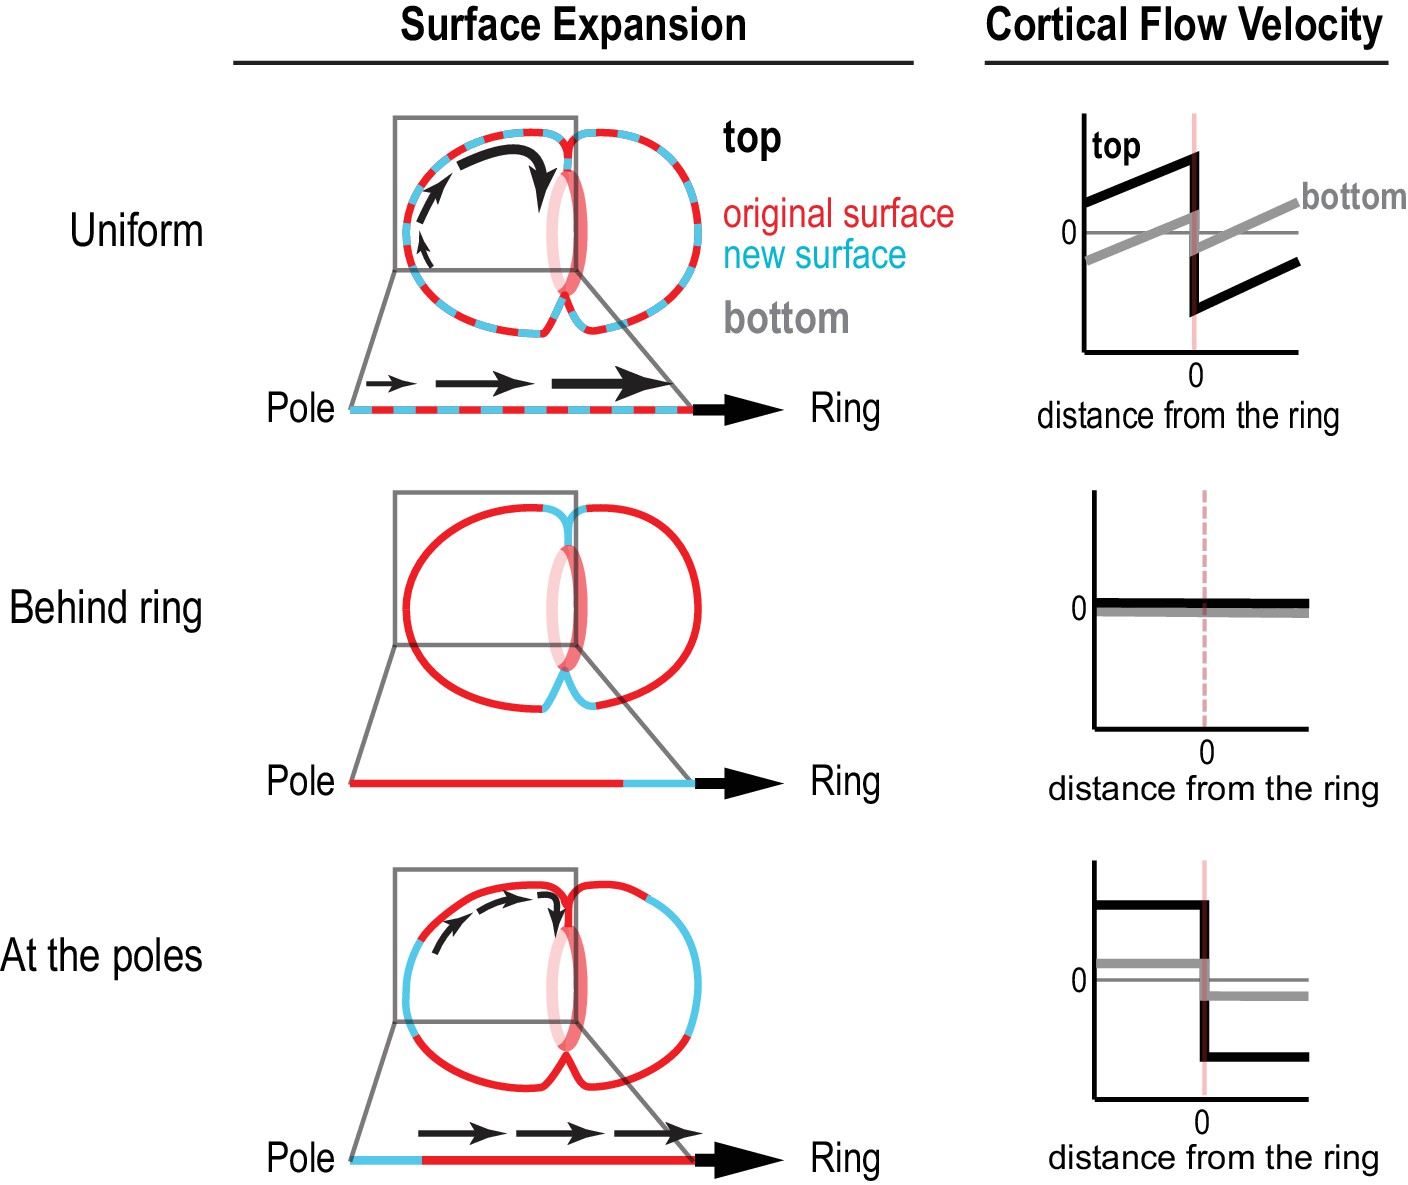
Different profiles of cortical surface velocity along the A-P axis are predicted for different spatial patterns of surface expansion.
(top) For surface expansion behind the ring, no cortical movement is predicted on the embryo surface. (middle) For uniform surface expansion, a gradient of velocities will be observed, where the cortex immediately behind the ring moves at the speed of the ingressing furrow, and cortical velocity decreases linearly towards the cell poles. (bottom) Reproduced from Figure 1C for comparison. If surface is expansion occurs only at the poles, cortical velocity will be constant in magnitude within the flow map region with opposite direction on the two sides of the ring.
Figure 2 with 1 supplement
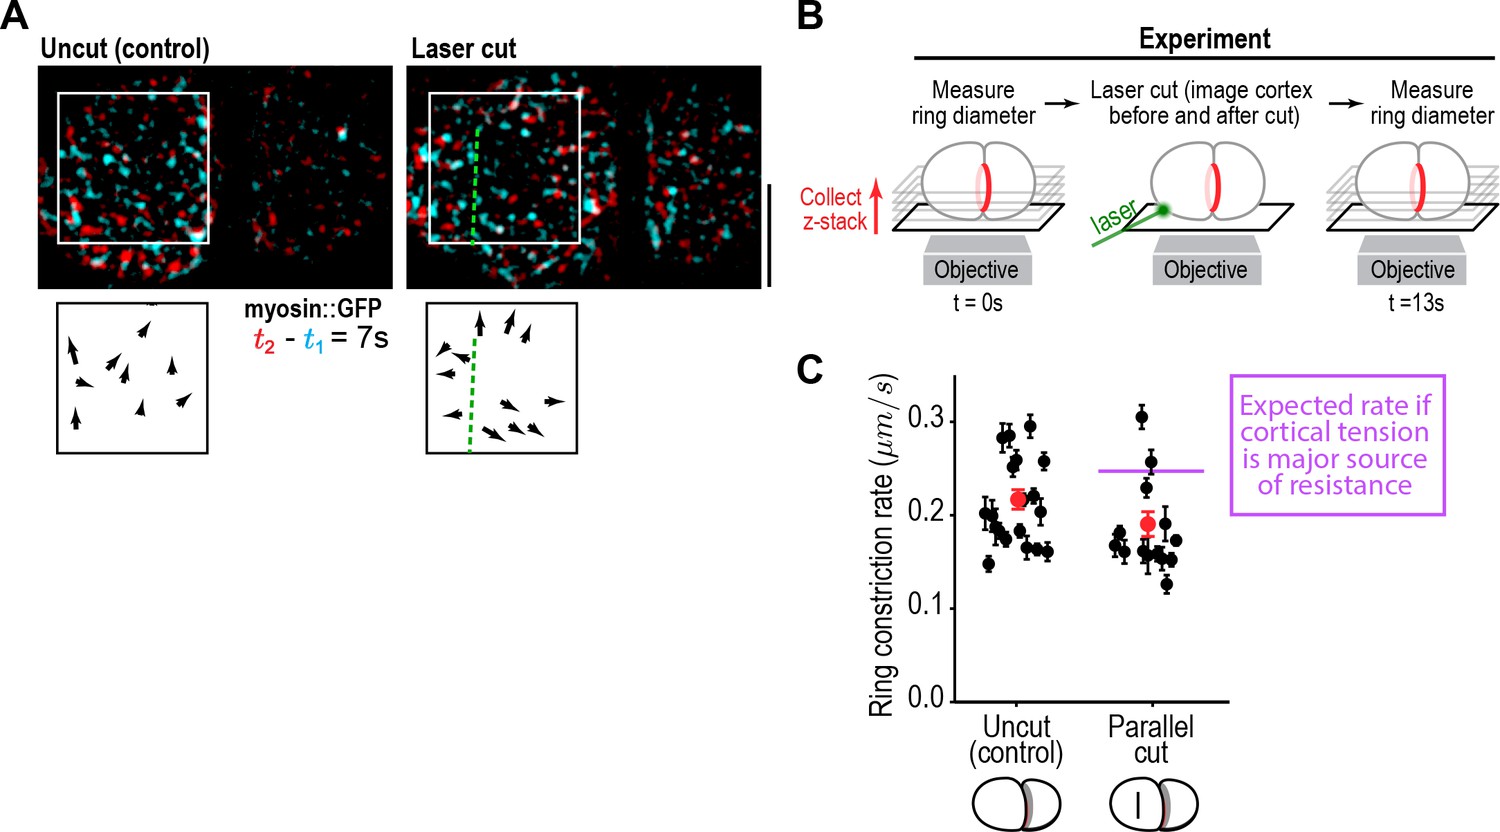
Cortical tension does not limit the rate of ring closure.
(A) The success of cortical cuts was assessed by comparing surface images of cortical myosin before (cyan) and after (red) the cut to monitor the movement of myosin foci away from the cut site. Representative images are shown. Scale bar is 10 µm. (B) Schematic of laser ablation experiment to determine if cortical resistance limits the rate of contractile ring closure. Contractile ring sizes were measured from z-stacks acquired before and 13 s after a cut was made across the cortex with a laser. (C) Graph plots the rates of ring closure derived from before and after ring size measurements for uncut controls (n = 19 embryos) and embryos with cuts parallel to the division plane (n = 14 embryos). Black symbols are single embryo measurements with measurement errors. Red symbols are the means; error bars are the SEM. The purple line marks expected closure rate if cortical tension is a major source of resistance.
Figure 2—figure supplement 1
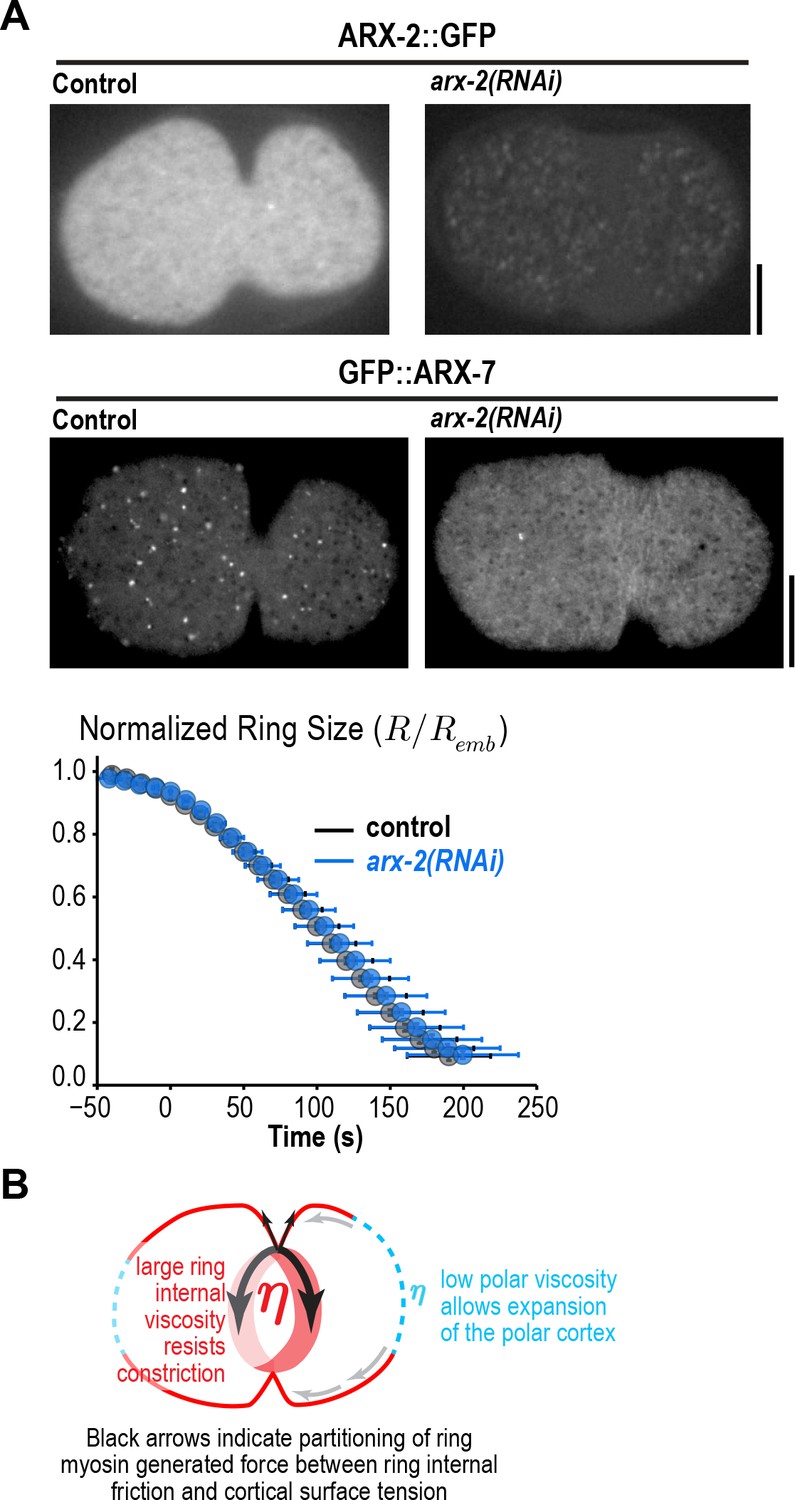
Arp2/3 depletion does not alter ring constriction kinetics.
(A) Images of cortical ARX-2::GFP (top) and GFP::ARX-7 (middle) in control and arx-2(RNAi) embryos confirm loss of cortical Arp2/3 complex (images are representative of 10 imaged embryos for each condition in the GFP::ARX-7 strain and 15 for control and 13 for arx-2(RNAi) in the ARX-2::GFP strain). Scale bars are 10 µm. (bottom) Graph plots average contractile ring size versus time for control (grey) and arx-2(RNAi) (blue) embryos expressing myosin::GFP (n = 93 embryos for control and 68 embryos for arx-2(RNAi)). Error bars are standard deviation. (B) Schematic illustrating the partitioning of ring myosin generated force between ring internal friction and cortical surface tension. Ring myosin generated force primarily counters ring internal friction to drive constriction. The low viscosity of the polar cortex causes it to expand when it comes under tension due to the constricting ring.
Figure 3 with 4 supplements
Ring myosin compresses cortical surface along the axis perpendicular to the ring, pulling in new cortical surface at a rate proportional to the amount of ring myosin.
(A) The equatorial cortex is compressed during contractile ring assembly. Following the onset of spindle-based RhoA signaling, the initial recruitment of contractile ring proteins leads to uniform compression of cortical surface along the axis perpendicular to the forming ring across a 10 µm wide region spanning the cell equator. (left) Average flow map at (t/tCK = −0.1) immediately after the onset of spindle-based signaling (n = 93 embryos). (middle) The surface velocity profile reveals a linear velocity gradient that spans the cell equator (−5 to +5 µm), indicating a uniform zone of cortical compression. (B) Cortical compression within the ring continues during constriction. (left graph) Plot comparing the area of the forming division plane (red) with the total cortical surface area that entered the division plane from the start of cytokinesis (purple; calculated as indicated in the schematic). (right graph) Plot comparing the rate of delivery of cortical surface into the division plane (purple) with the rate of growth of the division plane (red). The difference between the two is the rate of cortical surface compression (rate of reduction of cortical surface area; cyan). (C) The per-unit-length amount of ring myosin and the rate of cortical compression increase with the same exponential kinetics, suggesting that the rate of cortical compression may be controlled by the amount of myosin in the contractile ring/Rho zone. (top left) Representative images of the division plane in embryos expressing myosin::GFP reconstructed from 40-plane z-stacks. Gold circles mark the embryo boundary and dashed circles mark the boundaries used for ring intensity measurements. Scale bar is 10 µm. (top right) Graph plots per-unit-length myosin::GFP fluorescence for the indicated angular ranges (n = 36 embryos). (bottom left) Graph plots the rate of cortical surface compression per unit ring length (n = 93 embryos). (bottom middle) Graphs plot mean per-unit-length myosin::GFP (n = 36 embryos) and GFP::anillin (n = 26 embryos) fluorescence (n = 36 embryos) in the ring. (bottom right) Graph plots the per-unit-length rate of ring closure. Black lines are fitted single exponentials. Error bars are the SEM.
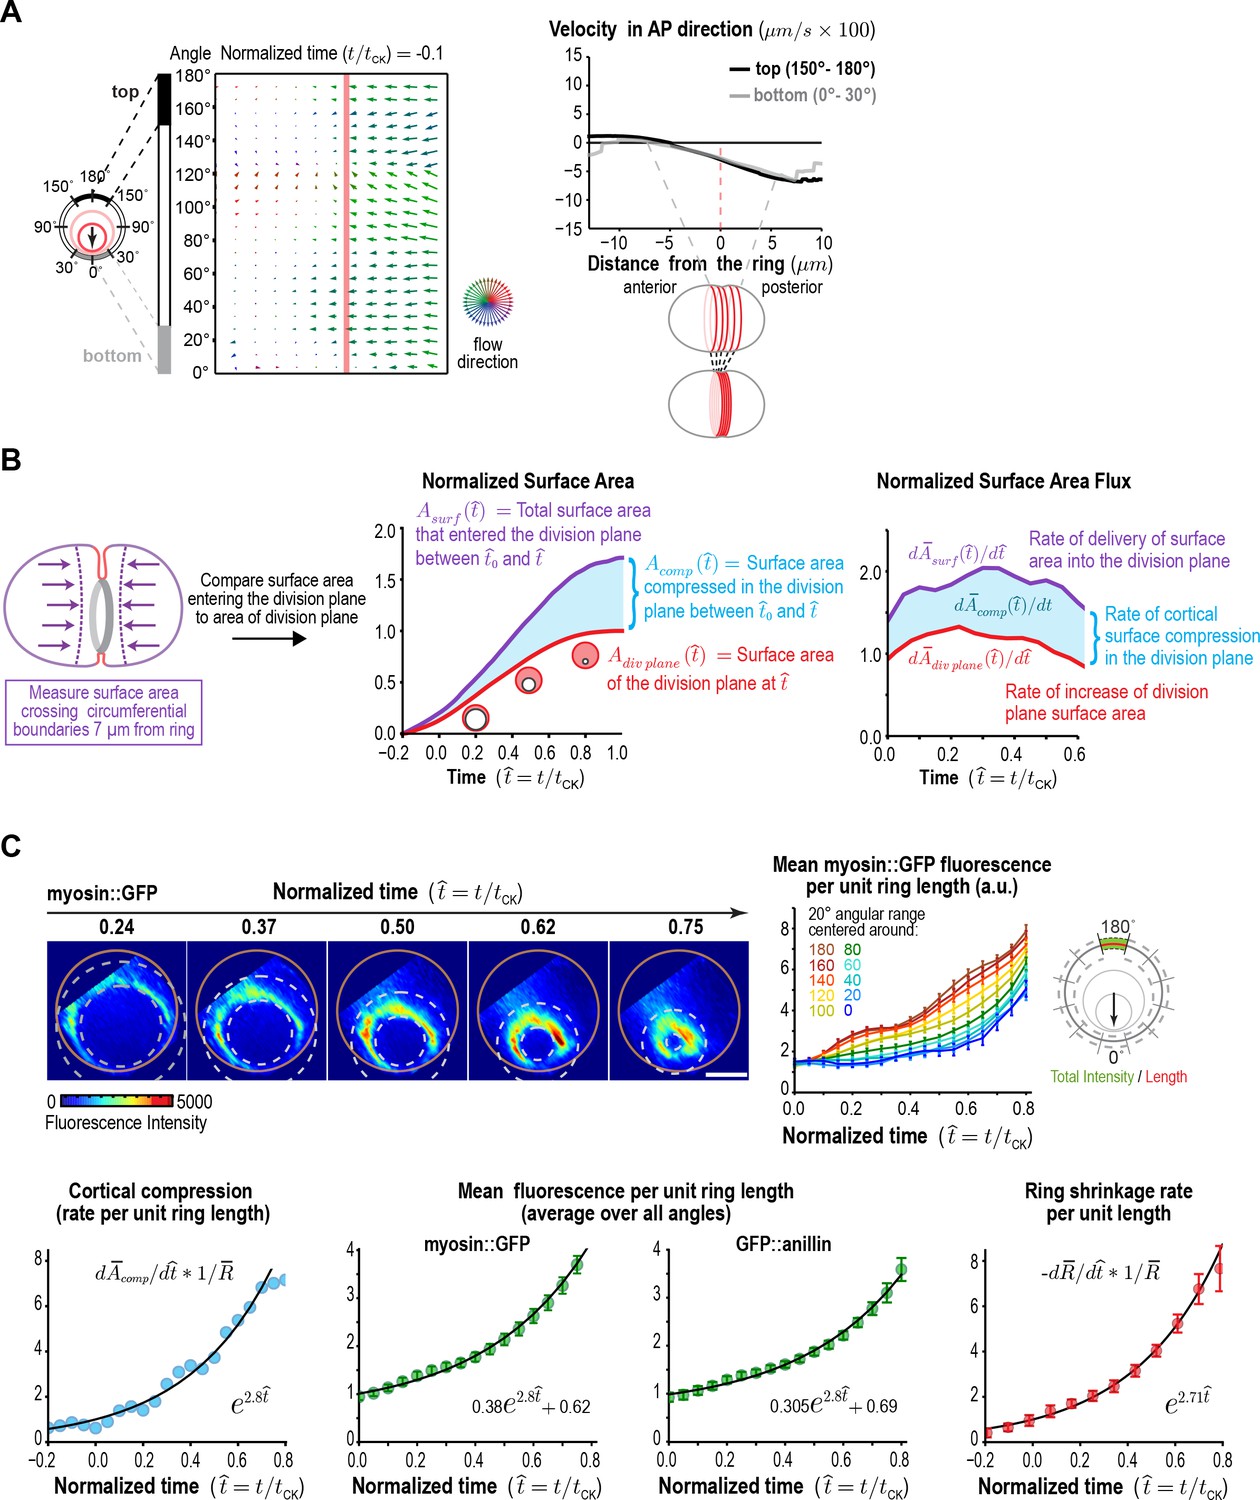
Figure 3—figure supplement 1
Arp2/3 inhibition abolishes the asymmetry in the amount of cortex entering the division plane from the anterior and posterior sides.
Graphs plot the rate of cortical flux across the anterior (light grey) and posterior (dark grey) boundaries (see schematic in Figure 3B) versus the mean for the two sides (purple) for control and arx-2(RNAi) embryos. Calculated from the average flow maps for the control (n = 93 embryos) and arx-2(RNAi) (n = 68 embryos) conditions.
Figure 3—figure supplement 2
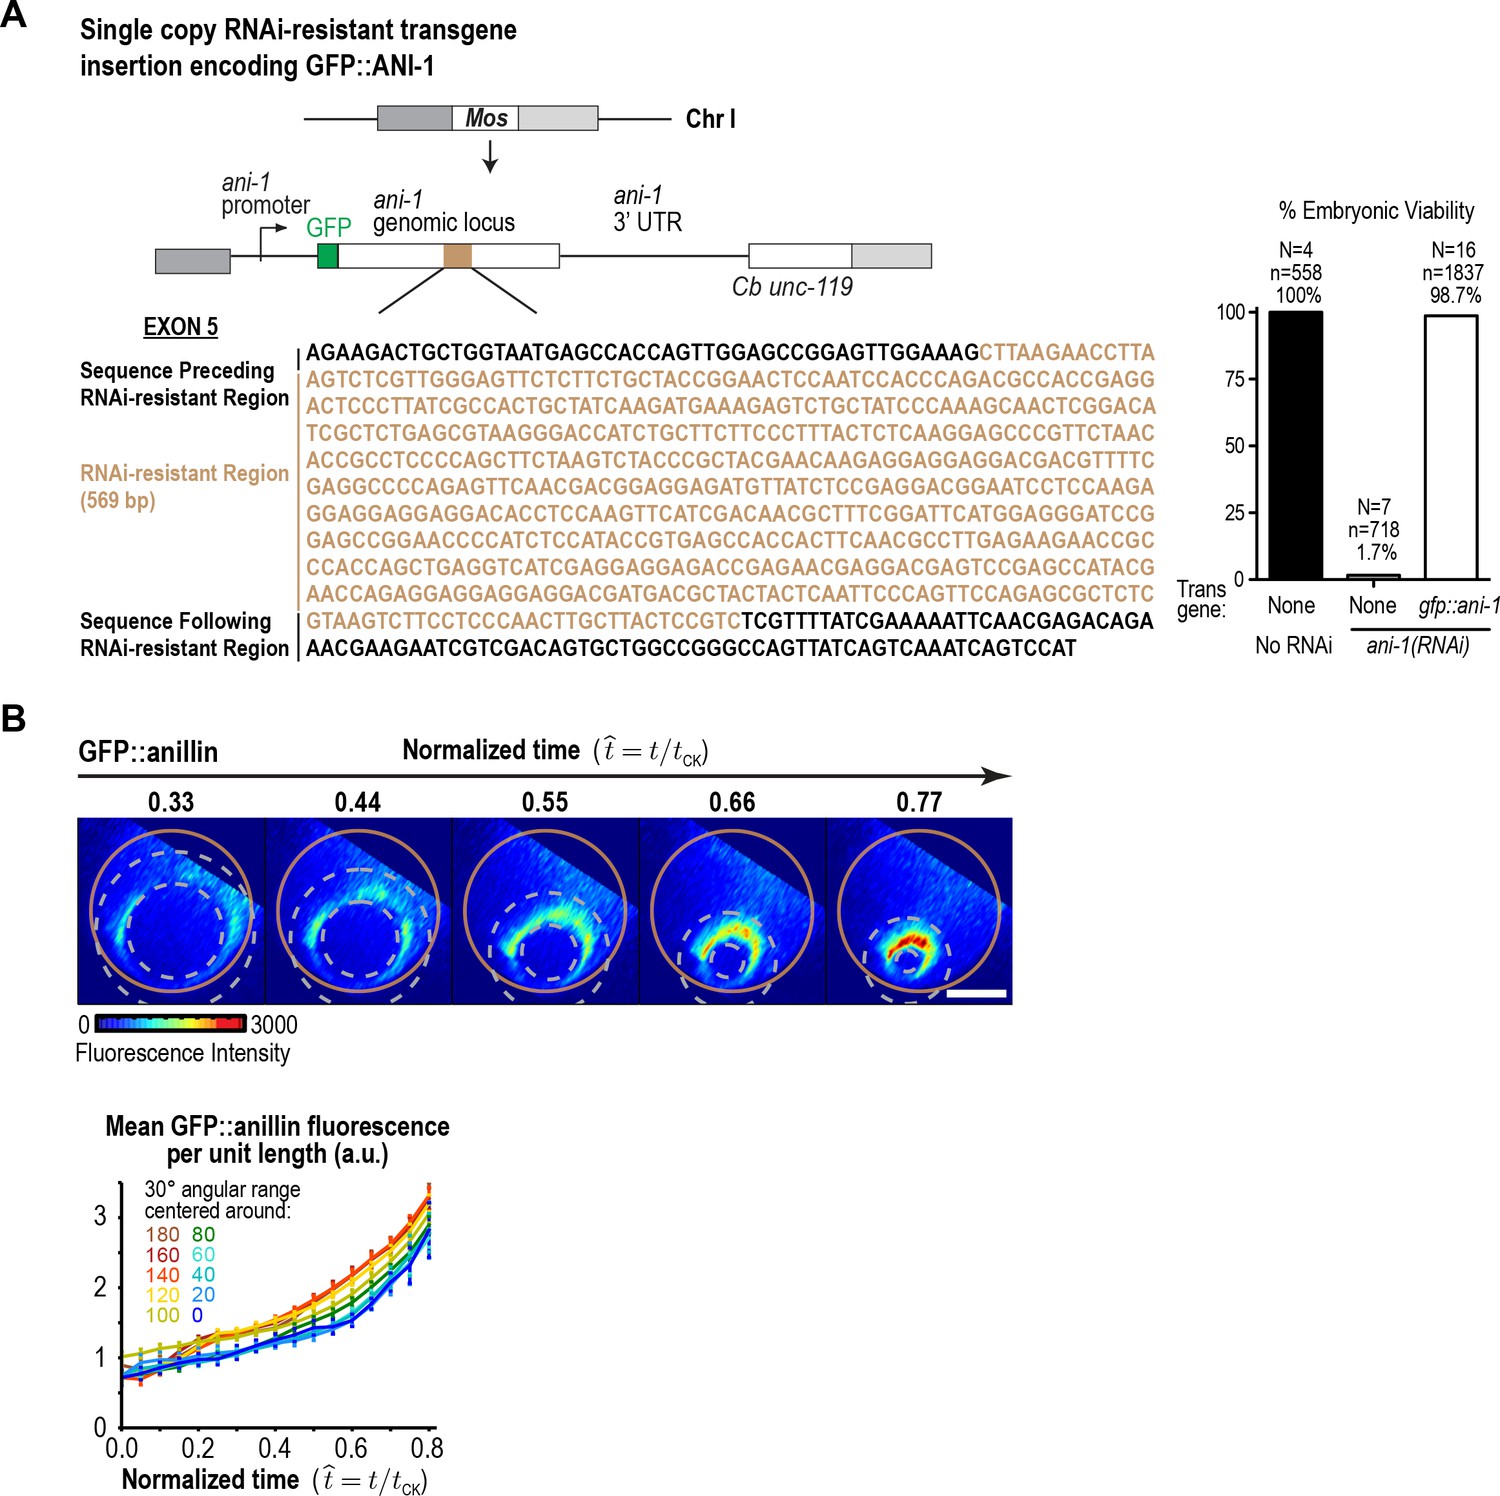
GFP::anillin fluorescence in the ring increases exponentially during constriction.
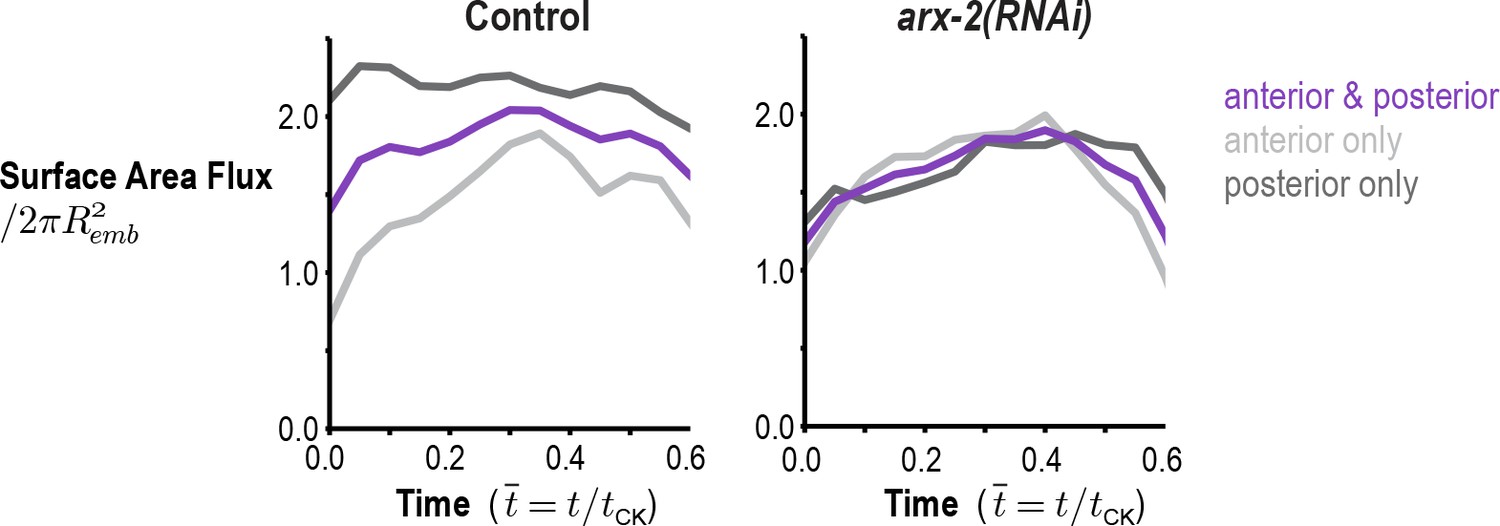
(A) (left) Schematic of the single-copy gfp::ani-1 trangene. The transgene was re-encoded while maintaining amino acid sequence in the indicated region to render it resistant to RNAi targeting of the endogenous ani-1 gene to allow testing of the functionality of the GFP::ANI-1 fusion. (right) Graph plotting embryonic lethality demonstrates that the gfp::ani-1 transgene is functional. (B) (top) Images of the division plane in an embryo expressing GFP::anillin. Scale bar is 10 µm. (bottom) Graph plots GFP::anillin fluorescence per unit length of the ring for the indicated angular ranges. Error bars are the SEM.
Figure 3—figure supplement 3
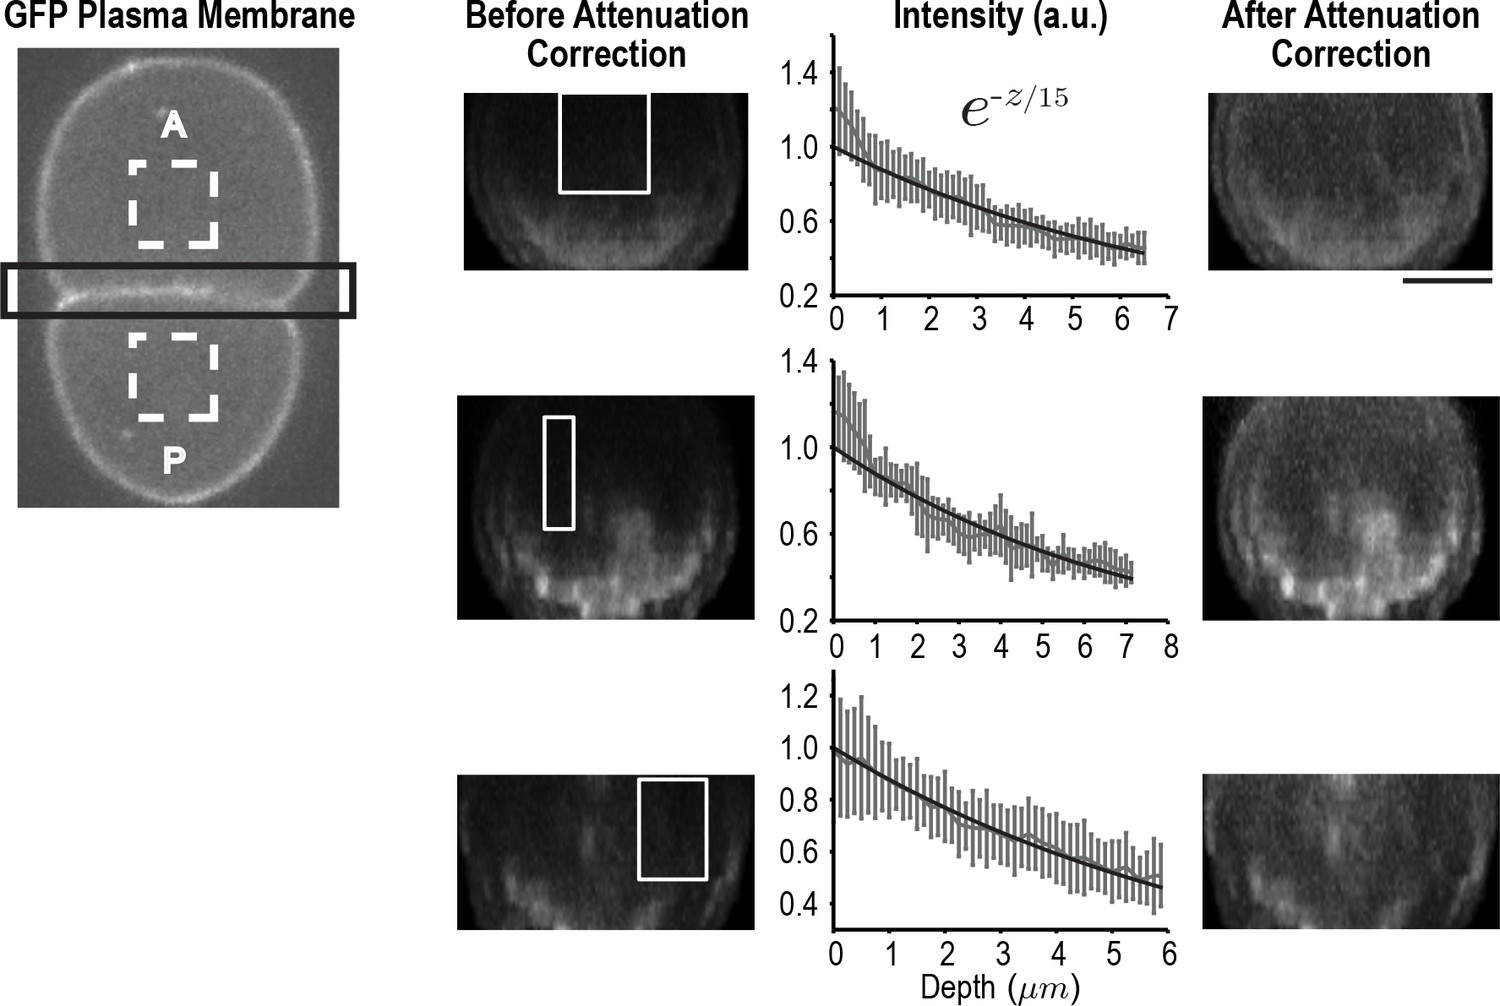
Correcting for signal attenuation with sample depth.
Fluorescence attenuation with embryo depth was estimated from fluorescence intensity measurements made at the cell-cell boundary of two-cell embryos expressing a GFP-tagged plasma membrane marker. Cell-cell boundaries were reconstructed from 40 plane z-stacks. The intensity profile at each slice was calculated by subtracting the average background intensity estimated from dashed rectangles (left) from the cell-cell boundary region (black rectangle) at each slice and calculating the maximum intensity projection along AP axis. The effect of depth on signal was calculated from the reconstructed division planes by plotting the mean signal as a function of depth in 10 rectangular regions (white boxes) where the signal was expected to be uniform; three examples are shown here. All intensity profiles were simultaneously fitted using a single exponential. Error bars are the SD. On the right, the same cell-cell boundaries are shown after correction for depth attenuation. The scale bar is 10 µm.
Figure 3—figure supplement 4
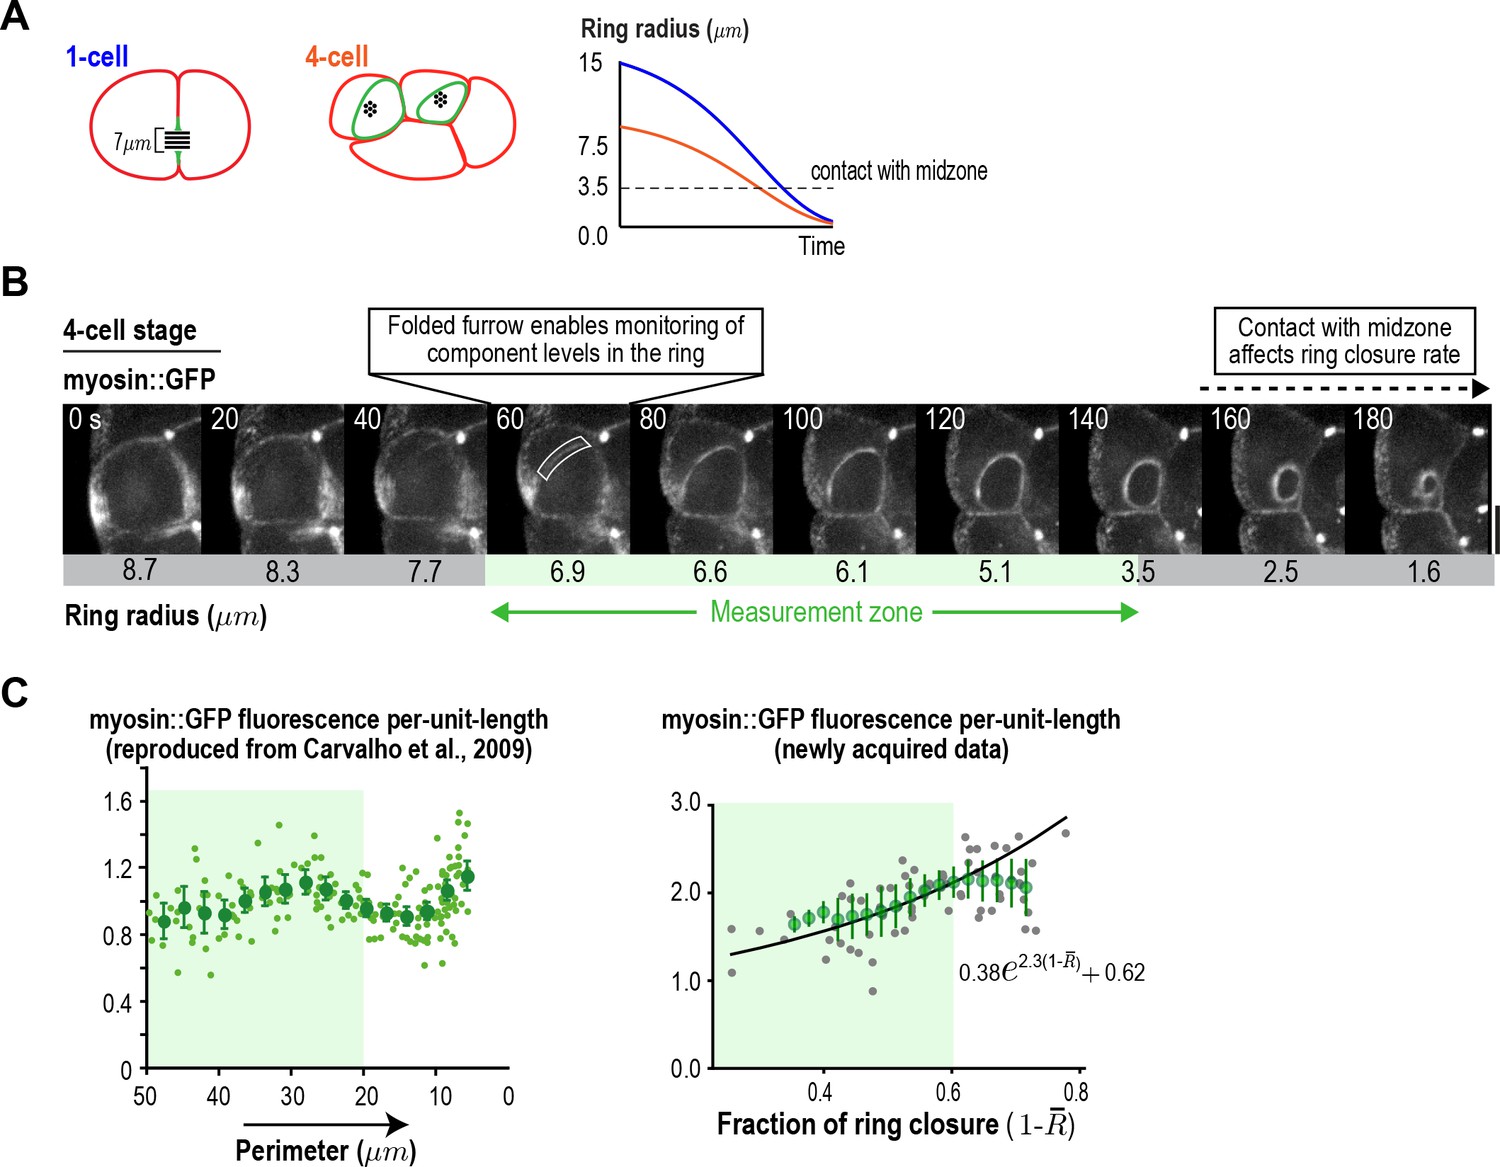
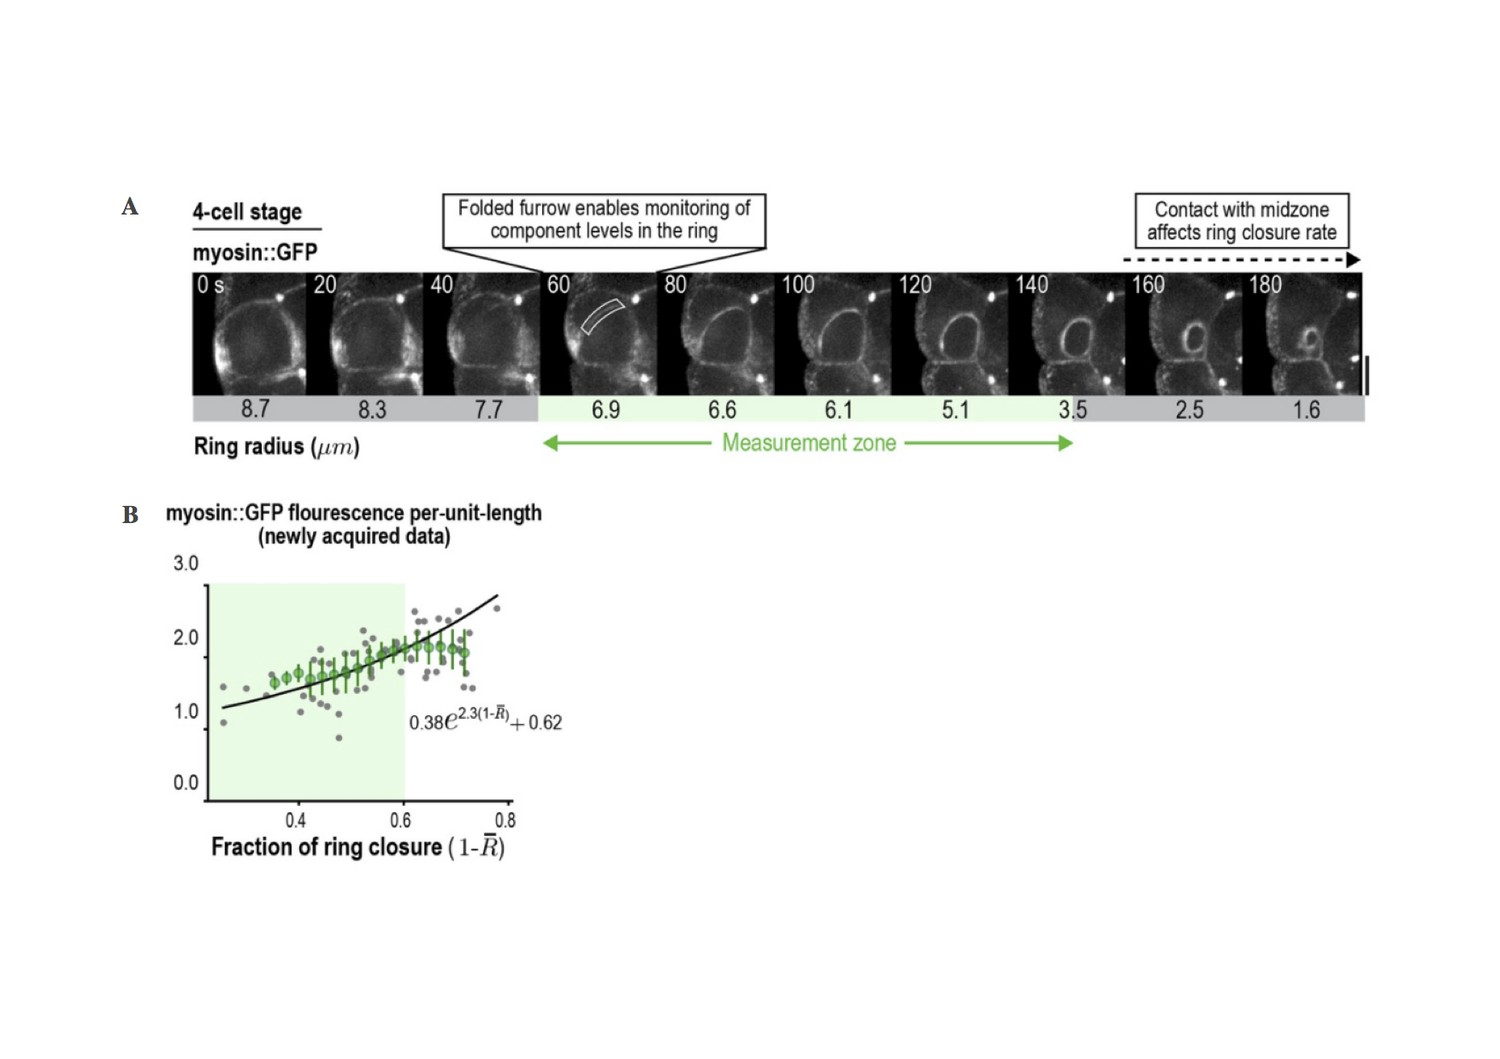
Ring component dynamics at the four-cell stage are consistent with exponential accumulation.
(A) (left) Schematic illustrating the relative geometries of cytokinesis in one- and four-cell stage C. elegans embryos. (right) The range of ring sizes between furrow formation and contact with the midzone, which occurs at a ring radius of about 3.5 µm (perimeter ~22 µm) in all divisions and alters constriction rate and component accumulation (Carvalho et al., 2009), is much smaller at the four-cell stage than at the one-cell stage. (B) Myosin levels in the ring can only be monitored over a limited range of ring size at the four-cell stage. Images of the division plane in a representative dividing cell at the four-cell stage reconstructed from 16 × 1 µm z-stacks of an embryo expressing myosin::GFP (n = 16 embryos imaged). The range of ring sizes between the point when the folding in of the furrow first enables monitoring of ring component levels in the end-on view, and the point when the ring contacts the spindle midzone, is indicated (green; Measurement zone). (C) Graphs plotting measured mean per-unit-length myosin::GFP fluorescence in the ring at the four-cell stage. The graph on the left is reproduced from Figure 4D of Carvalho et al. (2009) where a strain with an integrated myosin::GFP transgene under an exogenous promoter was filmed. The graph on the right is new data collected in the in situ-tagged myosin::GFP strain. The measurement zone highlighted in B (from 50 to 20 µm ring perimeter is highlighted in green for both graphs). In the graph on the right, the data for rings in the measurement zone were fit to an exponential equation with the same baseline contribution as the one-cell stage data in Figure 3C (black line). Error bars are the SEM.
© 2009 Elsevier. Figure 3—figure supplement 4C (left graph) reproduced with permission from Figure 5 of Carvalho et al. (2009).
Figure 4

Constriction-coupled disassembly with compression feedback model.
(A) The natural coordinate system for contractile ring dynamics has two axes, an axis parallel to ring constriction (around-the-ring axis) and an axis perpendicular to the ring (perpendicular-to-the-ring axis). Polar relaxation and filament alignment in the around-the-ring direction lead to anisotropy in behavior along the two axes, which are illustrated separately here. Our prior work analyzing component dynamics at the 4-cell stage in the C. elegans embryo has suggested that in the around-the-ring direction constriction is coupled to component disassembly (Constriction-Coupled Disassembly, right), so that ring constriction does not change the per-unit-length amount of ring components (Carvalho et al., 2009). Here, we propose that this is coupled to a feedback loop between ring myosin and compression-driven cortical flow (Compression Feedback, left) that operates along the axis perpendicular to the ring. Compression feedback would lead to an exponential increase in the per-unit-length amount of ring myosin and the per-unit-length constriction rate as the ring closes. (B) Constriction-Coupled Disassembly with Compression Feedback can be formulated as an analytical mathematical model consisting of three equations and three model parameters. (left) Equations (1) and (2) describe the feedback loop between the amount of ring myosin and the velocity of compression-driven flow of cortical surface into the ring. Solving these equations gives the expression for the per-unit-length amount of ring myosin, which accumulates exponentially as shown in the graph. (right) The feedback loop operating perpendicular to the ring controls the per-unit-length amount of ring myosin, which in turn controls the per-unit-length rate of ring constriction as described in Equation (3). Graph plots the equation for ring size resulting from solving the model equations in the time reference where is the halfway point of ring closure.
Figure 5 with 1 supplement
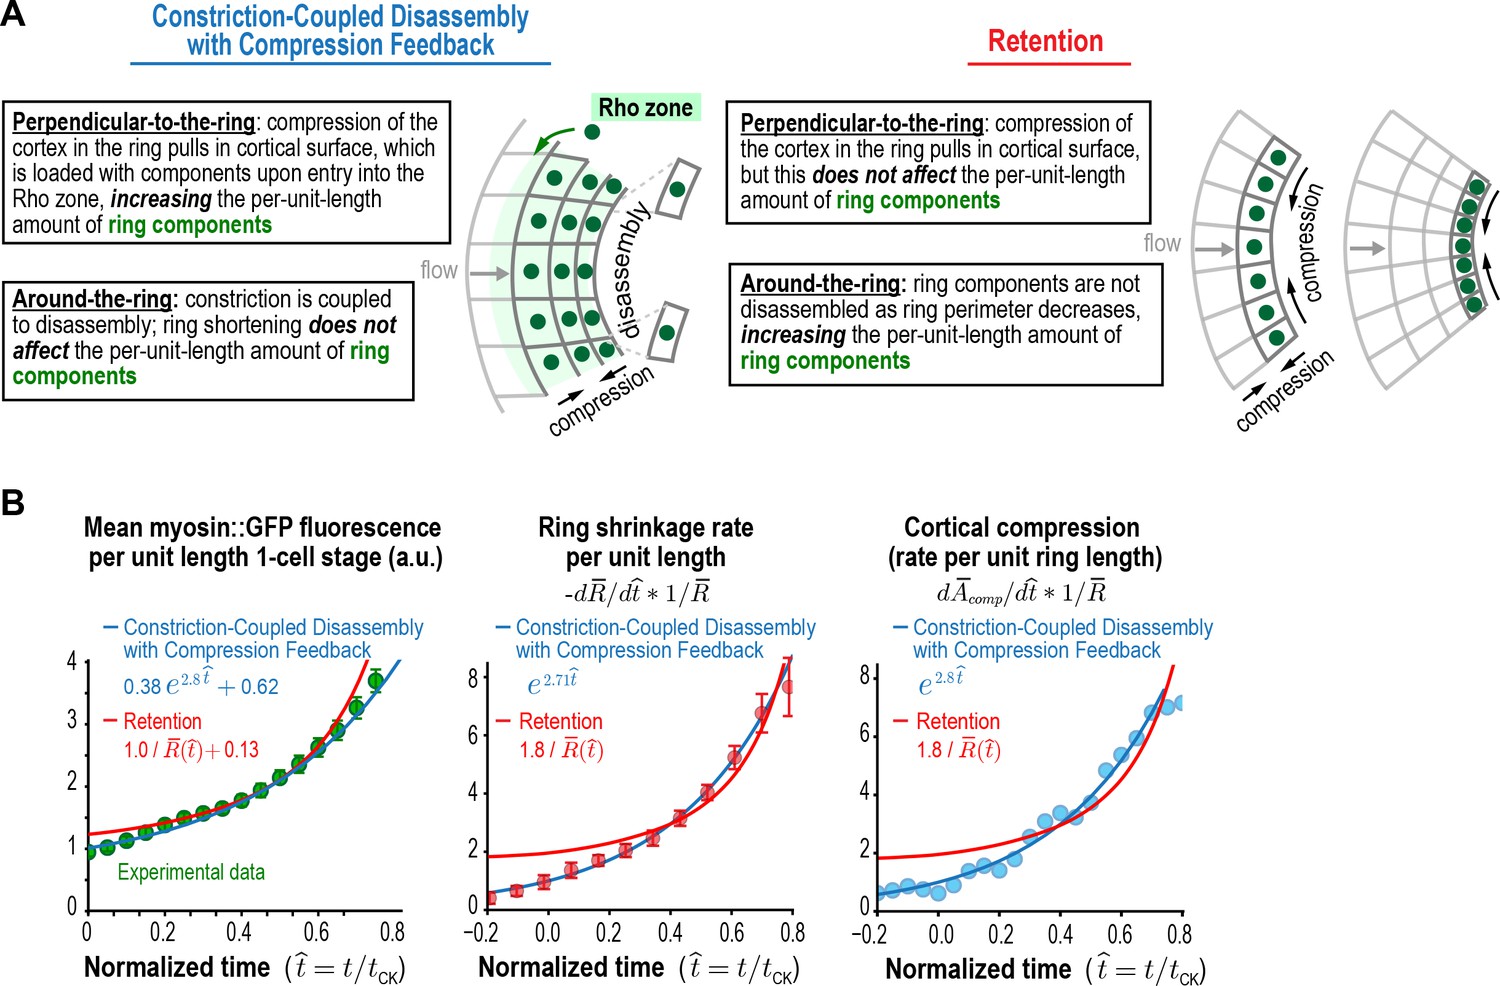
Myosin accumulation and the rates of ring constriction and cortical compression can be approximated with a retention model but are fit better by the Constriction-Coupled Disassembly with Compression Feedback model.
(A) Two models could explain the acceleration in the per-unit-length constriction rate during constriction. In the Constriction-Coupled Disassembly with Compression Feedback model, the increase in per-unit-length component amounts arises from a feedback loop between ring myosin and compression-driven cortical flow along the direction perpendicular to the ring. In the Retention model, the increase in per-unit-length component amounts arises because components are retained rather than lost due to disassembly as ring perimeter decreases. (B) Graphs show mean per-unit-length myosin::GFP fluorescence in the ring along with the per-unit-length constriction and cortical compression rates. Myosin fluorescence data is reproduced from Figure 3C to allow comparison of the best fits for the Constriction-Coupled Disassembly with Compression Feedback (blue lines) and Retention (red lines) models.
Figure 5—figure supplement 1
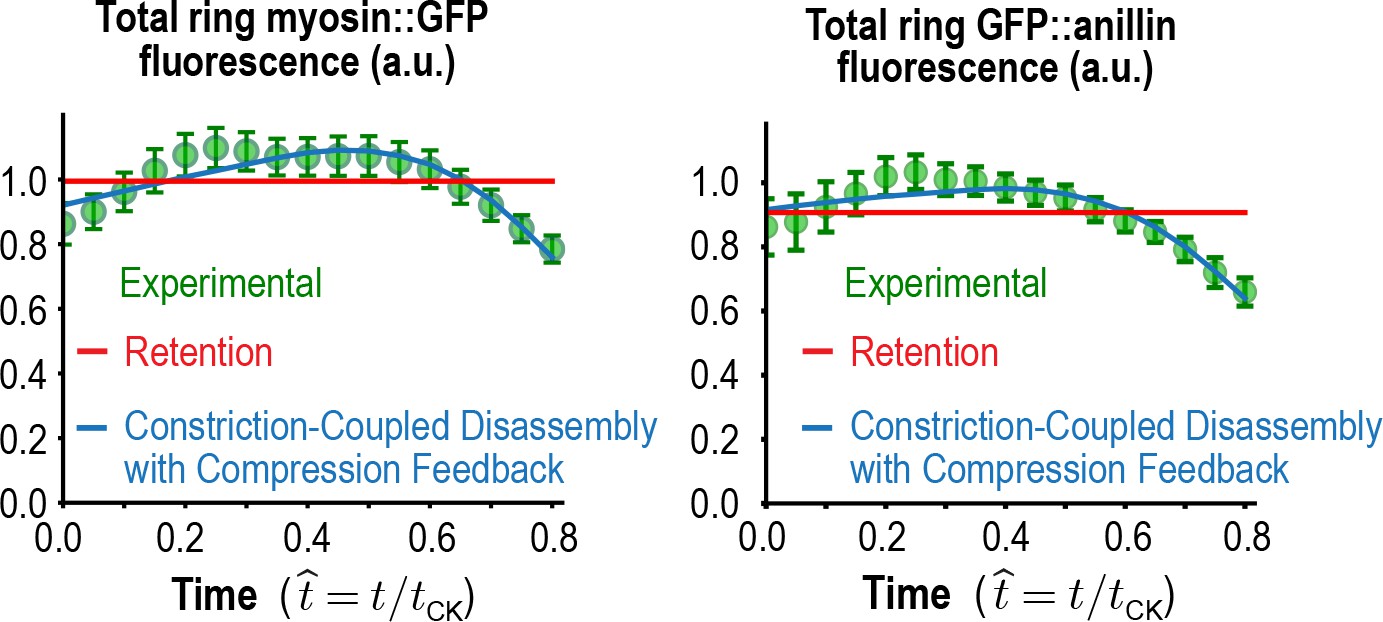
Total myosin::GFP and GFP::anillin in the ring.
Graphs plotting mean total ring fluorescence (average over all angles; green) for myosin::GFP (n = 36 embryos) and GFP::anillin (n = 26 embryos). Error bars are the SEM. The predictions for the Constriction-Coupled Disassembly with Compression Feedback (blue lines) and Retention (red lines) models are also shown. Error bars are the SEM.
Figure 6
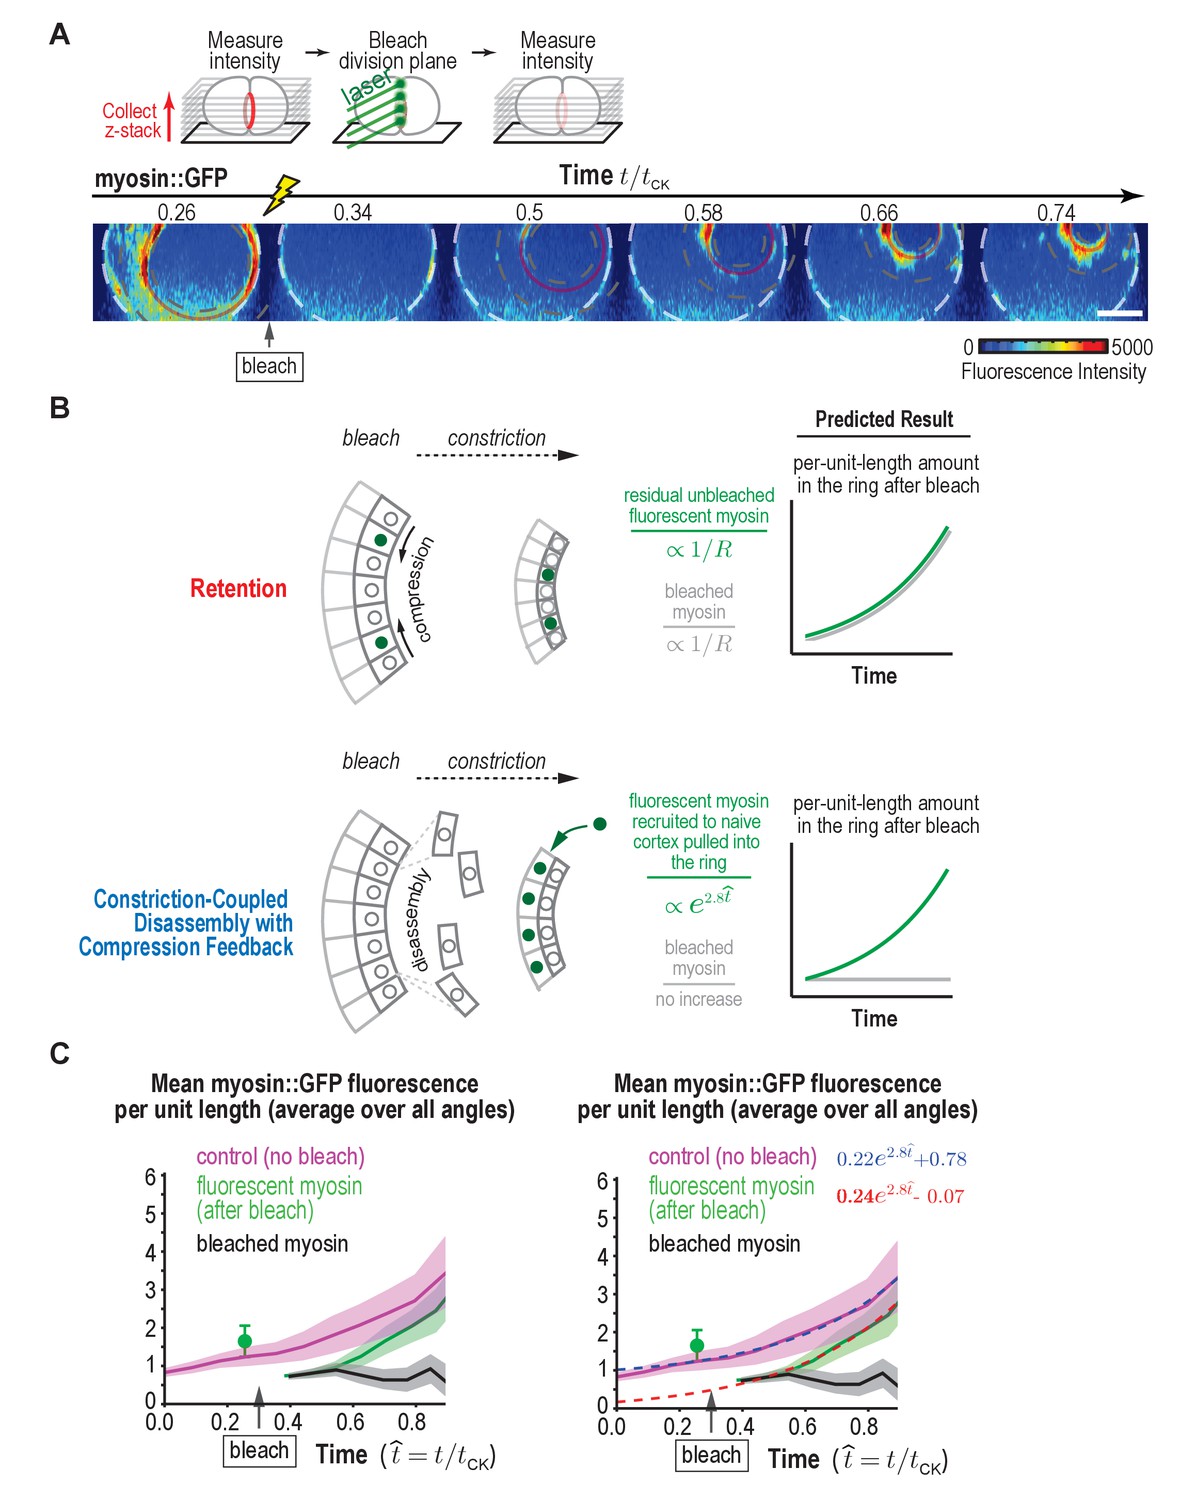
Fluorescence recovery after photobleaching of the division plane at the one-cell stage rules out Retention and is consistent with Constriction-Coupled Disassembly with Compression Feedback.
(A) (top) Schematic of the photobleaching experiment. (bottom) Images of the division plane reconstructed from 30 × 1 μm z-stacks of an embryo expressing myosin::GFP whose division plane was bleached at t/tCK ~0.3. Red circle marks the contractile ring and dashed circles mark the boundaries used for ring intensity measurements. Image series is representative of eight imaged embryos. (B) Schematics illustrate the expected results predicted by the Retention and Constriction-Coupled Disassembly with Compression Feedback models. (C) (left) Graph plotting the mean per-unit-length amounts of fluorescent myosin::GFP in the ring for control embryos (pink, n = 24 embryos) and embryos in which the division plane was bleached at the indicated time (green, n = 8 embryos). The amount of bleached myosin::GFP in the ring (black) was calculated as the difference between the control and after bleach curves. Solid continuous lines are the average curves with errors shown as shaded regions. (right) Same as the graph on the left with dashed lines, representing exponential fits to the data, added. Errors for the control and after bleach data are SD and errors for the difference are SEM. Scale bar is 10 µm.
Figure 7

Fluorescence recovery after photobleaching of the division plane at the four-cell stage is consistent with Constriction-Coupled Disassembly with Compression Feedback.
(A) (top) Schematics of an experiment that we performed previously in which a spot was bleached in contractile rings at the four-cell stage (Carvalho et al., 2009). In kymographs of a fixed length region of the arc, the bleached spot narrowed as the ring constricted, yielding a tornado shape. (middle) Image panels and kymograph reproduced from Figure 5 of Carvalho et al. (2009). The top set of panels show a four-cell stage spot bleaching experiment. The region indicated by the arrow was bleached. Time is in seconds after photobleaching. Stills are in pseudocolor with hot-to-cold colors representing high-to-low GFP intensity. Scale bar, 5 μm. Below the images is a representative tornado-shaped kymograph. The time interval between each row of pixels is 5 s. The top row corresponds to the time point before photobleaching. Pixel dimensions are 0.27 × 0.27 μm. These experiments suggested that after its incorporation into the ring, ring myosin does not exchange with myosin in the cytoplasm, and that the ring disassembles in constriction-coupled fashion. (B) In addition to Constriction-Coupled Disassembly, which does not alter the per-unit-length amount of ring myosin, the division plane bleaching experiments that we performed at the one-cell stage suggest that new myosin is delivered into the ring by compression feedback along the axis perpendicular to the ring. (C, D) Schematics in C and D show the predictions of Constriction-Coupled Disassembly Alone and Constriction-Coupled Disassembly with Compression Feedback for spot (C) and division plane (D) bleaching experiments at the four-cell stage. Rather than closing by 50% over 95 s as predicted by Constriction-Coupled Disassembly Alone, the tornados thinned more rapidly, consistent with the prediction of the Constriction-Coupled Disassembly with Compression Feedback model (Carvalho et al., 2009). (D) To test whether Compression Feedback delivers components to the ring at the four-cell stage as well as at the one-cell stage, we monitored recovery after photobleaching the entire contractile arc. Images show a representative bleached embryo (n = 10). The observed recovery pattern was similar to what we observed at the one-cell stage, consistent with the idea that compression feedback contributes to ring component accumulation at both the one- and four-cell stages. Scale bar is 10 µm.
© 2009 Elsevier. Figure 7A (spot bleach at four-cell stage) reproduced with permission from Figure 5 of Carvalho et al. (2009).
Figure 8
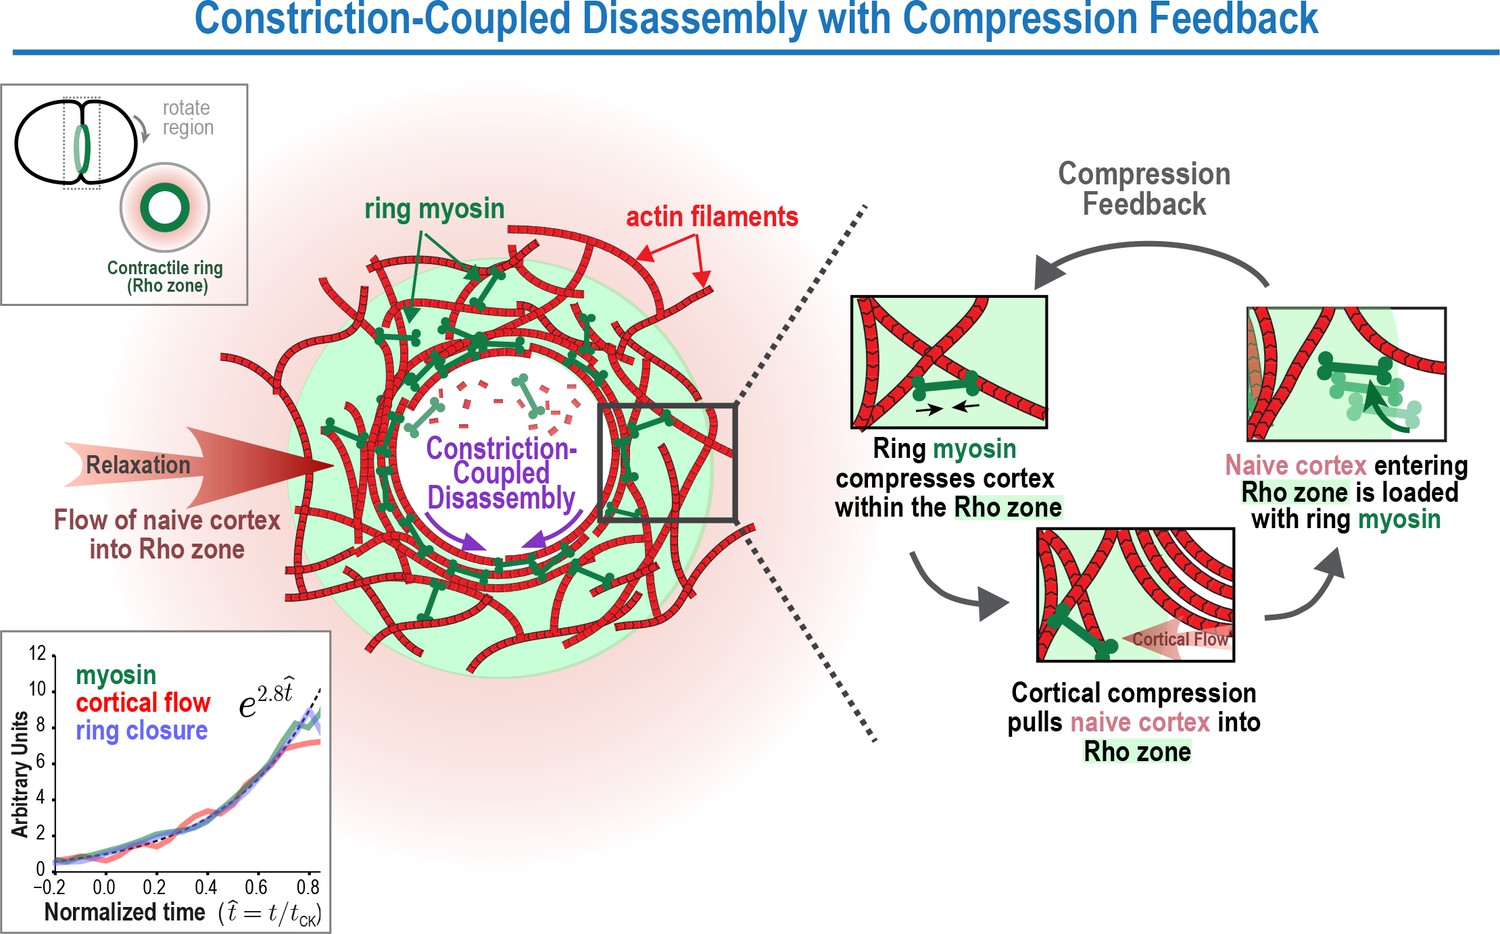
The Constriction-Coupled Disassembly with Compression Feedback model for contractile ring dynamics during cytokinesis.
Polar relaxation allows ring myosin to compress cortical surface along the axis perpendicular to the ring. Compression pulls naive cortex not previously exposed to RhoA-based signaling into the contractile ring/Rho zone, where it is loaded with myosin and other contractile ring components. Feedback between ring myosin and compression-driven cortical flow leads to an exponential increase in the per-unit-length amount of ring myosin that maintains the high overall closure rate as ring perimeter decreases.
Author response image 1
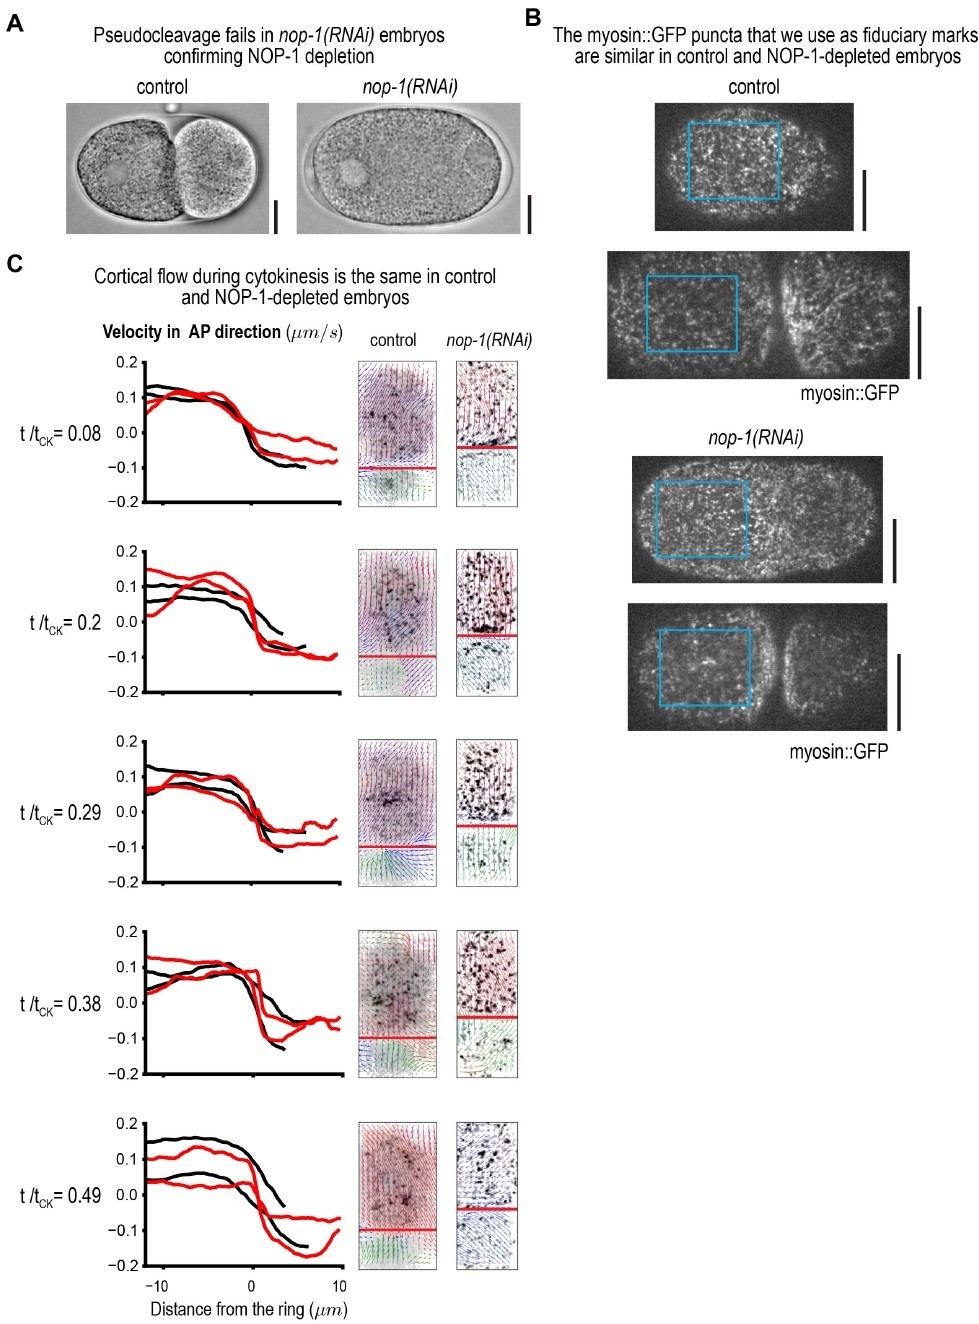
Cortical flows during cytokinesis are not altered in NOP-1-depleted embryos.
(A) nop-1(RNAi) embryos were monitored prior to the first mitotic division to confirm that pseudocleavage failed indicating successful NOP-1 depletion. (B) Fluorescence confocal images showing that the myosin::GFP foci that we use as fiduciary marks to monitor cortical flow were not altered by NOP-1 depletion. (C) Graphs plotting cortical velocity in the AP direction versus distance from the ring at different times during cytokinesis. Two examples of control (black) and nop-1(RNAi) (red) embryos are shown.
Author Response Image 2

Amounts of myosin::GFP and GFP:anillin per unit ring length measured at the 4-cell stage.
© 2009 Elsevier. Author response image 2 reproduced with permission from Carvalho et al., 2009.
Author response image 3
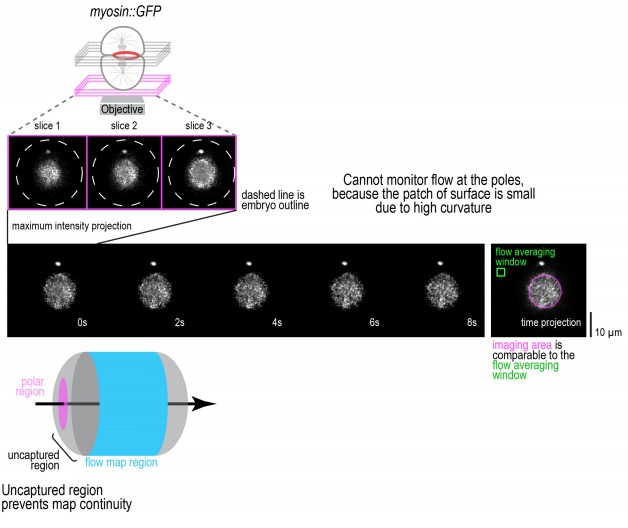
Technical limitations prevent imaging of cortical flow at the cell poles.
https://doi.org/10.7554/eLife.36073.026
Author response image 4
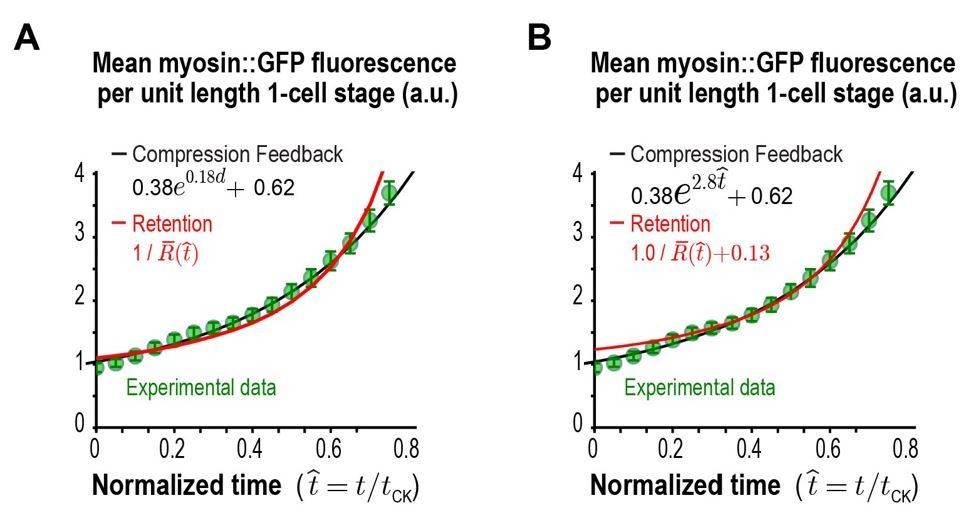
Comparison of the Retention model fit without (A) and with (B) inclusion of a baseline term.
https://doi.org/10.7554/eLife.36073.027
Author response image 5
(A) New 4-cell stage data. Images of the division plane in a representative dividing cell at the 4-cell stage reconstructed from 16x1μm z-stacks of an embryo expressing myosin::GFP from an in situ tagged trans-gene (n=16 embryos) imaged). (B) Quantification of the per unit length amount of myosin in the ring from the data in A.
Author response image 6
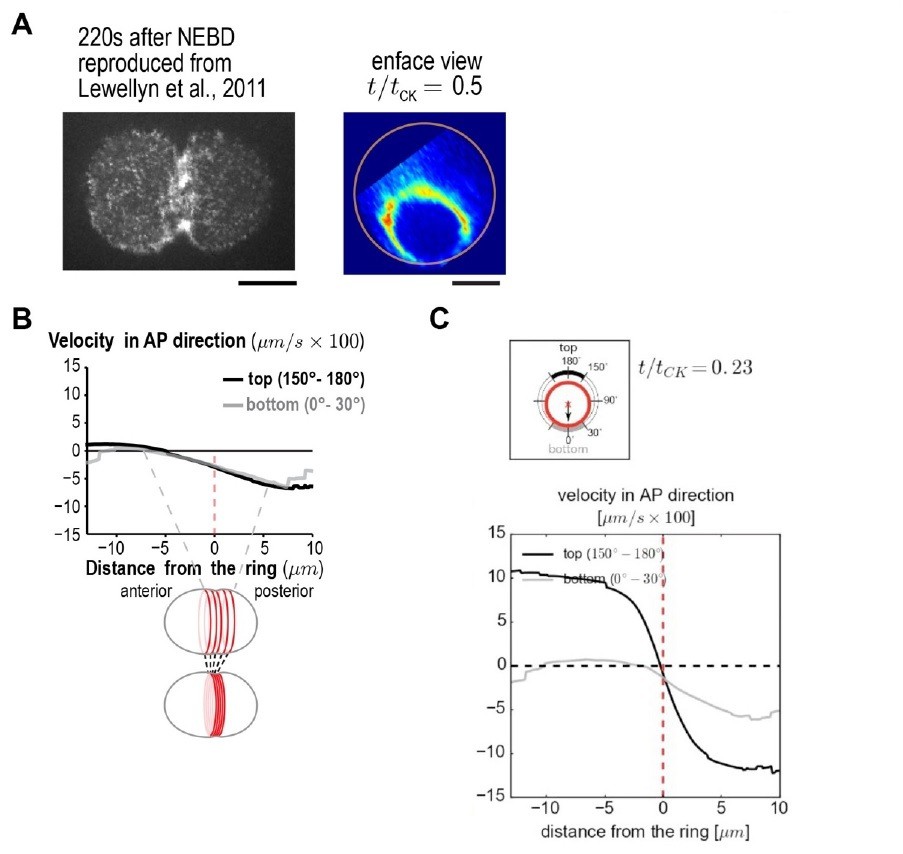
(A) (left) Spinning disk confocal optics were used to collect a 4x1μm z-series containing the embryo cortex and a maximum intensity projection is shown 220s after nuclear envelope breakdown (NEBD). Reproduced from Figure 6 of Lewellyn et al., 2011. (right) en face view of the division plane reproduced from Figure 3C in our paper. Both illustrate the point that there is much more myosin in the Rho zone than on the adjacent cortex. (B) Panel reproduced from Figure 3A in our paper. The equatorial cortex is compressed during contractile ring assembly. Following the onset of spindle-based RhoA signaling, the initial recruitment of contractile ring proteins leads to uniform compression of cortical surface along the axis perpendicular to the forming ring across a 10 μm wide region spanning the cell equator. The surface velocity profile reveals a linear velocity gradient that spans the cell equator)-5 to +5 μm), indicating a uniform zone of cortical compression. Outside of this region velocity is essentially constant. (C) Panel reproduced from Video 2. An average cortical flow map was calculated from time lapse imaging of the cell surface in 93 control embryos expressing myosin::GFP. (top) schematic illustrates ring size and position at t/tCK= 0.23. The graph plots the magnitude of the component of surface velocity aligned along the anterior-posterior axis for the top (150-180°; black) and bottom (0-30°; grey) regions of the cortex at the t/tCK= 0.23.
Videos
Video 1
Cortical flow imaged in a control embryo expressing myosin::GFP.
Playback is 6x realtime. The video is constructed from maximum intensity projection of 3 × 0.75 µm plane z-stacks acquired at 2 s intervals. The red line marks the position of the division plane. The arrows represent the surface movement between consecutive frames at the base of the arrow. The length of the arrow is five times the magnitude of movement. The direction is also color coded according to the color wheel as shown in Figure 1B.
Video 2
Average cortical flow map calculated from time lapse imaging of the cell surface in 93 control embryos expressing myosin::GFP. (top, left)
Schematic illustrates location of the cylindrical surface covered by the map. (top, right) Dynamic schematic illustrates ring size and position for each value of t/tCK. (bottom, left) The movement of each blue dot corresponds to surface movement at its location. The y-axis is the angular position relative to the initial ingression axis. The x-axis is the distance from the division plane along the anterior-posterior axis. (bottom, right) Dynamic graph plots the magnitude of the component of surface velocity aligned along the anterior-posterior axis for the top (150–180°; black) and bottom (0–30°; grey) regions of the cortex.
Video 3
Average cortical flow map calculated from time lapse imaging of the cell surface in 68 arx-2(RNAi) embryos expressing Myosin::GFP.
(top, left) Schematic illustrates the location of the cylindrical surface covered by the map. (top, right) Dynamic schematic illustrates ring size and position for each value of t/tck. (bottom, left) The movement of each blue dot corresponds to surface movement at its location. The y-axis is the angular position relative to the initial ingression axis. The x-axis is the distance from the division plane along the anterior-posterior axis. (bottom, right) Dynamic graph plots the magnitude of the component of surface velocity aligned along the anterior-posterior axis for the top (150–180°; black) and bottom (0–30°; grey) regions of the cortex.
Tables
Key resources table
| Strain name | Genotype | Reference |
|---|---|---|
| OD821 | ltSi200[pOD1997; Pnmy-2::nmy-2::gfp; cb-unc-119(+)] II; unc-119(ed3) III | This study |
| OD857 | ltSi200[pOD1997; Pnmy-2::nmy-2::gfp; cb-unc-119(+)] II; unc-119(ed3); ruIs32[pAZ132; pie-1/GFP::histone H2B] III | This study |
| OD858 | ltSi803[pOD1998; Parx-7::GFP::arx-7; cb-unc-119(+)] II; unc-119(ed3) III; | This study |
| LP162 | nmy-2(cp13[nmy-2::gfp + LoxP]) I | Dickinson et al., 2013 |
| OD95 | unc-119(ed3) III; ltIs37 [pAA64; Ppie-1::mCherry::his-58; unc-119(+)] IV; ltIs38 [pAA1; Ppie-1::GFP::PH(PLC1delta1); unc-119 (+)] | Essex et al., 2009 |
| OD3011 | ltSi1123[pSG017; Pani-1::GFP::ani-1 RE-encoded-exon5::ani-1 3'-UTR; cb unc-119(+)]II;unc-119(ed3)III | This study |
| GOU2047 | cas607[arx‐2::gfp knock‐in] V | Zhu et al., 2016 |
Additional files
-
Transparent reporting form
- https://doi.org/10.7554/eLife.36073.022
Download links
A two-part list of links to download the article, or parts of the article, in various formats.
Downloads (link to download the article as PDF)
Open citations (links to open the citations from this article in various online reference manager services)
Cite this article (links to download the citations from this article in formats compatible with various reference manager tools)
A positive-feedback-based mechanism for constriction rate acceleration during cytokinesis in Caenorhabditis elegans
eLife 7:e36073.
https://doi.org/10.7554/eLife.36073


