Histone H3 threonine 11 phosphorylation by Sch9 and CK2 regulates chronological lifespan by controlling the nutritional stress response
- Stowers Institute for Medical Research, United States
Figures
Figure 1 with 2 supplements
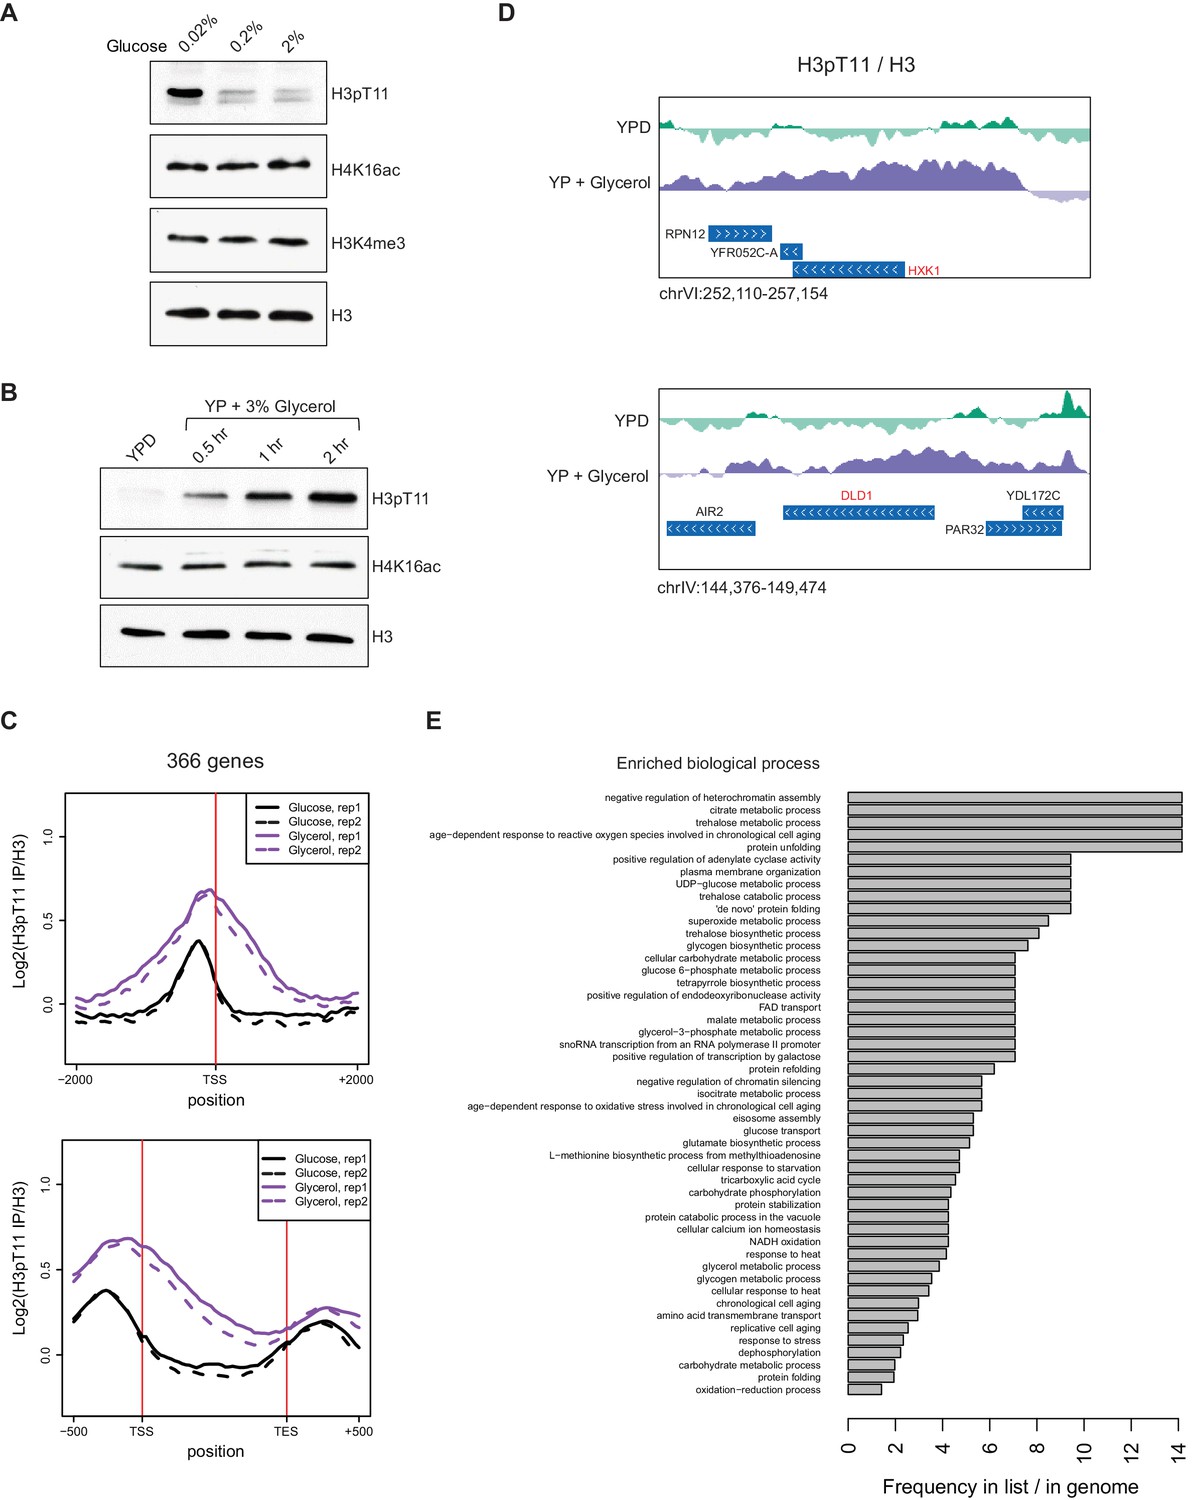
H3pT11 responds to nutritional stress.
(A) H3pT11 levels in the media containing different concentration of glucose measured by western blots. Wild type (BY4741) yeast cultures at early mid-log phase (OD 0.4) were shifted from YPD to YP media containing 0.02, 0.2, or 2% glucose for 1 hr at 30°C. (B) H3pT11 levels in the media containing non-fermentable glycerol measured by western blots. WT cultures were shifted from YPD to YP with 3% glycerol for indicated times. (C) The averaged profiles of H3pT11 at 366 genes, whose H3pT11 levels are increased in YPglycerol (Glycerol) compared to YPD (Glucose) condition. TSS: transcription start site; TES: transcription end site. (D) Normalized H3pT11 levels to H3 at HXK1 and DLD1 gene loci in YPD and YPglycerol conditions. (E) GO term analysis of the 366 genes shown in (C). GO terms with a p-value less than 0.05 were included, and with at least two genes from the significant gene list annotated. The bars are based on the frequency of the term in the significant gene list divided by the frequency of the term in the genome.
-
Figure 1—source data 1
H3pT11 occupancy of the genes shown in Figure 1C and Figure 1—figure supplement 2C.
- https://doi.org/10.7554/eLife.36157.005
Figure 1—figure supplement 1
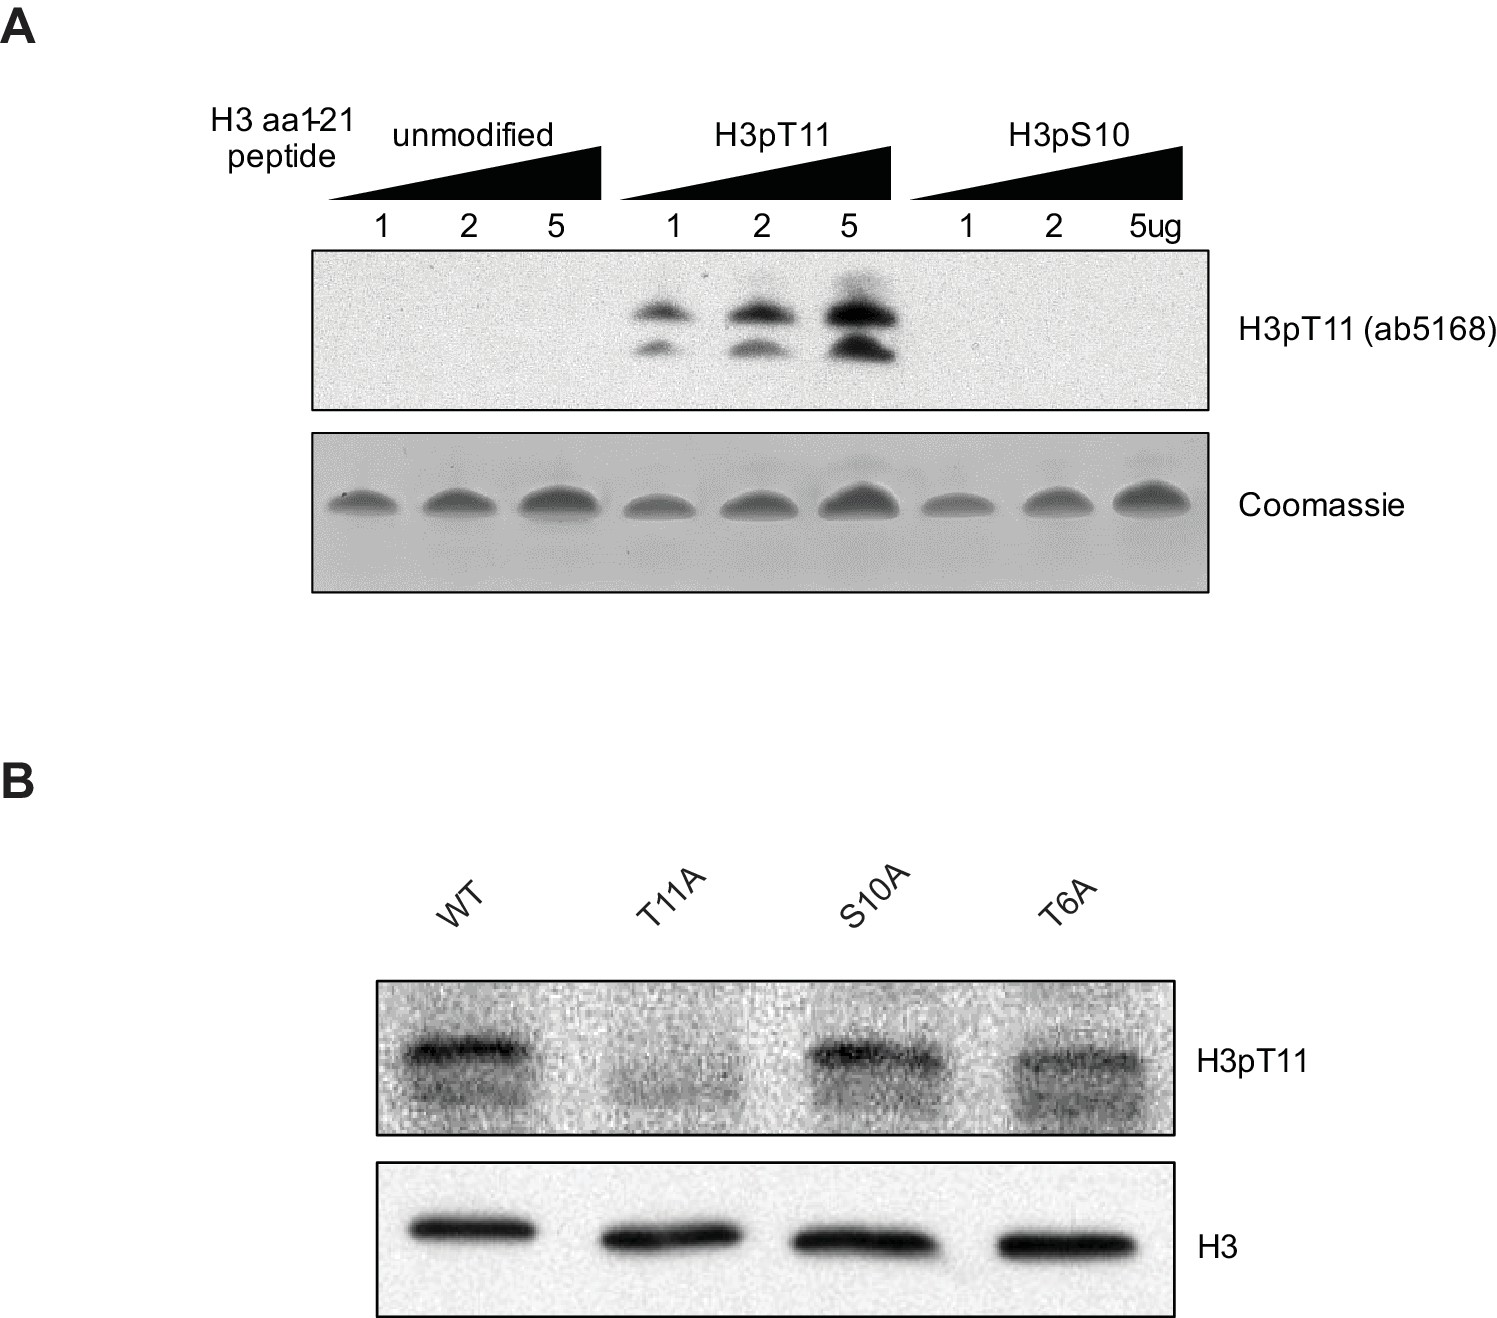
H3pT11 antibody validation.
(A) H3pT11 antibody specificity test against unmodified, H3pT11, and H3pS10 containing histone H3 amino acids (aa) 1–21 peptides measured by Western blots. (B) H3pT11 levels in WT (ySE40), H3T6A, H3S10A and H3T11A strains in YPD.
Figure 1—figure supplement 2

H3pT11 responds to low glucose condition.
(A) Western blots showing H3pT11 levels in WT (BY4741) cultures shifted from YPD to YP media containing 2% glucose, 3% glycerol, or 2% glucose with 3% glycerol (Glucose + Glycerol) for 1 hr. For ‘Glucose added’ cells, WT cultures were initially shifted from YPD to YP with 3% glycerol for 1 hr, were then directly supplied with 2% glucose, and were further incubated for 1 hr. (B) A bar plot showing the total number of H3pT11 peaks in YPglycerol (Glycerol-1 and 2) and YPD (Glucose-1 and 2) ChIP-seq experiments. This bar plot does not include peaks overlapping non-pol II genes or peaks on the mitochondrial chromosome. (C) The average profiles of H3pT11 around the transcription start site (TSS) and across the gene body for 139 genes whose H3pT11 levels are decreased in YPglycerol (Glycerol) compared to YPD (Glucose). tRNA and rRNA genes have been excluded. TES: transcription end site. (D) GO term analysis of the 139 genes, of which H3pT11 levels are decreased, from ChIP-sequencing data shown in (C).
Figure 2 with 1 supplement
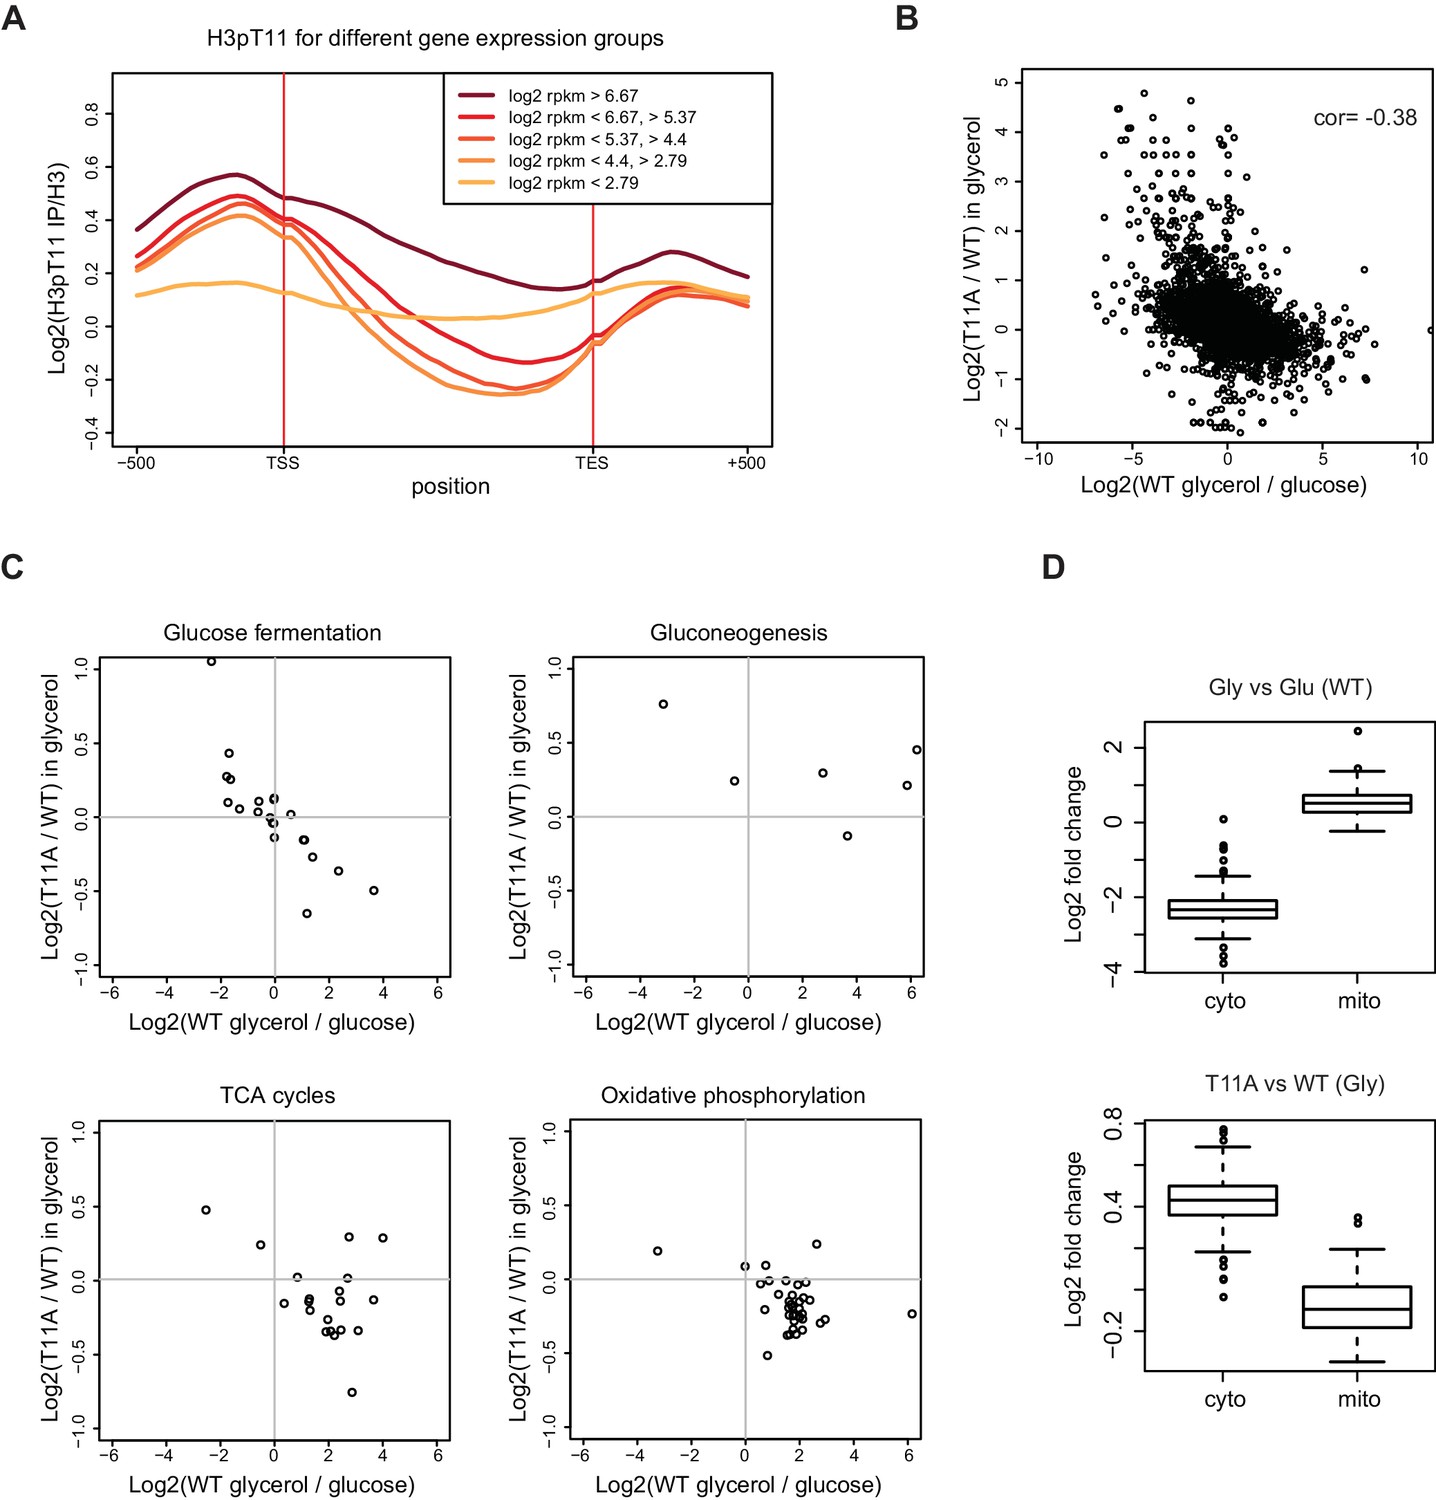
H3pT11 regulates transcription involved in metabolic transition upon nutritional stress.
(A) The average H3pT11 signal of genes from five different gene expression quantiles in YPglycerol. The groups are established by dividing the genes into equally sized quantiles based on the RPKM (Reads Per Kilobase Million) value in YPglycerol. Each group contains 1355 genes. (B) A scatter plot from RNA-seq data showing a negative correlation between transcription changes upon media shift from YPD to YPglycerol (x-axis), and the changes in H3T11A mutant compared to WT in YPglycerol condition (y-axis). (C) Scatter plots from RNA-seq for transcripts of genes in indicated pathways. (D) Box-plots showing expression changes of cytoplasmic (cyto) and mitochondrial (mito) ribosomal subunit genes upon nutritional stress condition (upper panel) and in H3T11A mutant in YPglycerol condition (lower panel). Gly: YPglycerol growth condition; Glu: YPD growth condition.
-
Figure 2—source data 1
Gene lists analyzed in Figure 2.
- https://doi.org/10.7554/eLife.36157.008
Figure 2—figure supplement 1

H3pT11 regulates transcription involved in stress response and aging upon nutritional stress.
(A) The averaged H3pT11 signal of genes from three different gene expression quantiles in YPglycerol. The numbers of genes in each group are noted in brackets (2258 or 2259 genes in each group). (B) Scatter plots from RNA-seq for transcripts of genes in indicated pathways.
Figure 3 with 2 supplements

Cka1 in the CK2 complex phosphorylates H3T11.
(A) (Left) H3pT11 levels of WT, cka1Δ, and cka2Δ in YPD analyzed by western blots. (Right) The relative band intensities of H3pT11 to H3 signals compared to WT. Error bars represent standard deviation (STD) from three biological replicates (B) (Left) Coomassie staining of TAP purified CK2 complex using a Cka1-TAP strain. (Right) In vitro kinase assay using TAP purified CK2 and recombinant H3 as a substrate. (C) In vitro kinase assay of TAP purified CK2 using recombinant H3 WT or H3T11A mutant as a substrate. (D) H3pT11 level changes in WT, cka1Δ, and cka2Δ mutants upon culture shift to YPglycerol media.
Figure 3—figure supplement 1
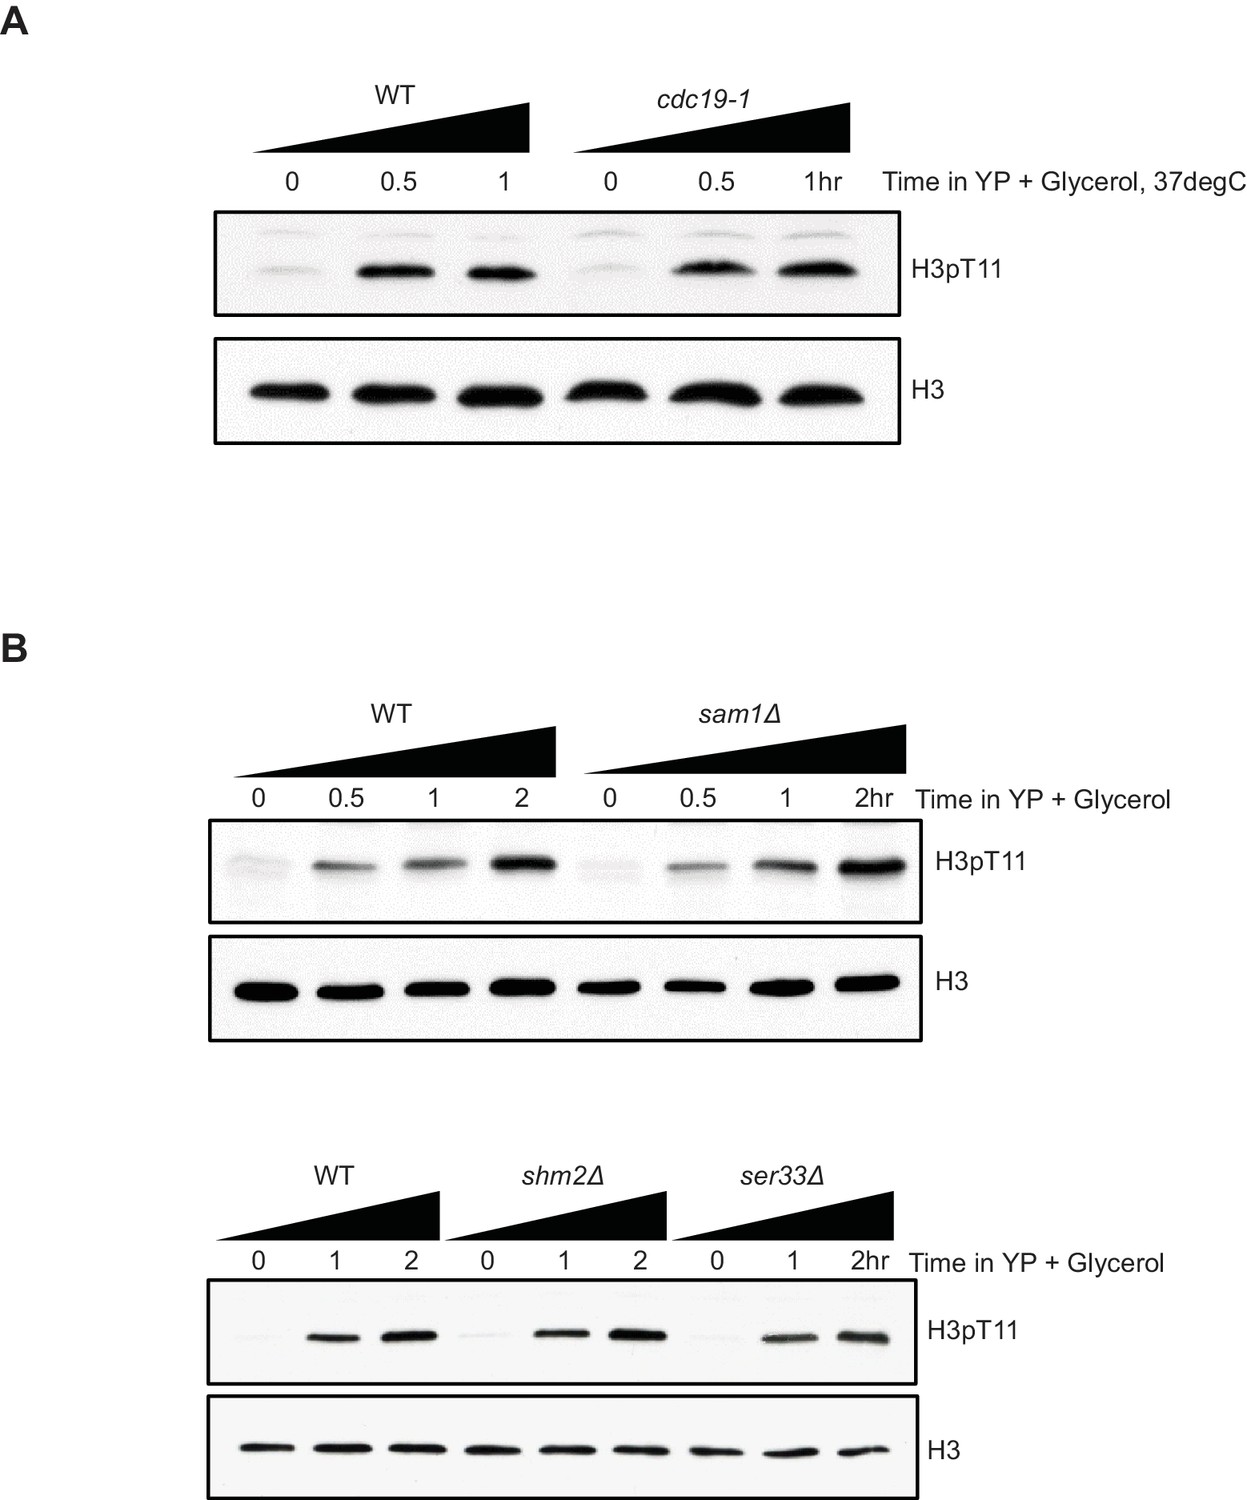
SESAME is not responsible for increased H3pT11 during nutritional stress condition.
(A) Western blots showing that H3pT11 level changes of WT and pyruvate kinase one temperature sensitive mutant cdc19-1 upon media shift from YPD, at permissive temperature (25°C) to YPglycerol, at non-permissive temperature (37°C). (B) H3pT11 levels in WT and SESAME subunit deletion mutants: sam1Δ, shm2Δ, and ser33Δ mutants upon media shift to YPglycerol analyzed by western blots.
Figure 3—figure supplement 2

Cka1 is required for H3pT11.
(A) H3pT11 levels in yeast kinase deletion mutants (bub1Δ, cka1Δ, and cka2Δ) and mutants of candidates for H3pT11 kinase (mek1Δ and chk1Δ) cultured in YPD media examined by western blots. (B) H3pT11 levels in subunits of CK2 deletion mutants: catalytic subunits, cka1Δ and cka2Δ, and regulatory subunits, ckb1Δ and ckb2Δ, cultured in YPD media examined by western blots.
Figure 4
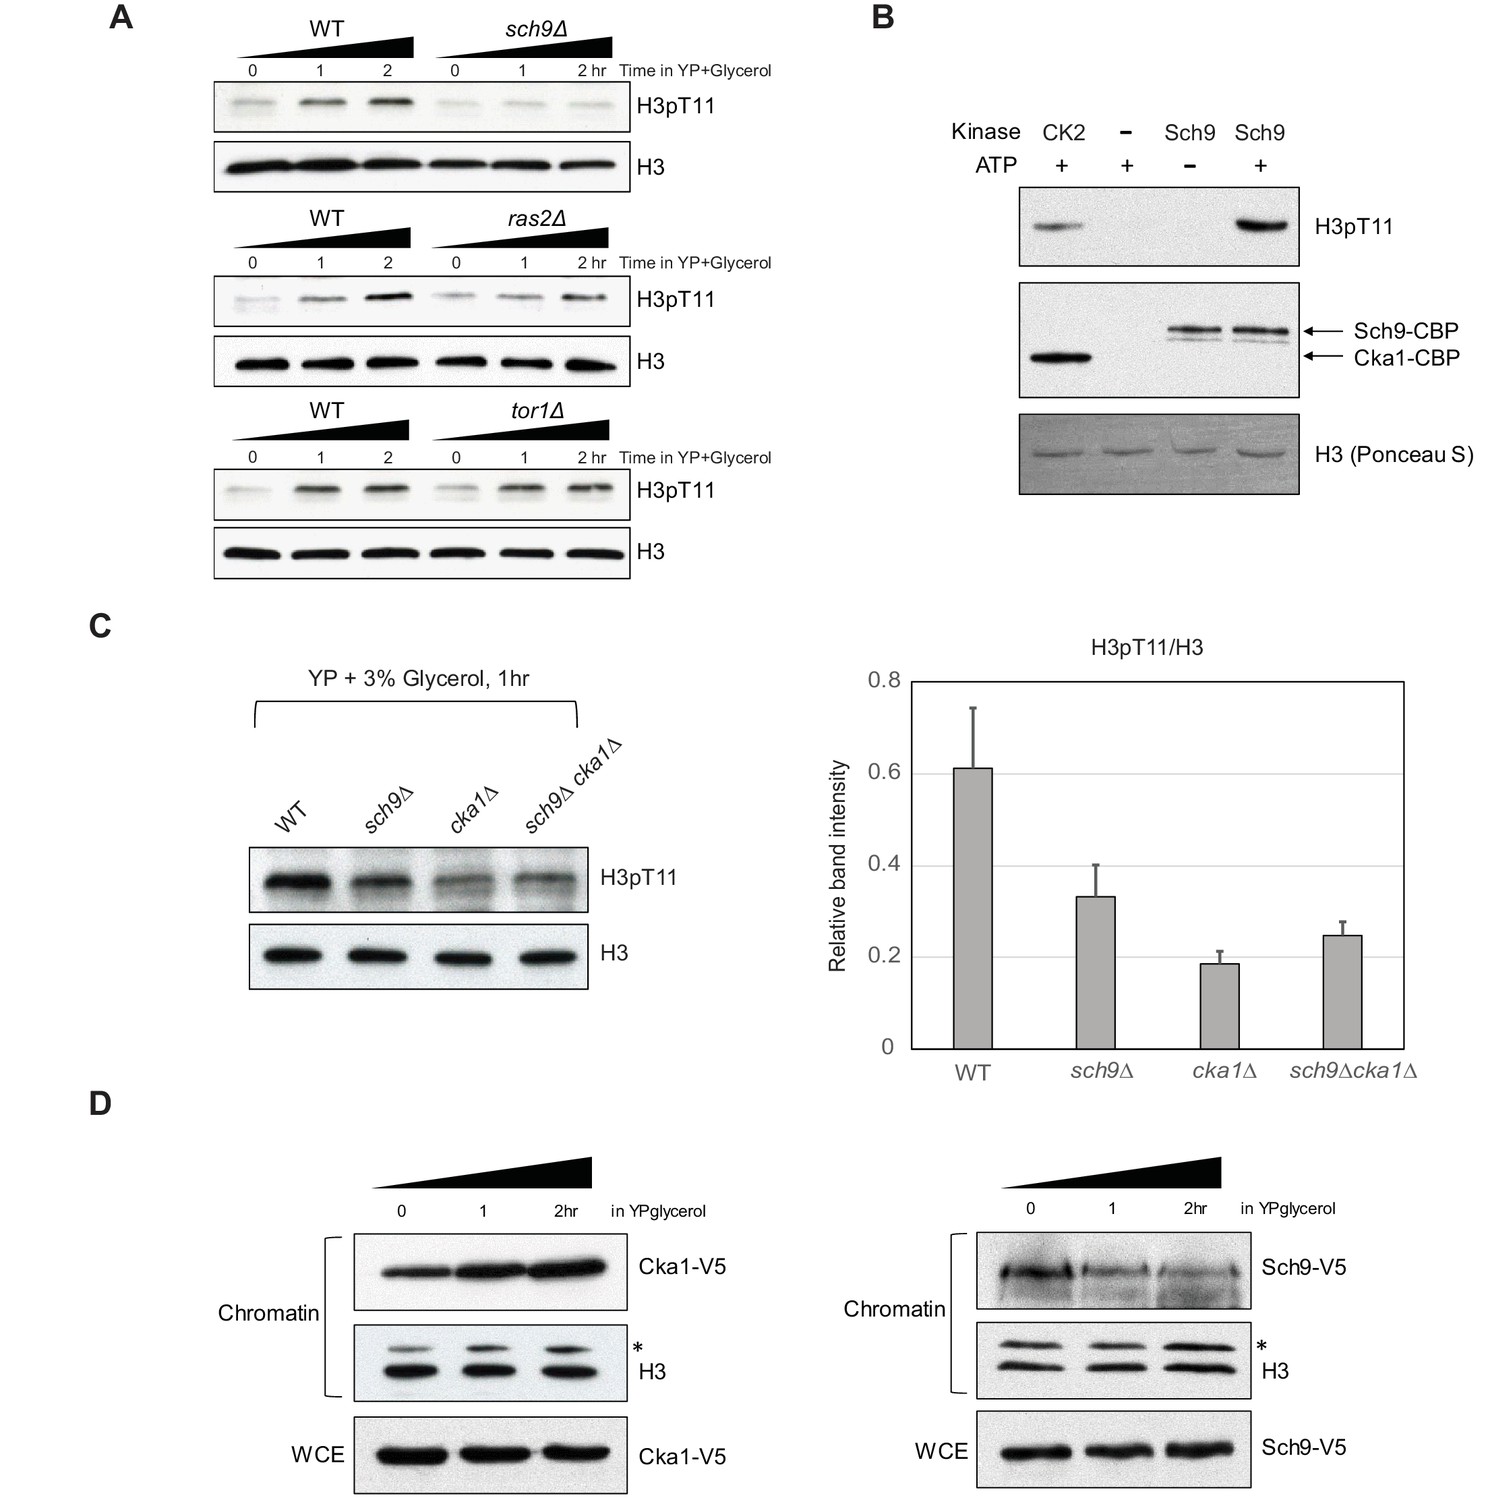
Sch9 regulates H3pT11 upon nutritional stress.
(A) H3pT11 levels in WT, sch9Δ, ras2Δ, and tor1Δ mutants upon media shift to YPglycerol measured by western blots. (B) In vitro kinase assay of TAP purified (Sch9-TAP) Sch9 and CK2 using recombinant H3 as a substrate. (C) (Left) H3pT11 levels in WT, sch9Δ, cka1Δ, and sch9Δcka1Δ at 1 hr after media shift from YPD to YPglycerol analyzed by western blots (Right) The relative ratios of H3pT11 to H3 signals are presented with error bars indicating STD from three biological replicates. (D) The levels of chromatin bound Cka1 (Left) or Sch9 (Right) upon media shifting to YPglycerol measured by western blots. Asterisks (*) indicate nonspecific bands.
Figure 5 with 1 supplement

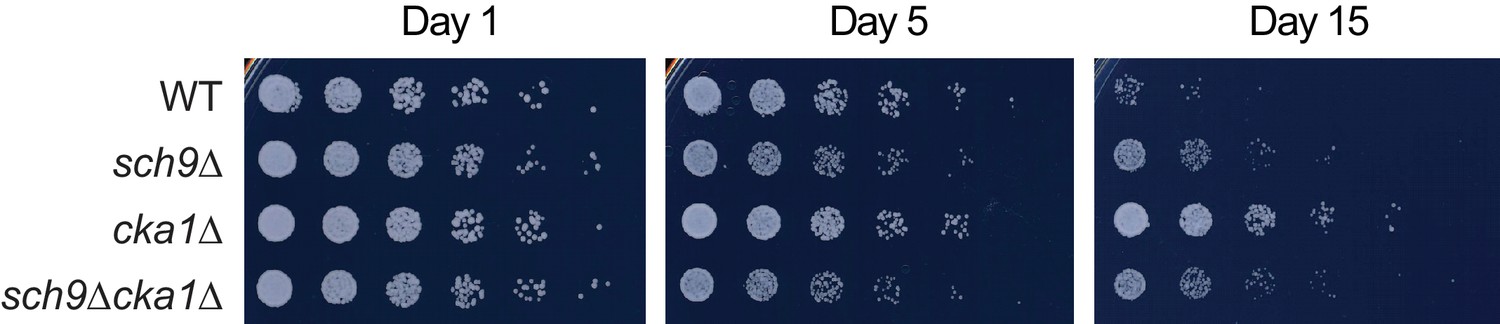
Phosphorylation of H3T11 regulates CLS.
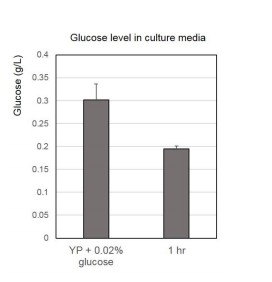
(A) CLS assays of WT (ySE40) and H3T11A strains. (B) CLS assays of WT (BY4742) and cka1Δ strains. (C) CLS assays of WT (BY4742), cka1Δ, sch9Δ, and sch9Δcka1Δ strains. Error bars in CLS assays indicate STD from three biological replicates. CFU: colony- forming units. (D) H3pT11 levels measured at indicated times during CLS assay of ySE40 (WT of histone mutant strains) and BY4741 strain analyzed by western blots. (E) A Bar graph displaying media glucose concentration measured from the WT strain culture at indicated times in the CLS assay. Error bars indicate STD of three biological replicates. (F) H3pT11 levels of WT strain at exponential growth stage (mid-log), saturated day one culture (day 1), and day one culture with re-supplemented glucose (day 1 + glucose) analyzed by western blots. For day 1 + glucose culture, 2% glucose was directly added to saturated day one culture, then incubated for additional 1 hr.
-
Figure 5—source data 1
CFU values in the CLS assays shown in Figure 5A, B and C.
- https://doi.org/10.7554/eLife.36157.015
Figure 5—figure supplement 1
Relative viability of WT (BY4742), sch9Δ, cka1Δ, and sch9Δcka1Δ strains during CLS assay at indicated time points.
https://doi.org/10.7554/eLife.36157.014
Figure 6 with 1 supplement
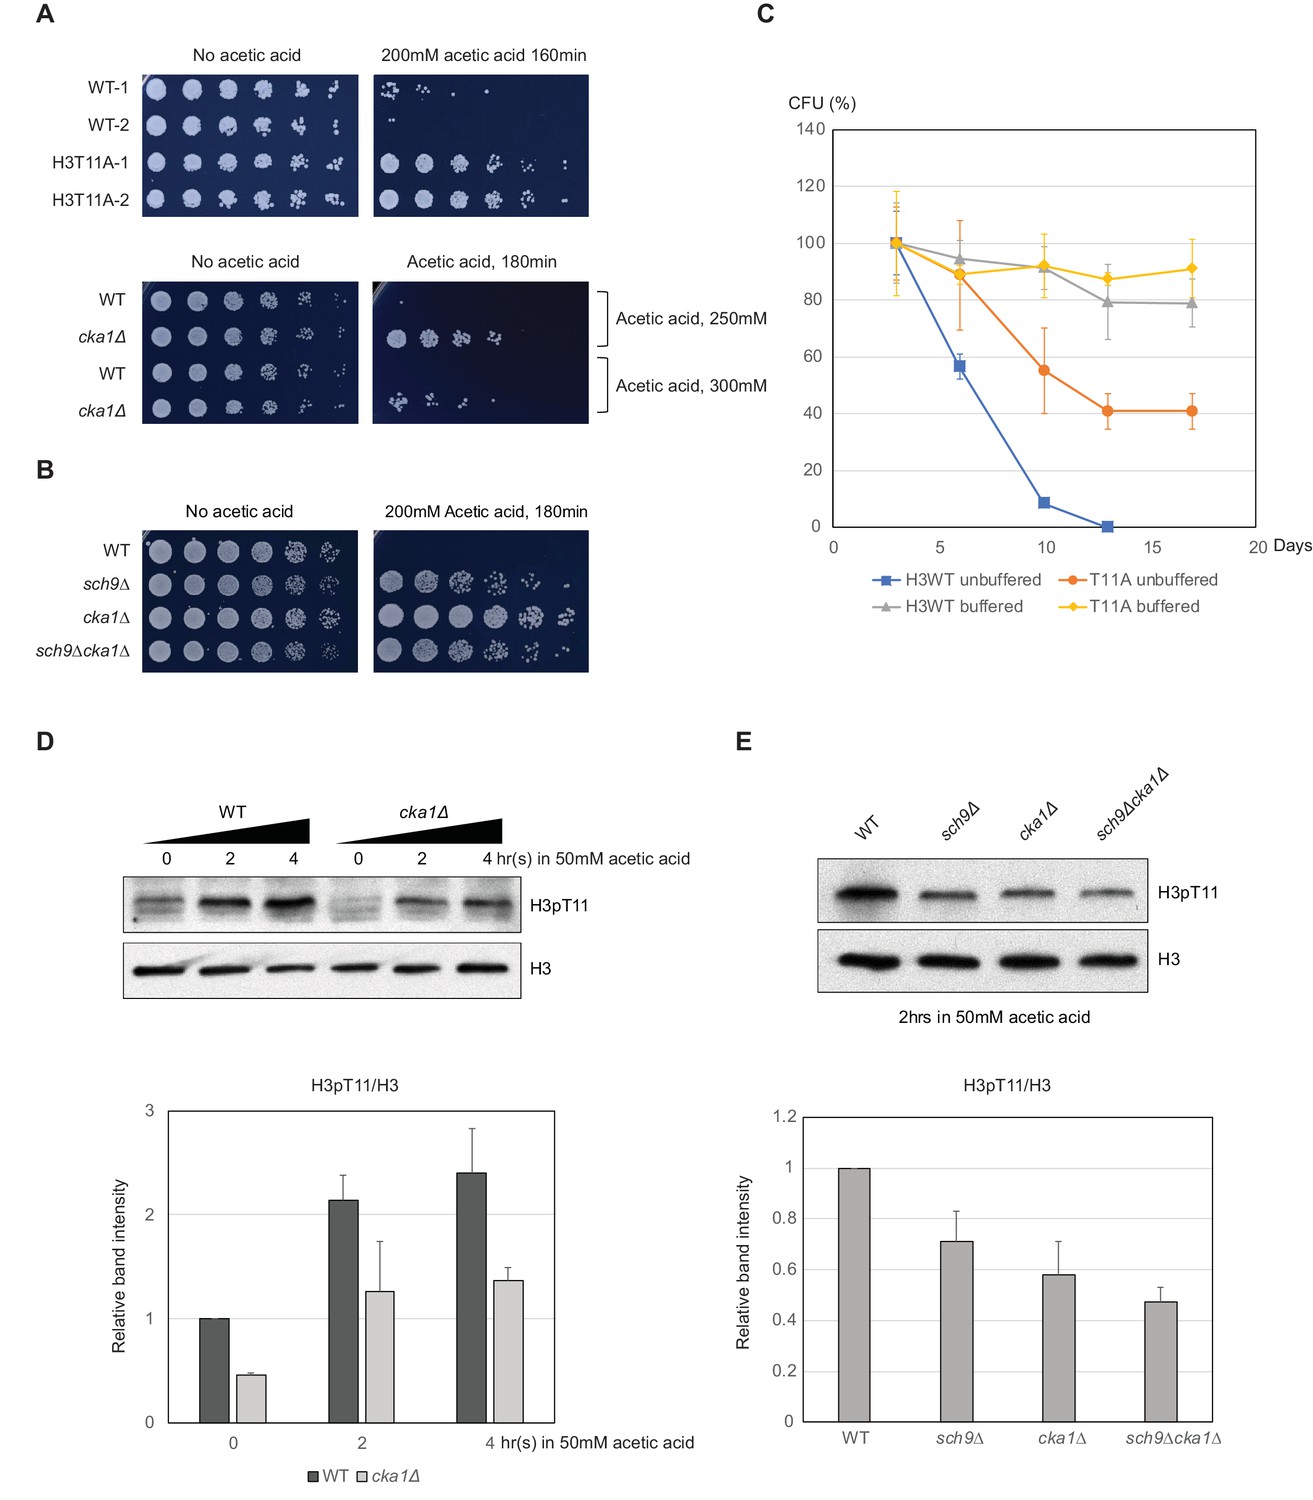
H3pT11 affects CLS by regulation of acetic acid resistance.
(A) Relative viability of H3T11A and cka1Δ mutants compared to their WT strains after exposure to indicated durations and concentrations of acetic acid. (B) Acetic acid resistance of WT, sch9Δ, cka1Δ, and sch9Δcka1Δ. (C) CLS assays of WT and H3T11A strains in buffered (pH 6.0) or unbuffered conditions. (D) H3pT11 levels in WT and cka1Δ upon 50 mM acetic acid addition analyzed by western blots (upper). The relative band intensities of H3pT11 to H3 signals (lower). (E) H3pT11 levels in WT, sch9Δ, cka1Δ, and sch9Δcka1Δ at 2 hr after 50 mM acetic acid treatment analyzed by western blots (upper). The relative ratios of H3pT11 to H3 signals (lower). All error bars indicate STD from three biological replicates.
-
Figure 6—source data 1
CFU values in the CLS assays shown in Figure 6C.
- https://doi.org/10.7554/eLife.36157.018
Figure 6—figure supplement 1

H3pT11 regulates CLS by modulation of acid stress response.
(A) Media pH in WT cultures during CLS assay (B) Media acetate concentration in WT cultures at indicated times. (C) CLS assays of WT and cka1Δ strain cultured in SDC media buffered at pH 6.0. (D) Media glucose concentrations of WT strain cultures in SDC media (no acetic acid) or SDC media supplemented with 10 or 50 mM acetic acid. ‘0 hr’ refers to the time at which acetic acid was added. From (A) to (D), All error bars indicate standard deviation (STD) of three biological replicates. (E) H3pT11 levels in WT strain upon treatment of 10 or 50 mM acetic acid measured by Western blots.
Figure 7
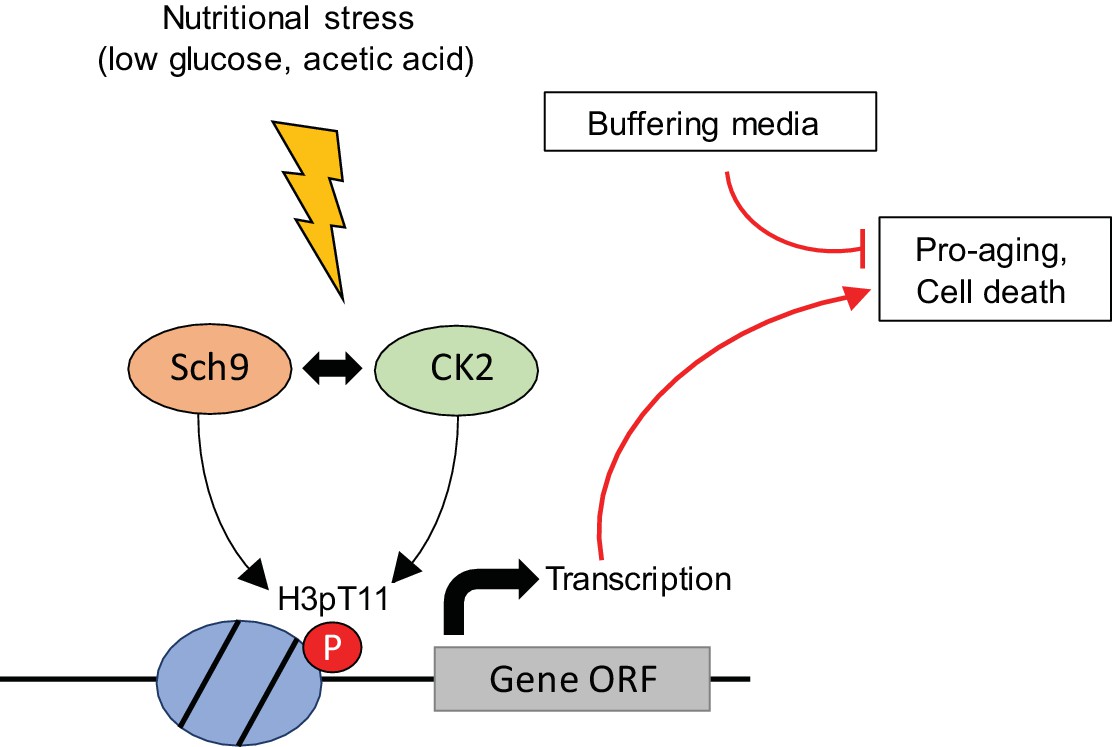
Summary models of H3pT11 functions upon stress conditions.
Additional files.
Author Response Image 1
<>
https://doi.org/10.7554/eLife.36157.023Tables
Key resources table
| Reagent type (species) or resource | Designation | Source and reference | Identifiers |
|---|---|---|---|
| Strain, strain background (S. cerevisiae) | Strain background: BY4741 | Open Biosystems | Cat#YSC1048 |
| Strain, strain background (S. cerevisiae) | Strain background: BY4742 | Open Biosystems | Cat#YSC1049 |
| Strain, strain background (S. cerevisiae) | Strain background: YBL574 | Nakanishi et al. 2008, PMID: 18622391 | N/A |
| Antibody | Anti H3pT11 | Abcam | Cat# ab5168, RRID:AB_304759 |
| Antibody | Anti H3 | Abcam | Cat#Ab1791 RRID:AB_302613 |
| Antibody | Anti H3K4me3 | EMD Millipore | Cat#07–473 RRID:AB_1977252 |
| Antibody | Anti H4K16ac, Rabbit polyclonal | Huang et al., 2014 PMID: 25512562 | N/A |
| Antibody | Anti CBP, Rabbit polyclonal | Venkatesh et al., 2012 PMID: 22914091 | N/A |
| Recombinant DNA reagent | pFA6A-NatMX6 | Euroscarf | Cat#P30437 |
| Recombinant DNA reagent | pFA6a-6xGLY-V5- kanMX6 | Addgene | Cat#20780 |
| Commercial assay or kit | KAPA HTP library prep kit | KAPA Biosystems | Cat#KK8234 |
| Commercial assay or kit | TruSeq Stranded Total RNA Library Prep Kit with Ribo-Zero Gold set B | Illumina | Cat#RS-122–2302 |
| Commercial assay or kit | HiSeq SR Cluster Kit v4 cBot | Illumina | Cat#GD-401–4001 |
| Commercial assay or kit | HiSeq SBS Kit v4 (50 cycles) | Illumina | Cat#FC-401–4001 |
| Commercial assay or kit | Glucose Colorimetric Detection Kit | ThermoFisher Scientific | Cat#EIAGLUC |
| Commercial assay or kit | Acetate Colorimetric Assay Kit | Sigma-Aldrich | Cat#MAK086 |
| Software, algorithm | bcl2fastq 1.8.4 | Illumina | RRID:SCR_015058 |
| Software, algorithm | bowtie2 (2.2.0) | PMID: 22388286 | RRID:SCR_005476 |
| Software, algorithm | R (3.2.2) | https://www.R-project.org/. | RRID:SCR_001905 |
| Software, algorithm | DiffBind (2.0.9) | PMID: 22217937 | RRID:SCR_012918 |
| Software, algorithm | bedtools (2.26.0) | PMID: 20110278 | RRID:SCR_006646 |
| Software, algorithm | tophat (2.0.13) | PMID: 23618408 | RRID:SCR_013035 |
| Software, algorithm | edgeR (3.14.0) | PMID: 19910308 | RRID:SCR_012802 |
| Software, algorithm | UCSC genome browser | PMID: 26590259 | RRID:SCR_005780 |
Additional files
-
Supplementary file 1
Yeast strains used in this study.
- https://doi.org/10.7554/eLife.36157.020
-
Transparent reporting form
- https://doi.org/10.7554/eLife.36157.021
Download links
A two-part list of links to download the article, or parts of the article, in various formats.
Downloads (link to download the article as PDF)
Open citations (links to open the citations from this article in various online reference manager services)
Cite this article (links to download the citations from this article in formats compatible with various reference manager tools)
Histone H3 threonine 11 phosphorylation by Sch9 and CK2 regulates chronological lifespan by controlling the nutritional stress response
eLife 7:e36157.
https://doi.org/10.7554/eLife.36157


