Prognostication of chronic disorders of consciousness using brain functional networks and clinical characteristics
- Chinese Academy of Sciences, China
- PLA Army General Hospital, China
- Guangzhou General Hospital of Guangzhou Military Command, China
- University of Electronic Science and Technology of China, China
- University of Queensland, Australia
Figures
Figure 1
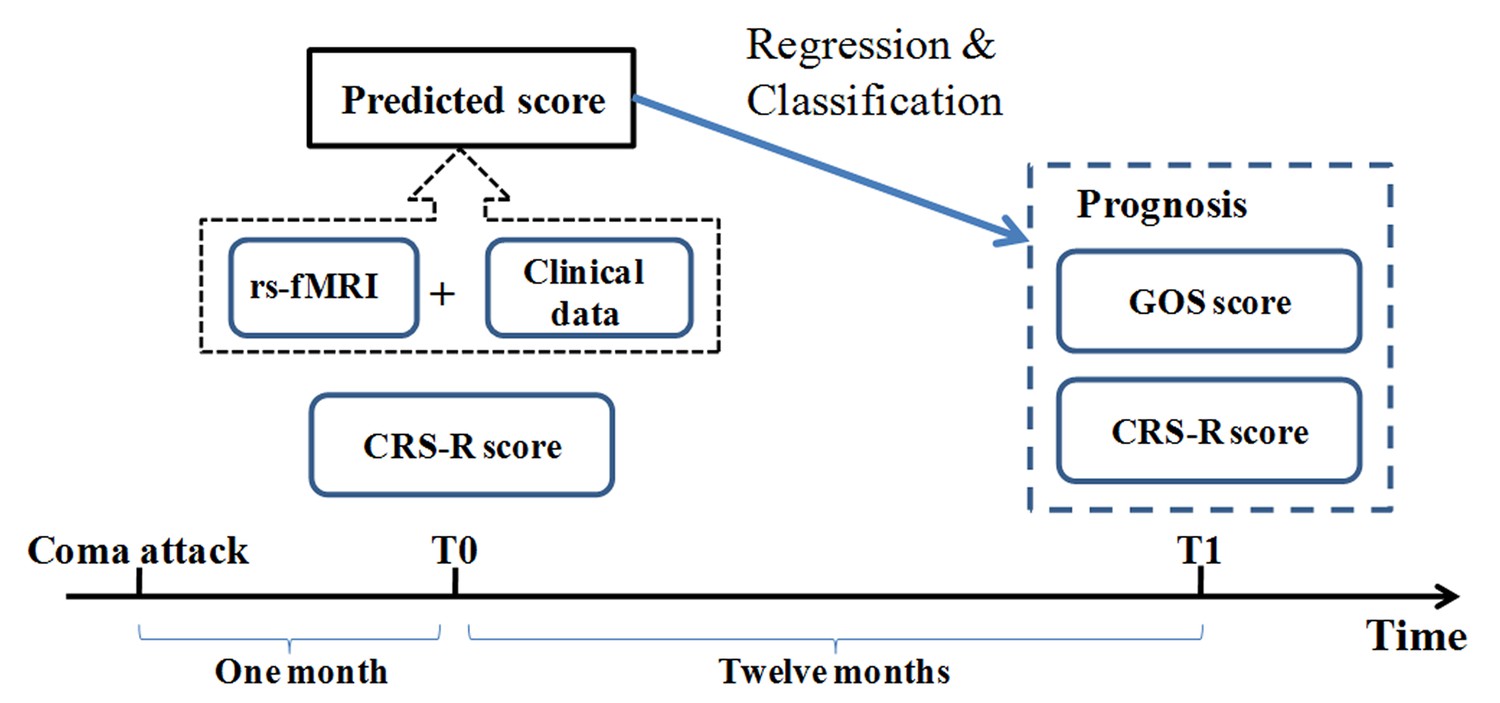
Conceptual paradigm of the study.
CRS-R: Coma Recovery Scale Revised scale; GOS: Glasgow Outcome Scale.
Figure 2
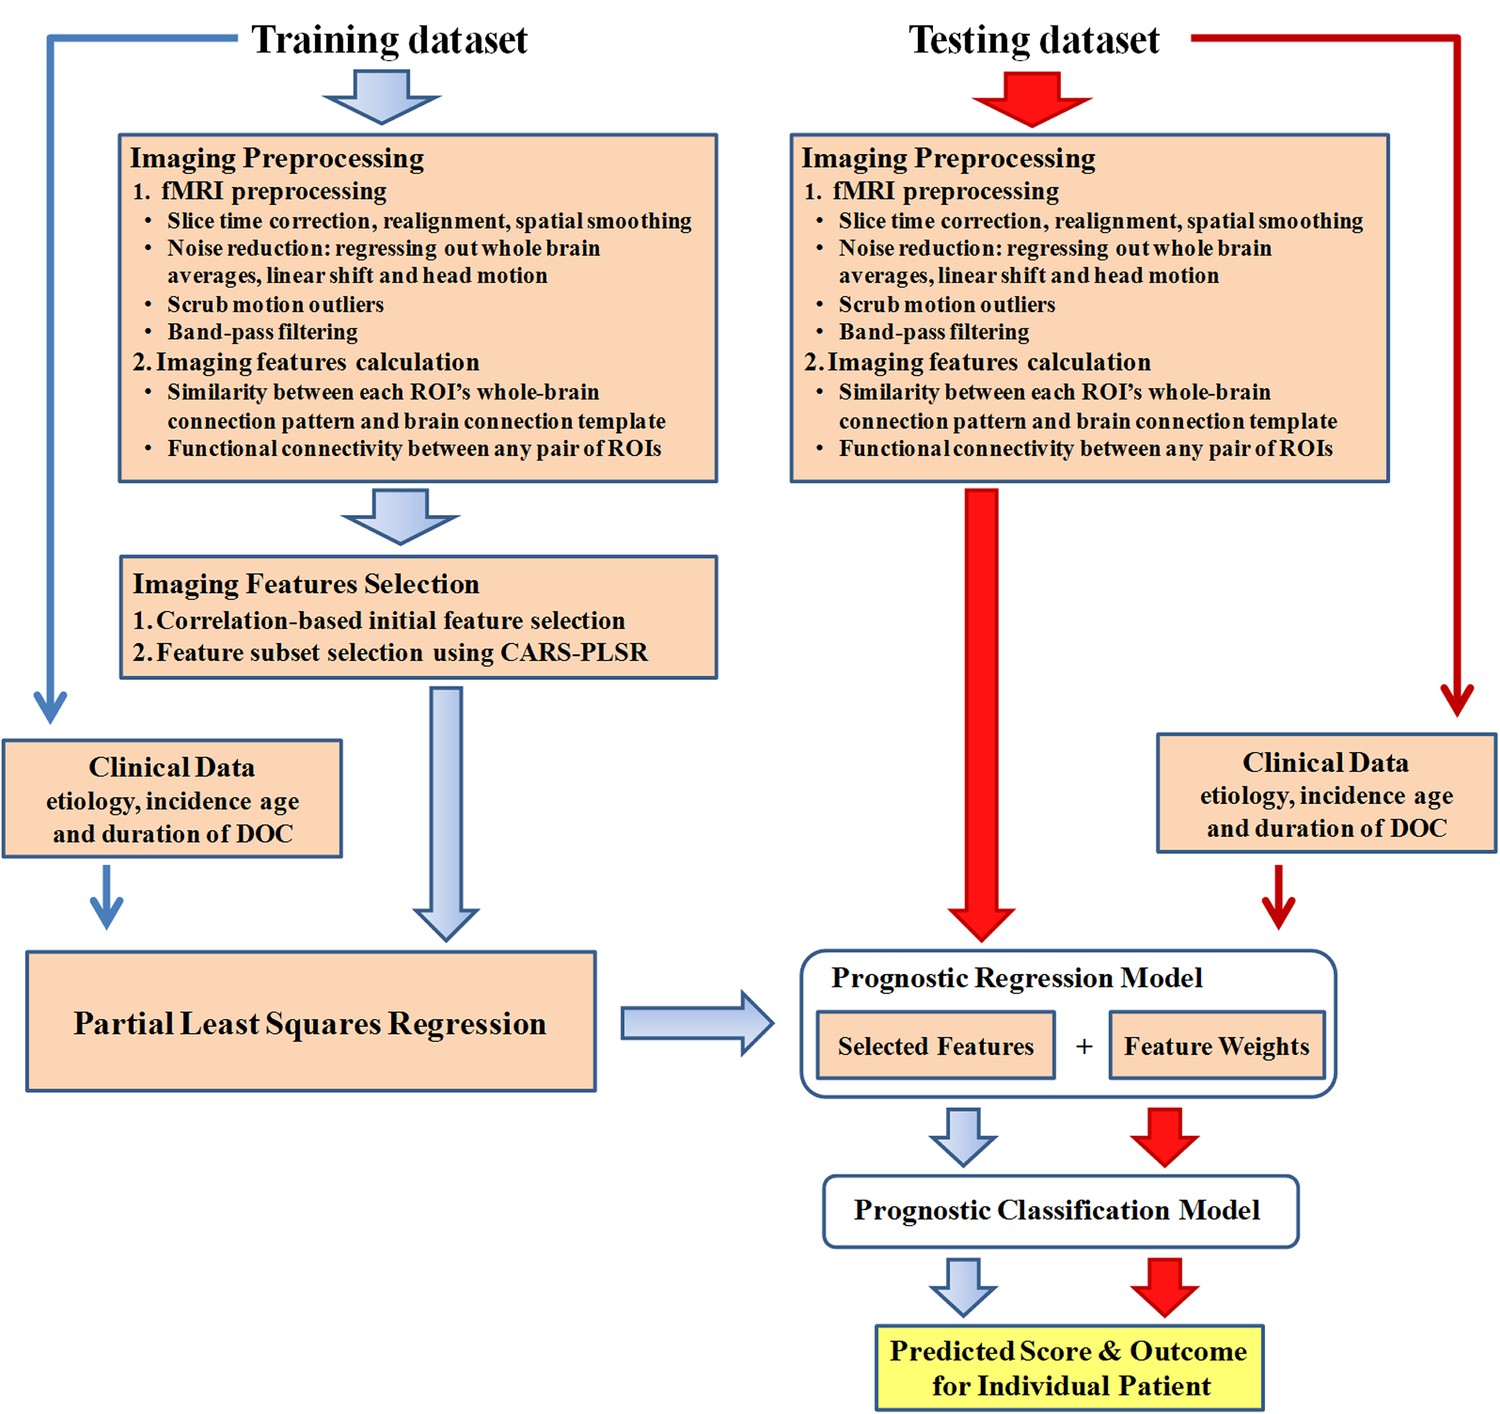
Data analysis pipeline.
All datasets involved in this study included resting state fMRI and clinical data. For the fMRI data in the training dataset, data analysis first encompassed preprocessing and imaging feature selection and extraction. Partial least square regression was then used to generate the regression model using the selected imaging features and clinical features in the training dataset. In this way, a prediction score that depicts the possibility of consciousness recovery was computed for each patient. The optimal cut-off value for classifying an individual patient as responsive or non-responsive was then calculated, and the prognostic classification model was obtained. The two testing datasets were only used to validate externally the regression and classification model.
Figure 3
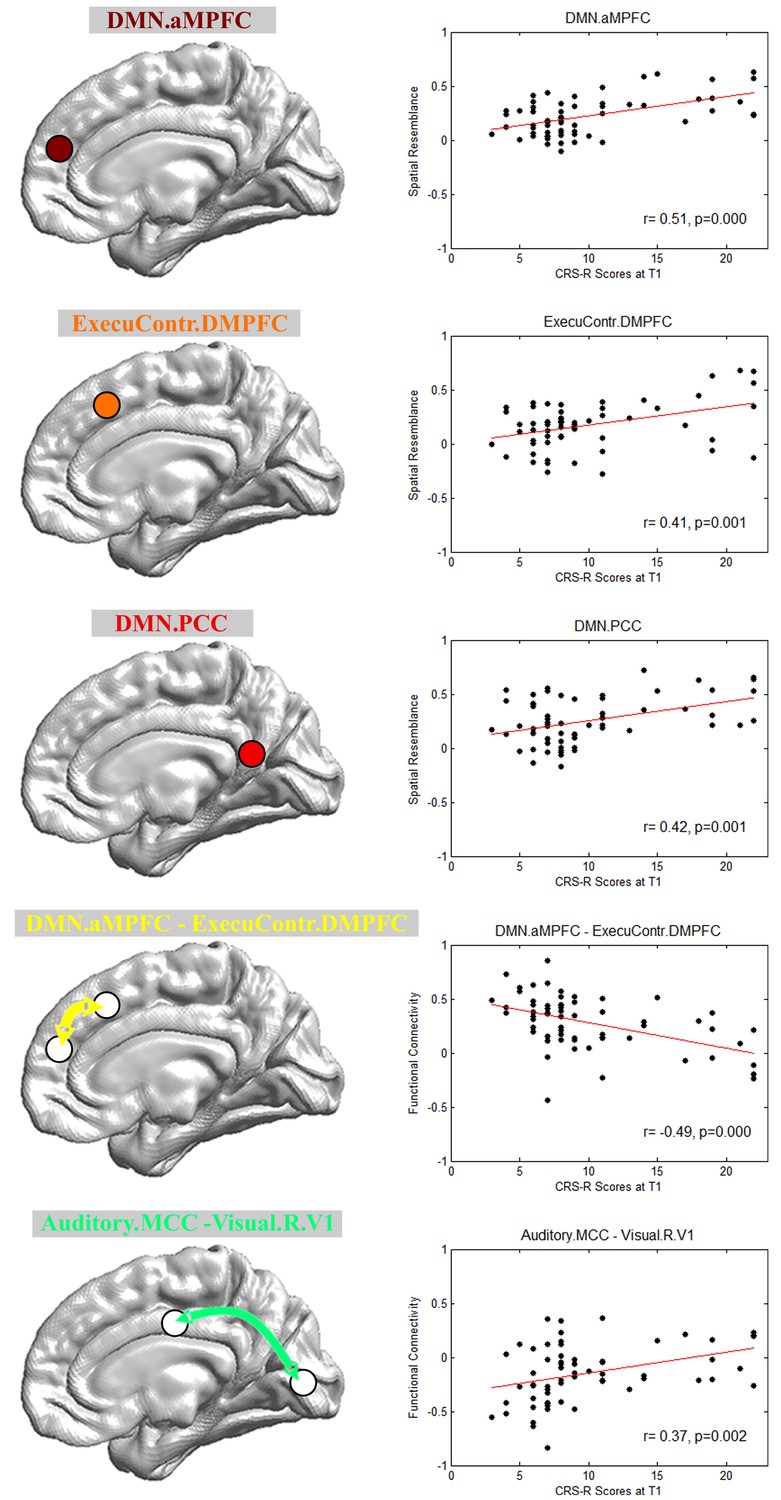
Imaging features involved in the prognostic regression model.
DMN.aMPFC, anterior medial prefrontal cortex in the default mode network; DMN.PCC, posterior cingulate cortex/precuneus in the default mode network; ExecuContr.DMPFC, dorsal medial prefrontal cortex in the executive control network; Auditory.MCC, middle cingulate cortex in the auditory network; Visual.R.V1, right lateral primary visual cortex in the visual network. DMN.aMPFC—ExecuContr.DMPFC: the functional connectivity between DMN.aMPFC and ExecuContr.DMPFC; Auditory.MCC—Visual.R.V1: the functional connectivity between Auditory.MCC and Visual.R.V1.
Figure 4
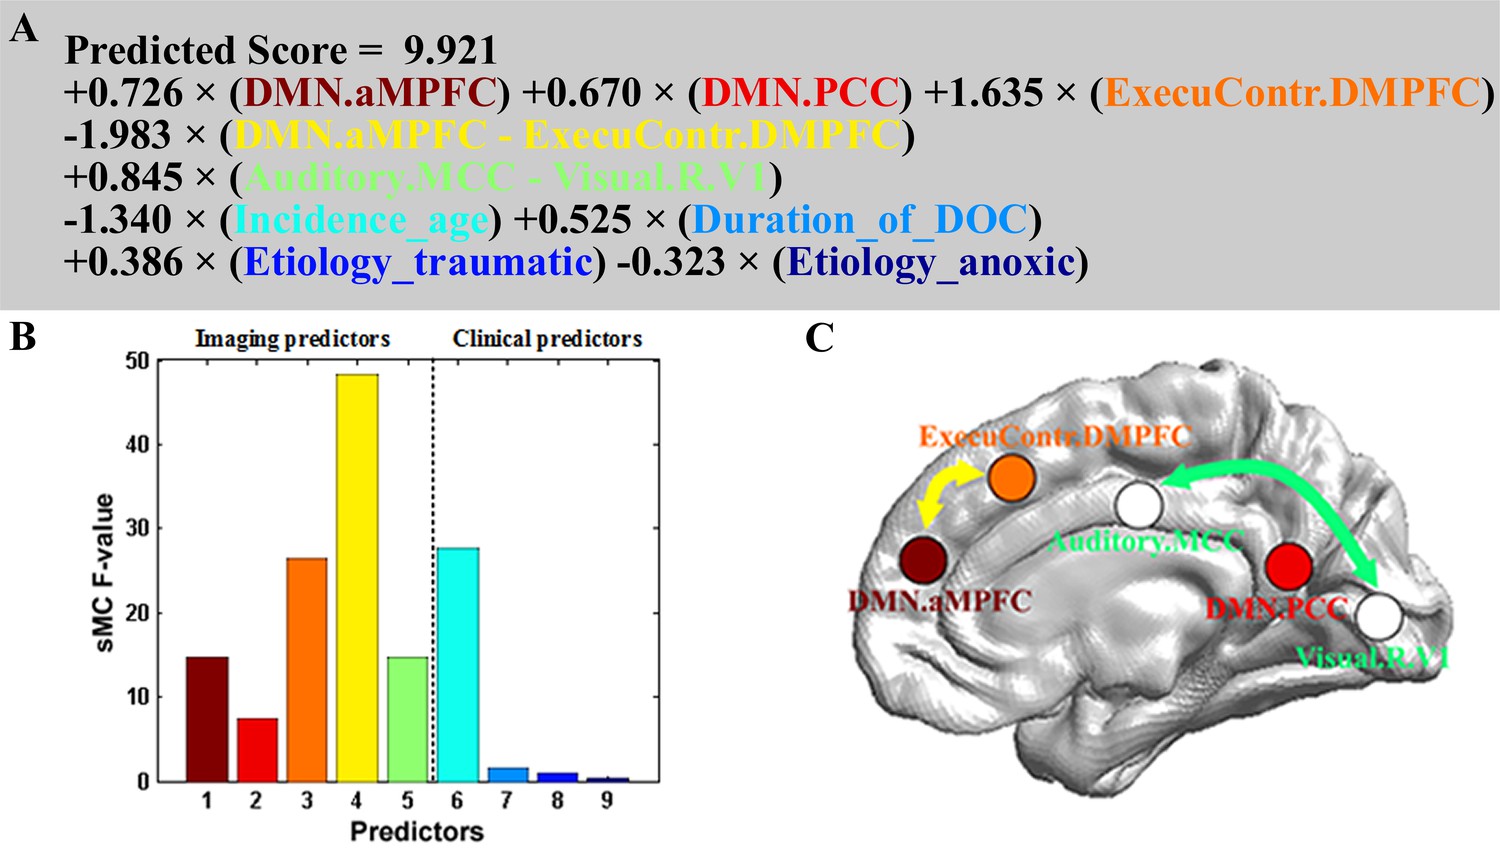
Prognostic regression model.
In the three subplots, each color denotes a particular predictor. (A) Regression formula. (B) Predictor importance for each predictor in prognostic regression model. The vertical axis represents the sMC F-test value. The larger the sMC F-value, the more informative the predictor with respect to the regression model. (C) The imaging features in the model are rendered on a 3D surface plot template in medial view.
Figure 5
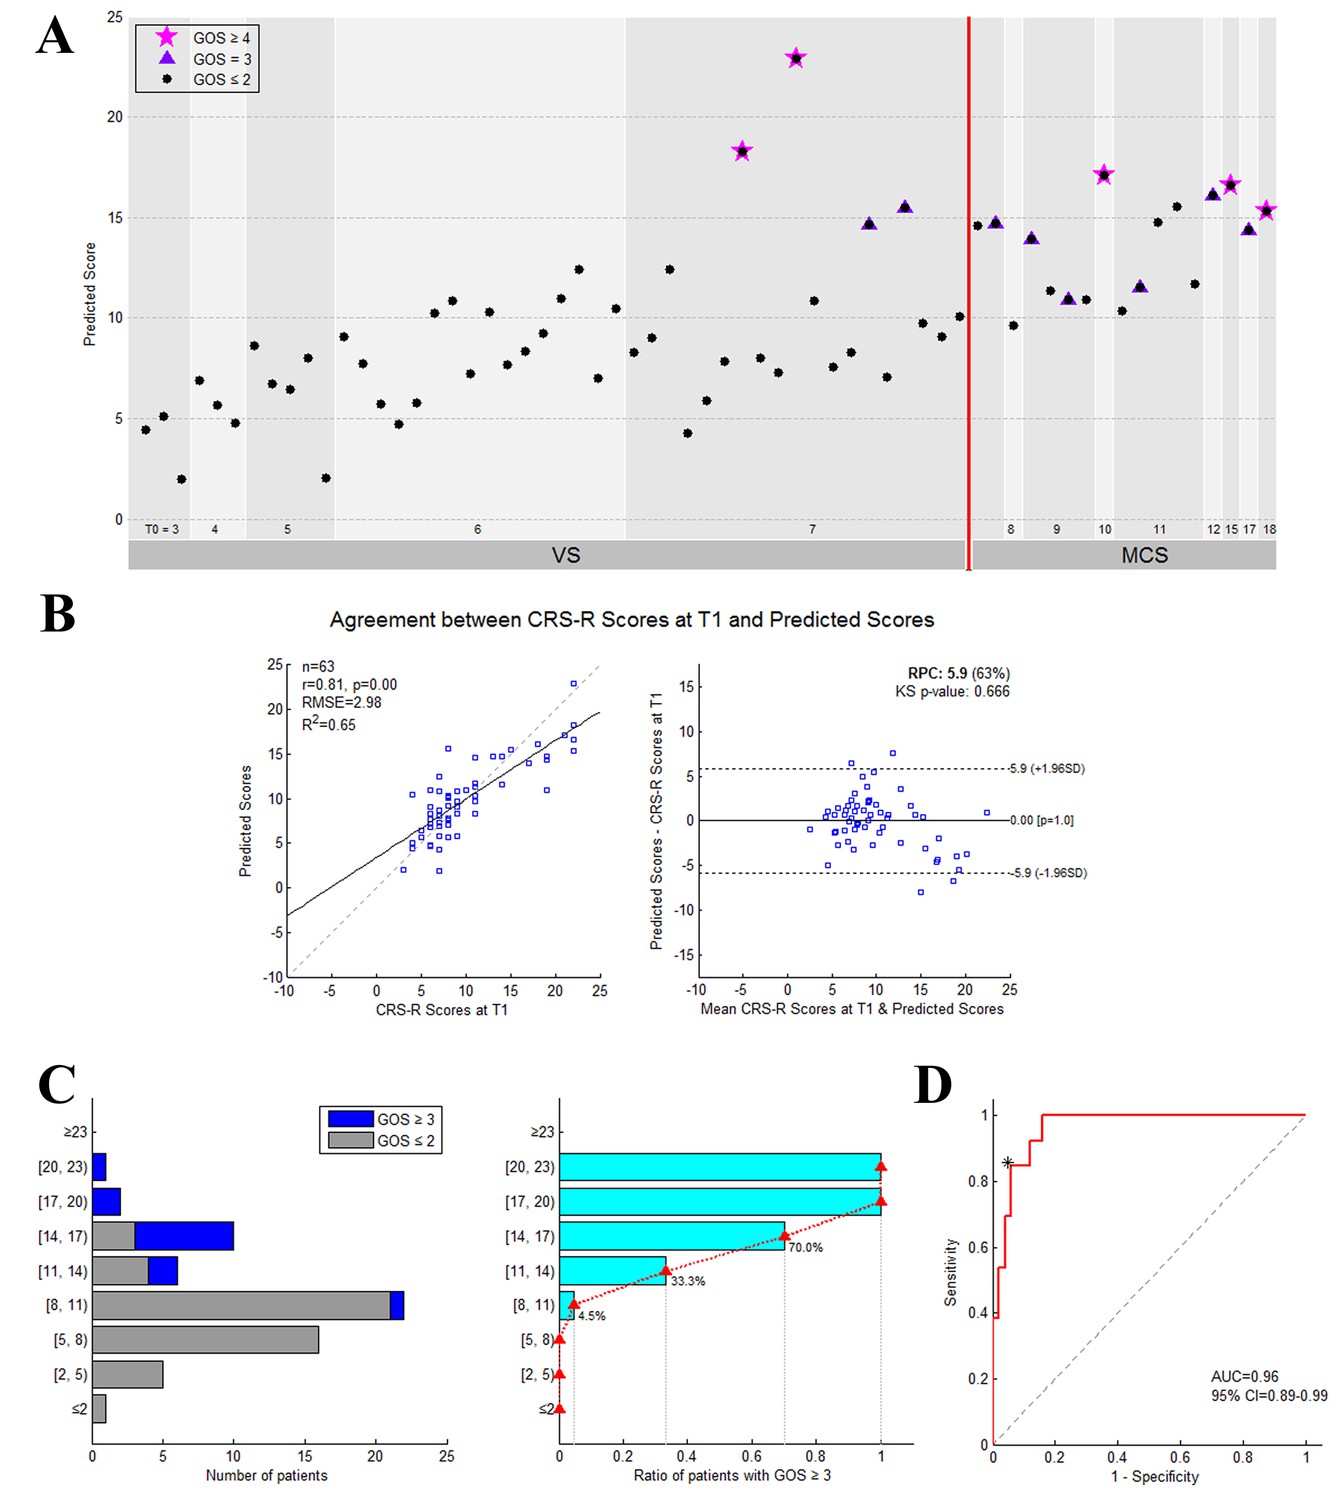
The performance of the prediction model on the training dataset.
(A) Individual predicted scores for each DOC patient in the training dataset. The CRS-R score at the T0 time point is shown on the x axis and the predicted score on the y axis. The patients diagnosed as VS/UWS at the T0 time point are shown to the left of the vertical red solid line, whereas the patients diagnosed as MCS at this time point are shown to the right. The purplish red pentagram, imperial purple triangle and blank circle mark the patients with a GOS score ≥4,=3 and≤2, respectively, at the T1 time point. (B) Agreement between the CRS-R scores at the T1 time point and the predicted scores. The left panel shows the correlation between the CRS-R scores at the T1 time point and the predicted scores, and the right panel shows the differences between them using the Bland-Altman plot. (C) Bar chart showing the numbers or proportions of DOC patients in each band of predicted scores. In these two panels, the y axis shows the predicted score. (D) The area under the receiver-operating characteristic (ROC) curve. The star on the curve represents the point with the maximal sum of true positive and false negative rates on the ROC curve, which were chosen as the cut-off threshold for classification. Here, the corresponding predicted score = 13.9.
Figure 6

The performance of the prediction model on the two testing datasets.
(A) The individual predicted score (top panel) and agreement between the CRS-R scores at the T1 time point and the predicted scores (bottom panel) for the testing dataset ‘Beijing HDxt’. (B) The individual predicted score for each DOC patient in the testing dataset ‘Guangzhou HDxt’. The legend description is the same as for Figure 5.
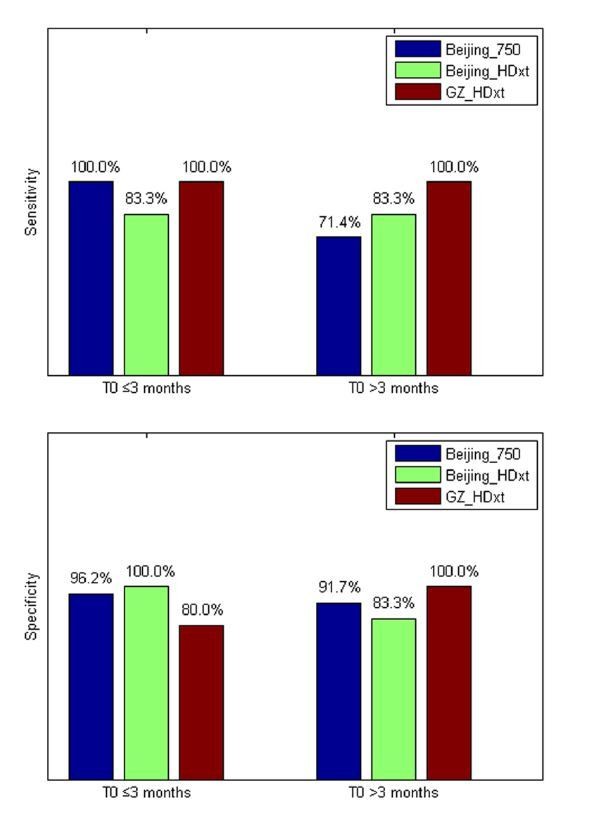
Figure 7
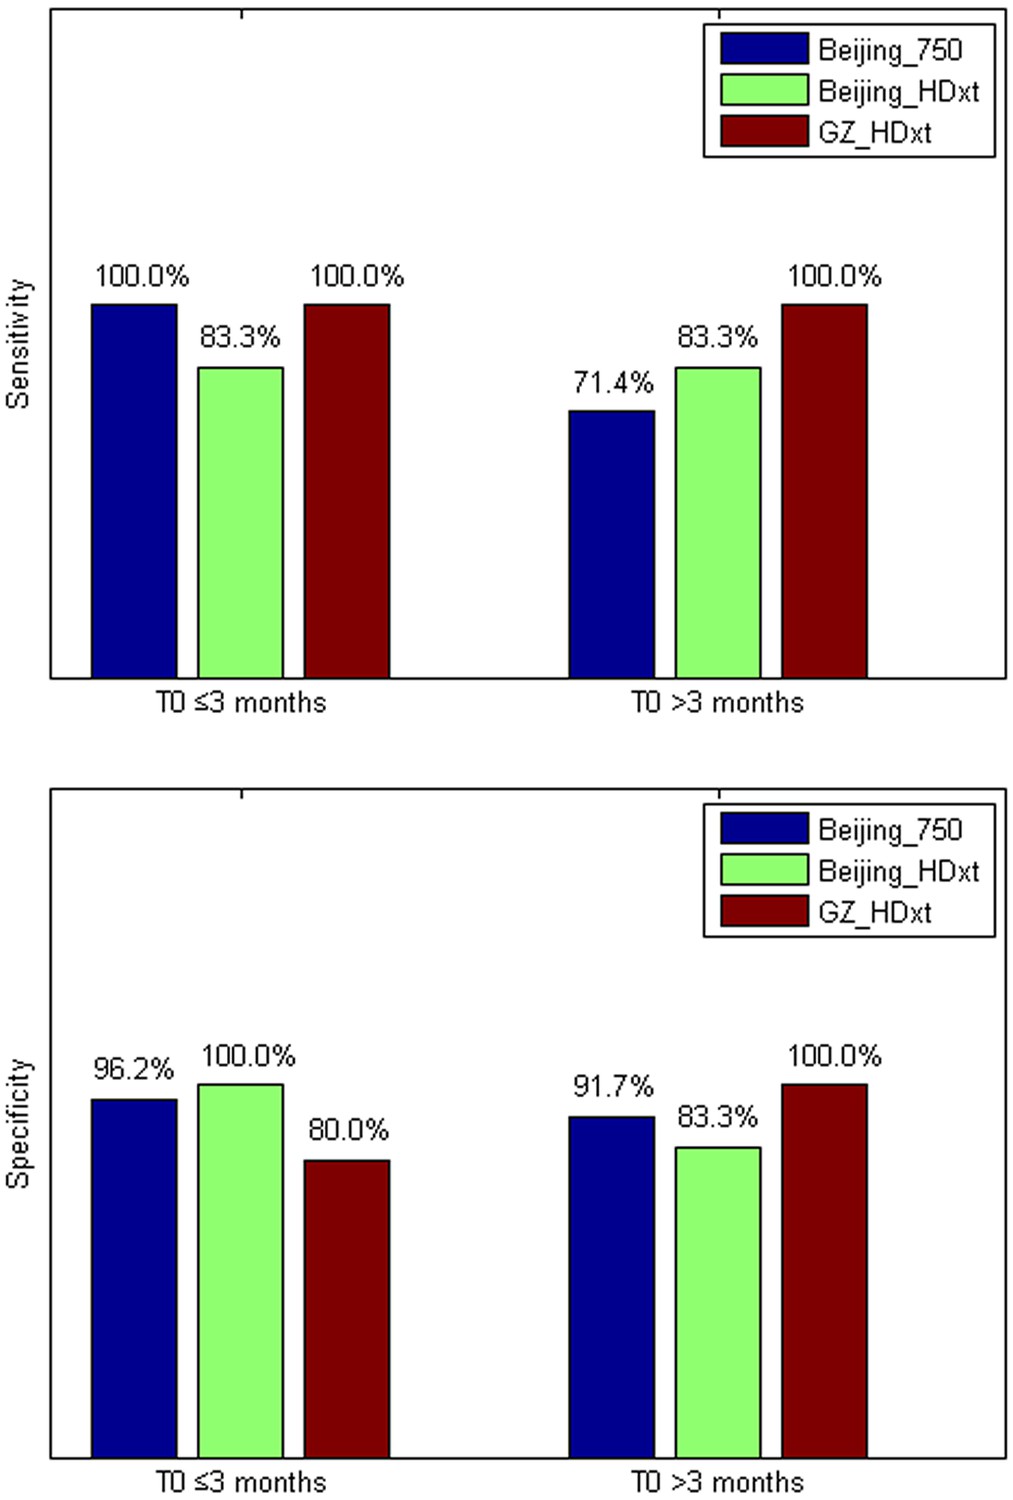
The sensitivity and specificity in the ‘subacute’ patients (i.e. duration of unconsciousness T0 ≤3 months) and those in the chronic phase (i.e. duration of unconsciousness T0 >3 months), respectively.
https://doi.org/10.7554/eLife.36173.010
Appendix 3—figure 1
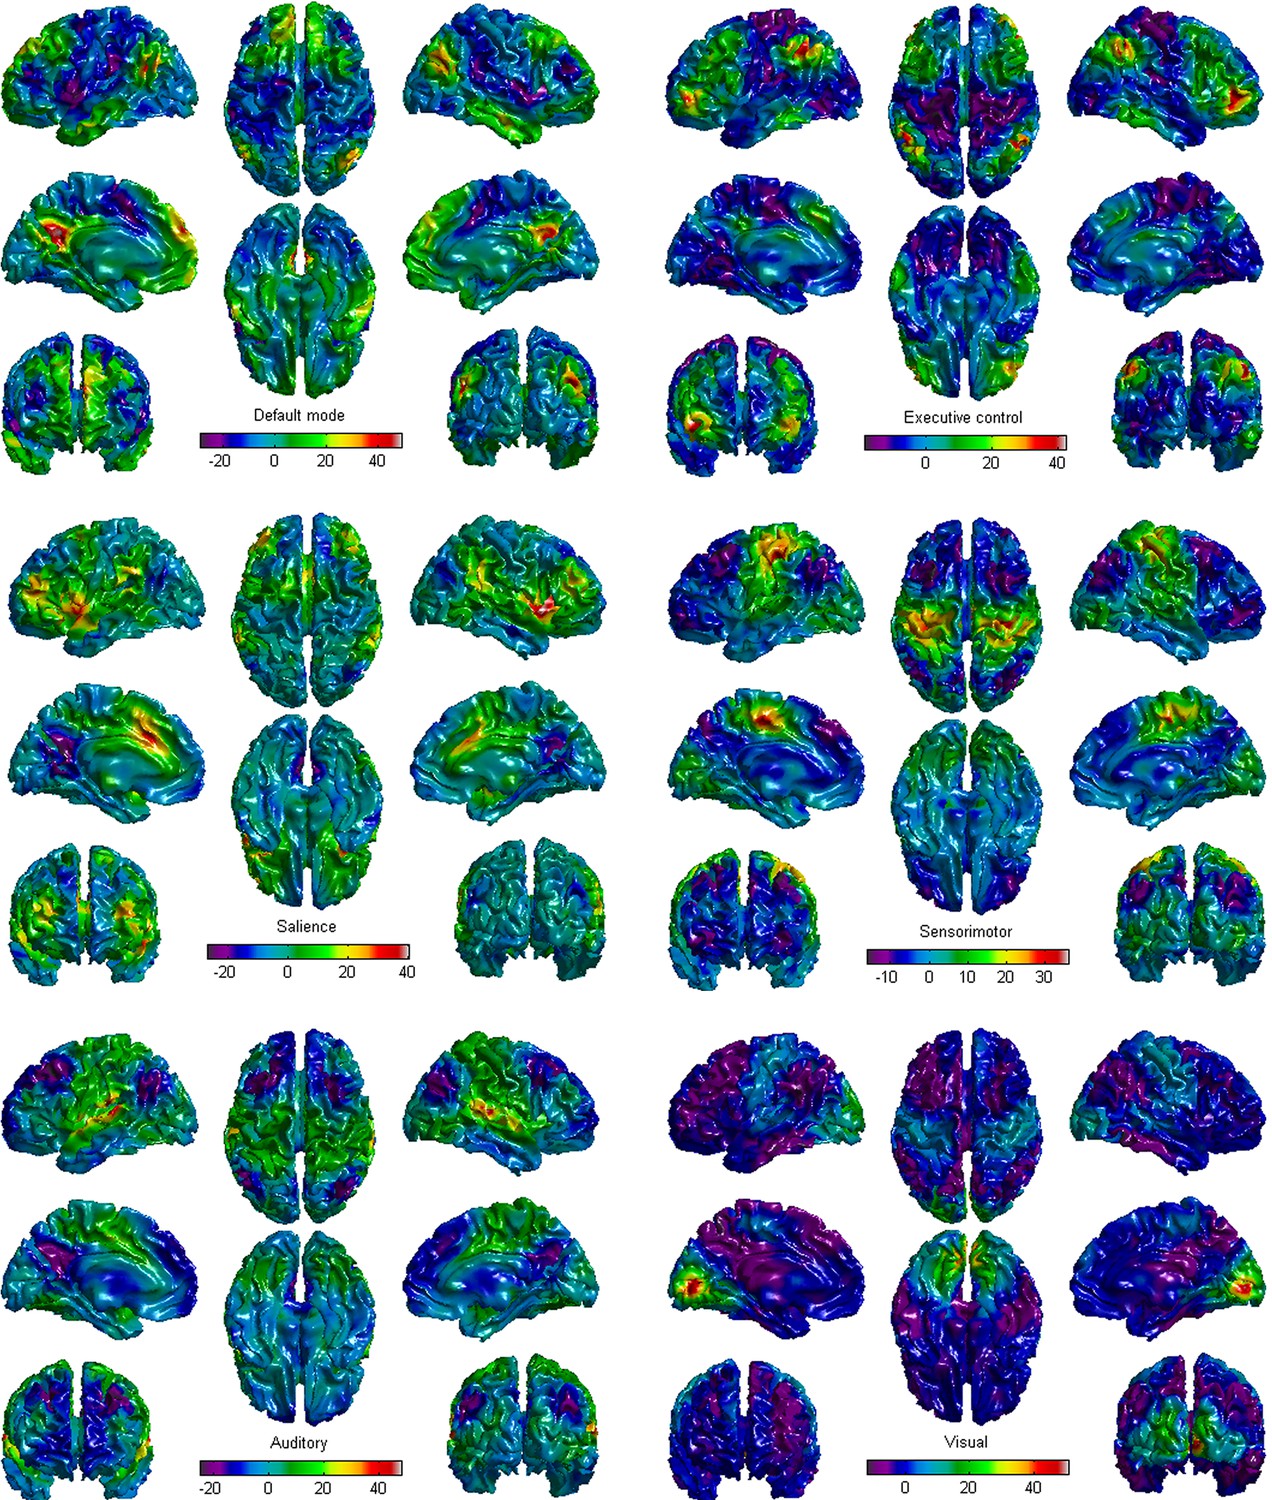
The six brain functional network templates in this study.
https://doi.org/10.7554/eLife.36173.023
Appendix 4—figure 1
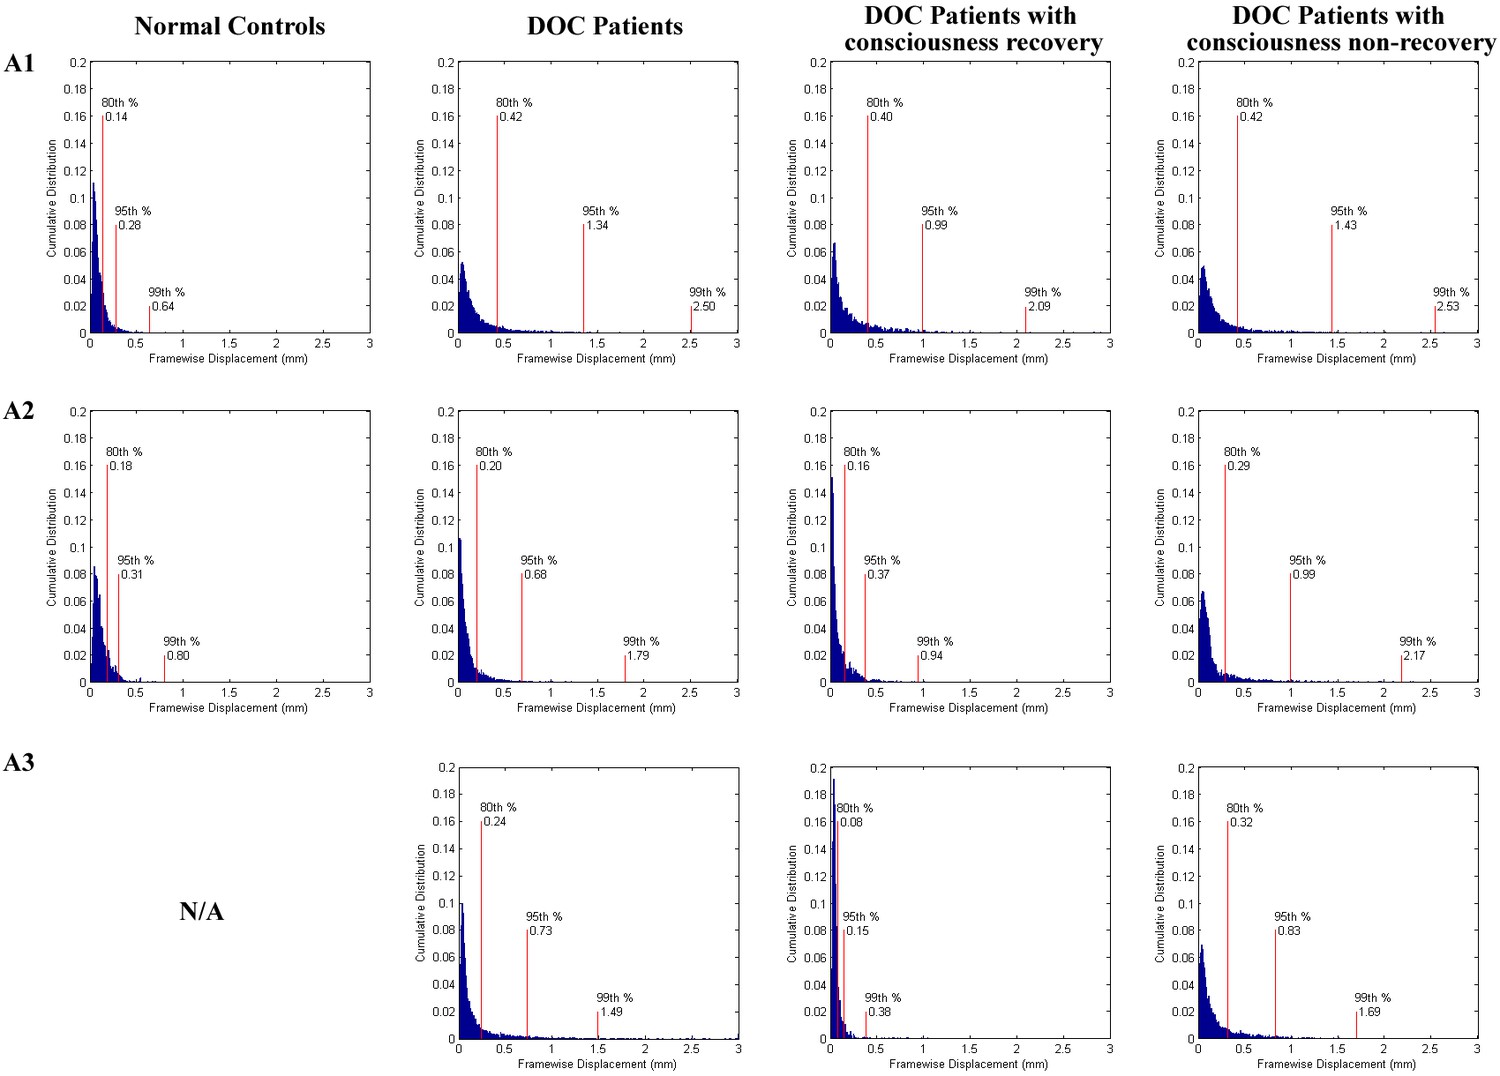
Cumulative distribution of head motion per volume (framewise displacement) for normal controls and DOC patients separately in the training dataset ‘Beijing 750’ (A1), the testing dataset ‘Beijing HDxt’ (A2), and the testing dataset ‘Guangzhou HDxt’ (A3).
The normal controls were shown in left column, whereas the DOC patients were shown in right column. No healthy control data were available for the Guangzhou centre. In both patients and controls, head position was stable to within 1.5 mm for the vast majority (>95%) of brain volumes.
Appendix 4—figure 2
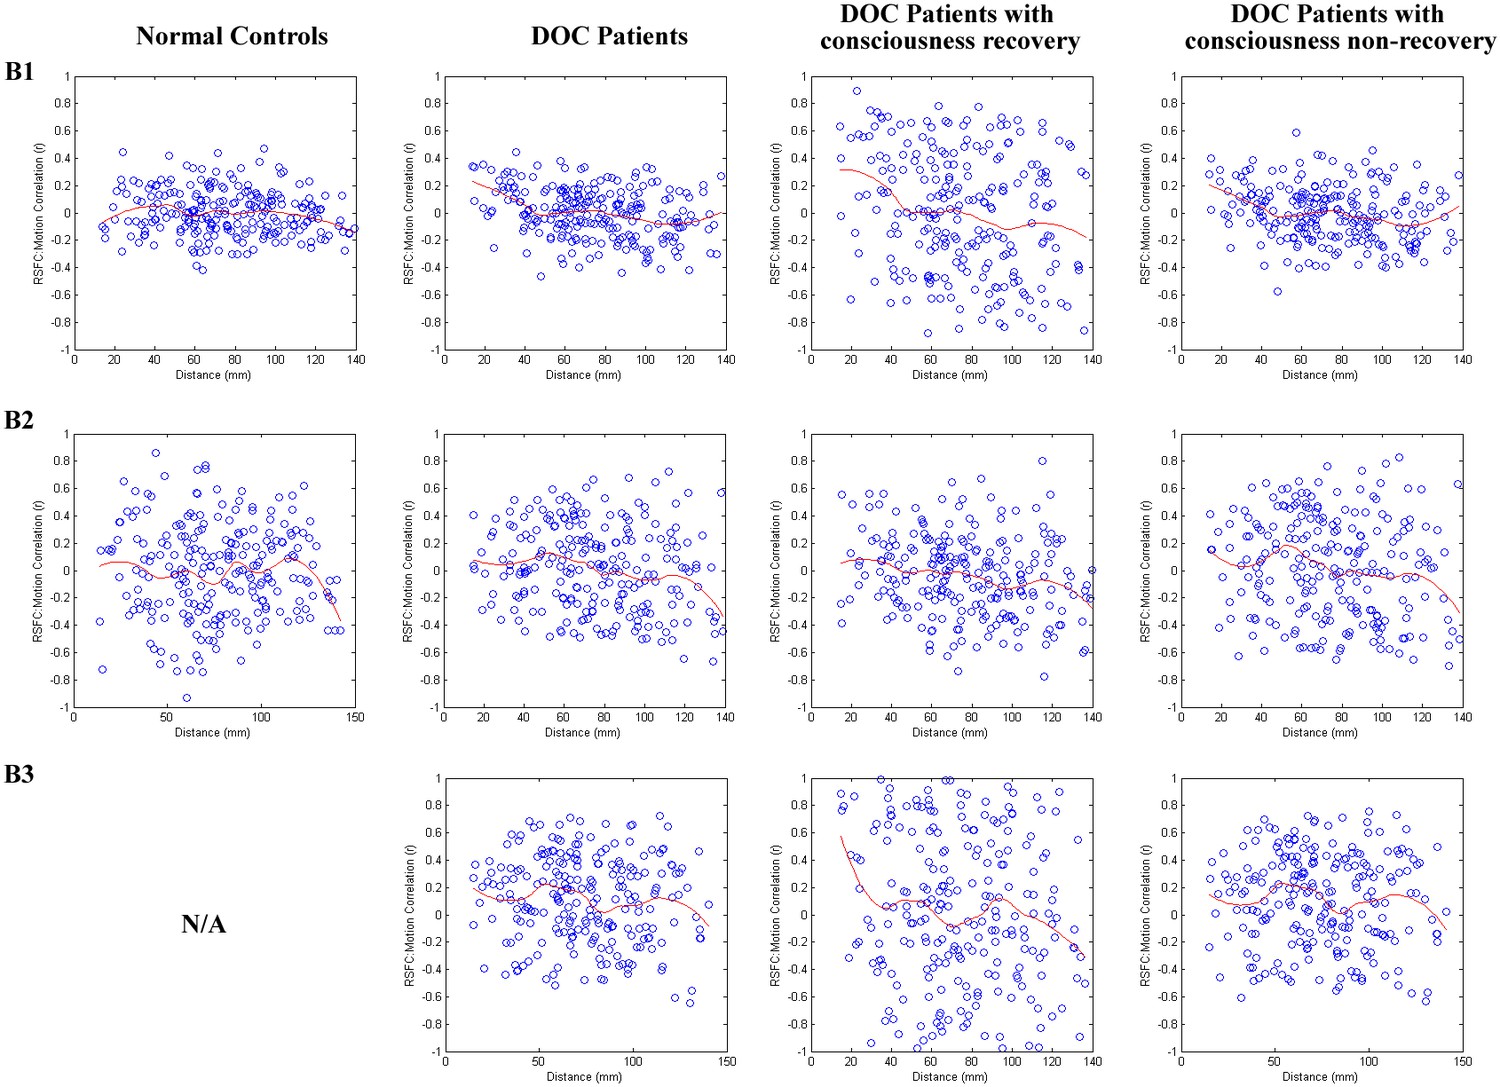
Correlations between motion artifact and neuroanatomical distance between the ROIs in this study.
Prior studies have shown that motion artifacts tend to vary with neuroanatomical distance between brain nodes. Here, we conducted quality control analyses as described in the previous study (Power et al., 2015). Specifically, we computed correlations between head motion (mean FD) and each resting state functional connectivity (RSFC) feature and plotted them as a function of neuroanatomical distance (mm) for subjects in the training dataset ‘Beijing 750’ (B1), the testing dataset ‘Beijing HDxt’ (B2), and the testing dataset ‘Guangzhou HDxt’ (B3). Smoothing curves (in red) were plotted using a moving average filter.
Appendix 4—figure 3
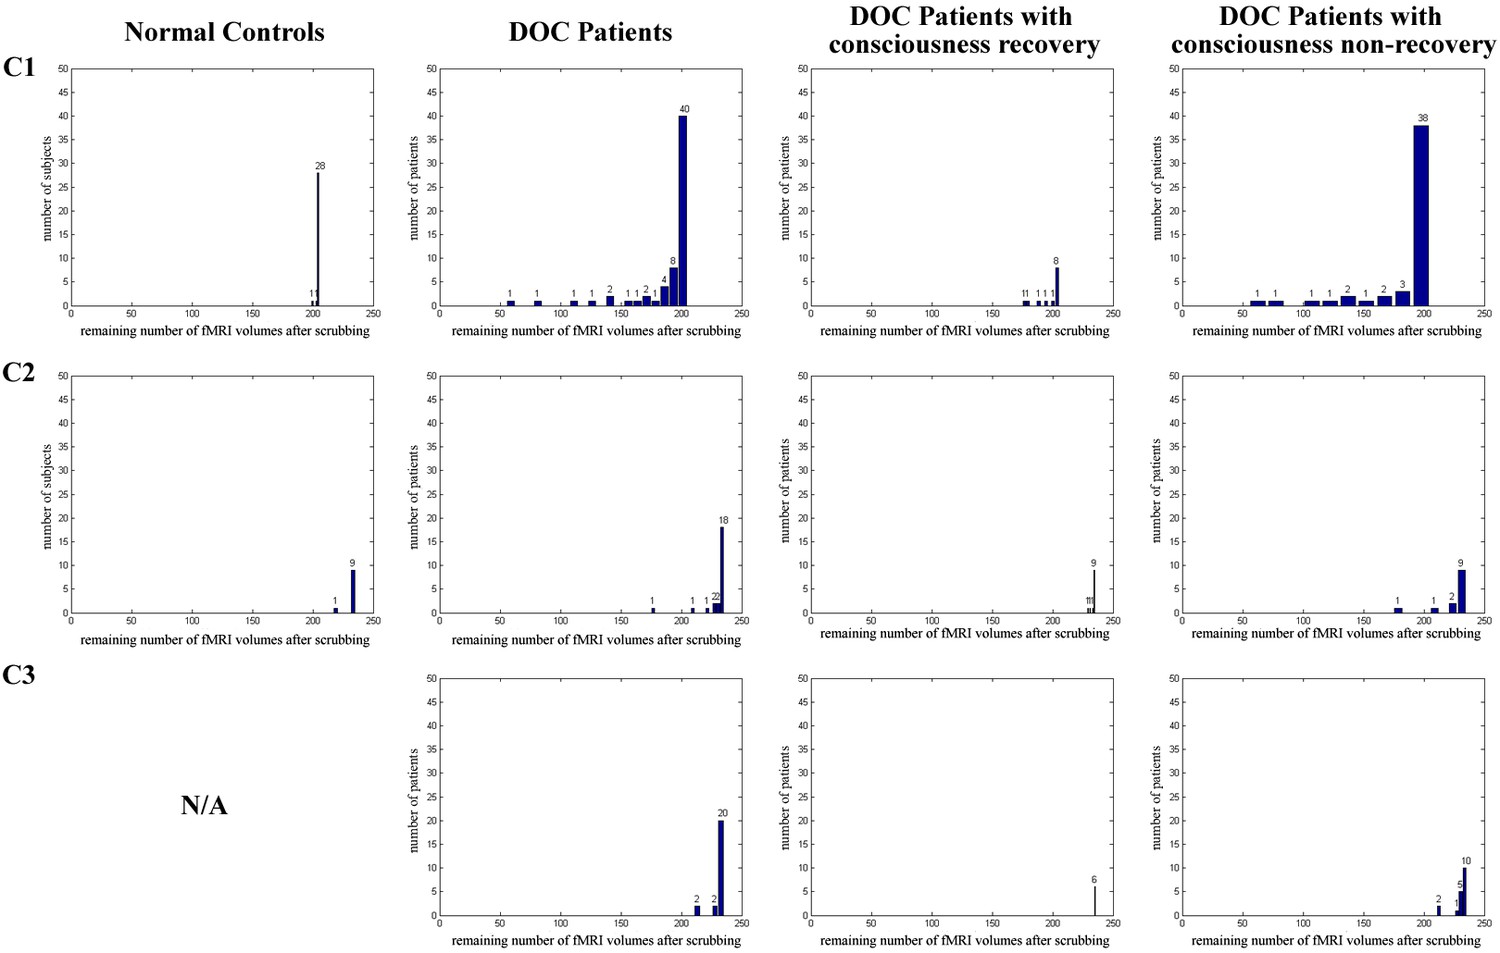
Histogram of the remaining number of fMRI volumes after scrubbing for each population, specifically ‘Beijing 750’ datatset (C1), ‘Beijing HDxt’ dataset (C2), and ‘Guangzhou HDxt’ dataset (C3).
https://doi.org/10.7554/eLife.36173.027
Appendix 6—figure 1
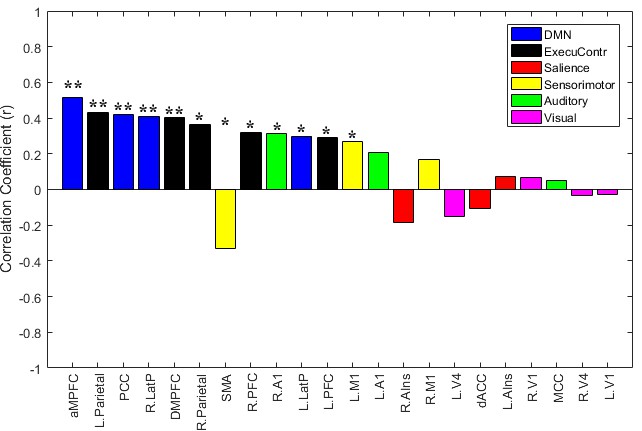
The brain area connection features sorted by their Pearson's correlations to the CRS-R scores at the T1 time point in the training dataset ‘Beijing 750’.
https://doi.org/10.7554/eLife.36173.030
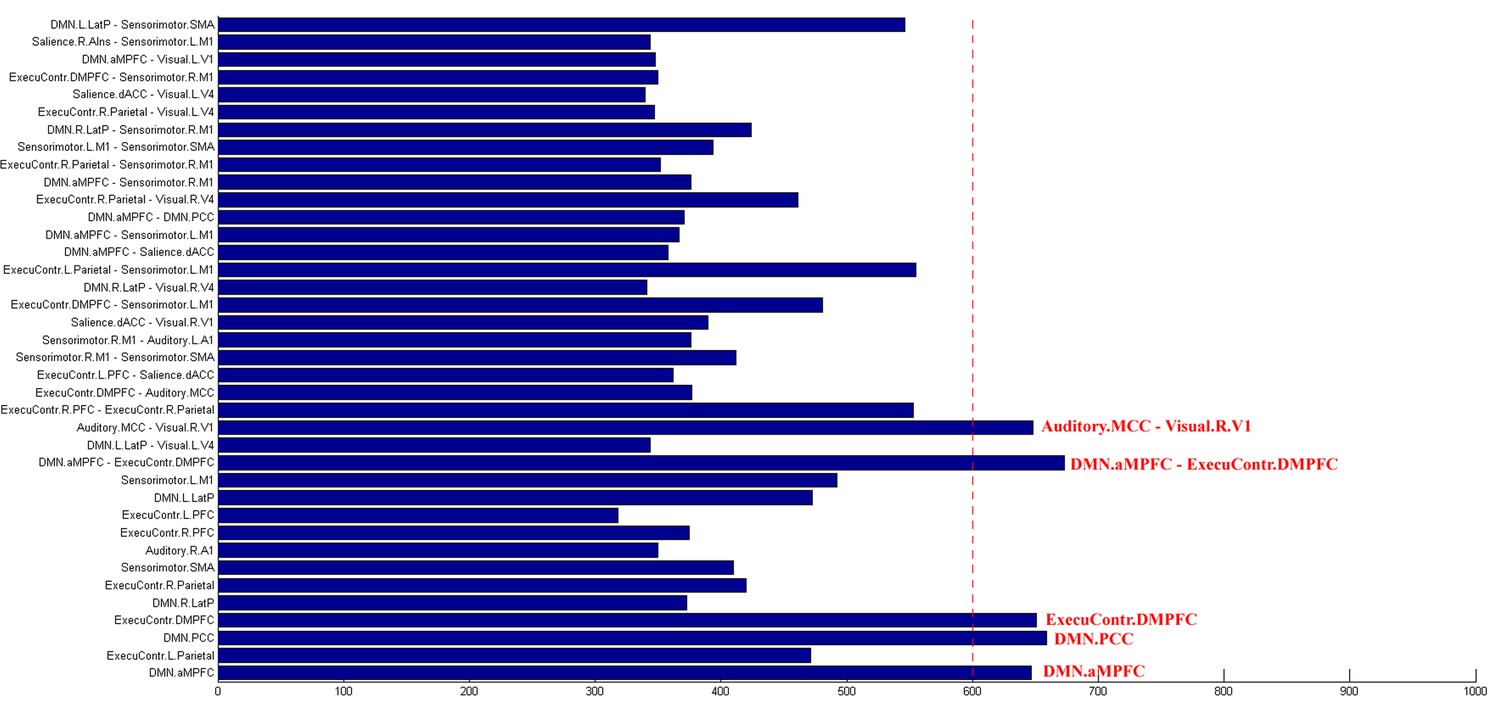
Appendix 6—figure 2
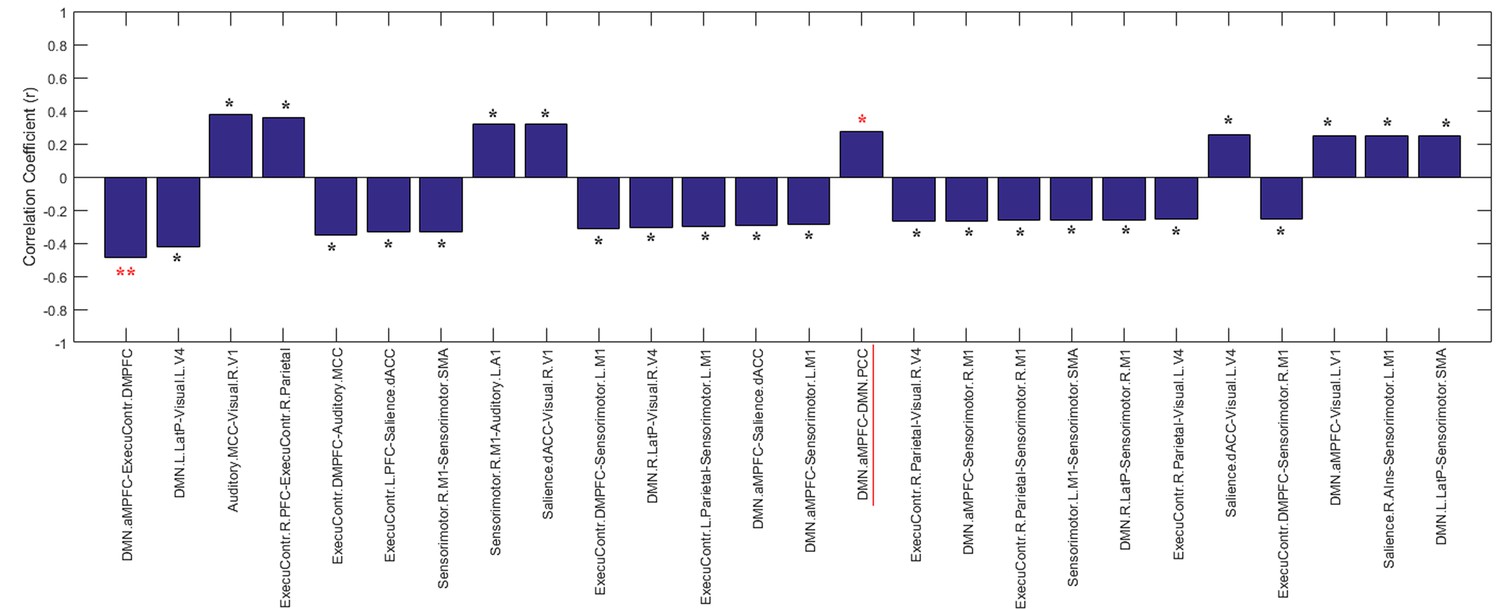
The functional connectivity features sorted by their Pearson's correlations to the CRS-R scores at the T1 time point across the DOC patients in the training dataset ‘Beijing 750’.
https://doi.org/10.7554/eLife.36173.031
Appendix 6—figure 3
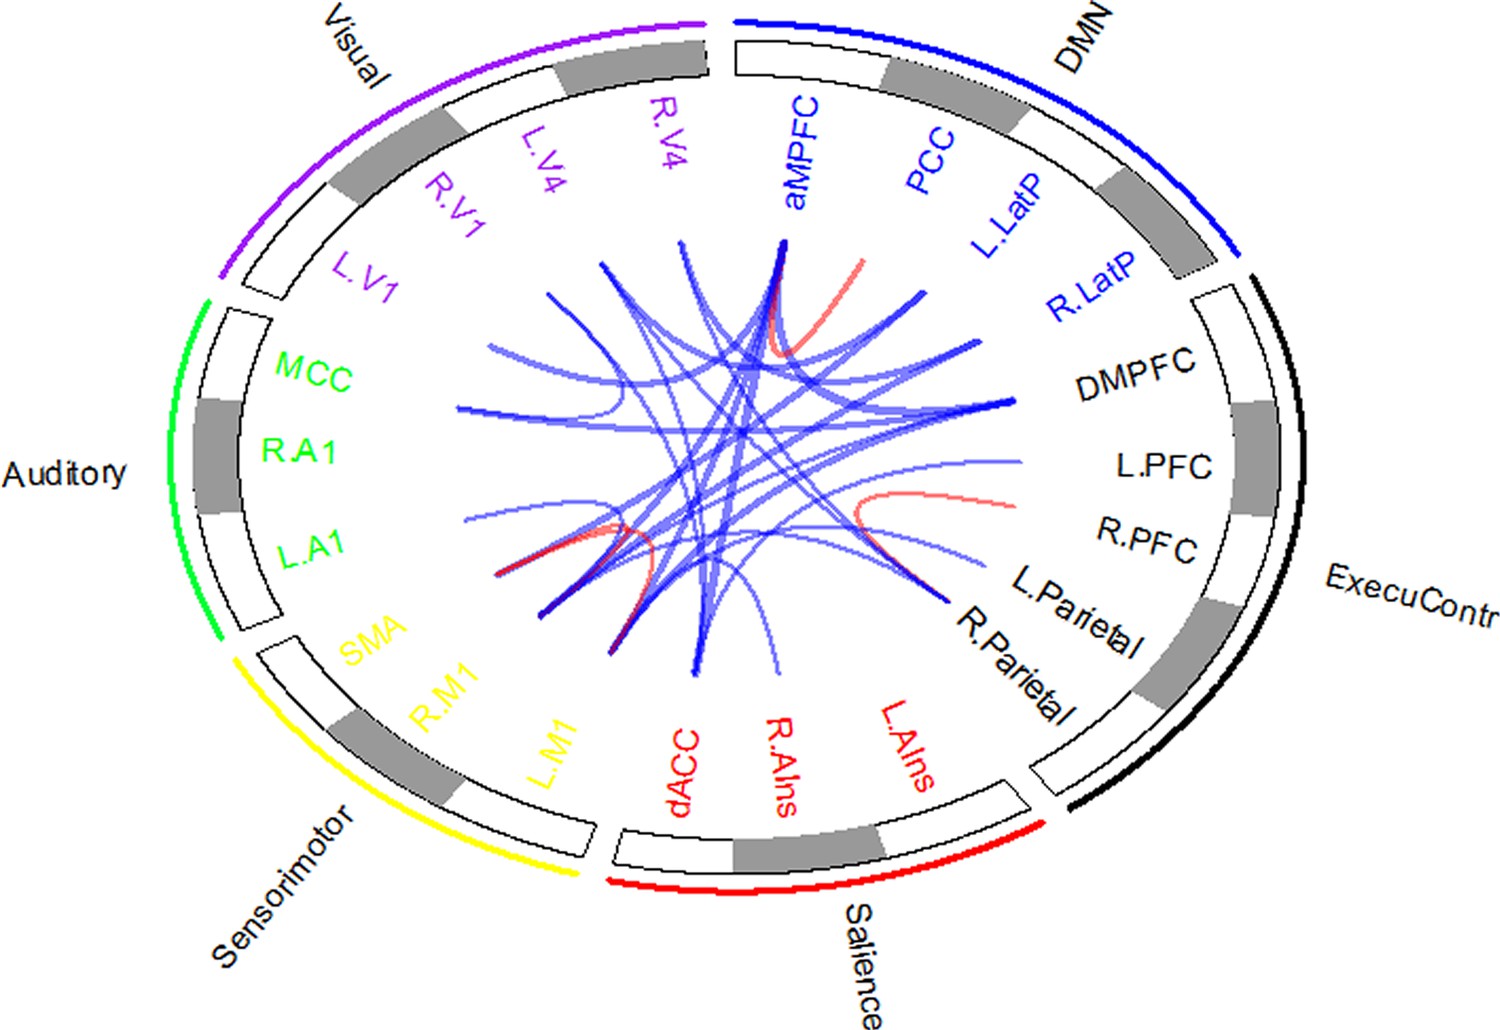
The Circos map for the functional connectivity features that were significantly correlated to the CRS-R scores at the T1 time point across the DOC patients in the training dataset ‘Beijing 750’.
https://doi.org/10.7554/eLife.36173.032
Appendix 7—figure 1
Histogram depicting the imaging features included in CARS-PLSR models.
https://doi.org/10.7554/eLife.36173.036
Appendix 8—figure 1
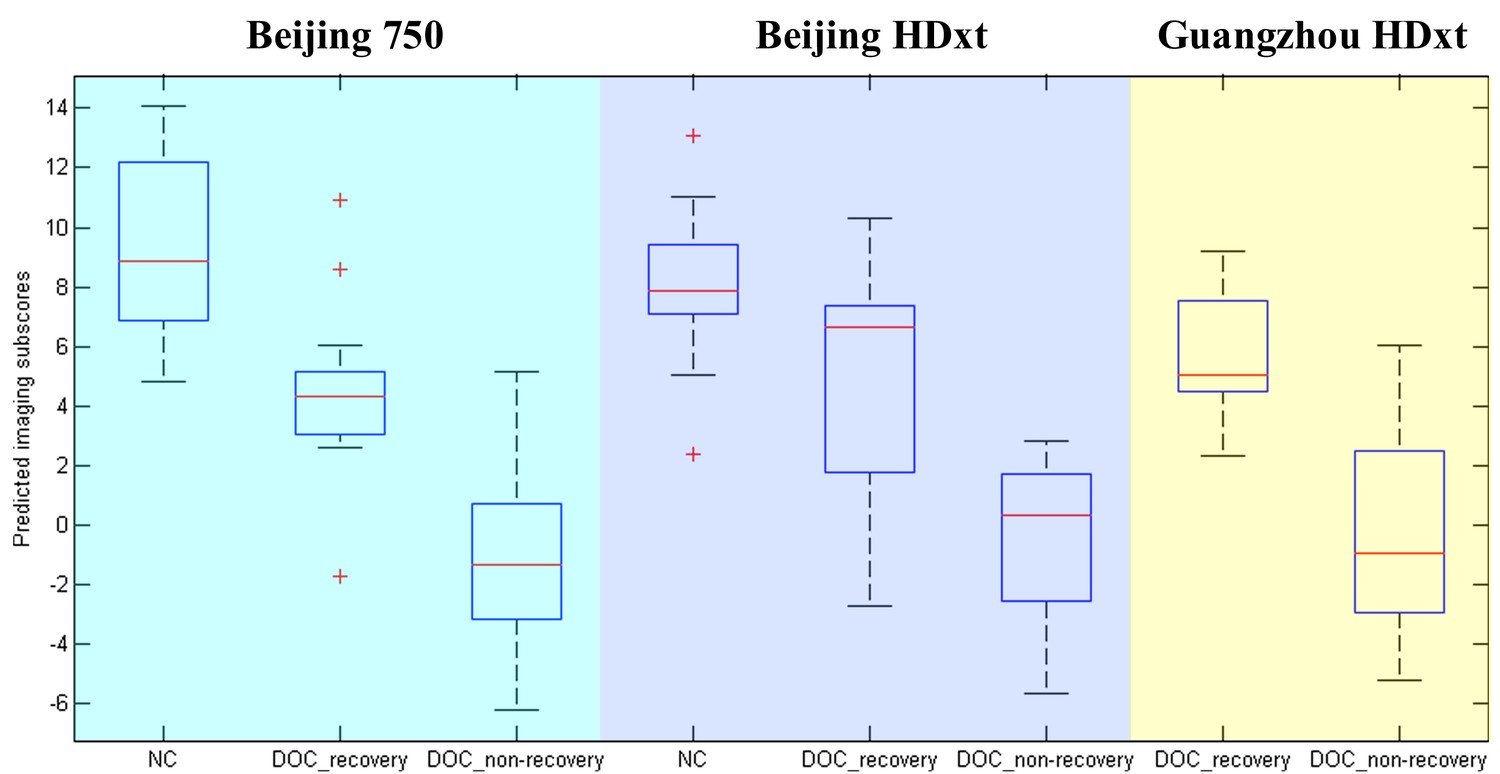
The imaging subscores for all of the subjects in the three datasets.
https://doi.org/10.7554/eLife.36173.038
Appendix 9—figure 1
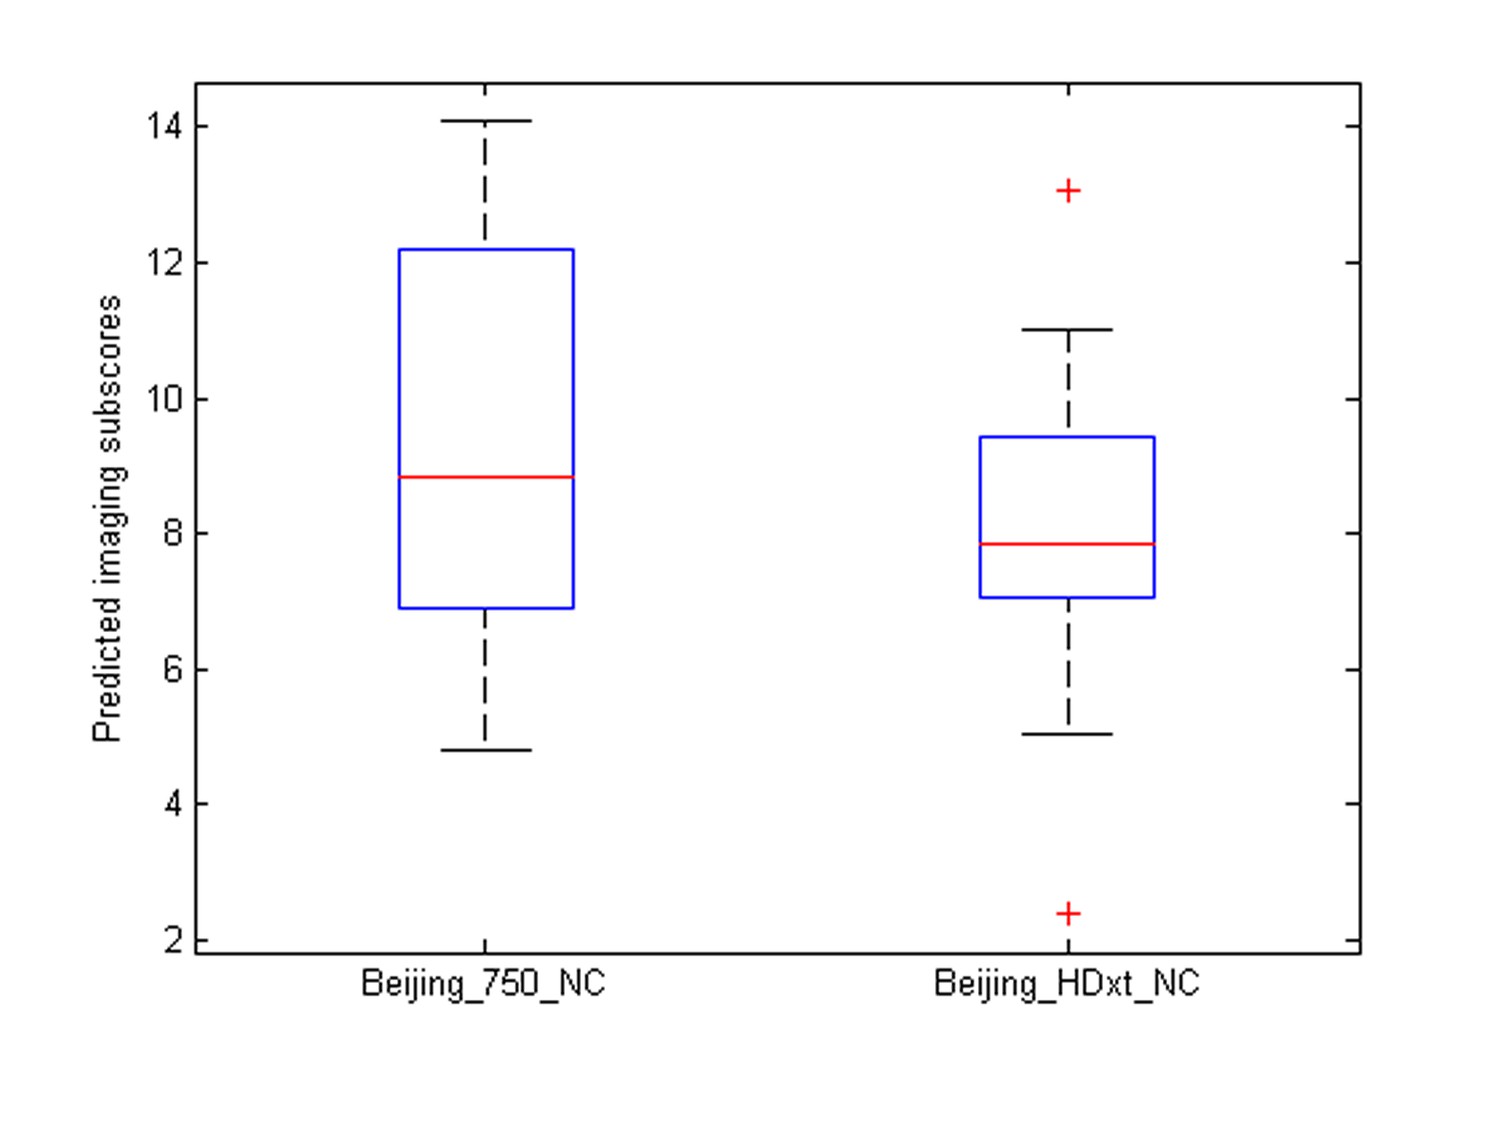
The distribution of the predicted imaging subscores of the healthy controls at different sites.
https://doi.org/10.7554/eLife.36173.040
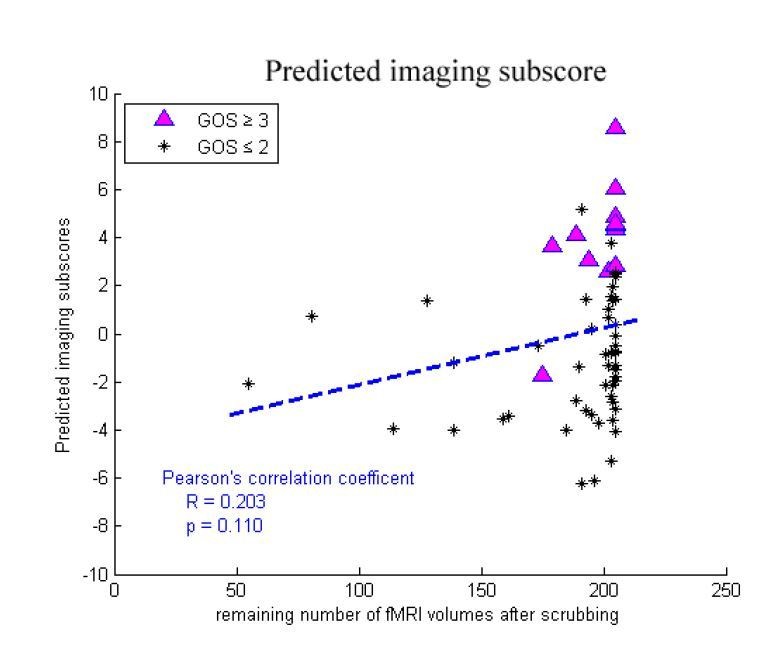
Appendix 9—figure 2
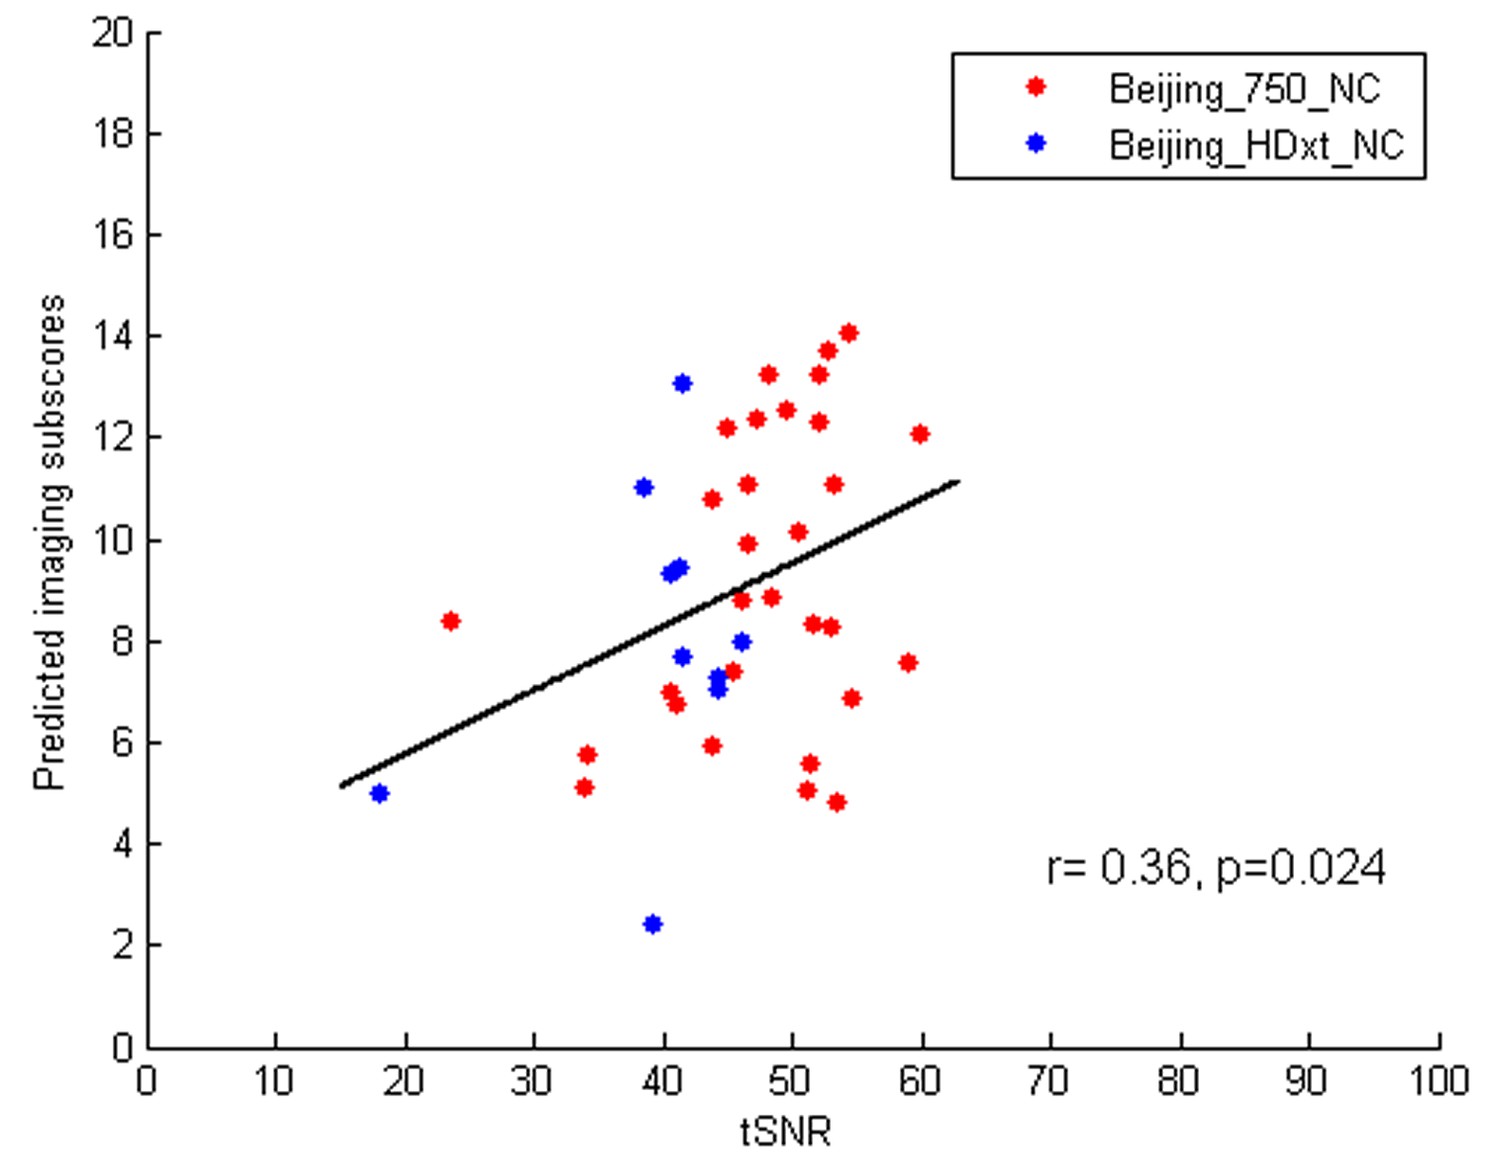
The correlations between the fMRI signal-to-noise ratio (SNR) and the predicted imaging subscores in the healthy controls.
https://doi.org/10.7554/eLife.36173.041
Author response image 1

Author response image 2

Author response image 3

Author response image 4

Author response image 5
Author response image 6
Author response image 7
Author response image 8

Author response image 9

Author response image 10
Author response image 11
Author response image 12

Author response image 13
Author response image 14
Author response image 15
Tables
Table 1
Demographic and clinical characteristics of the patients in the three datasets.
https://doi.org/10.7554/eLife.36173.004| Beijing_750 (n = 63) | Beijing_HDxt (n = 25) | Guangzhou_HDxt (n = 24) | |
|---|---|---|---|
| Gender, M/F | 36/27 | 18/7 | 14/10 |
| Etiology | |||
| Trauma/Stroke/Anoxia | 17/21/25 | 12/6/7 | 8/0/16 |
| Age at the T0 (years) | |||
| Mean (SD) | 42.8 (13.8) | 40.7 (15.2) | 39.3 (16.9) |
| Range | 18.0 ~ 71.0 | 18.0 ~ 68.0 | 15.0 ~ 78.0 |
| Time to MRI (months) | |||
| Range | 1.0 ~ 77.0 | 1.0 ~ 44.0 | 1.0 ~ 10.0 |
| Mean (SD) | 7.4 (12.8) | 5.4 (8.4) | 2.3 (2.4) |
| Median | 3.0 | 3.0 | 1.5 |
| Band | |||
| [1,3] | 32 | 13 | 20 |
| (3,6] | 15 | 8 | 2 |
| (6,12] | 11 | 3 | 2 |
| >12 | 5 | 1 | 0 |
| Follow-up time (months) | |||
| Range | 12.0 ~ 51.0 | 14.0 ~ 53.0 | 27.0 ~ 78.0 |
| Mean (SD) | 21.0 (9.8) | 41.7 (8.4) | 52.2 (14.5) |
| Median | 15.0 | 43.0 | 53.0 |
| Band | |||
| [12,24] | 38 | 2 | 0 |
| (24,48] | 24 | 20 | 8 |
| >48 | 1 | 3 | 16 |
| Diagnosis at T0 | |||
| MCS/VS | 17/46 | 5/20 | 8/16 |
| CRS-R total score | |||
| Mean (SD) | 7.3 (2.9) | 6.5 (2.3) | 7.1 (4.1) |
| Range | 3.0 ~ 18.0 | 3.0 ~ 14.0 | 3.0 ~ 17.0 |
| Outcome at T1 | |||
| CRS-R total score | |||
| Mean (SD) | 9.9 (5.1) | 12.7 (6.4) | N/A |
| Range | 3.0 ~ 22.0 | 5.0 ~ 23.0 | N/A |
| GOS score | |||
| GOS = 5 | 0 | 0 | 0 |
| GOS = 4 | 5 | 5 | 1 |
| GOS = 3 | 8 | 7 | 5 |
| GOS <= 2 | 50 | 13 | 18 |
-
Abbreviations: CRS-R, Coma Recovery Scale–Revised; GOS, Glasgow Outcome Scale; MCS, minimally conscious state; N/A, not available; SD, standard deviation; VS, vegetative state/unresponsive wakefulness syndrome.
Appendix 1—table 1
Demographic and clinical characteristics of patients in the ‘Beijing_750’ dataset.
https://doi.org/10.7554/eLife.36173.015| Patient alias | Gender | Age (years) | Diagnose | Etiology | Structural lesions on MRI | Time to MRI (months) | Number of CRS-R assessments | CRS-R score at T0 | CRS-R subscore at T0 | CRS-R score at T1 | CRS-R subscore at T1 | Follow-up(months) | GOS | Predicted score |
|---|---|---|---|---|---|---|---|---|---|---|---|---|---|---|
| 001 | M | 36 | VS/UWS | Anoxia | Diffuse pons damage | 1 | 6 | 7 | 022102 | 22 | 446323 | 15 | 4 | 18.26 |
| 002 | M | 29 | MCS | Trauma | Bilateral-temporo-parietal damage | 9 | 4 | 18 | 355113 | 22 | 456223 | 39 | 4 | 15.31 |
| 003 | F | 33 | VS/UWS | Trauma | Bilateral-frontal lobe damage, atrophy | 12 | 5 | 7 | 102202 | 22 | 455323 | 12 | 4 | 22.88 |
| 004 | F | 28 | MCS | Trauma | L-frontal-temporal lobe damage | 1 | 4 | 15 | 335103 | 22 | 456223 | 19 | 4 | 16.58 |
| 005 | M | 23 | MCS | Anoxia | Diffuse cortical and subcortical atrophy | 3 | 4 | 10 | 232102 | 21 | 455223 | 13 | 4 | 17.08 |
| 006 | M | 45 | MCS | Stroke | L-temporo-parietal damage | 9 | 4 | 9 | 222102 | 17 | 334223 | 12 | 3 | 13.94 |
| 007 | M | 39 | MCS | Stroke | Brainstem damage | 1 | 4 | 17 | 345113 | 19 | 445123 | 12 | 3 | 14.39 |
| 008 | F | 27 | MCS | Trauma | L-basal ganglia damage | 10 | 6 | 12 | 332103 | 18 | 345123 | 19 | 3 | 16.09 |
| 009 | M | 23 | MCS | Trauma | Diffuse cortical and subcortical atrophy | 6 | 4 | 9 | 132102 | 19 | 444223 | 13 | 3 | 10.94 |
| 010 | M | 42 | MCS | Stroke | L-basal ganglia damage | 3 | 7 | 7 | 103102 | 19 | 416323 | 12 | 3 | 14.72 |
| 011 | M | 53 | MCS | Stroke | Diffuse cortical and basal ganglia (caudates) damage | 7 | 5 | 11 | 332102 | 14 | 332123 | 14 | 3 | 11.55 |
| 012 | F | 40 | VS/UWS | Stroke | Diffuse cortical and basal ganglia damage | 5 | 6 | 7 | 112102 | 14 | 333122 | 12 | 3 | 14.67 |
| 013 | M | 22 | VS/UWS | Trauma | L-frontal-temporo-parietal lobe damage | 3 | 4 | 7 | 112102 | 15 | 334122 | 27 | 3 | 15.48 |
| 014 | F | 64 | VS/UWS | Stroke | L-thalamus, basal ganglia lesions | 1 | 4 | 7 | 112102 | 11 | 233102 | 17 | 2 | 8.28 |
| 015 | F | 42 | VS/UWS | Anoxia | Diffuse anoxic cortical lesions | 1 | 4 | 7 | 112102 | 9 | 222102 | 14 | 2 | 9.02 |
| 016 | M | 45 | VS/UWS | Anoxia | Diffuse anoxic cortical lesions | 9 | 5 | 5 | 002102 | 7 | 112102 | 15 | 2 | 8.65 |
| 017 | F | 60 | VS/UWS | Anoxia | Diffuse anoxic cortical lesions | 4 | 4 | 6 | 102102 | 6 | 102102 | 13 | 2 | 7.71 |
| 018 | M | 42 | VS/UWS | Stroke | R-cerebral hemisphere lesions | 6 | 4 | 7 | 112102 | 7 | 112102 | 14 | 2 | 12.44 |
| 019 | M | 51 | VS/UWS | Anoxia | Diffuse cortical and subcortical atrophy | 3 | 4 | 7 | 112102 | 7 | 112102 | 28 | 2 | 4.28 |
| 020 | F | 35 | VS/UWS | Anoxia | Bilateral-frontal lobe damage, atrophy | 2 | 4 | 7 | 112102 | 7 | 112102 | 13 | 2 | 5.87 |
| 021 | M | 71 | VS/UWS | Trauma | Diffuse cortical and subcortical atrophy | 6 | 6 | 3 | 101100 | 4 | 101101 | 13 | 2 | 4.46 |
| 022 | F | 30 | VS/UWS | Anoxia | Bilateral-basal ganglia damage | 2 | 4 | 4 | 002002 | 7 | 022102 | 38 | 2 | 6.92 |
| 023 | F | 58 | VS/UWS | Trauma | Diffuse cortical and subcortical atrophy | 2 | 4 | 3 | 002100 | 4 | 002101 | 14 | 2 | 5.09 |
| 024 | M | 23 | MCS | Trauma | R-basal ganglia (caudates) damage | 5 | 5 | 7 | 103102 | 11 | 223202 | 12 | 2 | 14.57 |
| 025 | F | 66 | VS/UWS | Trauma | Bilateral-temporo-parietal damage | 1 | 4 | 6 | 102102 | 8 | 113102 | 32 | 2 | 5.71 |
| 026 | F | 25 | VS/UWS | Anoxia | Diffuse cortical and subcortical atrophy | 3 | 4 | 5 | 102002 | 6 | 112002 | 36 | 2 | 6.75 |
| 027 | M | 48 | VS/UWS | Anoxia | Diffuse cortical and subcortical atrophy | 4 | 5 | 7 | 112102 | 8 | 113102 | 29 | 2 | 7.83 |
| 028 | F | 28 | MCS | Anoxia | Diffuse cortical and subcortical atrophy | 5 | 4 | 9 | 222102 | 11 | 233102 | 32 | 2 | 11.36 |
| 029 | M | 57 | VS/UWS | Anoxia | Diffuse cortical and subcortical atrophy | 11 | 4 | 6 | 102102 | 6 | 102102 | 33 | 2 | 4.70 |
| 030 | M | 61 | MCS | Stroke | Bilateral-temporo-parietal lobe damage | 2 | 4 | 11 | 134102 | 11 | 223112 | 12 | 2 | 10.34 |
| 031 | M | 40 | VS/UWS | Anoxia | Diffuse cortical and subcortical atrophy | 4 | 4 | 4 | 001102 | 5 | 011102 | 27 | 2 | 5.70 |
| 032 | M | 39 | VS/UWS | Stroke | R-basal ganglia damage, atrophy | 3 | 4 | 7 | 112102 | 7 | 112102 | 12 | 2 | 8.03 |
| 033 | M | 41 | VS/UWS | Anoxia | Diffuse cortical and subcortical atrophy | 2 | 4 | 5 | 002102 | 5 | 002102 | 13 | 2 | 6.44 |
| 034 | M | 26 | VS/UWS | Stroke | Diffuse cortical and subcortical atrophy | 54 | 4 | 7 | 112102 | 7 | 112102 | 38 | 2 | 7.28 |
| 035 | F | 50 | VS/UWS | Anoxia | Diffuse cortical and subcortical atrophy | 8 | 6 | 6 | 102102 | 9 | 122202 | 12 | 2 | 5.77 |
| 036 | F | 53 | VS/UWS | Stroke | Bilateral brainstem, midbrain damage | 3 | 4 | 5 | 112100 | 7 | 112102 | 28 | 2 | 8.02 |
| 037 | M | 67 | VS/UWS | Stroke | R- brainstem, cerebellar damage | 1 | 4 | 5 | 112100 | 3 | 002001 | 12 | 2 | 2.04 |
| 038 | M | 45 | MCS | Stroke | Diffuse cortical and subcortical atrophy | 2 | 5 | 9 | 132102 | 10 | 222112 | 13 | 2 | 10.91 |
| 039 | F | 35 | VS/UWS | Anoxia | Diffuse cortical and subcortical atrophy | 3 | 4 | 6 | 102102 | 8 | 112202 | 19 | 2 | 10.24 |
| 040 | F | 46 | MCS | Trauma | Diffuse axonal injury | 77 | 7 | 11 | 222212 | 13 | 332212 | 51 | 2 | 14.76 |
| 041 | M | 49 | VS/UWS | Stroke | Bilateral-brainstem, cerebellar damage | 10 | 4 | 7 | 112102 | 7 | 112102 | 28 | 2 | 10.87 |
| 042 | M | 45 | VS/UWS | Stroke | Diffuse cortical and basal ganglia damage | 3 | 4 | 7 | 112102 | 8 | 122102 | 19 | 2 | 7.59 |
| 043 | M | 18 | VS/UWS | Anoxia | Diffuse cortical and subcortical atrophy | 8 | 5 | 6 | 111102 | 9 | 123102 | 12 | 2 | 10.85 |
| 044 | M | 53 | VS/UWS | Anoxia | Bilateral-occipital lobe damage, atrophy | 2 | 4 | 3 | 002001 | 7 | 112102 | 34 | 2 | 1.98 |
| 045 | M | 46 | VS/UWS | Trauma | R-temporo-parietal damage | 4 | 4 | 6 | 101202 | 6 | 101202 | 13 | 2 | 7.23 |
| 046 | F | 29 | VS/UWS | Anoxia | Diffuse cortical and subcortical atrophy | 28 | 4 | 7 | 112102 | 9 | 123102 | 12 | 2 | 8.31 |
| 047 | F | 47 | MCS | Stroke | R-basal ganglia damage | 47 | 5 | 8 | 113102 | 11 | 222212 | 12 | 2 | 9.66 |
| 048 | M | 58 | VS/UWS | Stroke | Bilateral-temporo-parietal lobe damage | 6 | 4 | 7 | 112102 | 8 | 113102 | 27 | 2 | 7.05 |
| 049 | M | 66 | VS/UWS | Anoxia | L-frontal lobe damage | 4 | 4 | 4 | 002002 | 6 | 102102 | 38 | 2 | 4.79 |
| 050 | M | 34 | VS/UWS | Trauma | Diffuse axonal injury | 3 | 4 | 6 | 112101 | 8 | 122102 | 14 | 2 | 10.28 |
| 051 | F | 31 | MCS | Trauma | L-frontal-temporo-parietal lobe damage | 3 | 5 | 11 | 133202 | 8 | 112202 | 15 | 2 | 15.56 |
| 052 | M | 33 | VS/UWS | Stroke | L-temporo-parietal lobe damage | 17 | 4 | 6 | 102102 | 8 | 113102 | 13 | 2 | 7.67 |
| 053 | F | 31 | VS/UWS | Anoxia | Diffuse cortical and basal ganglia (caudates) damage | 1 | 4 | 6 | 102102 | 6 | 102102 | 27 | 2 | 8.36 |
| 054 | F | 28 | VS/UWS | Anoxia | Diffuse cortical and subcortical atrophy | 3 | 4 | 6 | 102102 | 8 | 112202 | 32 | 2 | 9.23 |
| 055 | F | 26 | VS/UWS | Stroke | L-basal ganglia damage | 4 | 4 | 6 | 102102 | 6 | 102102 | 12 | 2 | 10.96 |
| 056 | M | 45 | VS/UWS | Trauma | Diffuse axonal injury | 1 | 4 | 6 | 102102 | 6 | 102102 | 29 | 2 | 9.05 |
| 057 | F | 69 | VS/UWS | Stroke | Diffuse cortical and subcortical atrophy | 4 | 4 | 6 | 102102 | 7 | 102202 | 33 | 2 | 12.43 |
| 058 | F | 68 | VS/UWS | Trauma | Diffuse axonal injury | 6 | 6 | 7 | 112102 | 9 | 132102 | 17 | 2 | 9.74 |
| 059 | M | 50 | VS/UWS | Stroke | L-frontal-temporo-parietal lobe damage | 3 | 4 | 6 | 111102 | 8 | 222002 | 27 | 2 | 7.01 |
| 060 | M | 60 | MCS | Trauma | Bilateral brainstem, midbrain damage | 7 | 4 | 11 | 134102 | 11 | 223112 | 30 | 2 | 11.69 |
| 061 | M | 44 | VS/UWS | Anoxia | Diffuse cortical and subcortical atrophy | 2 | 4 | 6 | 102102 | 4 | 002101 | 13 | 2 | 10.48 |
| 062 | F | 35 | VS/UWS | Anoxia | Bilateral-basal ganglia damage | 3 | 5 | 7 | 211102 | 9 | 231102 | 27 | 2 | 9.07 |
| 063 | F | 43 | VS/UWS | Anoxia | Diffuse cortical and subcortical atrophy | 2 | 4 | 7 | 112102 | 8 | 202112 | 29 | 2 | 10.09 |
Appendix 1—table 2
Demographic and clinical characteristics of patients in the ‘Beijing_HDxt’ dataset.
https://doi.org/10.7554/eLife.36173.016| Patient alias | Gender | Age (years) | Diagnose | Etiology | Structural lesions on MRI | Time to MRI (months) | Number of CRS-R assessments | CRS-R score at T0 | CRS-R subscore at T0 | CRS-R score at T1 | CRS-R subscore at T1 | follow-up(months) | GOS | Predicted score |
|---|---|---|---|---|---|---|---|---|---|---|---|---|---|---|
| 001 | M | 19 | VS/UWS | Trauma | L-temporo-parietal lobe damage | 6 | 4 | 7 | 112102 | 22 | 456223 | 40 | 4 | 20.37 |
| 002 | M | 26 | MCS | Trauma | R-thalamus, basal ganglia lesions | 3 | 6 | 10 | 232102 | 23 | 456323 | 47 | 4 | 17.12 |
| 003 | F | 22 | VS/UWS | Trauma | L-temporal lobe damage | 4 | 4 | 6 | 102102 | 22 | 456223 | 47 | 4 | 14.05 |
| 004 | M | 41 | VS/UWS | Stroke | Bilateral brainstem, midbrain damage | 3 | 4 | 6 | 112101 | 23 | 456323 | 50 | 4 | 20.23 |
| 005 | M | 36 | MCS | Stroke | Bilateral brainstem damage | 4 | 4 | 6 | 003102 | 23 | 456323 | 39 | 4 | 7.75 |
| 006 | M | 34 | VS/UWS | Anoxia | Diffuse cortical and subcortical atrophy | 1 | 4 | 6 | 111102 | 14 | 323123 | 31 | 3 | 17.25 |
| 007 | F | 18 | VS/UWS | Trauma | Diffuse axonal injury | 3 | 4 | 5 | 012002 | 14 | 332123 | 41 | 3 | 14.86 |
| 008 | M | 58 | MCS | Trauma | R-frontal lobe damage | 12 | 4 | 8 | 113102 | 15 | 333123 | 40 | 3 | 15.62 |
| 009 | M | 41 | MCS | Trauma | R-frontal-temporo-parietal lobe damage | 1 | 5 | 11 | 233012 | 18 | 344223 | 42 | 3 | 18.89 |
| 010 | M | 46 | VS/UWS | Stroke | L-brainstem, cerebellar damage | 7 | 4 | 6 | 102102 | 14 | 332123 | 53 | 3 | 17.05 |
| 011 | M | 25 | VS/UWS | Anoxia | Diffuse cortical and subcortical atrophy | 4 | 6 | 6 | 102102 | 14 | 224123 | 46 | 3 | 18.07 |
| 012 | M | 58 | VS/UWS | Trauma | L-brainstem damage | 1 | 7 | 7 | 112102 | 19 | 355123 | 40 | 3 | 10.75 |
| 013 | M | 36 | VS/UWS | Trauma | L-frontal-temporo-parietal lobe damage | 6 | 4 | 7 | 112102 | 10 | 232102 | 44 | 2 | 9.58 |
| 014 | M | 58 | VS/UWS | Trauma | R-frontal-temporo-parietal lobe damage | 4 | 4 | 6 | 102102 | 6 | 102102 | 45 | 2 | 6.69 |
| 015 | M | 65 | VS/UWS | Stroke | Diffuse cortical and subcortical atrophy | 3 | 4 | 3 | 100002 | 5 | 101102 | 43 | 2 | 4.01 |
| 016 | F | 24 | VS/UWS | Trauma | Diffuse axonal injury | 44 | 6 | 6 | 102102 | 8 | 122102 | 44 | 2 | 14.03 |
| 017 | F | 46 | VS/UWS | Stroke | L-pons damage | 2 | 4 | 7 | 112102 | 7 | 112102 | 40 | 2 | 12.11 |
| 018 | M | 53 | VS/UWS | Anoxia | Diffuse cortical and subcortical atrophy | 3 | 4 | 4 | 101002 | 6 | 102102 | 41 | 2 | 5.38 |
| 019 | F | 32 | VS/UWS | Trauma | L-temporo-parietal lobe damage | 3 | 4 | 6 | 102102 | 8 | 112202 | 23 | 2 | 13.76 |
| 020 | M | 41 | VS/UWS | Anoxia | Diffuse cortical and subcortical atrophy | 2 | 4 | 4 | 101002 | 8 | 112202 | 40 | 2 | 12.06 |
| 021 | F | 33 | VS/UWS | Anoxia | Diffuse cortical and subcortical atrophy | 7 | 5 | 6 | 211002 | 11 | 232202 | 47 | 2 | 4.55 |
| 022 | M | 49 | VS/UWS | Anoxia | Diffuse cortical and subcortical atrophy | 2 | 4 | 6 | 102102 | 6 | 102102 | 14 | 2 | 8.97 |
| 023 | F | 25 | MCS | Anoxia | Bilateral thalamus, brainstem damage | 4 | 7 | 14 | 450023 | 10 | 240022 | 50 | 2 | 12.42 |
| 024 | M | 63 | VS/UWS | Stroke | L-basal ganglia lesions | 5 | 4 | 4 | 001102 | 5 | 101102 | 48 | 2 | 8.22 |
| 025 | M | 68 | VS/UWS | Trauma | L-frontal-temporo-parietal lobe damage | 2 | 4 | 5 | 002102 | 6 | 012102 | 47 | 2 | 9.72 |
Appendix 1—table 3
Demographic and clinical characteristics of patients in the ‘Guangzhou_HDxt’ dataset.
https://doi.org/10.7554/eLife.36173.017| Patient alias | Gender | Age (years) | Diagnose | Etiology | Time to MRI (months) | CRS-R score at T0 | CRS-R subscore at T0 | Follow-up (months) | GOS | Predicted score |
|---|---|---|---|---|---|---|---|---|---|---|
| 001 | F | 15 | MCS | Anoxia | 1 | 13 | 135112 | 59 | 4 | 20.92 |
| 002 | M | 29 | MCS | Trauma | 4 | 9 | 114012 | 61 | 3 | 16.50 |
| 003 | F | 27 | MCS | Trauma | 1 | 9 | 105102 | 29 | 3 | 16.67 |
| 004 | F | 20 | MCS | Trauma | 2 | 8 | 113102 | 41 | 3 | 20.37 |
| 005 | M | 30 | MCS | Trauma | 1 | 15 | 116223 | 63 | 3 | 17.34 |
| 006 | M | 31 | MCS | Trauma | 1 | 20 | 445223 | 51 | 3 | 14.00 |
| 007 | M | 28 | VS/UWS | Anoxia | 1 | 5 | 102002 | 69 | 2 | 9.71 |
| 008 | M | 48 | MCS | Trauma | 1 | 12 | 234102 | 55 | 2 | 9.11 |
| 009 | M | 46 | VS/UWS | Trauma | 2 | 4 | 102001 | 65 | 2 | 12.58 |
| 010 | M | 78 | VS/UWS | Anoxia | 1 | 4 | 100102 | 49 | 2 | 9.20 |
| 011 | M | 39 | VS/UWS | Anoxia | 1 | 5 | 002102 | 51 | 2 | 4.20 |
| 012 | F | 46 | VS/UWS | Anoxia | 2 | 4 | 001102 | 46 | 2 | 14.49 |
| 013 | M | 39 | VS/UWS | Anoxia | 2 | 5 | 102002 | 43 | 2 | 7.30 |
| 014 | M | 16 | VS/UWS | Anoxia | 2 | 3 | 001002 | 71 | 2 | 14.17 |
| 015 | M | 25 | MCS | Anoxia | 1 | 12 | 135102 | 78 | 2 | 8.56 |
| 016 | F | 76 | VS/UWS | Anoxia | 5 | 4 | 100102 | 59 | 2 | 3.57 |
| 017 | M | 36 | VS/UWS | Trauma | 2 | 5 | 001202 | 65 | 2 | 17.28 |
| 018 | M | 32 | VS/UWS | Anoxia | 10 | 6 | 102102 | 56 | 2 | 5.66 |
| 019 | F | 49 | VS/UWS | Anoxia | 1 | 6 | 102102 | 49 | 2 | 4.55 |
| 020 | F | 52 | VS/UWS | Anoxia | 1 | 3 | 000102 | 27 | 2 | 5.08 |
| 021 | M | 62 | VS/UWS | Anoxia | 2 | 3 | 001002 | 28 | 2 | 10.26 |
| 022 | F | 33 | VS/UWS | Anoxia | 2 | 6 | 102102 | 29 | 2 | 9.09 |
| 023 | F | 28 | VS/UWS | Anoxia | 9 | 6 | 102102 | 67 | 2 | 12.62 |
| 024 | F | 57 | VS/UWS | Anoxia | 1 | 5 | 002102 | 42 | 2 | 4.72 |
Appendix 1—table 4
Demographic of healthy controls in the ‘Beijing_750’ dataset.
https://doi.org/10.7554/eLife.36173.018| Alias | Gender | Age | Handedness |
|---|---|---|---|
| NC001 | F | 40 | Right |
| NC002 | M | 50 | Right |
| NC003 | F | 34 | Right |
| NC004 | M | 25 | Right |
| NC005 | M | 28 | Right |
| NC007 | F | 24 | Right |
| NC008 | F | 47 | Right |
| NC009 | F | 22 | Right |
| NC010 | F | 60 | Right |
| NC012 | F | 26 | Right |
| NC013 | M | 21 | Right |
| NC014 | F | 27 | Right |
| NC015 | M | 40 | Right |
| NC016 | M | 44 | Right |
| NC017 | F | 22 | Right |
| NC018 | M | 50 | Right |
| NC019 | M | 27 | Right |
| NC020 | F | 43 | Right |
| NC021 | F | 25 | Right |
| NC022 | M | 54 | Right |
| NC023 | F | 52 | Right |
| NC026 | M | 46 | Right |
| NC027 | F | 52 | Right |
| NC028 | M | 29 | Right |
| NC029 | F | 46 | Right |
| NC030 | M | 44 | Right |
| NC031 | M | 30 | Right |
| NC032 | M | 31 | Right |
| NC033 | M | 32 | Right |
| NC034 | M | 30 | Right |
Appendix 1—table 5
Demographic of healthy controls in the ‘Beijing_HDxt’ dataset.
https://doi.org/10.7554/eLife.36173.019| Alias | Gender | Age | Handedness |
|---|---|---|---|
| NC001_HDxt | M | 44 | Right |
| NC002_HDxt | M | 42 | Right |
| NC003_HDxt | M | 30 | Right |
| NC004_HDxt | M | 40 | Right |
| NC005_HDxt | M | 30 | Right |
| NC006_HDxt | M | 30 | Right |
| NC007_HDxt | F | 58 | Right |
| NC008_HDxt | F | 54 | Right |
| NC009_HDxt | F | 41 | Right |
| NC010_HDxt | F | 41 | Right |
Appendix 2—table 1
Brain networks and ROIs in this study.
https://doi.org/10.7554/eLife.36173.021| Brain network | ROI name | ROI abbreviation | Peak MNI coordinates | References |
|---|---|---|---|---|
| Default mode | (Raichle, 2011; Demertzi et al., 2015) | |||
| Anterior medial prefrontal cortex | aMPFC | −1 54 27 | ||
| Posterior cingulate cortex/precuneus | PCC | 0 –52 27 | ||
| Left lateral parietal cortex | L.LatP | −46 –66 30 | ||
| Right lateral parietal cortex | R.LatP | 49 –63 33 | ||
| Executive control | (Seeley et al., 2007; Raichle, 2011) | |||
| Dorsal medial PFC | DMPFC | 0 27 46 | ||
| Left anterior prefrontal cortex | L.PFC | −44 45 0 | ||
| Right anterior prefrontal cortex | R.PFC | 44 45 0 | ||
| Left superior parietal cortex | L. Parietal | −50 –51 45 | ||
| Right superior parietal cortex | R. Parietal | 50 –51 45 | ||
| Salience | (Seeley et al., 2007; Raichle, 2011; Demertzi et al., 2015) | |||
| Left orbital frontoinsula | L.AIns | −40 18 –12 | ||
| Right orbital frontoinsula | R.AIns | 42 10 –12 | ||
| Dorsal anterior cingulate | dACC | 0 18 30 | ||
| Sensorimotor | (Raichle, 2011; Demertzi et al., 2015) | |||
| Left primary motor cortex | L.M1 | −39 –26 51 | ||
| Right primary motor cortex | R.M1 | 38 –26 51 | ||
| Supplementary motor area | SMA | 0 –21 51 | ||
| Auditory | (Raichle, 2011; Demertzi et al., 2015) | |||
| Left primary auditory cortex | L.A1 | −62 –30 12 | ||
| Right primary auditory cortex | R.A1 | 59 –27 15 | ||
| Middle cingulate cortex | MCC | 0 –7 43 | ||
| Visual | (Demertzi et al., 2015) | |||
| Left primary visual cortex | L.V1 | −13 –85 6 | ||
| Right primary visual cortex | R.V1 | 8 –82 6 | ||
| Left associative visual cortex | L.V4 | −30 –89 20 | ||
| Right associative visual cortex | R.V4 | 30 –89 20 |
Appendix 6—table 1
The brain area connection features and their Pearson's correlations to the CRS-R scores at the T1 time point across the DOC patients in the training dataset ‘Beijing 750’.
https://doi.org/10.7554/eLife.36173.033| ROI name | Pearson's correlation coefficient and p value | |
|---|---|---|
| ** | DMN.aMPFC | r = 0.514, p=0.000 |
| ** | ExecuContr.L.Parietal | r = 0.429, p=0.000 |
| ** | DMN.PCC | r = 0.420, p=0.001 |
| ** | DMN.R.LatP | r = 0.407, p=0.001 |
| ** | ExecuContr.DMPFC | r = 0.405, p=0.001 |
| * | ExecuContr.R.Parietal | r = 0.363, p=0.003 |
| * | Sensorimotor.SMA | r = −0.332, p=0.008 |
| * | ExecuContr.R.PFC | r = 0.320, p=0.011 |
| * | Auditory.R.A1 | r = 0.315, p=0.012 |
| * | DMN.L.LatP | r = 0.298, p=0.018 |
| * | ExecuContr.L.PFC | r = 0.291, p=0.021 |
| * | Sensorimotor.L.M1 | r = 0.267, p=0.035 |
| Auditory.L.A1 | r = 0.206, p=0.105 | |
| Salience.R.AIns | r = −0.187, p=0.142 | |
| Sensorimotor.R.M1 | r = 0.167, p=0.191 | |
| Visual.L.V4 | r = −0.151, p=0.236 | |
| Salience.dACC | r = −0.104, p=0.418 | |
| Salience.L.AIns | r = 0.075, p=0.560 | |
| Visual.R.V1 | r = 0.065, p=0.611 | |
| Auditory.MCC | r = 0.053, p=0.682 | |
| Visual.R.V4 | r = −0.031, p=0.809 | |
| Visual.L.V1 | r = −0.028, p=0.830 |
-
**: p<0.05, FDR corrected; *: p<0.05, uncorrected.
Appendix 6—table 2
Functional connectivity features and their Pearson's correlations to the CRS-R scores at the T1 time point across the DOC patients in the training dataset ‘Beijing 750’.
https://doi.org/10.7554/eLife.36173.034| Functional connectivity | Pearson's correlation coefficient and p-value | |
|---|---|---|
| † | DMN.aMPFC - ExecuContr.DMPFC | r = −0.489, p=0.000 |
| * | DMN.L.LatP - Visual.L.V4 | r = −0.421, p=0.001 |
| * | Auditory.MCC - Visual.R.V1 | r = 0.375, p=0.002 |
| * | ExecuContr.R.PFC - ExecuContr.R.Parietal | r = 0.361, p=0.004 |
| * | ExecuContr.DMPFC - Auditory.MCC | r = −0.351, p=0.005 |
| * | ExecuContr.L.PFC - Salience.dACC | r = −0.335, p=0.007 |
| * | Sensorimotor.R.M1 - Sensorimotor.SMA | r = −0.330, p=0.008 |
| * | Sensorimotor.R.M1 - Auditory.L.A1 | r = 0.319, p=0.011 |
| * | Salience.dACC - Visual.R.V1 | r = 0.319, p=0.011 |
| * | ExecuContr.DMPFC - Sensorimotor.L.M1 | r = −0.310, p=0.013 |
| * | DMN.R.LatP - Visual.R.V4 | r = −0.306, p=0.015 |
| * | ExecuContr.L.Parietal - Sensorimotor.L.M1 | r = −0.302, p=0.016 |
| * | DMN.aMPFC - Salience.dACC | r = −0.292, p=0.020 |
| * | DMN.aMPFC - Sensorimotor.L.M1 | r = −0.286, p=0.023 |
| * | DMN.aMPFC - DMN.PCC | r = 0.275, p=0.029 |
| * | ExecuContr.R.Parietal - Visual.R.V4 | r = −0.270, p=0.033 |
| * | DMN.aMPFC - Sensorimotor.R.M1 | r = −0.268, p=0.034 |
| * | ExecuContr.R.Parietal - Sensorimotor.R.M1 | r = −0.263, p=0.037 |
| * | Sensorimotor.L.M1 - Sensorimotor.SMA | r = −0.261, p=0.039 |
| * | DMN.R.LatP - Sensorimotor.R.M1 | r = −0.261, p=0.039 |
| * | ExecuContr.R.Parietal - Visual.L.V4 | r = −0.257, p=0.042 |
| * | Salience.dACC - Visual.L.V4 | r = 0.256, p=0.043 |
| * | ExecuContr.DMPFC - Sensorimotor.R.M1 | r = −0.255, p=0.043 |
| * | DMN.aMPFC - Visual.L.V1 | r = 0.251, p=0.047 |
| * | Salience.R.AIns - Sensorimotor.L.M1 | r = 0.250, p=0.049 |
| * | DMN.L.LatP - Sensorimotor.SMA | r = 0.248, p=0.050 |
-
Specifically, the functional connectivity features were the functional connectivity between any pair of ROIs. As there were more than 200 functional connectivity features, because of space limitations, only the functional connectivity features that were significantly correlated to the CRS-R scores at the T1 time point are shown. **: p<0.05, FDR corrected; *: p<0.05, uncorrected.
Additional files
-
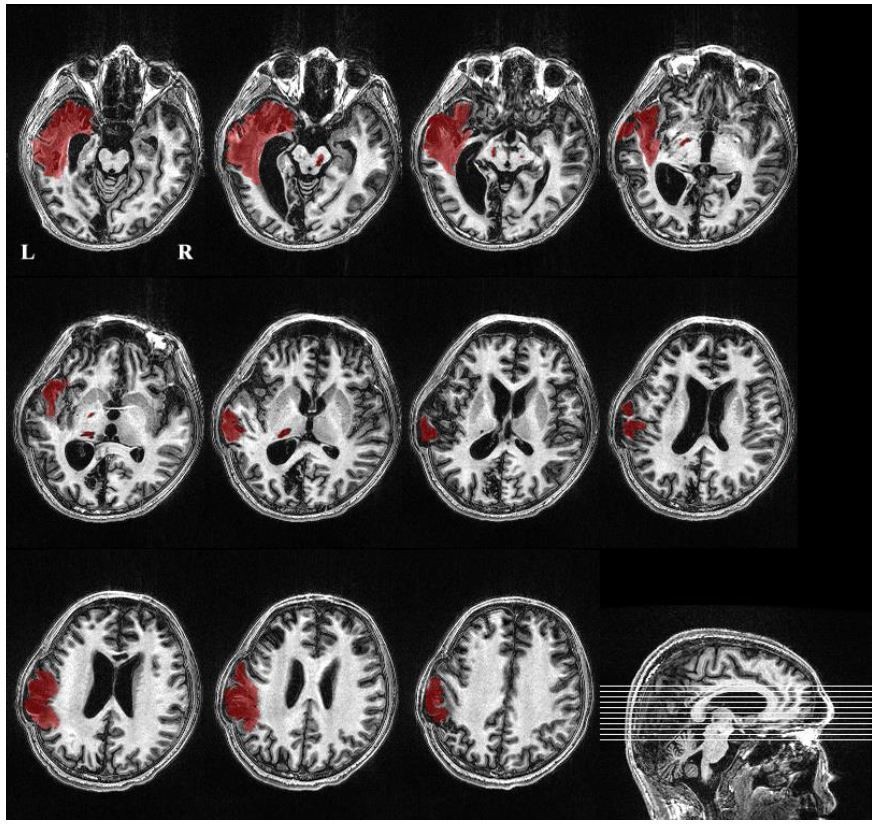
Supplementary file 1
Some examples of the warped ROIs in the default mode network for one healthy control and three DOC patients with a GOS score of 2,3 and 4, respectively.
- https://doi.org/10.7554/eLife.36173.011
-
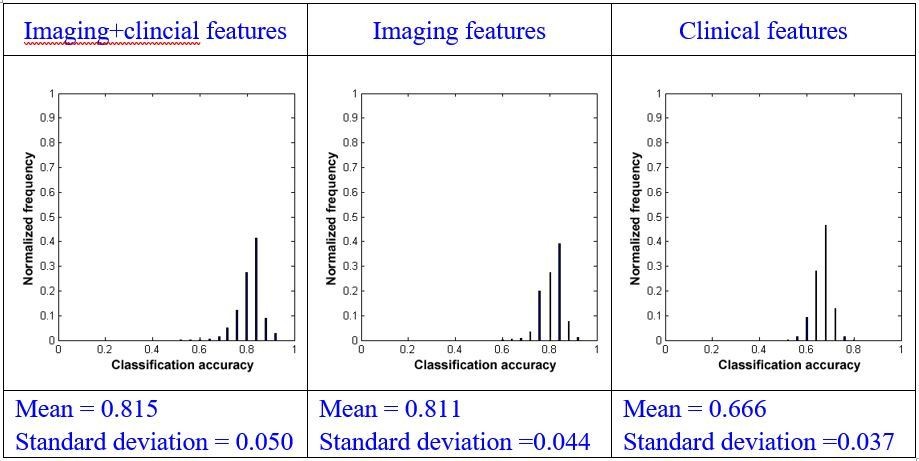
Supplementary file 2
Details about single-domain prognostic models and comparisons of the single-domain and combination models.
- https://doi.org/10.7554/eLife.36173.012
-
Transparent reporting form
- https://doi.org/10.7554/eLife.36173.013
Download links
A two-part list of links to download the article, or parts of the article, in various formats.
Downloads (link to download the article as PDF)
Open citations (links to open the citations from this article in various online reference manager services)
Cite this article (links to download the citations from this article in formats compatible with various reference manager tools)
Prognostication of chronic disorders of consciousness using brain functional networks and clinical characteristics
eLife 7:e36173.
https://doi.org/10.7554/eLife.36173


