Structural basis for potent and broad inhibition of HIV-1 RT by thiophene[3,2-d]pyrimidine non-nucleoside inhibitors
- Yale University, United States
- Shandong University, China
- Rega Institute for Medical Research, KU Leuven, Belgium
Figures
Figure 1
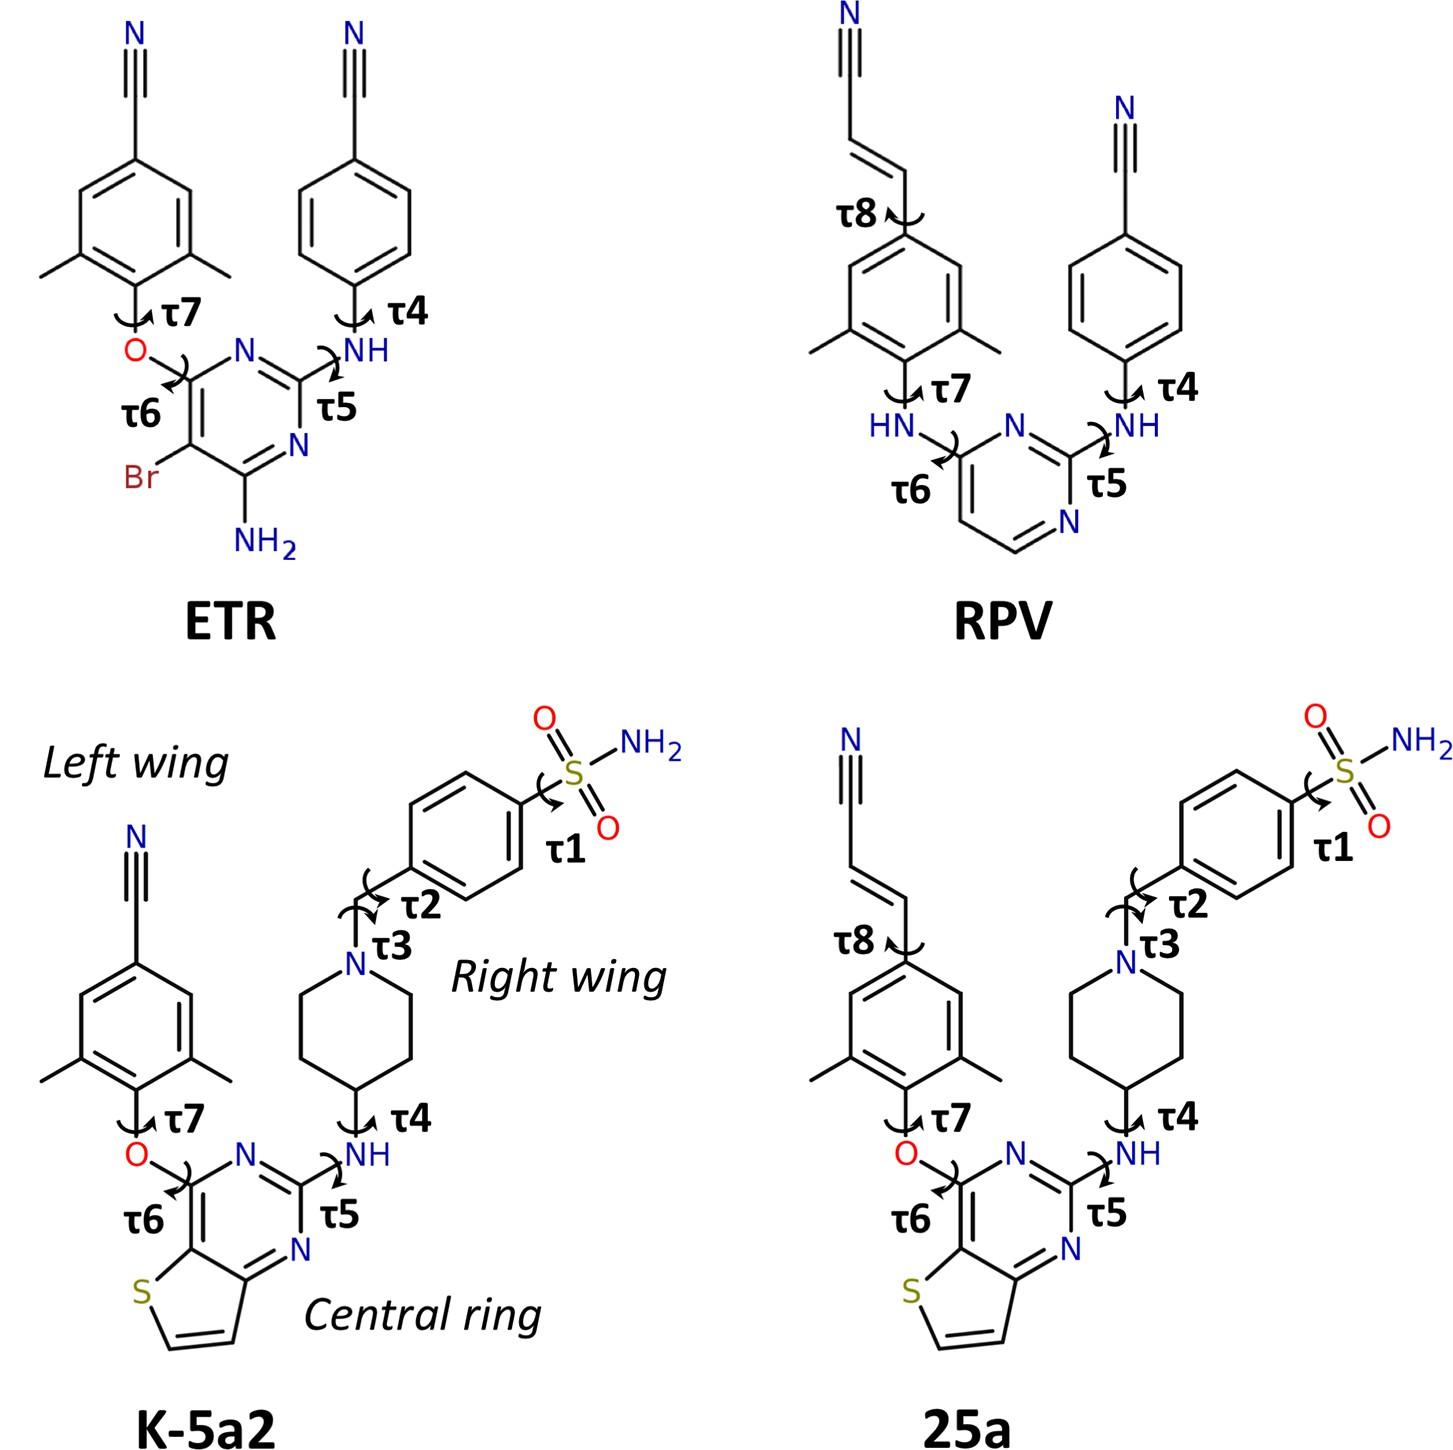
Chemical structures of NNRTIs.
The torsion angles defining the rotatable bonds are labeled as τ1 to τ7 in K-5a2 and τ1 to τ8 in 25a. The equivalent torsion angles in ETR and RPV are labeled as τ4 to τ7 and τ4 to τ8, respectively. The structures of K-5a2 and 25a can be divided into three functional regions: a thiophene[3,2-d]pyrimidine central ring, a piperidine-linked benzenesulfonamide right wing, and a 4-cyano- (or 4-cyanovinyl-) 2,6-dimethylpheyl left wing.
Figure 2 with 1 supplement
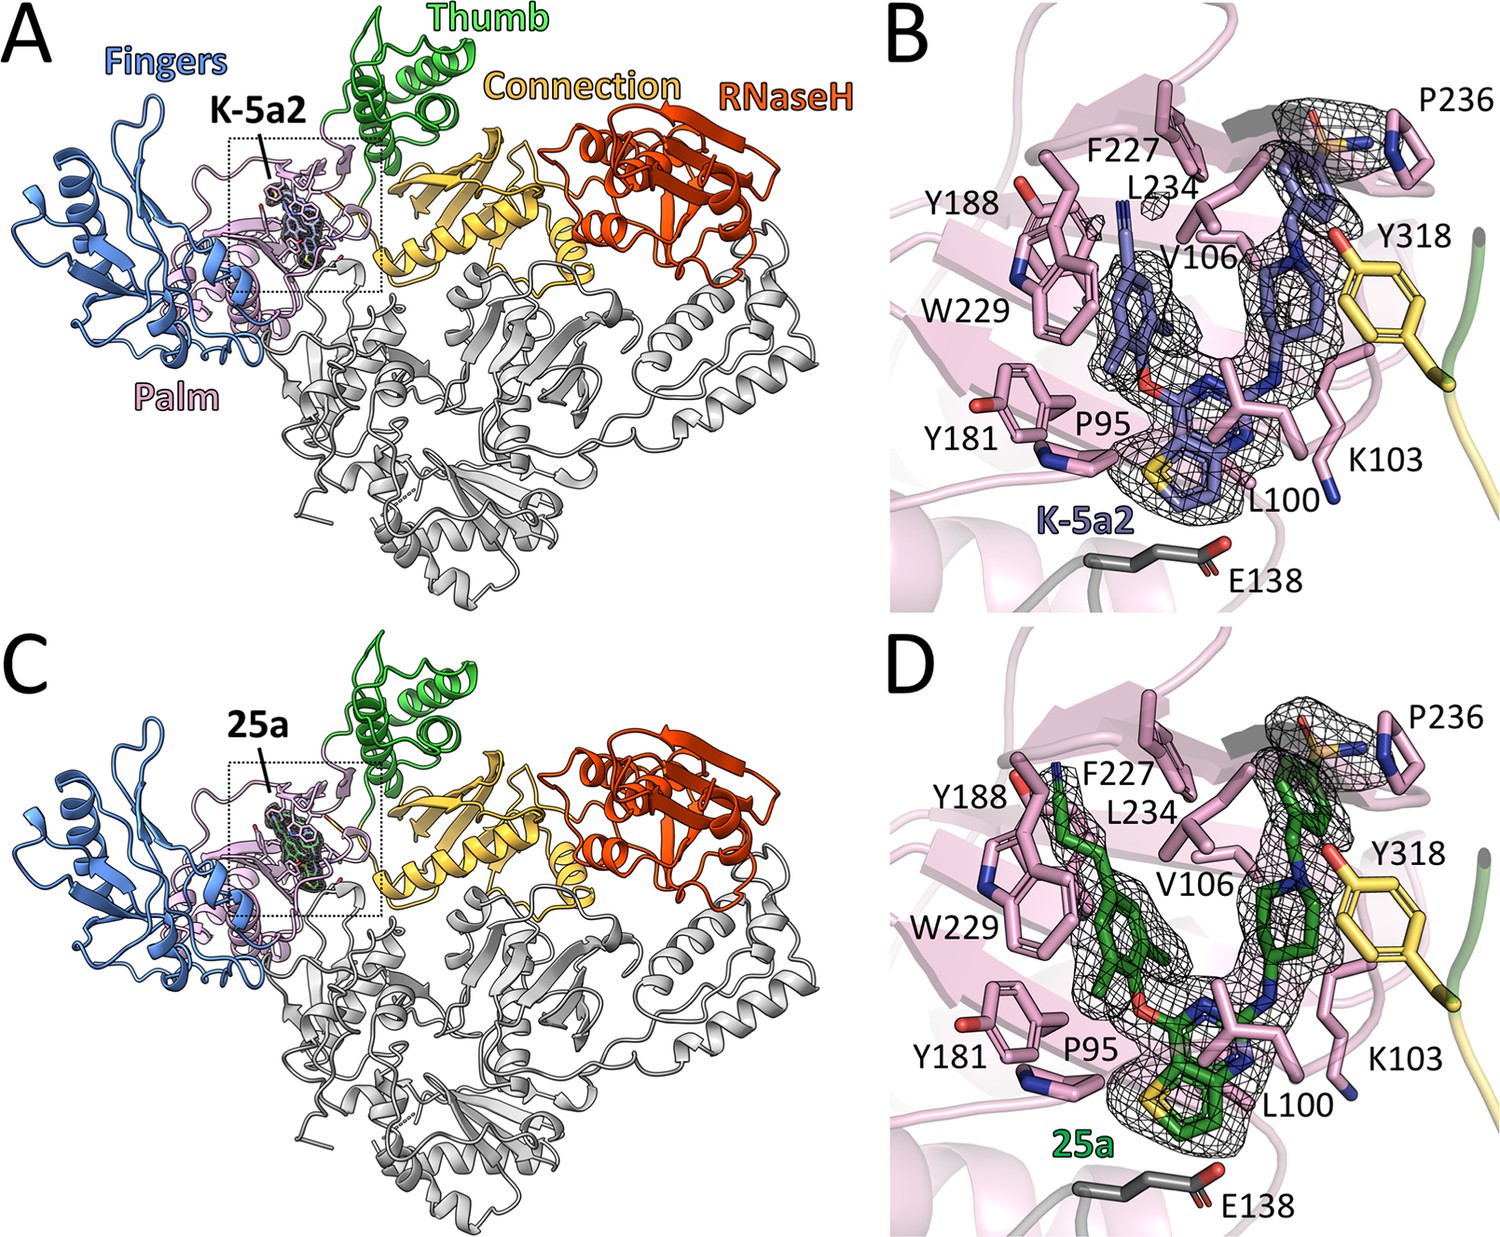
Structure of HIV-1 RT in complex with compound K-5a2 and 25a.
(A) and (C) Overall structure of the HIV-1 WT RT in complex with compound K-5a2 determined at 1.92 Å resolution (A) and with compound 25a determined at 2.0 Å resolution (C). The p51 subunit is colored in gray, the fingers domain of the p66 subunit is colored in light blue, palm domain in pink, thumb domain in light green, connection domain in yellow, RNase H domain in red. Compound K-5a2 is in dark blue and compound 25a is in dark green. (B) and (D) An enlarged view of compound K-5a2 (B) and compound 25a (D) in the NNIBP with contacting residues shown as sticks. Compound K-5a2 and 25a are superposed with the electron density of their respective Fo–Fc omit map (sharpened by applying a B-factor correction of –35 and contoured at 2.7σ).
Figure 2—figure supplement 1
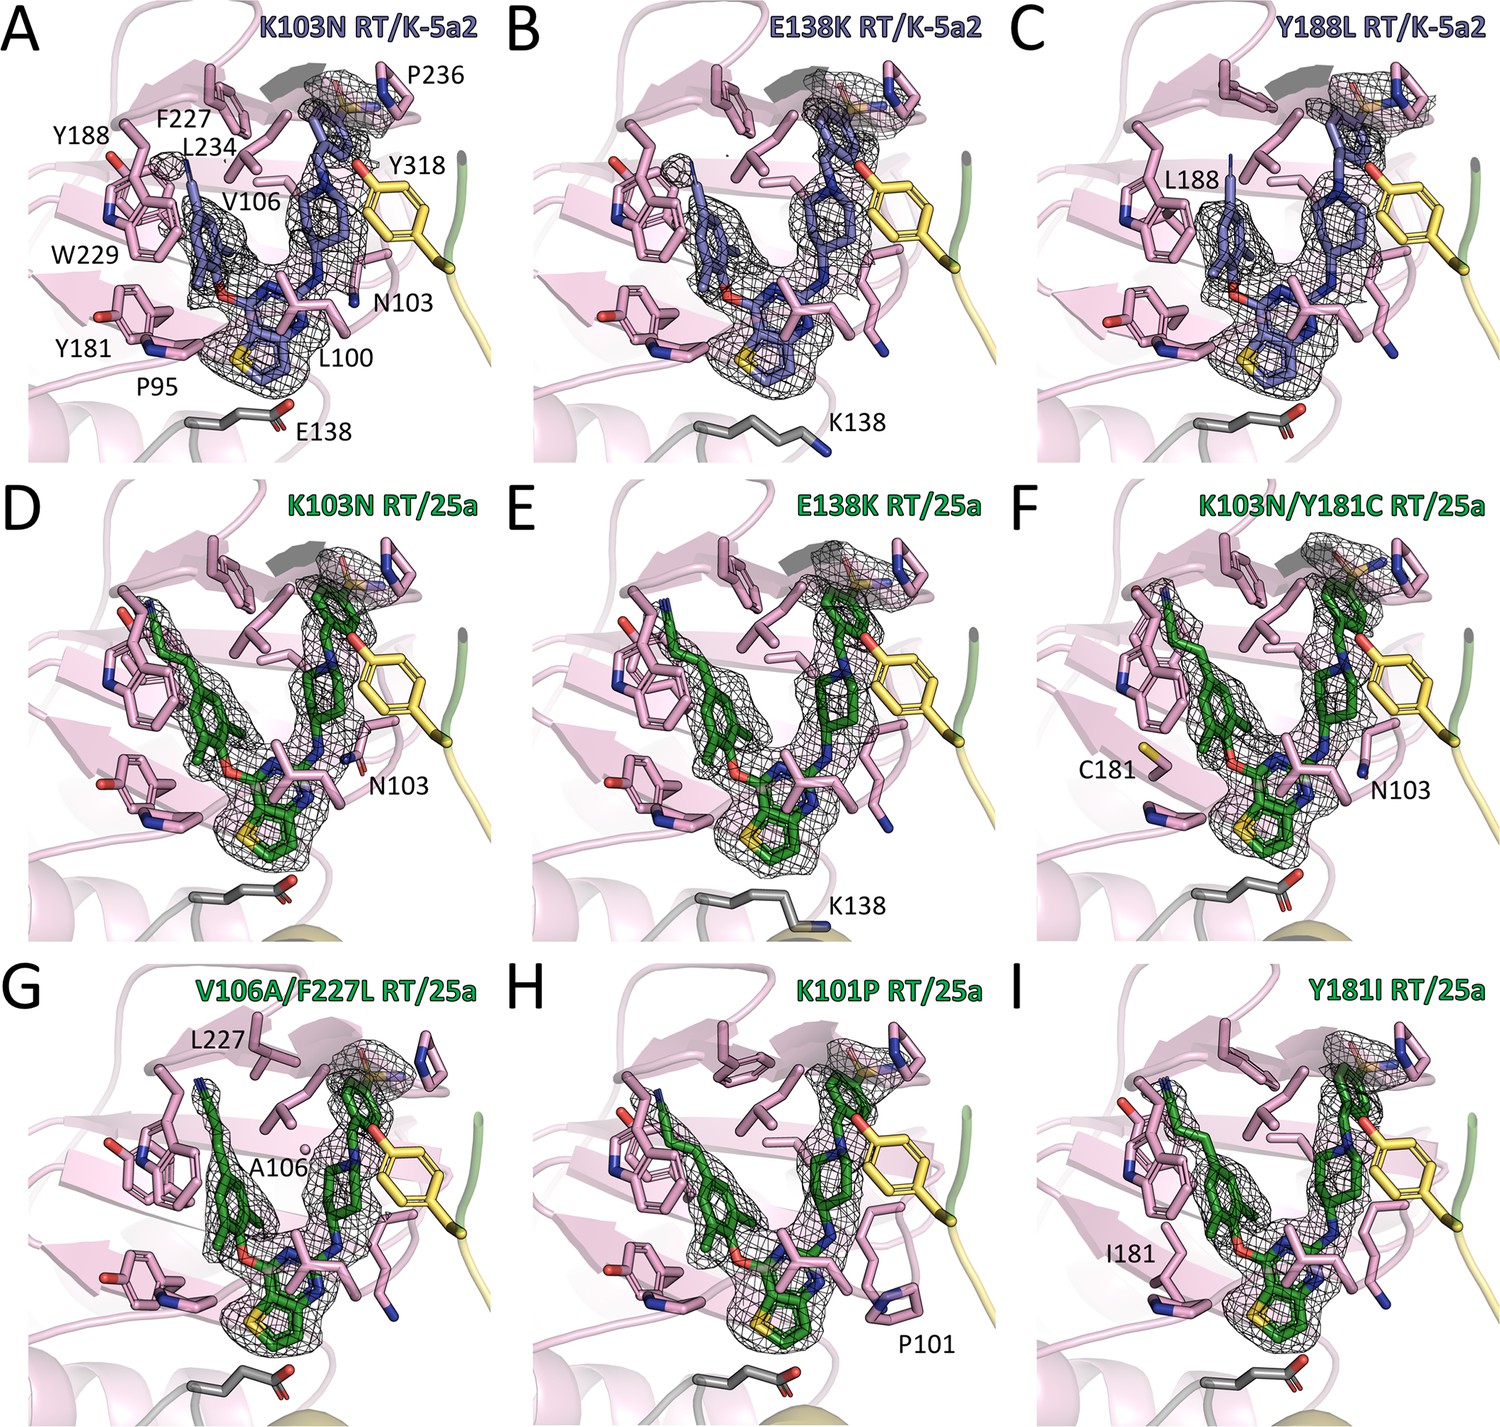
Structures of different RT mutants in complex with K-5a2 or 25a.
Structures of (A) K103N RT in complex with K-5a2. (B) E138K RT in complex with K-5a2. (C) Y188L RT in complex with K-5a2. (D) K103N RT in complex with 25a. (E) E138K RT in complex with 25a. (F) K103N/Y181C RT in complex with 25a. (G) V106A/F227L RT in complex with 25a. (H) K101P RT in complex with 25a. (I) Y181I RT in complex with 25a. Residues in the p51 subunit of RT are colored in gray, residues in the palm domain of the p66 subunit are colored in pink, and connection domain in yellow. Compound K-5a2 is in dark blue and compound 25a is in dark green. Both compounds are superposed with the electron density of their Fo–Fc omit maps (sharpened by applying a B-factor correction of –35 and contoured at 2.7σ).
Figure 3 with 1 supplement

Detailed interactions between WT RT and compound 25a.
(A) Back, (B) front and (C) top views of compound 25a in the NNIBP of RT. The inhibitor-binding pocket is in surface presentation and key residues are depicted as sticks. (D) Hydrogen bonds between compound 25a and the main chains of NNIBP residues. Residues in the p51 subunit are colored in gray, and residues in the p66 subunit are colored in pink.
Figure 3—figure supplement 1
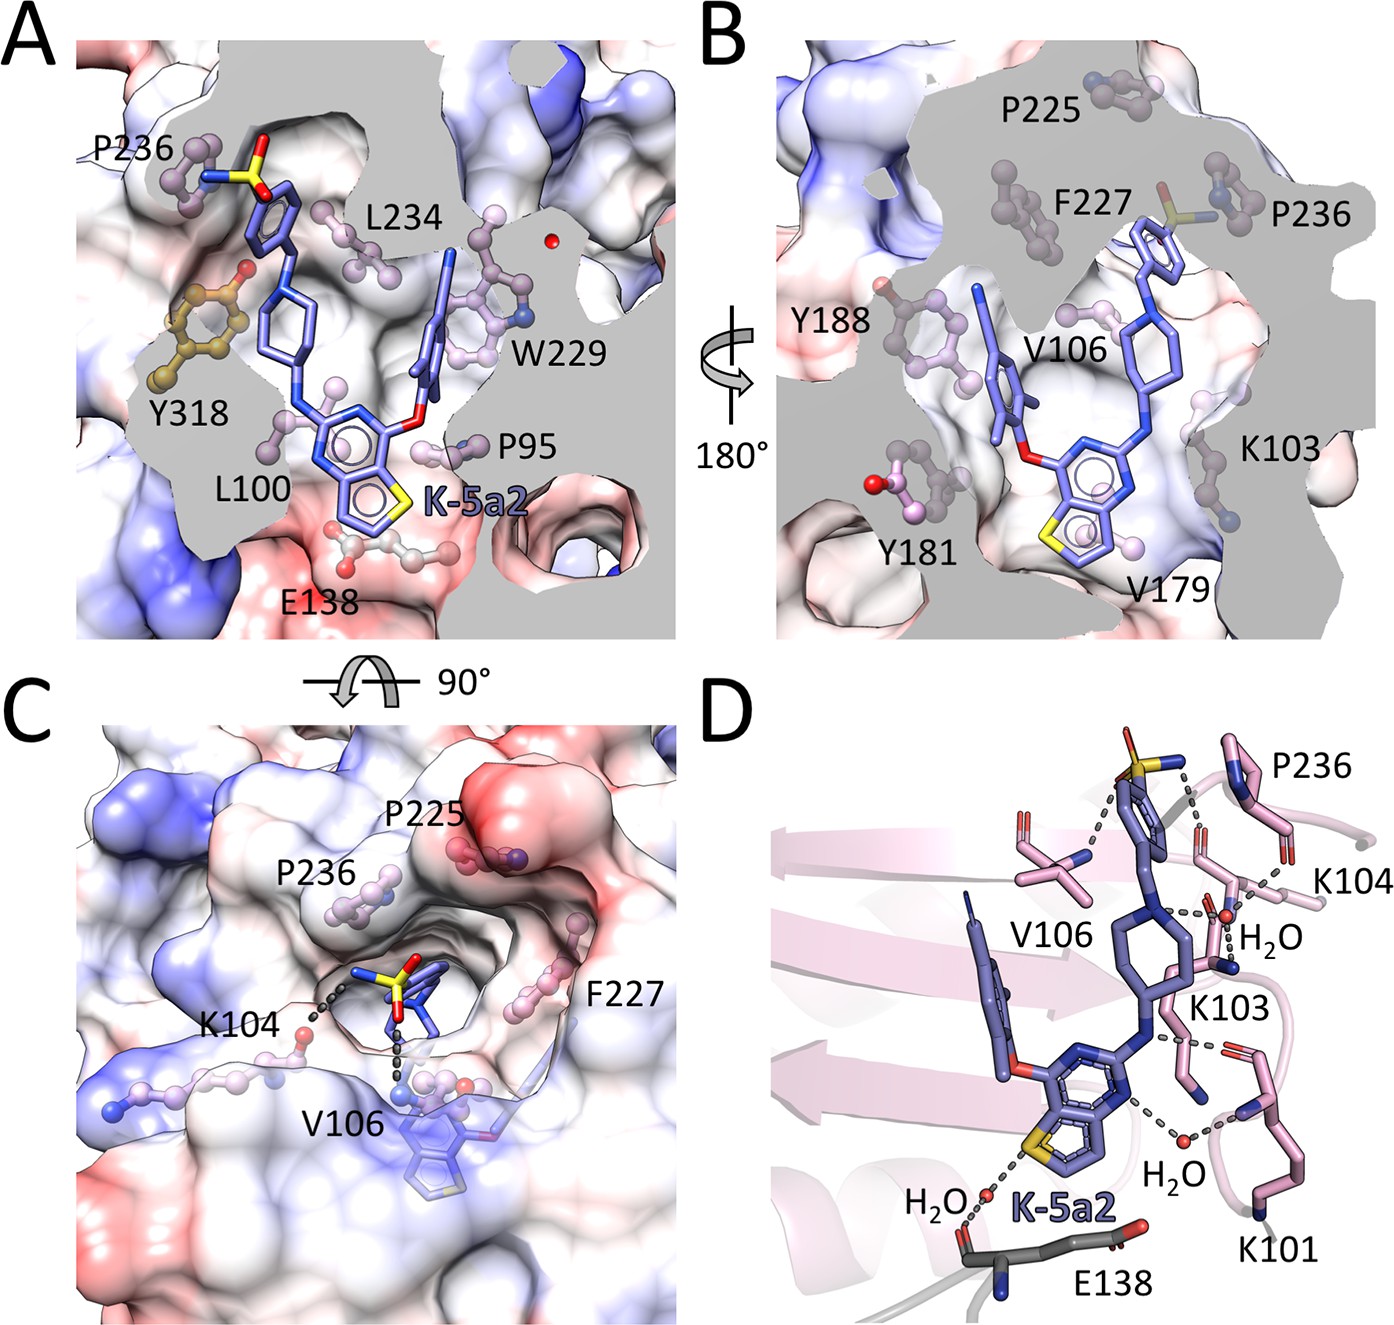
Detailed interactions between WT RT and compound K-5a2.
(A) Back, (B) front and (C) top views of compound K-5a2 in the NNIBP of RT. The inhibitor-binding pocket is in surface presentation and key residues are depicted as sticks. (D) Hydrogen bonds between compound K-5a2 and the main chains of NNIBP residues. Residues in the p51 subunit are colored in gray, and residues in the p66 subunit are colored in pink.
Figure 4
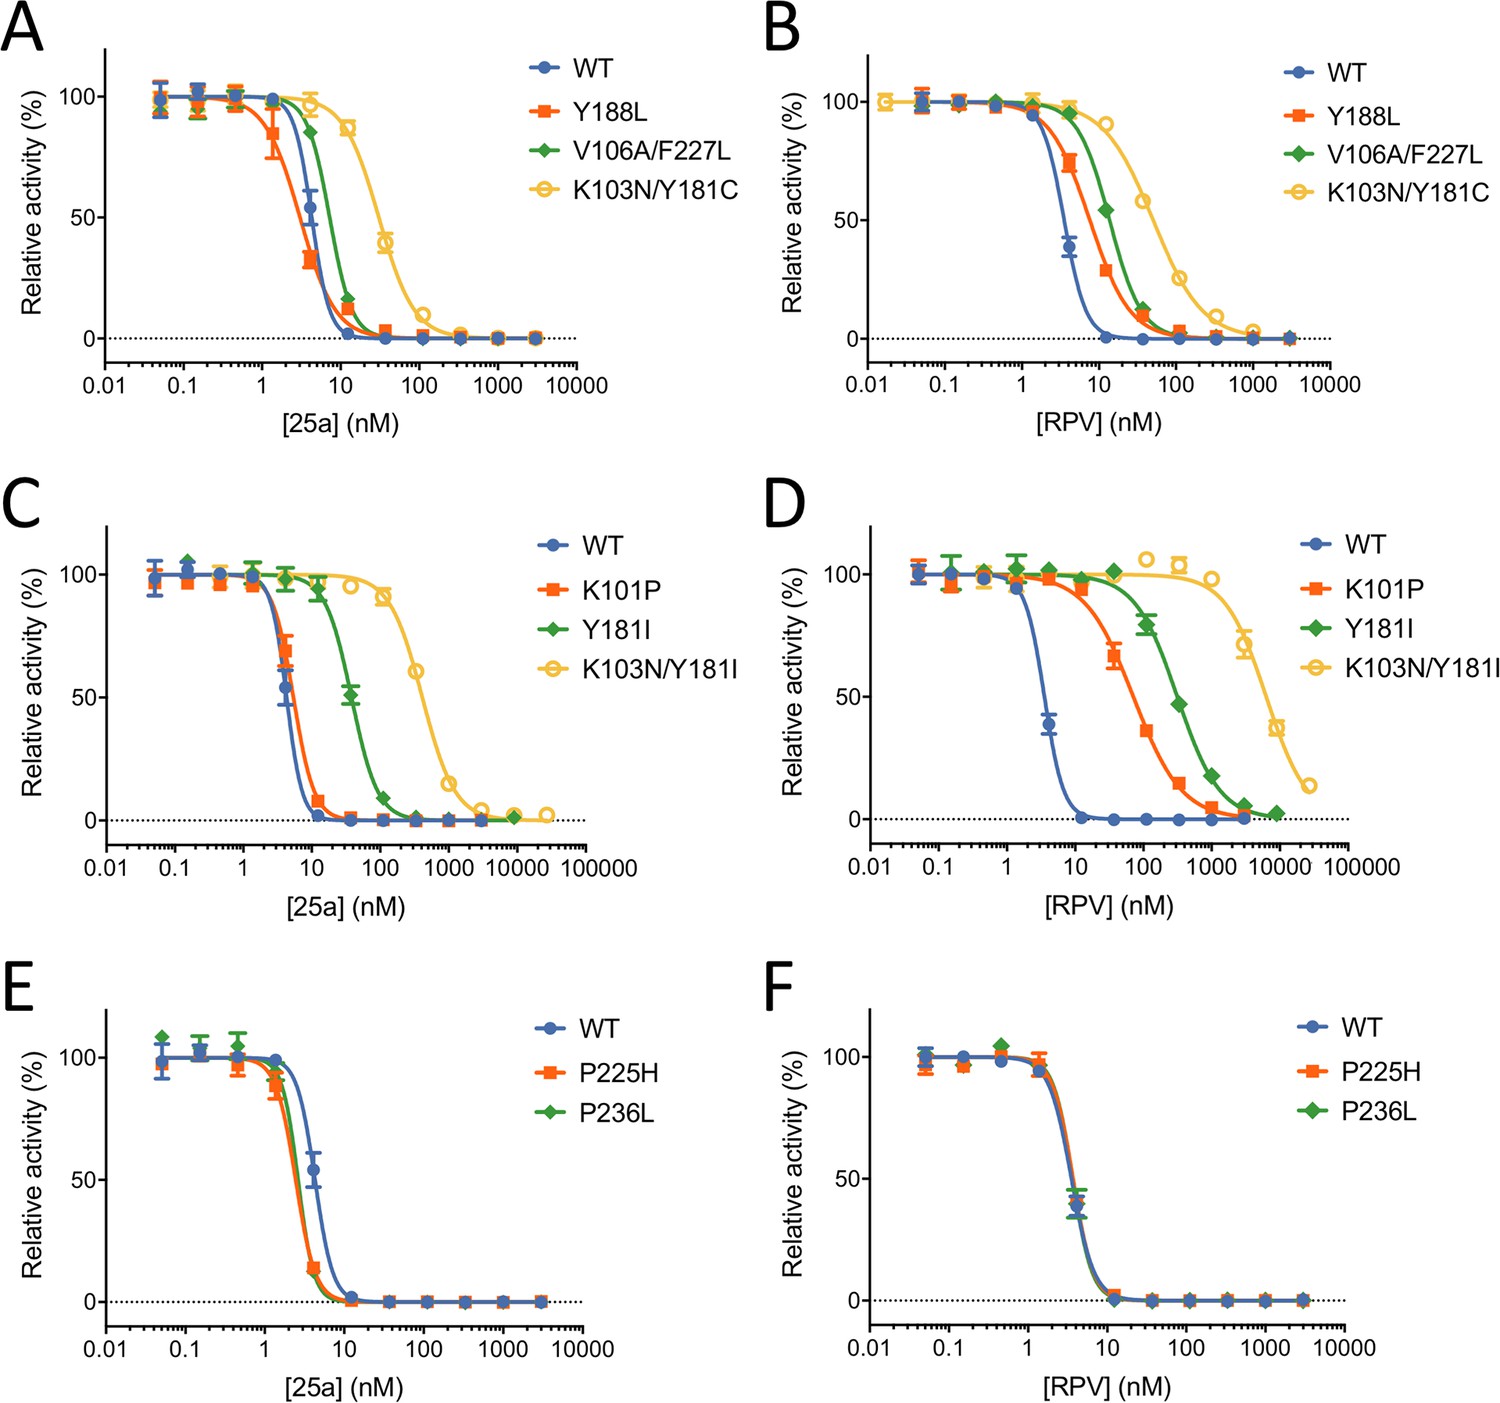
In vitro Inhibition of HIV-1 RT by 25a and RPV.
(A) and (B) Inhibition curves of WT RT, Y188L RT, K103N/Y181C RT and V106A/F227L RT by 25a and RPV. (C) and (D) Inhibition curves of WT RT, K101P RT, Y181I RT and K103N/Y181I RT by 25a and RPV. (E) and (F) Inhibition curves of WT RT, P225H RT and P236L RT by 25a and RPV. Each data point is shown as mean ± standard error (n = 3). The data are fitted into inhibition dose-response curves with variable slopes. All datasets have excellent goodness of fit with R2 ≥ 0.99 except for the inhibition curve of RPV against K103N/Y181I RT (R2 = 0.98). The IC50 and curve slope values are summarized in Table 2.
Figure 5 with 1 supplement
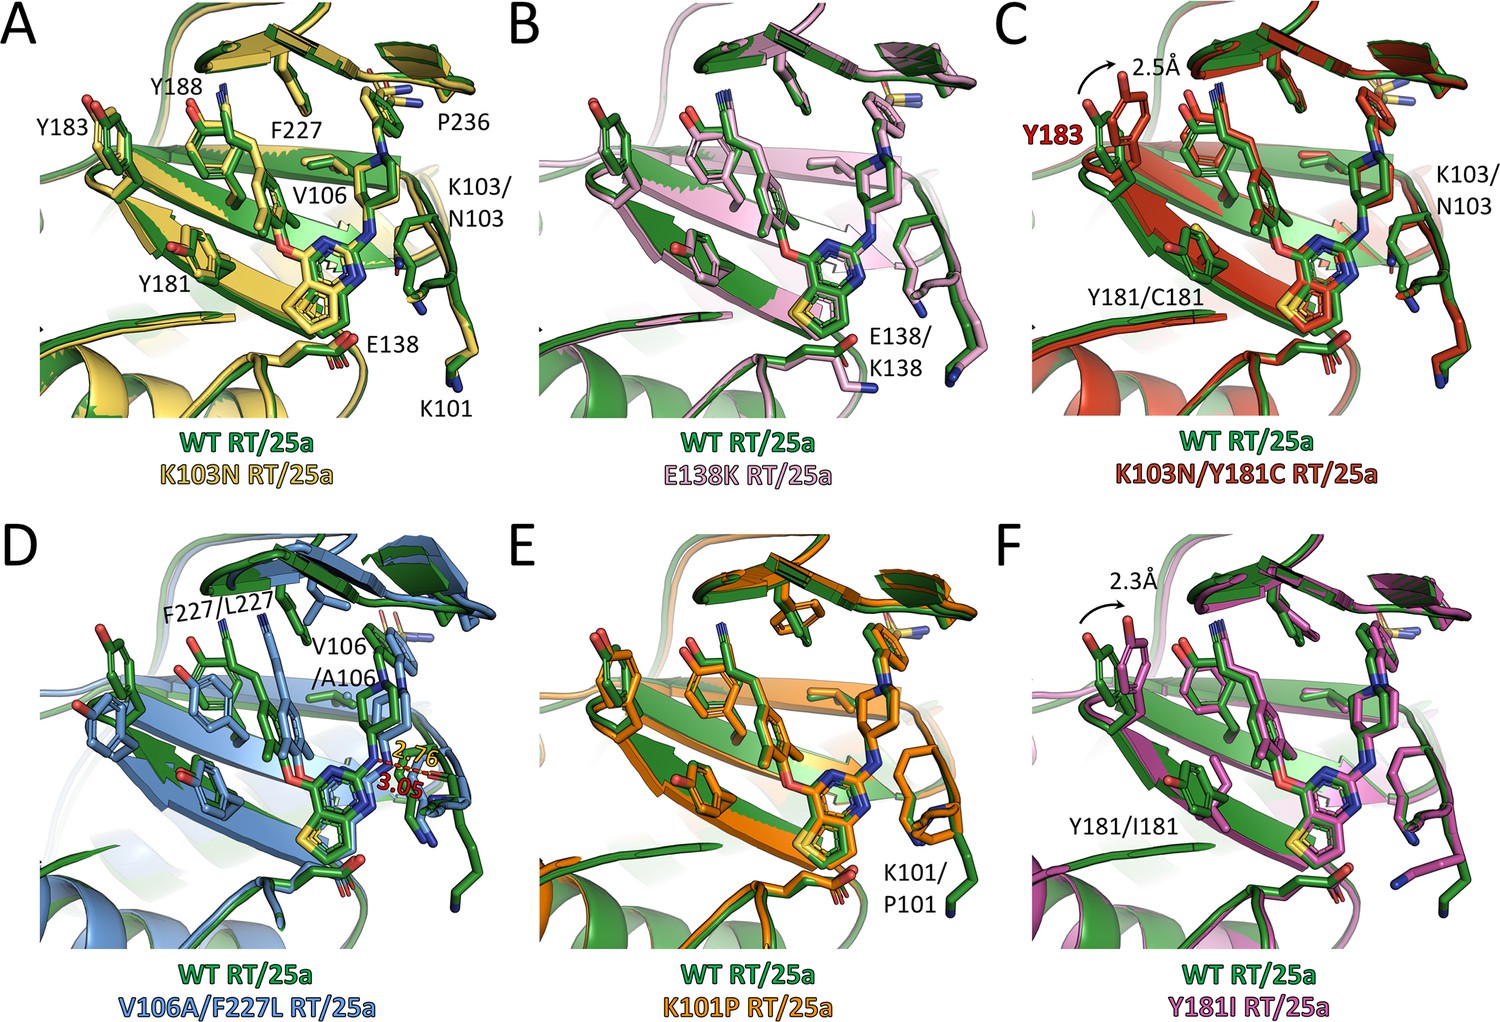
Comparison of the conformations of 25a in different RT complexes.
Superposition of (A) K103N RT/25a complex structure, (B) E138K RT/25a complex structure, (C) K103N/Y181C RT/25a complex structure, (D) V106A/F227L RT/25a complex structure, (E) K101P RT/25a complex structure, and (F) Y181I RT/25a complex structure onto WT RT/25a complex structure. The structure of WT RT/25a complex is colored in green, K103N RT/25a complex in yellow, E138K RT/25a complex in pink, K103N/Y181C RT/25a complex in red, V106A/F227L RT/25a complex in blue, K101P RT/25a complex in orange, and Y181I RT/25a complex in magenta. Distances are in angstrom (Å).
Figure 5—figure supplement 1
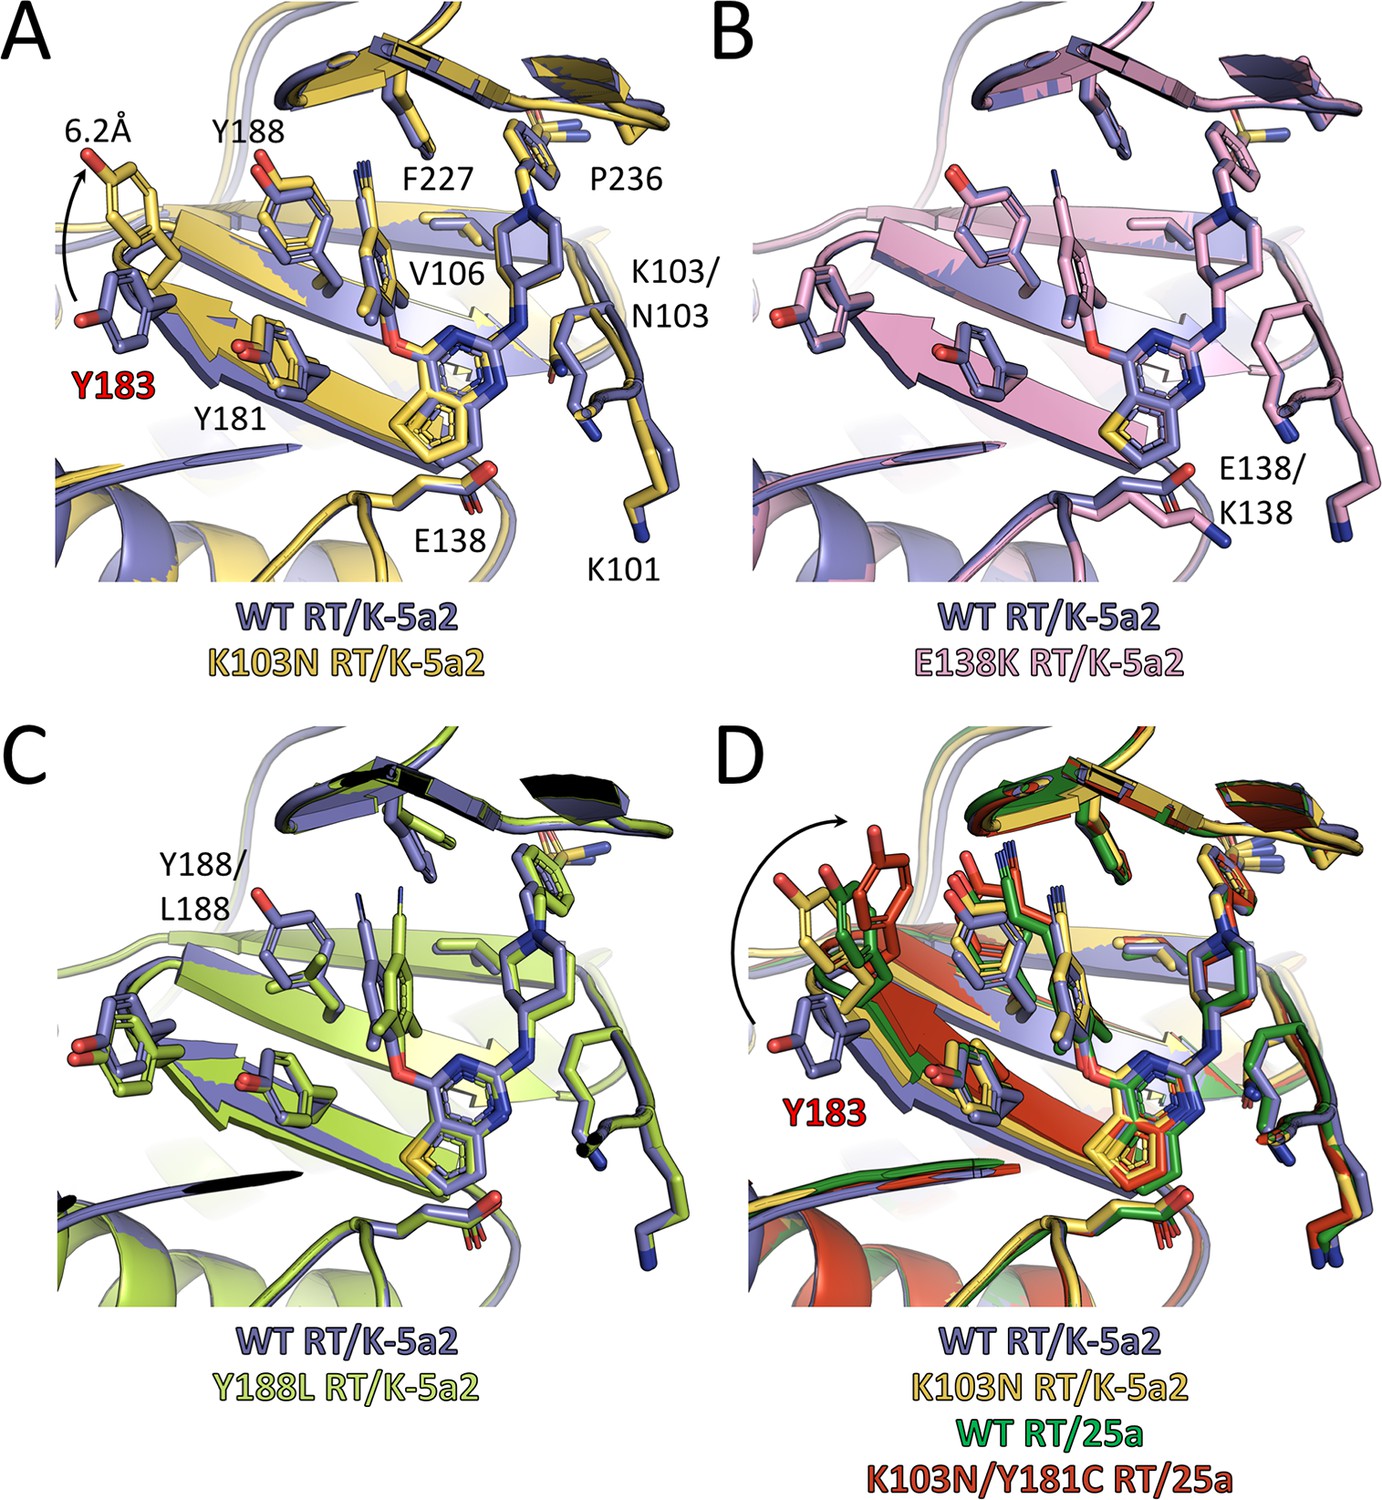
Comparison of the conformations of K-5a2 and 25a in different RT complexes.
Superposition of (A) K103N RT/K-5a2 complex structure, (B) E138K RT/K-5a2 complex structure and (C) Y188L RT/K-5a2 complex structure onto WT RT/K-5a2 complex structure. (D) Superposition of K103N RT/K-5a2 complex structure, WT RT/25a complex structure, and K103N/Y181C RT/25a complex structure onto WT RT/K-5a2 complex structure. The structure of WT RT/K-5a2 complex is colored in blue, K103N RT/K-5a2 complex in yellow, E138K RT/K-5a2 complex in pink, Y188L RT/K-5a2 complex in light green, WT RT/25a complex in green, and K103N/Y181C RT/25a complex in red.
Figure 6 with 1 supplement
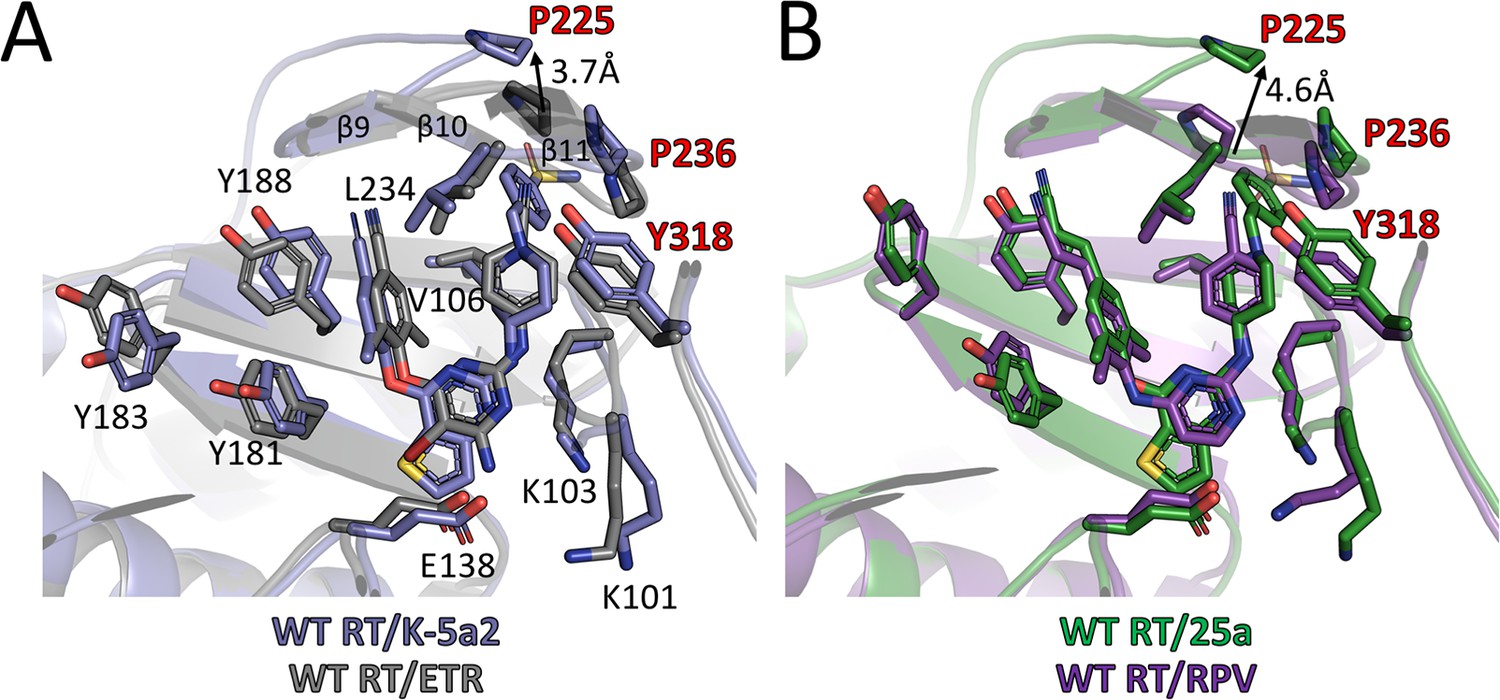
Comparison of the binding modes for K-5a2, 25a, ETR and RPV in RT.
(A) Superposition of WT RT/ETR complex structure (PDB ID: 3MEC) onto WT RT/K-5a2 complex structure. The structure of WT RT/K-5a2 complex is colored in blue and WT RT/ETR complex in gray. (B) Superposition of WT RT/RPV complex structure (PDB ID: 4G1Q) onto WT RT/25a complex structure. The structure of WT RT/25a complex is colored in green and WT RT/RPV complex in purple.
Figure 6—figure supplement 1
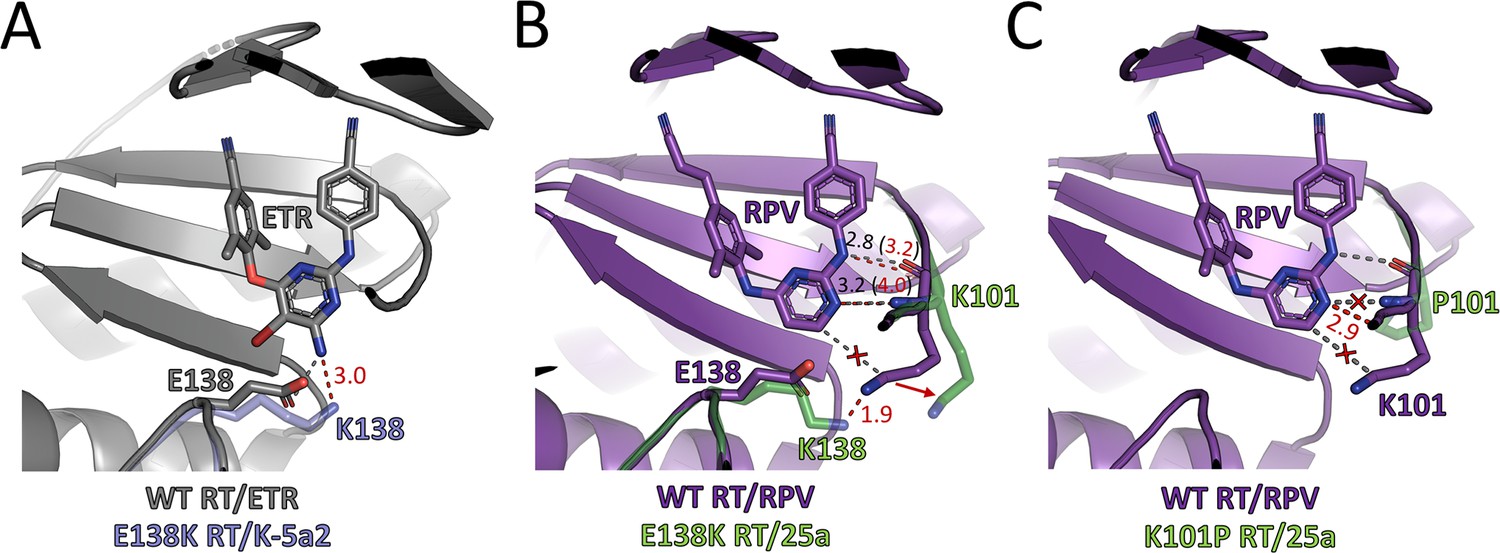
Mechanisms of resistance to ETR and RPV in E138K RT and K101P RT.
(A) The structure of WT RT/ETR complex (PDB ID: 3MEC) is colored in gray. Lys138 (transparent blue) from the structure of E138K RT/K-5a2 complex is grafted here to illustrate the expected effects on ETR-binding upon E138K mutation. (B) The structure of WT RT/RPV complex (PDB ID: 4G1Q) is colored in purple. Lys101 and Lys138 (transparent green) from the structure of E138K RT/25a complex are grafted here to show the likely conformational changes at the entrance of NNIBP imparted by E138K mutation. (C) The structure of WT RT/RPV complex (PDB ID: 4G1Q) is colored in purple. Pro101 (transparent green) from the structure of K101P RT/25a complex is grafted here to demonstrate the possible changes in the RT-RPV interactions caused by the mutation. Graydotted lines represent favorable interactions between WT RT and ETR or RPV. Red crosses indicate favorable interactions disrupted by resistance mutations. Red dotted lines indicate possible unfavorable interactions between the RT mutants and the two inhibitors. Distances are in angstrom (Å).
Tables
Table 1
Anti-HIV-1 activity and cytotoxicity of K-5a2, 25a, etravirine (ETR) and rilpivirine (RPV) against wild-type (WT) HIV-1 and selected mutant HIV-1 strains in MT-4 cell assays.
https://doi.org/10.7554/eLife.36340.008| Inhibitor | K-5a2* | 25a† | ETR‡ | RPV‡ | |
|---|---|---|---|---|---|
| EC50 (nM) | WT | 1.4 ± 0.43§ | 1.2 ± 0.26 | 4.1 ± 0.15 | 0.99 ± 0.27 |
| L100I | 3.4 ± 0.66 | 1.3 ± 0.50 | 5.4 ± 2.1 | 1.5 ± 0.0011 | |
| K103N | 2.9 ± 0.014 | 0.96 ± 0.07 | 2.4 ± 0.67 | 1.3 ± 0.36 | |
| E138K | 2.9 ± 0.021 | 4.7 ± 0.16 | 14 ± 2.3 | 5.7 ± 0.11 | |
| Y181C | 3.2 ± 0.48 | 5.0 ± 0.11 | 16 ± 2.1 | 5.0 ± 0.48 | |
| K103N/Y181C | 31 ± 12 | 5.5 ± 0.81 | 17 ± 1.8 | 11 ± 1.9 | |
| CC50 (µM) | >227 | 2.3 ± 0.47 | >4.6 | 4.0 ± 1.2 | |
-
* Results from (Kang et al., 2016).
† Results from (Kang et al., 2017).
-
‡ The data were obtained from the same laboratory using the same method.
§ Data reported as mean ± standard deviations.
Table 2
In vitro inhibition of HIV-1 reverse transcriptase by 25a and RPV.
https://doi.org/10.7554/eLife.36340.009| RT variants | 25a | RPV | ||||
|---|---|---|---|---|---|---|
| IC50 (nM) | Fold R* | Curve slope | IC50 (nM) | Fold R | Curve slope | |
| WT | 4.3 ± 0.080† | – | 3.8 ± 0.70 | 3.5 ± 0.052 | – | 3.1 ± 0.17 |
| K103N/Y181C | 31 ± 0.83 | 7.2 | 1.9 ± 0.092 | 51 ± 1.5 | 15 | 1.4 ± 0.047 |
| Y188L | 3.0 ± 0.15 | 0.70 | 1.9 ± 0.16 | 7.6 ± 0.22 | 2.2 | 1.7 ± 0.069 |
| V106A/F227L | 7.3 ± 0.23 | 1.7 | 3.1 ± 0.17 | 14 ± 0.27 | 4.0 | 2.1 ± 0.083 |
| K101P | 5.4 ± 0.16 | 1.3 | 2.9 ± 0.21 | 71 ± 3.0 | 20 | 1.2 ± 0.056 |
| Y181I | 38 ± 1.1 | 8.8 | 2.3 ± 0.16 | 315 ± 15 | 90 | 1.4 ± 0.081 |
| K103N/Y181I | 412 ± 13 | 96 | 1.8 ± 0.094 | 6317 ± 339 | 1805 | 1.4 ± 0.10 |
| P225H | 2.5 ± 0.059 | 0.58 | 3.5 ± 0.15 | 3.7 ± 0.070 | 1.1 | 3.4 ± 0.34 |
| P236L | 2.6 ± 0.13 | 0.60 | 4.3 ± 0.43 | 3.7 ± 0.085 | 1.1 | 3.6 ± 0.47 |
-
* Mean fold change in the IC50 values of mutant RT versus WT RT.
† Data reported as mean ±standard error.
Table 3
Root mean square deviations (RMSDs) of Cα atoms (Å) for the alignments between different RT/NNRTI complexes structures.
https://doi.org/10.7554/eLife.36340.012| Overall | NNIBP region | |
|---|---|---|
| WT RT/K-5a2 and K103N RT/K-5a2 | 0.283 | 0.579 |
| WT RT/K-5a2 and E138K RT/K-5a2 | 0.094 | 0.095 |
| WT RT/K-5a2 and Y188L RT/K-5a2 | 0.138 | 0.293 |
| WT RT/25a and K103N RT/25a | 0.250 | 0.430 |
| WT RT/25a and E138K RT/25a | 0.162 | 0.290 |
| WT RT/25a and K103N/Y181C RT/25a | 0.175 | 0.499 |
| WT RT/25a and V106A/F227L RT/25a | 0.245 | 1.108 |
| WT RT/25a and K101P RT/25a | 0.253 | 0.292 |
| WT RT/25a and Y181I RT/25a | 0.182 | 0.297 |
Table 4
Buried area (Å2) between HIV-1 RT and each NNRTI*.
https://doi.org/10.7554/eLife.36340.013| Total | Individual residue | |||||||||
|---|---|---|---|---|---|---|---|---|---|---|
| 101 | 103 | 106 | 181 | 183 | 188 | 227 | 236 | 138 | ||
| WT RT/K-5a2 | 584.1 | 46.5 | 81.2 | 91.1 | 63.9 | 0 | 75.4 | 89.3 | 69.6 | 54.6 |
| K103N RT/K-5a2 | 579.4 | 44.3 | 73.4 | 85.5 | 59.6 | 0 | 71.2 | 92.9 | 71.2 | 52.6 |
| E138K RT/K-5a2 | 587.9 | 44.3 | 83.5 | 89.6 | 63.0 | 0 | 72.9 | 86.4 | 69.9 | 54.3 |
| Y188L RT/K-5a2 | 571.3 | 44.3 | 83.0 | 93.9 | 57.9 | 0 | 70.0 | 73.2 | 74.0 | 51.5 |
| WT RT/25a | 620.5 | 51.9 | 88.2 | 91.7 | 68.5 | 19.6 | 84.8 | 96.9 | 68.4 | 54.8 |
| K103N RT/25a | 626.8 | 47.9 | 74.7 | 86.4 | 67.8 | 15.6 | 84.3 | 106 | 72.0 | 53.7 |
| E138K RT/25a | 621.4 | 45.5 | 87.1 | 92.5 | 66.4 | 14.0 | 86.6 | 98.4 | 69.1 | 54.1 |
| K103N/Y181C RT/25a | 624.7 | 51.9 | 76.1 | 86.8 | 56.5 | 33.5 | 83.2 | 106 | 73.3 | 54.1 |
| V106A/F227L RT/25a | 614.9 | 47.6 | 87.1 | 79.2 | 58.1 | 0 | 79.2 | 91.8 | 62.8 | 52.0 |
| K101P RT/25a | 613.6 | 62.6 | 93.9 | 90.7 | 66.6 | 21.1 | 85.6 | 89.9 | 70.5 | 53.5 |
| Y181I RT/25a | 618.5 | 62.9 | 90.9 | 90.8 | 58.9 | 31.5 | 84.6 | 99.8 | 71.7 | 52.4 |
-
* The buried area between HIV-1 RT and each NNRTI was calculated using UCSF ChimeraX.
Table 5
Torsion angles and energies of K-5a2 and 25a in different binding poses.
https://doi.org/10.7554/eLife.36340.014| Torsion angles (°) | NNRTI energy* (kcal/mol) | ||||||||
|---|---|---|---|---|---|---|---|---|---|
| τ1 | τ2 | τ3 | τ4 | τ5 | τ6 | τ7 | τ8 | ||
| WT RT/K-5a2 | 14 | −17 | −84 | −71 | 2 | −8 | −97 | — | −161.4 |
| K103N RT/K-5a2 | 11 | −23 | −83 | −73 | 6 | −11 | −102 | — | −162.4 |
| E138K RT/K-5a2 | 9 | −19 | −87 | −68 | 2 | −9 | −97 | — | −162.7 |
| Y188L RT/K-5a2 | 3 | −49 | −66 | −70 | 4 | −2 | −94 | — | −160.9 |
| WT RT/ETR† | — | — | — | 16 | −2 | −13 | −95 | — | N/A |
| WT RT/25a | 23 | −26 | −79 | −79 | 1 | 0 | −109 | −40 | −191.1 |
| K103N RT/25a | 7 | −22 | −81 | −74 | 3 | 0 | −110 | −53 | −187.7 |
| E138K RT/25a | 19 | −29 | −76 | −77 | 0 | 3 | −108 | −53 | −188.5 |
| K103N/Y181C RT/25a | −4 | −26 | −76 | −77 | 4 | −1 | −107 | −54 | −186.2 |
| V106A/F227L RT/25a | 14 | −24 | −72 | −82 | 4 | −4 | −103 | −163 | −187.3 |
| K101P RT/25a | 5 | −24 | −84 | −81 | 5 | 6 | −112 | −44 | −190.1 |
| Y181I RT/25a | −2 | −15 | −87 | −72 | 6 | 4 | −107 | −57 | −189.2 |
| WT RT/RPV‡ | — | — | — | 10 | −7 | −13 | −103 | −28 | N/A |
-
* The NNRTI energy refers to the energy of K-5a2 or 25a itself at the specific conformations in different RT complexes. It was calculated using the MacroModel program in the Schrödinger software suite.
† Torsion angles of ETR were measured using the structure from PDB ID: 3MEC.
-
‡ Torsion angles of RPV were measured using the structure from PDB ID: 4G1Q.
Key resources table
| Reagent type (species) or resource | Designation | Source or reference | Identifiers | Additional information |
|---|---|---|---|---|
| Strain, strain background (E.coli) | BL21 Star (DE3) | ThermoFisher Scientific | C601003 | Chemically Competent E.coli for the expression of recombinant RTs. |
| Strain, strain background (HIV-1 IIIB) | HIV-1 L100I | Established in house | ||
| Strain, strain background (HIV-1 IIIB) | HIV-1 K103N | Established in house | ||
| Strain, strain background (HIV-1 IIIB) | HIV-1 E138K | Established in house | ||
| Strain, strain background (HIV-1 IIIB) | HIV-1 Y181C | Established in house | ||
| Strain, strain background (HIV-1 IIIB) | HIV-1 K103N/Y181C | Established in house | ||
| Cell line (H. Sapiens) | MT-4 cells | NIH AIDS Reagent Program | NIH-ARP Cat# 120–438, RRID:CVCL_2632 | |
| Recombinant DNA reagent | pCDFDuet-1 | Millipore Sigma | 71340–3 | Expression plasmid for all RT variants in E.coli. |
| Peptide, recombinant protein | HRV 3C protease | Recombinantly expressed in house | Expressed as His-tagged fusion protein. | |
| Commercial assay or kit | EnzChek Reverse Transcriptase Assay kit | ThermoFisher Scientific | E22064 | |
| Chemical compound, drug | Compound K-5a2 | Synthesized in house | ||
| Chemical compound, drug | Compound 25a | Synthesized in house | ||
| Chemical compound, drug | etravirine | Sigma-Aldrich | ADV428293567 | |
| Chemical compound, drug | rilpivirine | Sigma-Aldrich | ADV465749297 | |
| Chemical compound, drug | PicoGreen dsDNA reagent | ThermoFisher Scientific | P7581 | |
| Software, algorithm | Coot | (Emsley et al., 2010) | RRID:SCR_014222 | |
| Software, algorithm | XDS | (Kabsch, 2010) | RRID:SCR_015652 | |
| Software, algorithm | PHASER | (McCoy et al., 2007) | RRID:SCR_014219 | |
| Software, algorithm | PHENIX suite | (Adams et al., 2010) | RRID:SCR_014224 | |
| Software, algorithm | PyMol v 2.0 | The PyMOL Molecular Graphics System, Schrödinger, LLC. | RRID:SCR_000305 | |
| Software, algorithm | MacroModel | Schrödinger suite | RRID:SCR_014879 | |
| Software, algorithm | UCSF Chimera | (Pettersen et al., 2004) | RRID:SCR_004097 | |
| Software, algorithm | UCSF ChimeraX | (Goddard et al., 2018) | RRID:SCR_015872 | |
| Software, algorithm | GraphPad Prism v 7.0a | GraphPad Software | RRID:SCR_002798 |
Additional files
-
Supplementary file 1
X-ray crystallography statistics from data collection and refinement.
- https://doi.org/10.7554/eLife.36340.017
-
Transparent reporting form
- https://doi.org/10.7554/eLife.36340.018
Download links
A two-part list of links to download the article, or parts of the article, in various formats.
Downloads (link to download the article as PDF)
Open citations (links to open the citations from this article in various online reference manager services)
Cite this article (links to download the citations from this article in formats compatible with various reference manager tools)
Structural basis for potent and broad inhibition of HIV-1 RT by thiophene[3,2-d]pyrimidine non-nucleoside inhibitors
eLife 7:e36340.
https://doi.org/10.7554/eLife.36340


