The universally-conserved transcription factor RfaH is recruited to a hairpin structure of the non-template DNA strand
- Universität Bayreuth, Germany
- The Ohio State University, United States
Figures
Figure 1
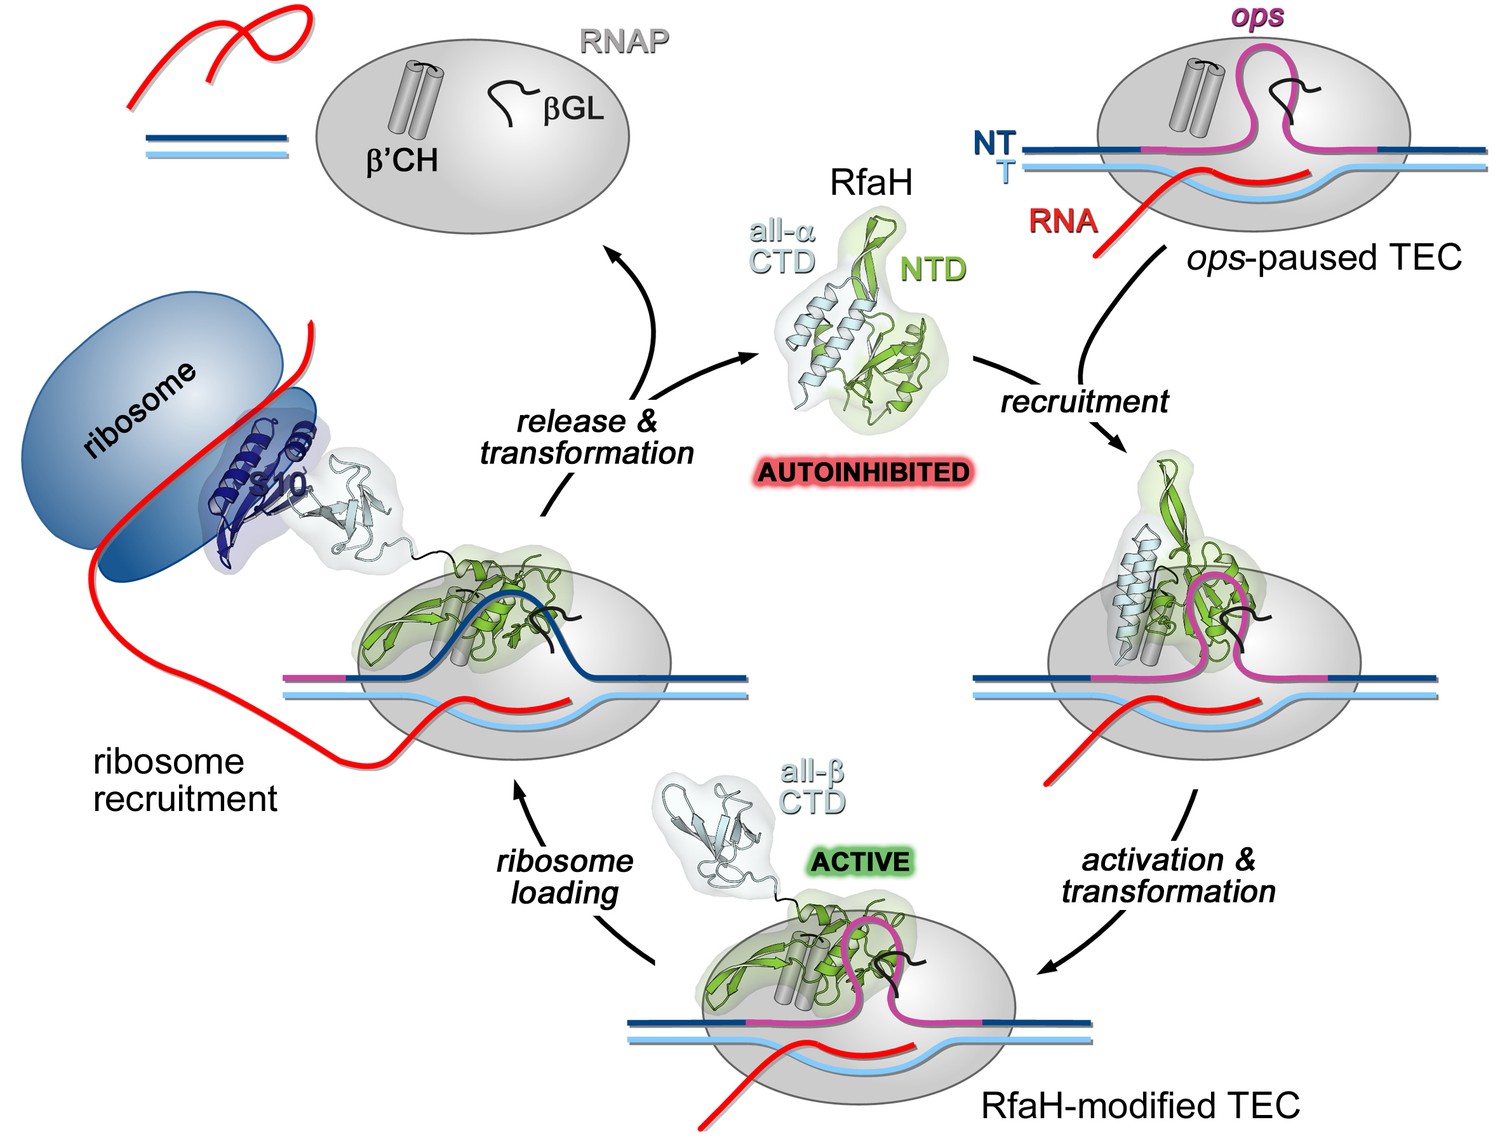
Life cycle of RfaH.
Available experimental data demonstrate RfaH recruitment to the ops-paused RNAP in vitro (Artsimovitch and Landick, 2002) and in vivo (Belogurov et al., 2009) via a hairpin in the NT DNA (this work). Belogurov et al. (2007) showed that destabilization of the interdomain interface was required for RfaH switch from the autoinhibited into the active state, and proposed that the RfaH-CTD refolds into a β-barrel upon release. The RfaH-CTD refolding and interactions with S10 were demonstrated by NMR spectroscopy, and functional evidence in support of their role in ribosome recruitment in vivo was reported (Burmann et al., 2012). A hypothesis that the autoinhibited state is regained after RfaH is released from TEC at a terminator has been proposed (Tomar et al., 2013) and awaits testing. The details of RfaH:RNAP contacts that mediate initial recruitment at ops, the molecular mechanism of ribosome recruitment, and hypothetical coupling of transcription and translation by RfaH (Burmann et al., 2012) remain to be investigated.β'CH, β' clamp helices; βGL, β gate loop.
Figure 2 with 1 supplement
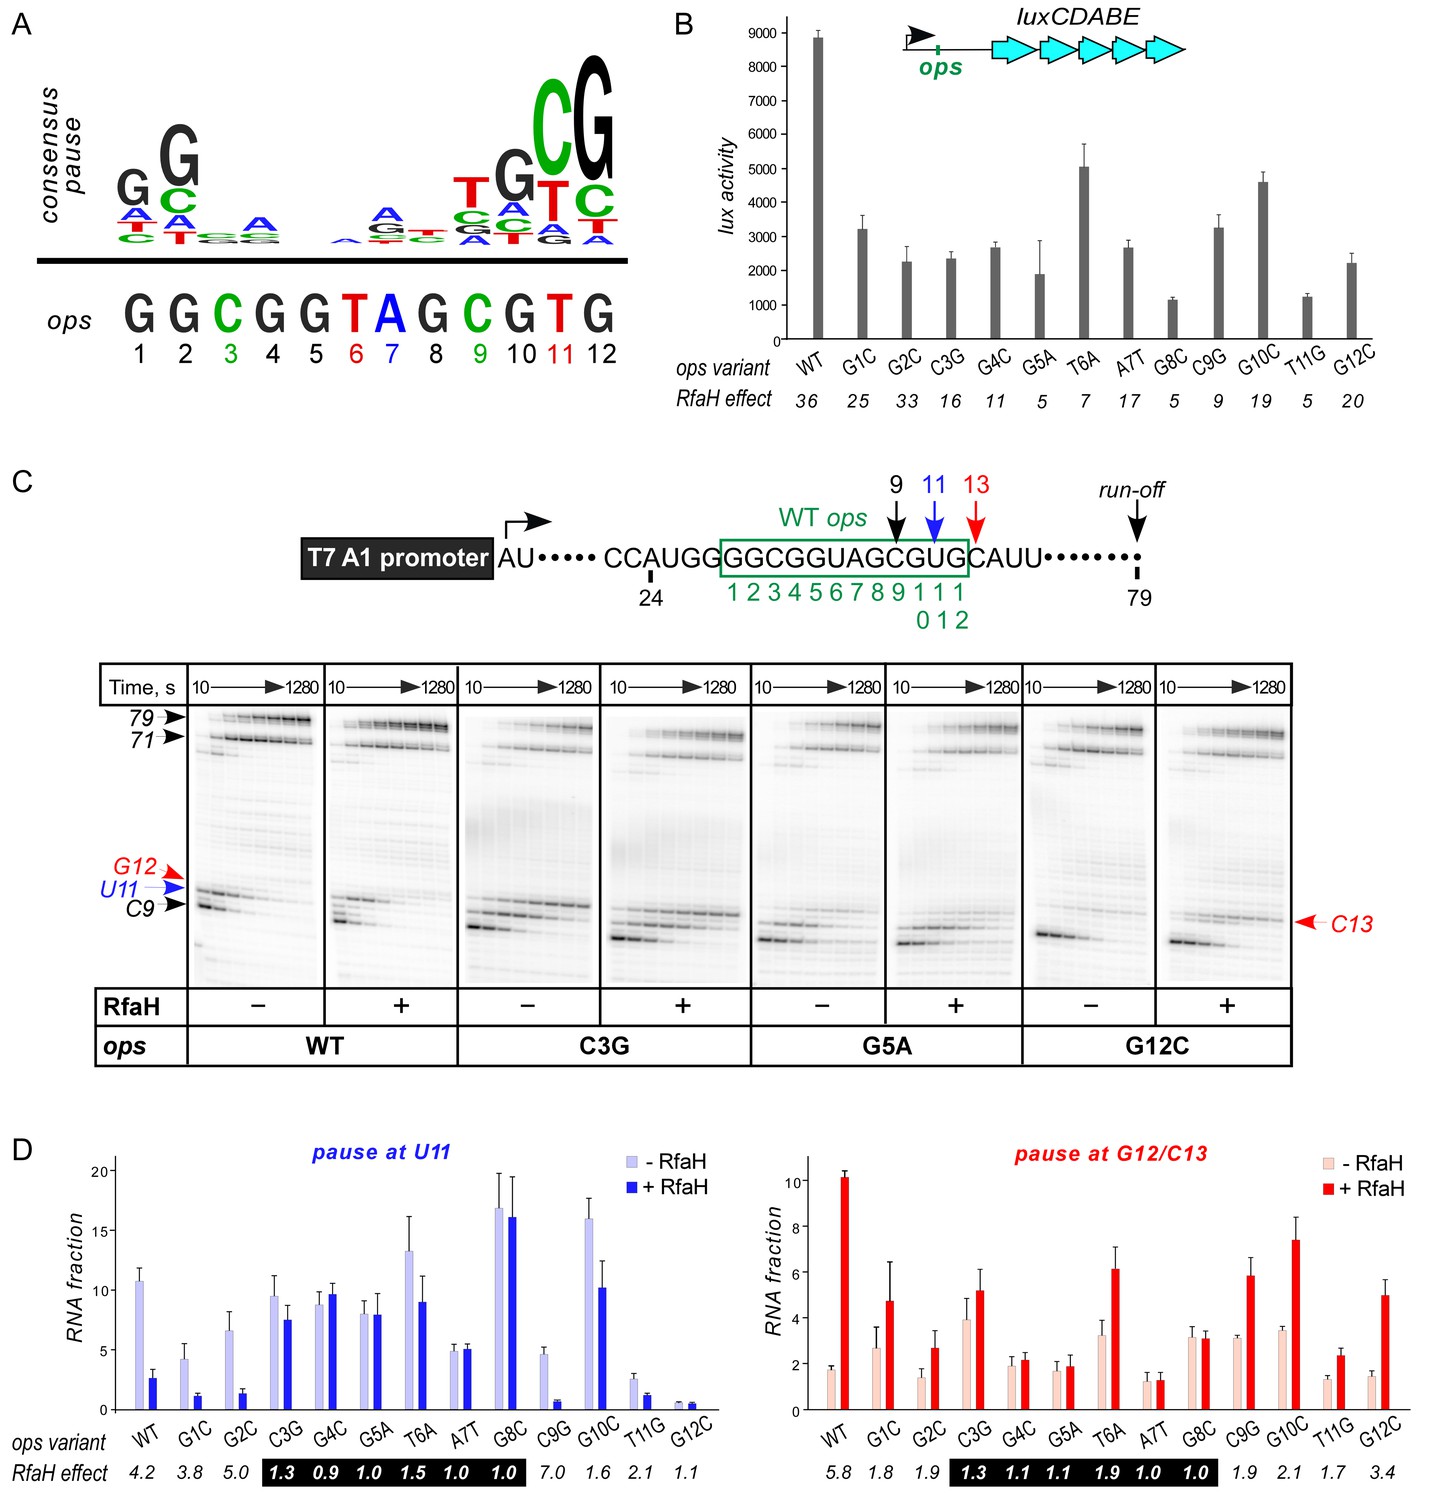
Contribution of individual ops bases to RNAP pausing and RfaH recruitment.
(A) Consensus pause and E. coli ops sequences. (B) Expression of luxCDABE reporter fused to ops mutants in the absence and presence of RfaH determined in three independent experiments, each with three biological replicates (see source file), is presented as average ± standard deviation. Only the data obtained in the presence of RfaH are plotted; the levels of expression in the absence of RfaH are very low. RfaH effect, the ratio of lux activities observed with and without RfaH, is shown below each mutant. (C) In vitro analysis of ops mutants. Transcript generated from the T7A1 promoter on a linear DNA template is shown on top; the transcription start site (bent arrow), ops element (green box), and transcript end are indicated. Halted A24 TECs were formed as described in Materials and Methods on templates with single substitutions in the ops element. Elongation was restarted upon addition of NTPs and rifapentin in the absence or presence of 50 nM RfaH. Aliquots were withdrawn at 10, 20, 40, 80, 160, 320, 640, and 1280 s and analyzed on 8% denaturing gels. Positions of the paused and run-off transcripts are indicated with arrows. Pause sites within the ops region are numbered relative to the ops consensus sequence and color-coded. Results with WT, C3G, G5A, and G12C ops variants are shown, for all other variants see Figure 2—figure supplement 1. (D) Analysis of RfaH effects in vitro (from (C)). The assays were performed in triplicates. RfaH effects at U11 reflect the antipausing modification of RNAP by RfaH. RfaH effects at G12/C13 reflect RfaH binding to the NT DNA strand, which hinders RNAP escape from ops. Fractions of U11 RNA (left) and G12 +C13 RNAs (right) at 20 s in the absence or the presence of RfaH, presented as average ± standard deviation from three independent experiments. RfaH effects (determined as a ratio of RNA fractions with vs. without RfaH) are shown below the variant. The core ops region is indicated by a black box.
-
Figure 2—source data 1
In vivo analysis of ops mutants by a lux reporter assay.
- https://doi.org/10.7554/eLife.36349.005
-
Figure 2—source data 2
In vitro analysis of the effect of ops mutants on RNAP pausing and RfaH recruitment.
- https://doi.org/10.7554/eLife.36349.006
Figure 2—figure supplement 1
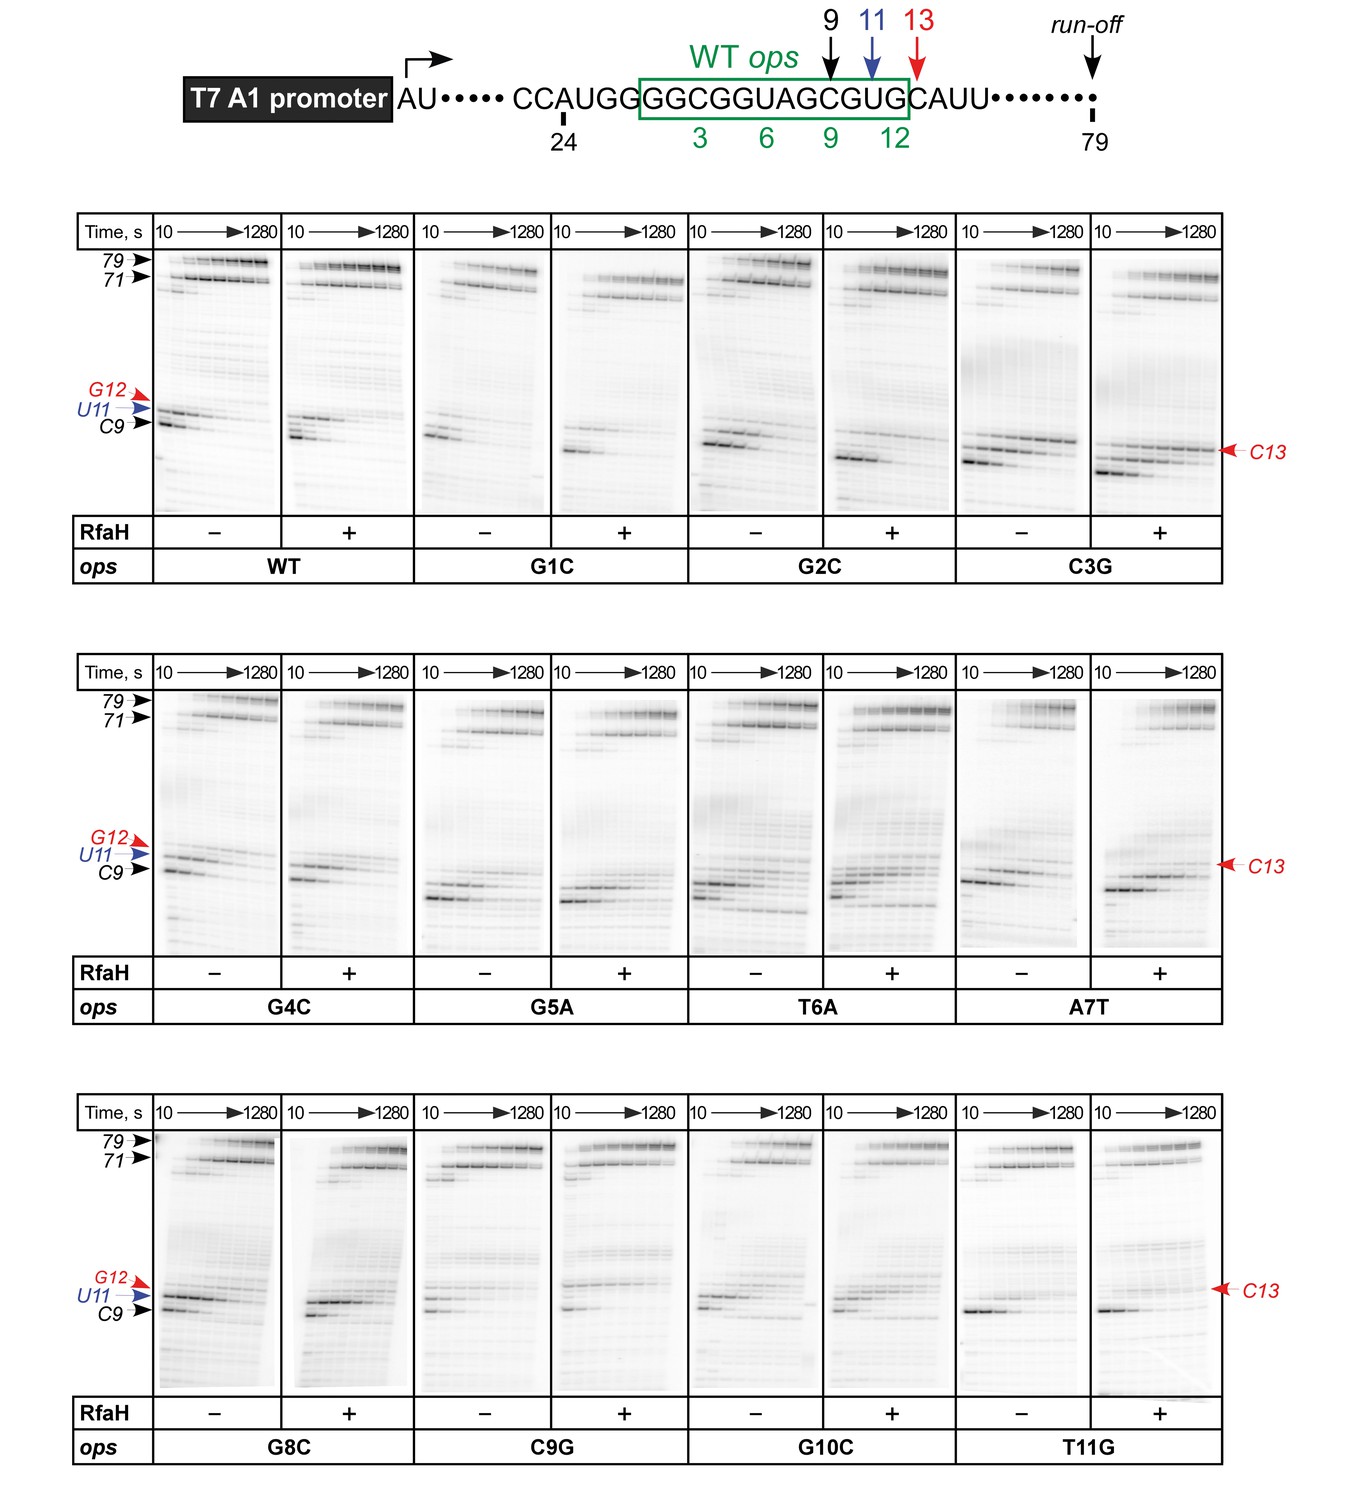
In vitro analysis of ops mutants.
Transcript generated from the T7A1 promoter on a linear DNA template is shown on top; the transcription start site (bent arrow), ops element (green box), and transcript end are indicated. Halted A24 TECs were formed as described in Methods on templates with single substitutions in the ops element. Elongation was restarted upon addition of NTPs and rifapentin in the absence or presence of 50 nM RfaH. Aliquots were withdrawn at 10, 20, 40, 80, 160, 320, 640, and 1280 s and analyzed on 8% denaturing gels. Positions of the paused and run-off transcripts are indicated with arrows. Pause sites within the ops region are numbered relative to the ops consensus sequence and color-coded.
Figure 3
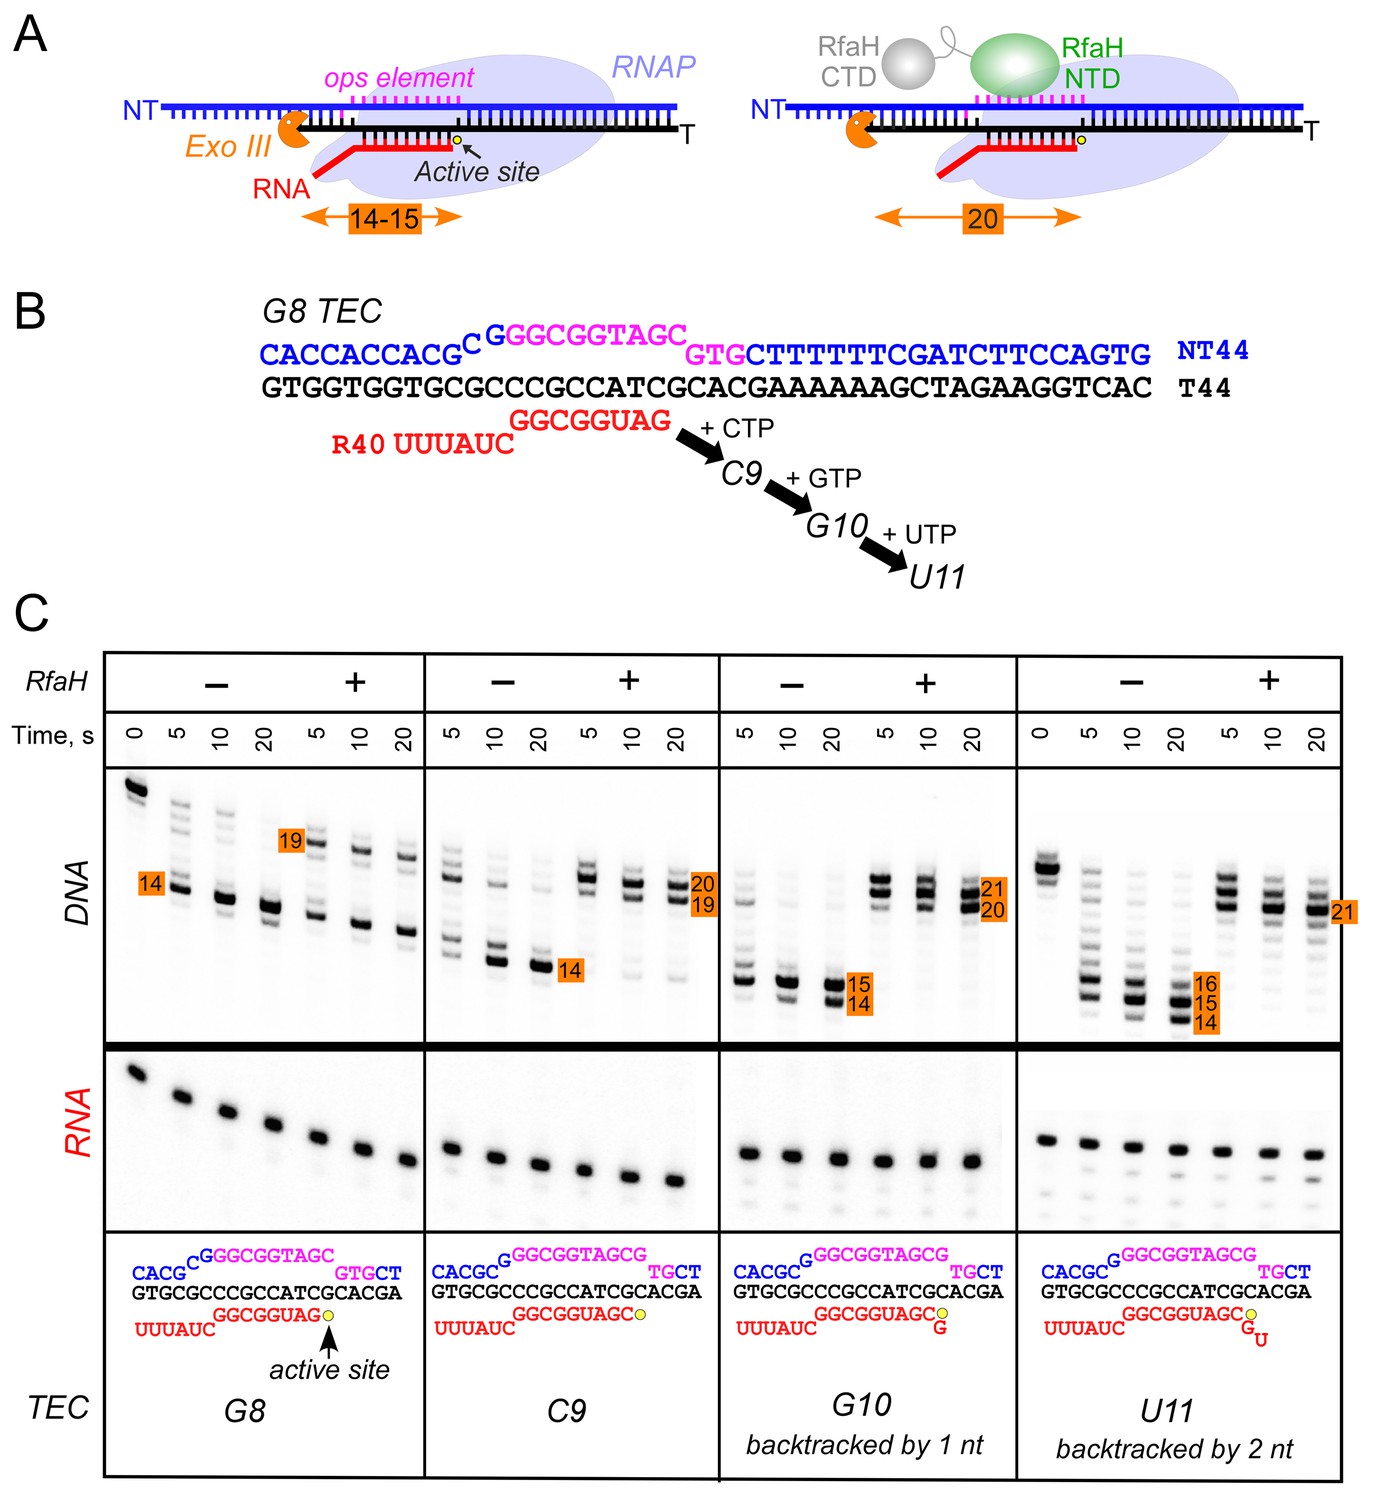
RfaH recruitment to RNAP transcribing through the ops element.
(A) Schematic of Exo III footprinting of free and RfaH-bound TECs. Numbers indicate the upstream footprint boundaries relative to the RNA 3’ end. (B) The G8 TEC was assembled on the scaffold, with RNA and template (T) DNA strands labeled with [γ32P]-ATP and T4 polynucleotide kinase (PNK), and walked in one-nucleotide steps to C9, G10, and U11 positions in the presence of the matching NTP substrates. (C) RfaH was added to 50 nM, where indicated. Following the addition of Exo III, the reactions were quenched at indicated times (0 represents an untreated DNA control) and analyzed on a 12% urea-acrylamide (19:1) gel in 0.5X TBE. Numbers indicate the distance from the RNA 3’ end. Hypothetical TEC structures are shown below. G8 and C9 complexes are predominantly post-translocated, as indicated by 14 bp protection of the upstream DNA. In G10 TEC, the pre-translocated state (15 bp protection) is observed, and in U11 an additional backtracked state (16 bp protection). Exo III may counteract backtracking; the sensitivity of the nascent RNA in G10 and U11 TECs to GreB-assisted cleavage (Nedialkov et al., 2018) was used to infer the translocation states shown in the schematics.
Figure 4 with 2 supplements
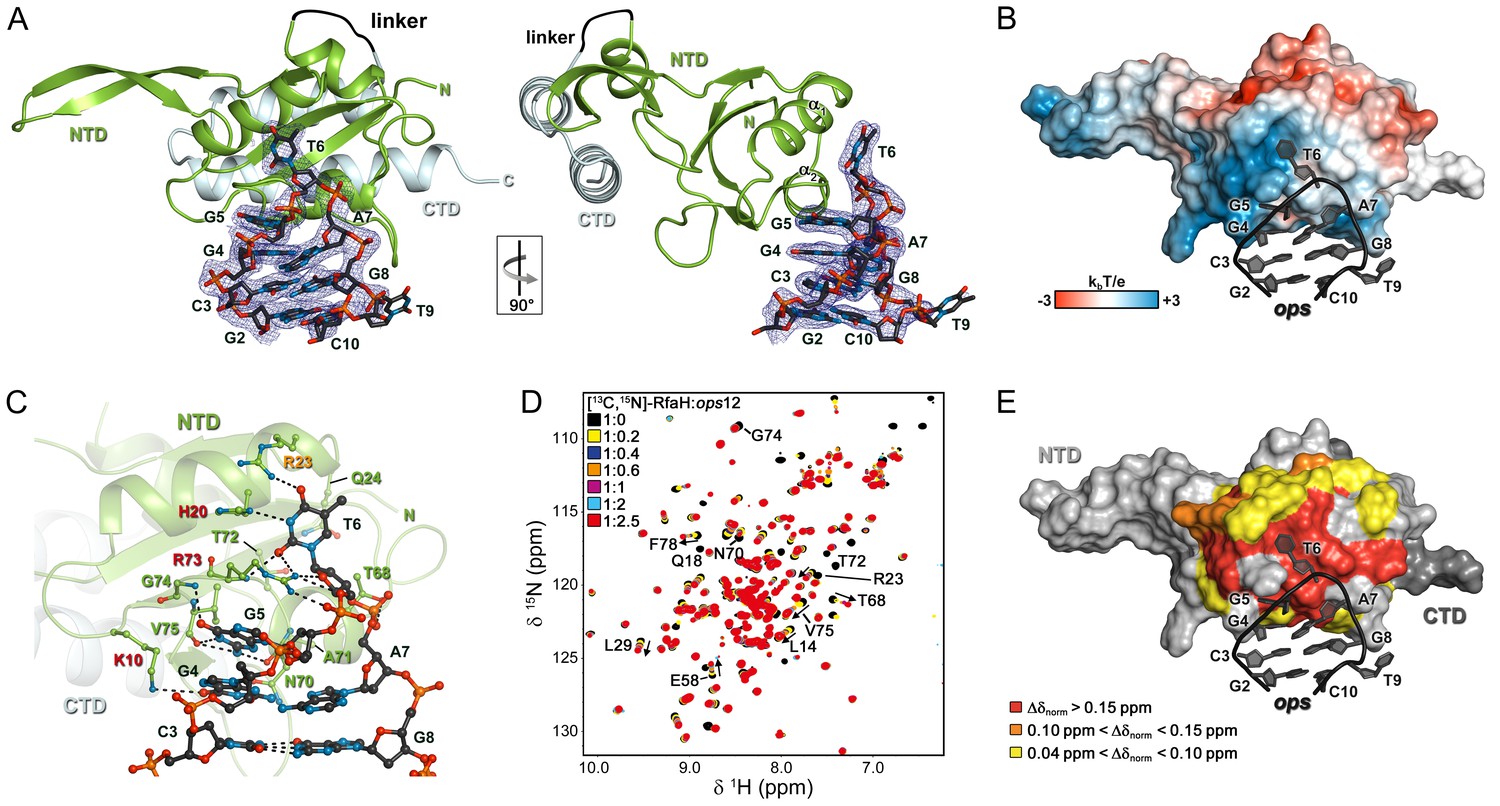
Specific recognition of ops by RfaH.
(A) Crystal structure of the RfaH:ops9 complex with the 2Fo – Fc electron density map contoured at 1 σ. (B) Structure of RfaH:ops9 complex with RfaH shown in surface representation, colored according to its electrostatic potential and ops9 as sticks. (C) Details of RfaH:ops9 interactions. Hydrogen bonds are shown as black dashed lines. RfaH residues that interact with ops are labeled in green. Alanine substitutions of RfaH residues that make base-specific contacts to G5 and T6 via their side chains and that compromise RfaH recruitment (Belogurov et al., 2010) are highlighted in red (strongly defective) and orange (moderately defective). (D) RfaH:ops interactions in solution. [1H, 15N]-HSQC spectra of 110 μM [13C, 15N]-RfaH titrated with 803 μM ops12 DNA. Arrows indicate changes of chemical shifts. Selected signals are labeled. (E) Mapping of normalized chemical shift perturbations observed in (D) on the RfaH:ops9 structure.
-
Figure 4—source data 1
Analysis of the chemical shift perturbations during the HSQC-titration of 15N-RfaH with ops12.
- https://doi.org/10.7554/eLife.36349.011
Figure 4—figure supplement 1
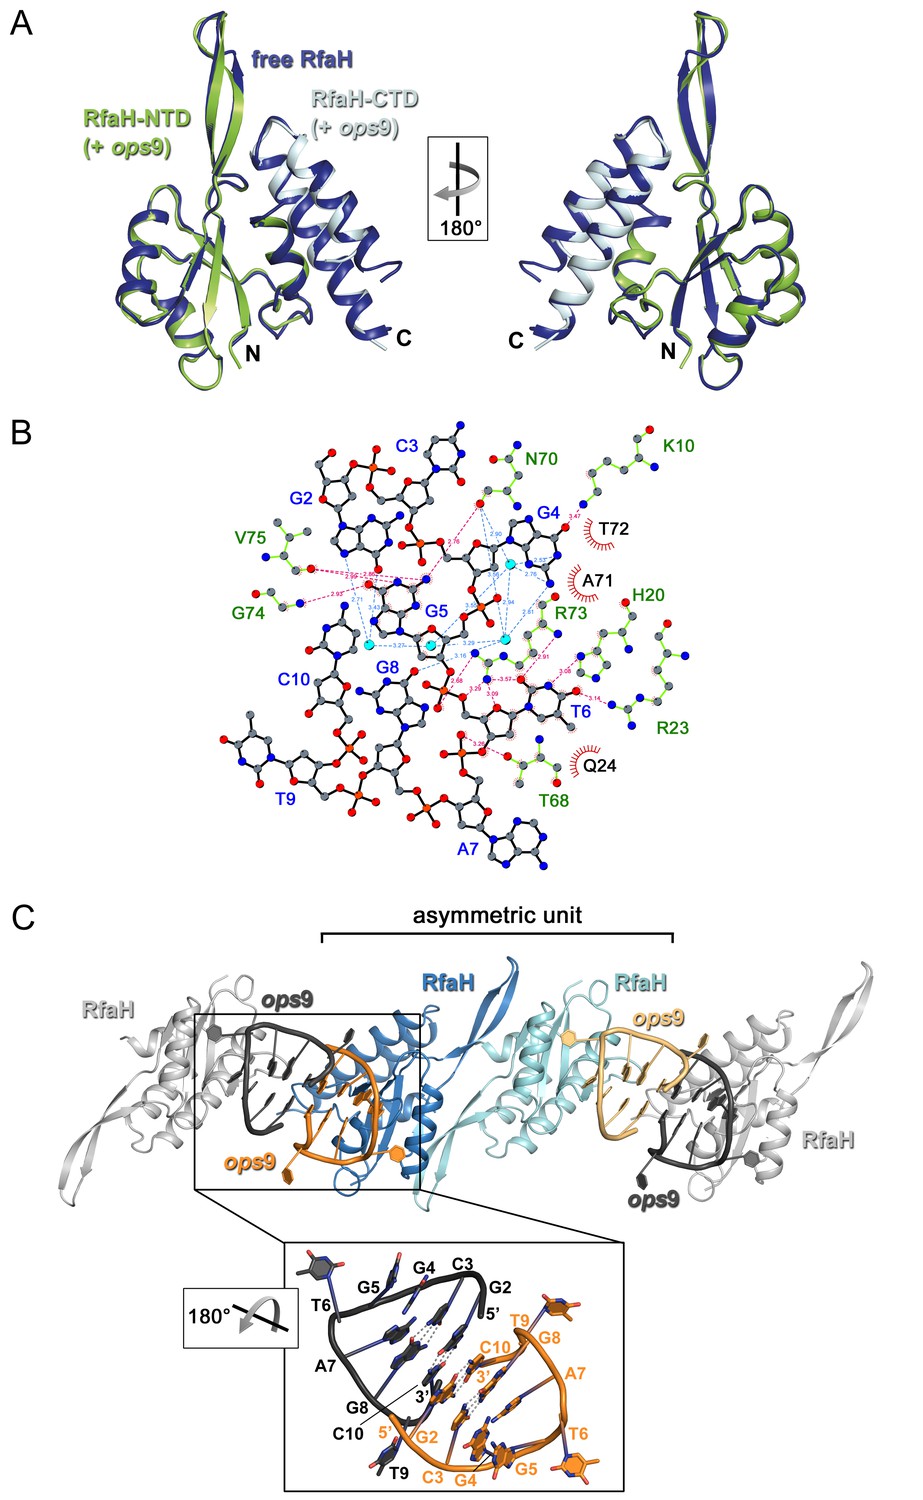
Analysis of RfaH:ops interactions.
(A) Superposition of free RfaH (PDB ID 2OUG, blue) and RfaH in the RfaH:ops9 complex (RfaH-NTD, green; RfaH-CTD, cyan), both in ribbon representation. The superposition is based on Cα atoms, yielding a root mean square deviation value of 0.72 Å. (B) Two-dimensional view of ops9:RfaH interactions. Water molecules are shown as cyan spheres. Bases are labeled in blue, amino acids in green. Hydrogen bonds between amino acids and DNA are shown as pink dashed lines, water-mediated hydrogen bonds as blue dashed lines. Van-der-Waals interactions are indicated in red. (C) Crystal packing of RfaH:ops9 crystals (space group P1). The content of one asymmetric unit is shown in color, molecules from neighboring asymmetric units are in grey (all molecules in ribbon representation). The panel shows an enlargement of the arrangement of DNA molecules from neighboring asymmetric units. Bases are shown as sticks (oxygen, red; nitrogen, blue; carbon, according to backbone color) and are labeled. Hydrogen bonds are indicated by dashed lines.
Figure 4—figure supplement 2
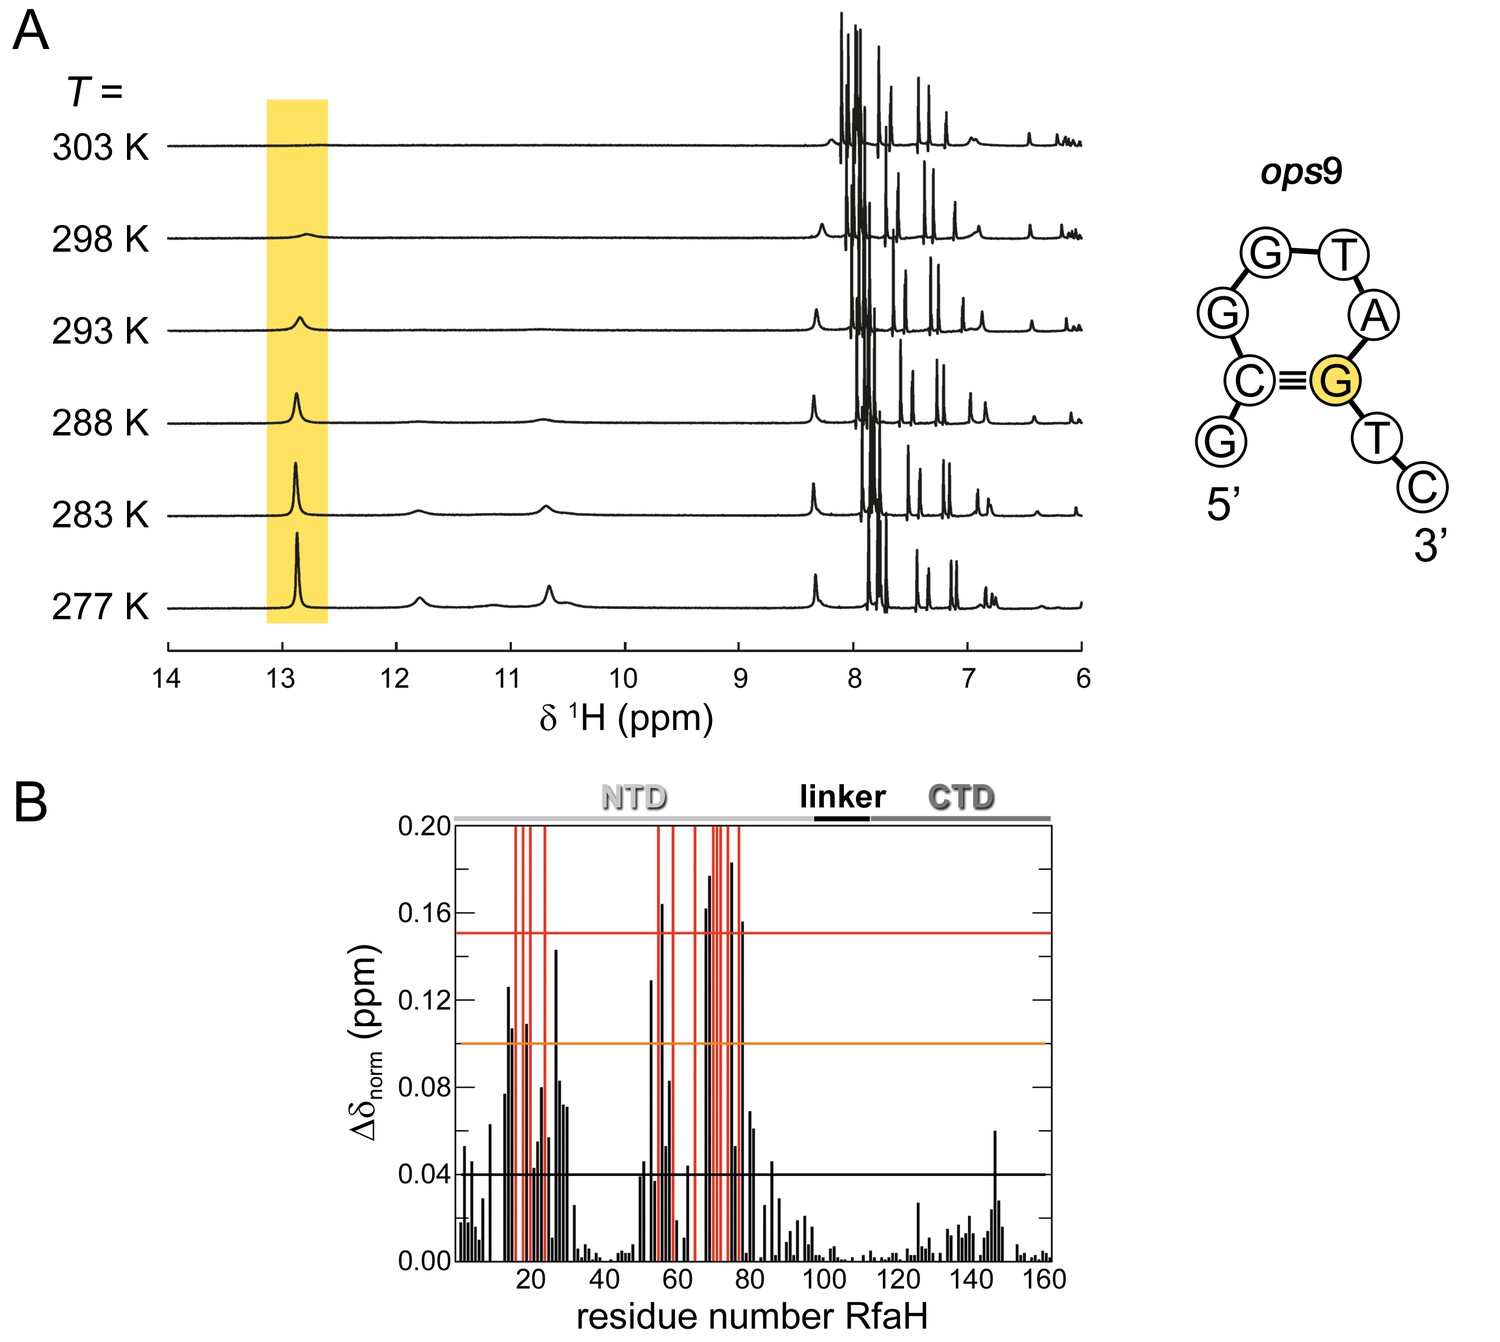
Secondary structure of isolated ops9 and RfaH:ops9 interaction in solution.
(A) Downfield region of the 1D [1H] NMR spectra of ops9 DNA measured at the temperatures indicated. The region characteristic for imino protons involved in Watson-Crick base pairs is highlighted in yellow. The inferred secondary structure of ops9 DNA is shown to the right. (B) RfaH:ops12 interaction in solution. [1H, 15N]-HSQC-derived normalized chemical shift perturbations vs. residue position in RfaH. The chemical shift perturbation were obtained from a titration of 15N-RfaH with ops12 (for spectra see Figure 3D). Horizontal lines: significance levels of Δδnorm = 0.04 ppm, black;=0.1 ppm, orange,=0.15 ppm, red. Disappearing signals are highlighted in red. The domain arrangement of RfaH is indicated above.
Figure 5
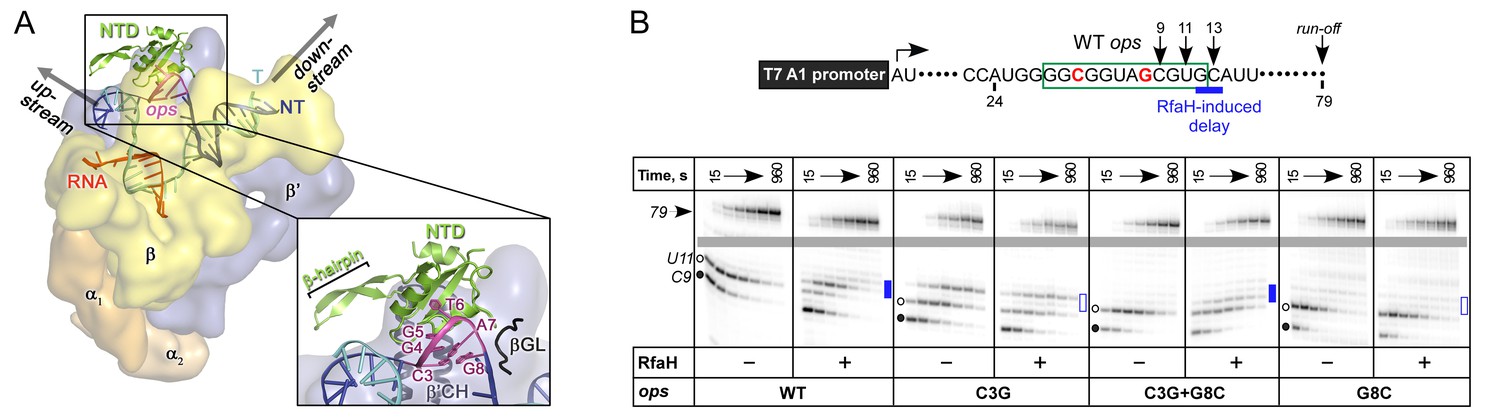
The role of NT DNA hairpin.
(A) Model of RfaH-NTD bound to the ops-paused TEC. Surface-accessible NT DNA bases are shown as sticks. (B) The double C3G + G8C substitution partially restores RfaH-dependent recruitment. The assay was done as in Figure 2. The position of an RfaH-induced delay in RNAP escape is shown with a blue bar, solid if delay is enhanced.
Figure 6
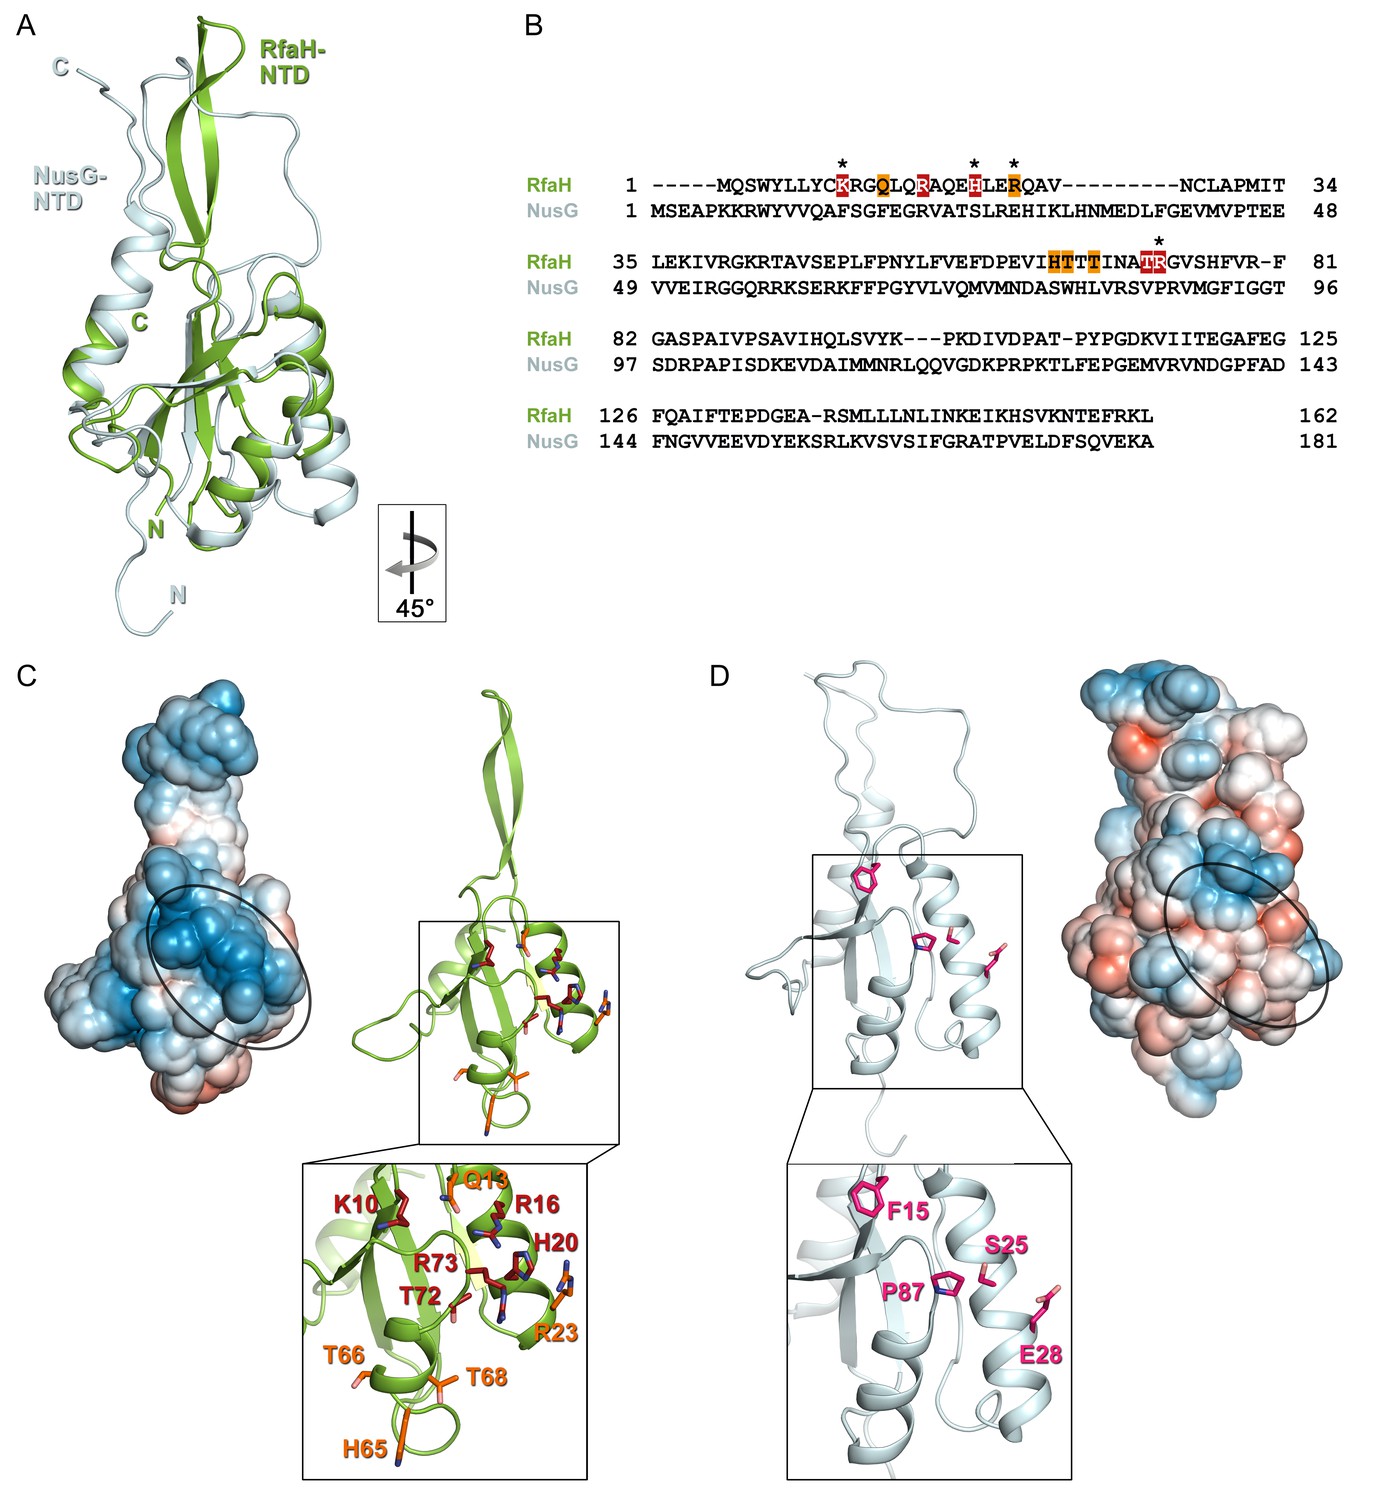
Specificity of RfaH for ops.
Superposition based on backbone atoms of NusG-NTD (PDB ID 2K06, light blue) and RfaH-NTD (taken from the RfaH:ops9 structure, green; root mean square deviation: 4.3 Å). Both proteins in ribbon representation. (B) Structure-based sequence alignment of NusG and RfaH. RfaH residues whose substitutions for Ala compromise RfaH recruitment (Belogurov et al., 2010) are highlighted in red (strongly defective) and orange (moderately defective). RfaH residues that make base-specific interactions with ops via their side chains are marked by an asterisk. (C) Structure of RfaH-NTD in (left) surface representation colored according to its electrostatic potential (from −3kBT/e, red, to +3 kBT/e, blue) and (right) ribbon representation with residues highlighted in (B) shown as sticks (C atoms, red or orange; N atoms, blue; O atoms, light red). (D) Structure of NusG-NTD (PDB ID 2K06) in (left) surface representation colored according to its electrostatic potential and (right) ribbon representation. Residues corresponding to the amino acids of RfaH highlighted in (B) are shown as sticks (C atoms, pink; N atoms, blue; O atoms, light red).
Tables
Table 1
Data collection and refinement statistics
https://doi.org/10.7554/eLife.36349.012| Data collection | |
|---|---|
| Wavelength (Å) | 0.9184 |
| Space group | P1 |
| Unit cell parameters | |
| a, b, c (Å) | 36.309/43.187/61.859 |
| α, β, γ (°) | 80.449/75.485/75.392 |
| Resolution (Å)a | 41.55–2.1 (2.2–2.1) |
| Unique/observed reflectionsa,b | 19,931/107,345 (2,633/14,210) |
| Rsym (%) a,c | 6.3 (42.9) |
| I/σIa | 13.96 (3.47) |
| Completeness (%)a | 97.3 (97.9) |
| Molecules per asymmetric unit | 2 |
| Refinement statistics | |
| Rwork (%)d | 18.62 |
| Rfree (%)e | 23.34 |
| Number of atoms | |
| Protein | 4283 |
| Nucleic acid | 574 |
| Water | 116 |
| B-factors | |
| Protein | 56.062 |
| Nucleic acid | 87.427 |
| water | 48.058 |
| r.m.s. deviations | |
| Bond lengths (Å) | 0.013 |
| Bond angles (°) | 1.149 |
-
aHighest-Resolution shell values are given in parentheses.
bFriedel mates were not treated as independent reflections.
-
cRsym = Σh ΣI | Ii(h) - <I(h)> | / ΣhΣiI(h); where I are the independent observations of reflection h.
dRwork = Σh ||Fobs| - |Fcalc|| / Σh |Fobs|.
-
eThe free R-factor was calculated from 5 % of the data, which were removed at random before the structure was refined.
Key resources table
| Reagent type (species) or resource | Designation | Source or reference | Identifiers | Additional information |
|---|---|---|---|---|
| Strain, strain background (E. coli) | BL21 (λ DE3) | Novagen | N/A | |
| Strain, strain background (E. coli) | DH5α ΔrfaH (λ DE3) | Belogurov et al. (2010) | IA lab stock #149 | |
| Recombinant DNA reagent | list of recombinant plasmids used | Table 2 | ||
| Sequence-based reagent | ops9 GCGGTAGTC | IDT | N/A | |
| Sequence-based reagent | ops12 GGCGGTAGCGTG | Biomers.net | N/A | |
| Sequence-based reagent | T7A1 promoter AAAAAGAGTATTGACTTAAAGTCTAACCTATAGGATACTTACAGCCATCGAGCAGGCAGCGGCAAAGCCATGG | Sigma Aldrich | IA lab stock #2536 | |
| Sequence-based reagent | DN PCR primer AAATAAGCGGCTCTCAGTTT | Sigma Aldrich | IA lab stock #2536 | |
| Sequence-based reagent | UP PCR primer AAAAAGAGTATTGACTTAAAG | Sigma Aldrich | IA lab stock #2499 | |
| Sequence-based reagent | R40 RNA oligo UUUAUCGGCGGUAG | IDT DNA Technologies | N/A | |
| Sequence-based reagent | NT44 DNA oligo CACCACCACGCGGGCGGTAGCGTGCTTTTTTCGATCTTCCAGTG | IDT DNA Technologies | N/A | |
| Sequence-based reagent | T44 DNA oligo CACTGGAAGATCGAAAAAAGCACGCTACCGCCCGCGTGGTGGTG | IDT DNA Technologies | N/A | |
| Peptide, recombinant protein | E. coli RfaH (transcription assays, NMR) | Belogurov et al. (2007) | N/A | |
| Peptide, recombinant protein | E. coli RfaH (crystallization) | Vassylyeva et al. (2006) | N/A | |
| Peptide, recombinant protein | E. coli RNA polymerase | Svetlov and Artsimovitch, 2015 | N/A | |
| Peptide, recombinant protein | Exo III nuclease | New England Biolabs | Cat#: MO206 | |
| Peptide, recombinant protein | T4 polynucleotide kinase | New England Biolabs | Cat#: MO0201 | |
| Commercial assay or kit | QIAquick PCR purification kit | Qiagen | Cat#: 28104 | |
| Commercial assay or kit | QIAquick Nucleotide Removal Kit | Qiagen | Cat#: 28306 | |
| Chemical compound, drug | (15NH)4SO4 | Campro Scientific | Cat#: CS01-185_148 | |
| Chemical compound, drug | D2O | Eurisotop | Cat#: D216L | |
| Chemical compound, drug | ApU | Sigma-Aldrich | Cat #: A6800 | |
| Chemical compound, drug | [α−32P]-CTP | Perkin Elmer | Cat#: BLU008H | |
| Chemical compound, drug | Rifapentin | Artsimovitch et al., 2005 | N/A | |
| Chemical compound, drug | PEG monomethyl ether 500 | Sigma-Aldrich | Cat#: 202487 | |
| Chemical compound, drug | 4-(2-hydroxyethyl)piperazineethanesulfonic acid (HEPES) for crystallization | Sigma-Aldrich | Cat#: H4034 | |
| Chemical compound, drug | MgCl2 for crystallization | Merck | Cat#: 105833 | |
| Chemical compound, drug | Glutaraldehyde for crystallization | Fluka | Cat#: 49629 | |
| Chemical compound, drug | Tris(hydroxymethyl)aminomethane (Tris) for crystallization | Roth | Cat#: 4855.3 | |
| Chemical compound, drug | KCl for crystallization | VWR | Cat#: 26764.298 | |
| Chemical compound, drug | Dithiothreitol (DTT) for crystallization | Roth | Cat#: 6908.1 | |
| Chemical compound, drug | Perfluoropolyether cryo oil | Hampton Research | Cat#: HR2-814 | |
| Software, algorithm | PyMol v. 1.7 | The PyMOL Molecular Graphics System, Schrödinger, LLC. | https://pymol.org/2/ | |
| Software, algorithm | COOT | Emsley et al. (2010) | https://www2.mrc-lmb.cam.ac.uk/personal/pemsley/coot/ | |
| Software, algorithm | XDS | Kabsch, 2010b | http://xds.mpimf-heidelberg.mpg.de/ | |
| Software, algorithm | XDSAPP | Sparta et al., 2016 | https://www.helmholtz-berlin.de/forschung/oe/np/gmx/xdsapp/index_en.html | |
| Software, algorithm | PHASER | McCoy et al. (2007) | ||
| Software, algorithm | PHENIX suite | Adams et al. (2010) | https://www.phenix-online.org/ | |
| Software, algorithm | LigPlot | Wallace et al. (1995) | https://www.ebi.ac.uk/thornton-srv/software/LIGPLOT/ | |
| Software, algorithm | NMRViewJ | One Moon Scientific, Inc. | http://www.onemoonscientific.com/nmrviewj | |
| Software, algorithm | GraFit v. 6.0.12 | Erithacus Software Ltd. | http://www.erithacus.com/grafit/ | |
| Software, algorithm | MatLab v. 7.1.0.183 | The MathWorks, Inc. | https://de.mathworks.com/products/matlab.html | |
| Software, algorithm | ImageQuant | GE Healthcare Life Sciences | www.gelifesciences.com/ | |
| Software, algorithm | PISA Server | Krissinel and Henrick (2007) | http://www.ebi.ac.uk/pdbe/pisa/ | |
| Other | 24-well VDXm plates with sealant | Hampton Research | HR3-306 |
Table 2
Plasmids
https://doi.org/10.7554/eLife.36349.015| Name | Description | Source |
|---|---|---|
| ops variants | ||
| pIA1087 | PBAD‒opsWT‒luxCDABE | Burmann et al. (2012) |
| pZL6 | PBAD‒ops(G2C)‒luxCDABE | This work |
| pZL7 | PBAD‒ops(A7T)‒luxCDABE | This work |
| pZL12 | PBAD‒ops(T11G ‒luxCDABE | This work |
| pZL14 | PBAD‒ops(G5A)‒luxCDABE | This work |
| pZL21 | PBAD‒ops(G4C)‒luxCDABE | This work |
| pZL22 | PBAD‒ops(T6A)‒luxCDABE | This work |
| pZL23 | PBAD‒ops(G8C)‒luxCDABE | This work |
| pZL24 | PBAD‒ops(G12C)‒luxCDABE | This work |
| pZL25 | PBAD‒ops(G1C)‒luxCDABE | This work |
| pZL26 | PBAD‒ops(C3G)‒luxCDABE | This work |
| pZL27 | PBAD‒ops(C9G)‒luxCDABE | This work |
| pZL28 | PBAD‒ops(G10C)‒luxCDABE | This work |
| pIA1286 | PBAD‒ops(C3G + G8C)‒luxCDABE | This work |
| Gene expression vectors | ||
| pVS10 | PT7 promoter– E. coli rpoA–rpoB–rpoCHis6–rpoZ | Belogurov et al. (2007) |
| pVS12 | E. coli rfaH in pTYB1 | Vassylyeva et al. (2006) |
| pIA238 | E. coli rfaH in pET28a | Artsimovitch and Landick (2002) |
Additional files
-
Supplementary file 1
RfaH-opsTEC_model.pdb: PDB file of the RfaH:opsTEC model.
- https://doi.org/10.7554/eLife.36349.016
-
Transparent reporting form
- https://doi.org/10.7554/eLife.36349.017
Download links
A two-part list of links to download the article, or parts of the article, in various formats.
Downloads (link to download the article as PDF)
Open citations (links to open the citations from this article in various online reference manager services)
Cite this article (links to download the citations from this article in formats compatible with various reference manager tools)
The universally-conserved transcription factor RfaH is recruited to a hairpin structure of the non-template DNA strand
eLife 7:e36349.
https://doi.org/10.7554/eLife.36349


