MAP7 regulates axon morphogenesis by recruiting kinesin-1 to microtubules and modulating organelle transport
- Thomas Jefferson University, United States
- University of Michigan Medical School, United States
Figures
Figure 1 with 1 supplement
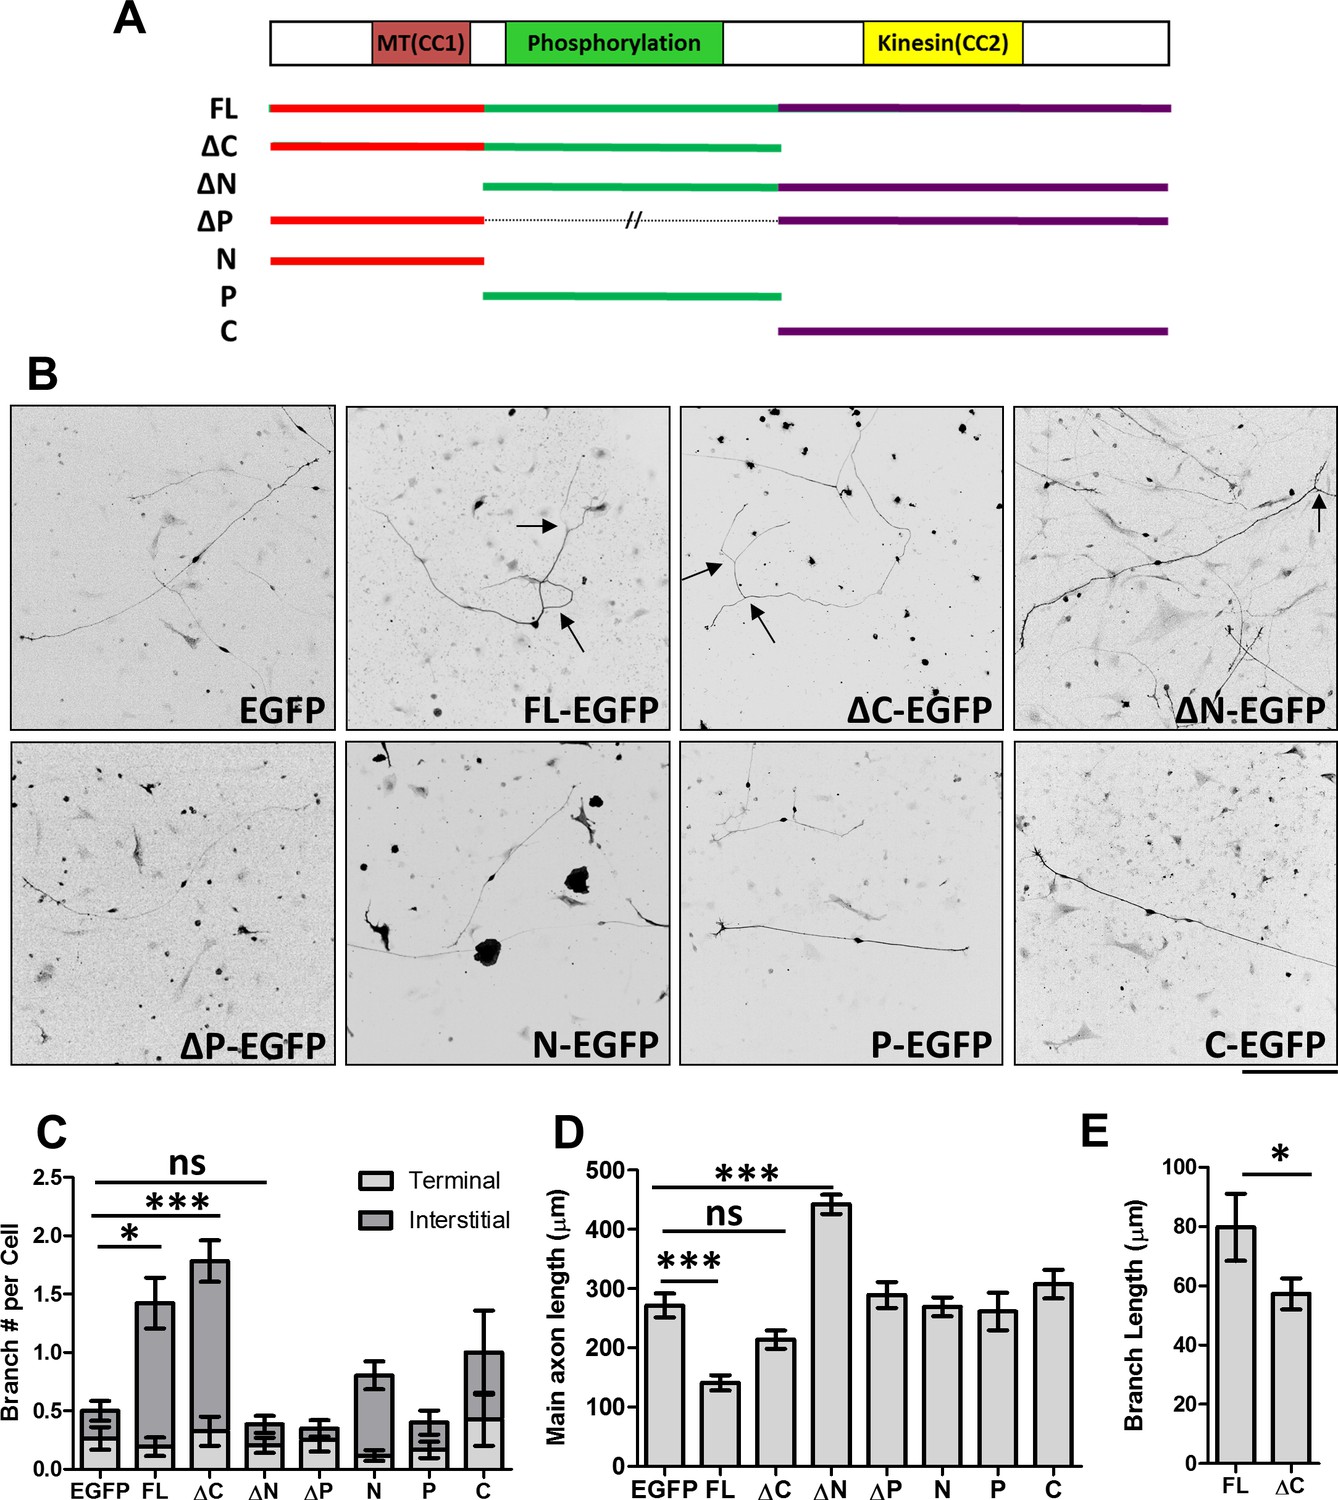
Distinct roles of MAP7 domains in DRG axon growth and branching.
(A) Primary structure of MAP7, indicating the phosphorylation (P) domain and the two coiled-coil (CC) regions that interact with microtubules (MT(CC1)) and kinesin-1 (Kinesin(CC2)). The full length (FL) MAP7 and various fragments used in the study are illustrated by line drawings. (B) Representative images of neurofilament staining in E14 rat DRG neurons expressing EGFP or EGFP-tagged fusion proteins of MAP7-FL or various MAP7 fragments. Arrows point to interstitial branches. (C) Quantification of the number of branches per cell as measured by counting the total number of tips per neuron in E14 DRG neurons expressing EGFP or EGFP fusion proteins. Branches were further divided into two groups: terminal branches arising from the distal 10% part of the axon and interstitial branches arising from the rest of the axons. n = 33, 26, 46, 39, 20, 51, 31, 14 for EGFP, FL, ΔC, ΔN, ΔP, N, P and C respectively. ANOVA-test (Mean ±SEM): EGFP-FL, p=0.013; EGFP-ΔC, p≤0.0001; EGFP-ΔN, p=0.98. (D) Quantification of the total length of main axons in neurons expressing different MAP7 constructs. n = 44, 21, 18, 22, 21, 77, 12, 15 for EGFP, FL, ΔC, ΔN, ΔP, N, P and C respectively. ANOVA-test (Mean ±SEM): EGFP-FL, p=0.0003; EGFP-ΔC, p=0.29; EGFP-ΔN, p≤0.0001. (E) Comparison of the branch length between MAP7-FL-EGFP and MAP7-ΔC-EGFP expressing DRG neurons. n = 36 for FL and 73 for ΔC. T-test (Mean ±SEM): p=0.04. *p<0.05; **p<0.01; ***p<0.001; ns: not significant. Scale bar: 200 µm.
-
Figure 1—source data 1
Data for the measurement of branch number, axon length, and branch length in Figure 1C–E.
- https://doi.org/10.7554/eLife.36374.004
Figure 1—figure supplement 1
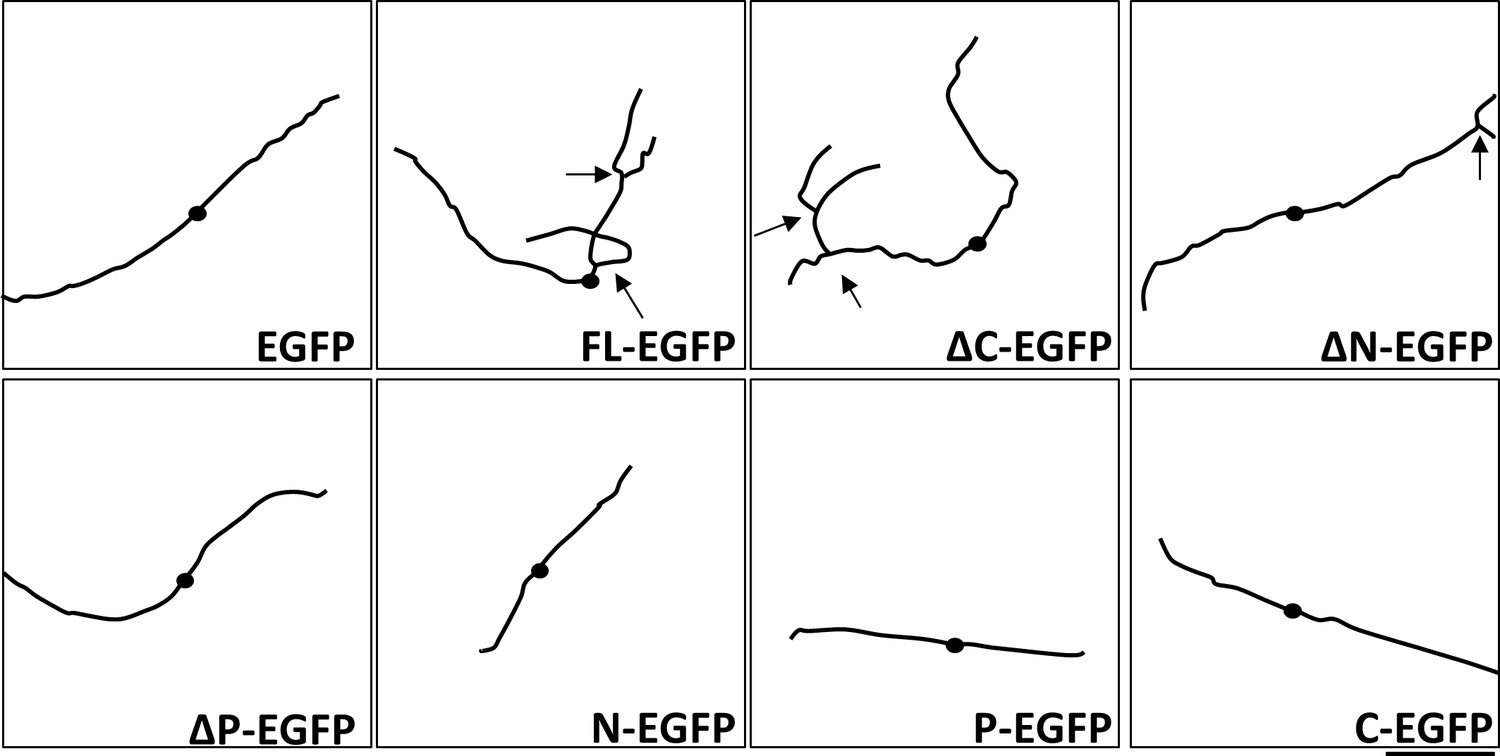
Traces of axonal morphology shown in Figure 1B. Scale bar: 200 µm.
https://doi.org/10.7554/eLife.36374.003
Figure 2

Localization of MAP7 in DRG axons.
(A) Fluorescence confocal images of E17 rat DRG axons immunostained for tubulin (red) and endogenous MAP7 (green) extending out from an explant (asterisks). The color-merged image is also shown. (B) Quantification of branches with either endogenous MAP7 by antibody staining or overexpressed FL-EGFP concentrated at branch sites. (C) Representative fluorescence images of E14 rat DRG neurons expressing EGFP or EGFP fusion proteins of MAP7-FL or various MAP7 fragments. Green: antibody staining for EGFP; red: antibody staining for neurofilament (NF). Arrows point to axonal terminals and asterisks indicate branch sites. (D) Line scans in axons (cell body, left, growth cone, right) of fluorescence signals from antibody staining for tubulin (red lines) and EGFP fusions (green lines) of FL or ΔN of MAP7. The asterisk indicates the location of a branch.
-
Figure 2—source data 1
Quantification of the percentage of branches containing MAP7 in Figure 2B.
- https://doi.org/10.7554/eLife.36374.006
Figure 3 with 2 supplements
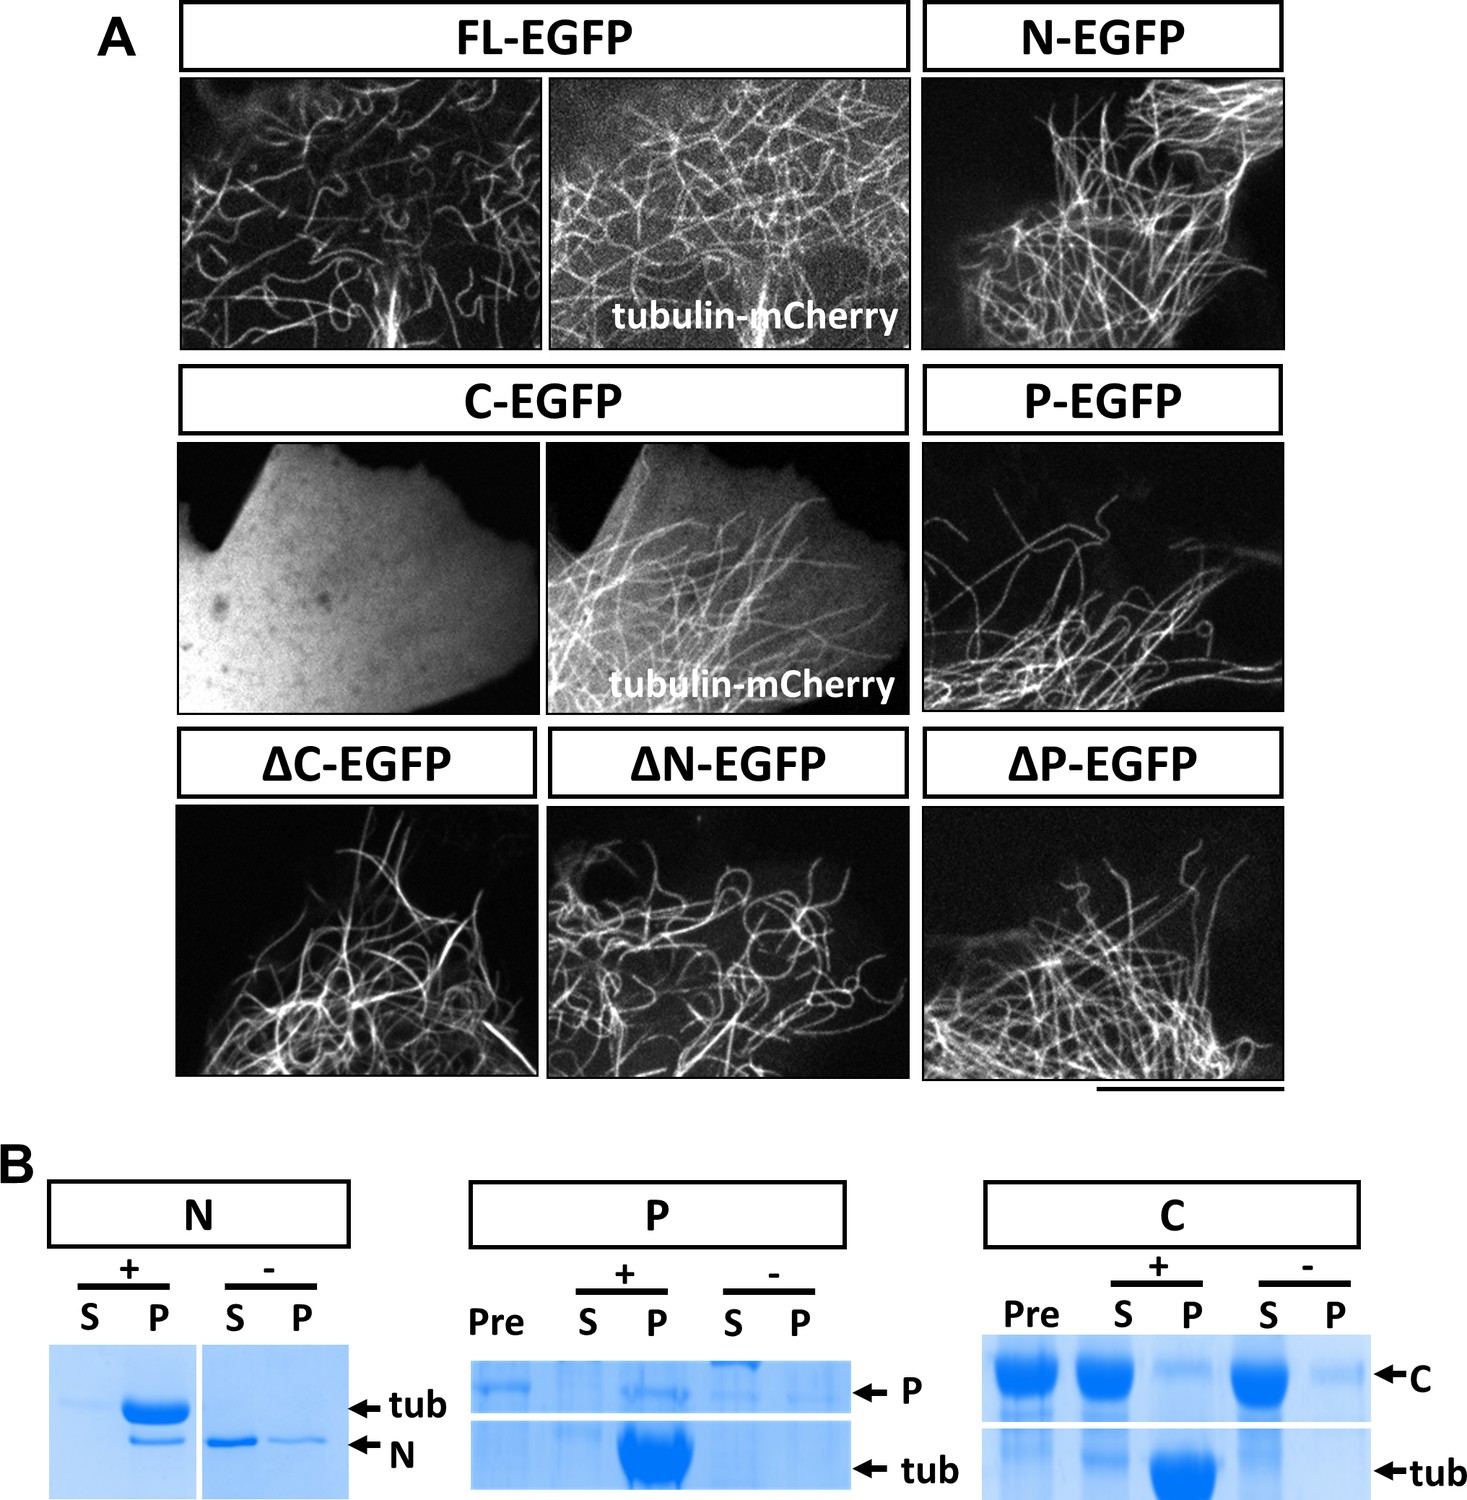
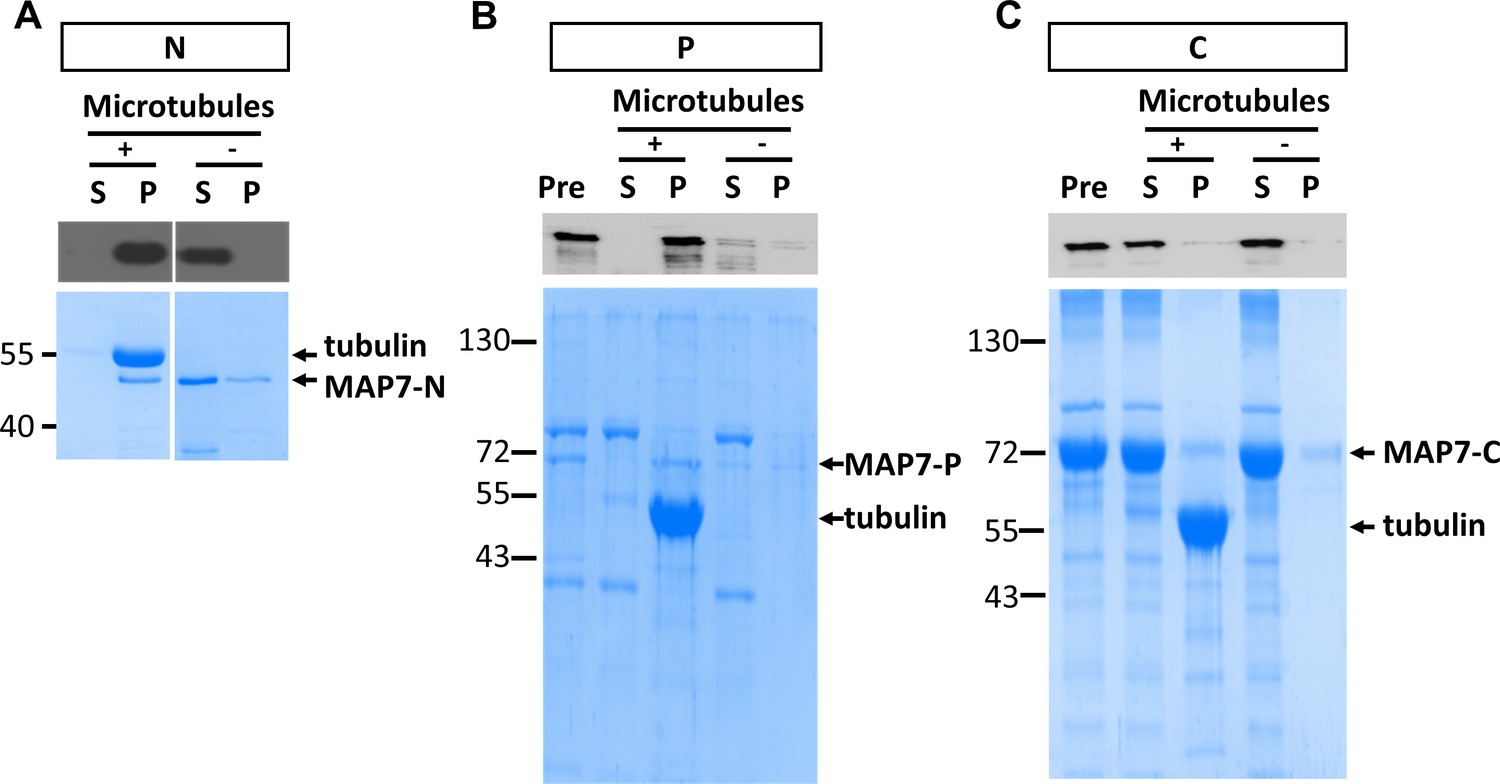
Characterization of MAP7 binding to microtubules.
(A) Confocal fluorescence images in live COS cells expressing EGFP fusion proteins of MAP7-FL or various fragments. Tubulin-mCherry were co-expressed to show microtubules (only for FL-EGFP and C-EGFP). (B) Co-sedimentation analysis of different MAP7 domains with (+) or without (-) taxol-stabilized microtubules. Representative Coomassie stained SDS-PAGE gels of the supernatants (S) and pellets (P) along with pre-binding samples (Pre) for purified GST-MAP7-N (N), MAP7-P-mCherry (P) or MAP7-C-mCherry (C). n = 3. Note the presence of tubulin bands only in the pellet of the samples incubated with microtubules.
Figure 3—figure supplement 1
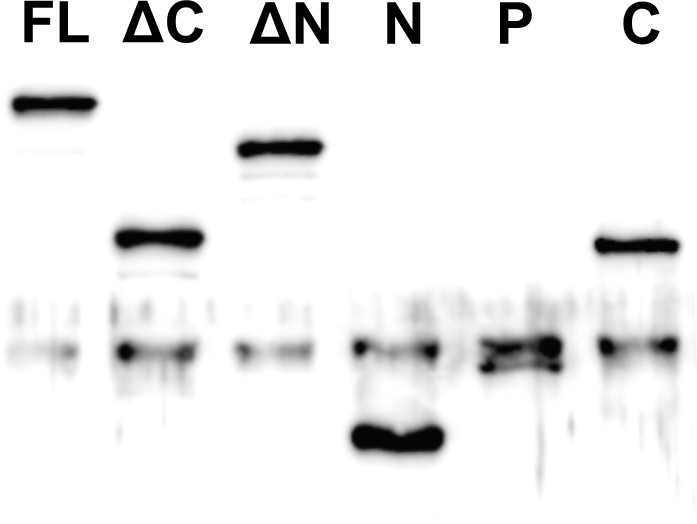
Western blot analysis of EGFP fusion proteins of MAP7-FL and various domain fragments expressed in COS cells.
https://doi.org/10.7554/eLife.36374.008
Figure 3—figure supplement 2
Microtubule binding by individual MAP7 domains in a co-sedimentation assay.
Western blot (top) and coomassie staining (bottom) from SDS-PAGE of purified GST-fusion of MAP7-N (N), mCherry fusion proteins of MAP7-P (P) or MAP7-C (C) after sedimentation with or without Taxol-stabilized microtubules. Western blots were probed for the FLAG tag in the GST fusion protein in (A) and the mCherry tag in (B-C). Supernatants (S) and pellets (P) along with pre-binding samples (Pre) were analyzed.
Figure 4 with 1 supplement
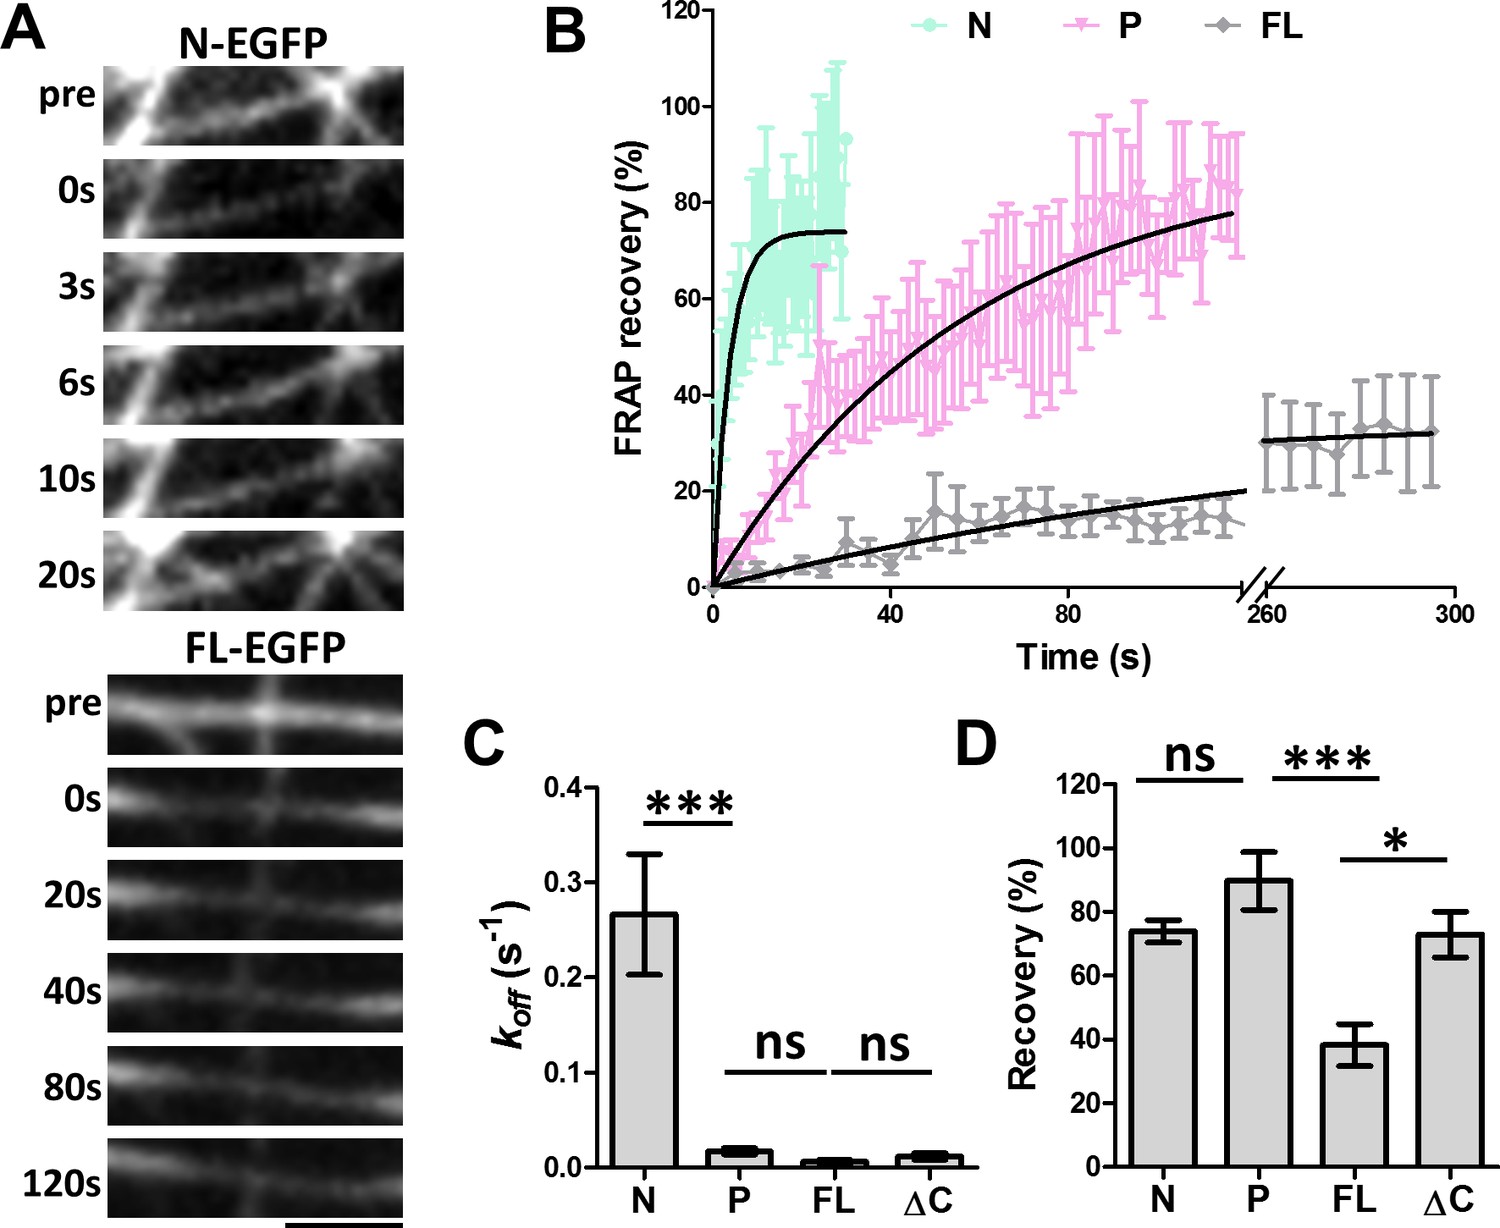
FRAP analysis of MAP7 binding to microtubules in COS cells.
(A) Representative sequential confocal images of N-EGFP or FL-EGFP on single microtubules in live COS cells before (pre) and after photobleaching at various time points. (B) Fluorescence recovery plots for N-, P-, and FL-EGFP fusion proteins along single microtubules in COS cells. Solid lines are derived from non-linear curve fitting based on the inverse of an exponential decay model. (C, D) Comparison of the dissociation rate constant (koff) (C) and the total recovery (D) derived from curve fitting of the MAP7 N-, P-, FL-, and ΔC-EGFP fluorescence recovery. n = 321 for N (11 cells), 396 for P (9 cells), 420 for FL (7 cells), and 150 for ΔC (5 cells). ANOVA-test (Mean ±SEM) for koff (C): N-P, p=0.001; P-FL, p=0.99; FL-ΔC, p=0.99, and for recovery (D): N-P, p=0.39; P-FL, p=0.001; FL-ΔC, p=0.018. *p<0.05; ***p<0.001; ns: not significant. Scale bar: 2 μm.
-
Figure 4—source data 1
Data for the fluoresence recovery curve (Figure 4B) and the kinetic parameters (Figure 4C,D).
- https://doi.org/10.7554/eLife.36374.013
Figure 4—figure supplement 1

FRAP analysis of MAP7 binding to microtubules in COS cells.
(A, B) FRAP recovery plots for FL-EGFP and ΔC-EGFP (A) or ∆P- and ΔN-EGFP (B) in COS cells. Solid lines are derived from non-linear curve fitting. (C, D) Comparison of the off-rate constant (kof) and the total recovery derived from curve fitting in C between ∆P- and ΔN-EGFP. n = 564 for ∆P (12 cells) and 449 for ΔN (10 cells). T-test (Mean ±SEM): p=0.014 (C) and p=0.635 (D). *p<0.05; and ns: not significant.
-
Figure 4—figure supplement 1—source data 1
Data for the fluoresence recovery curve (A,B) and the kinetic parameters (C,D) in Figure 4—figure supplement 1.
- https://doi.org/10.7554/eLife.36374.012
Figure 5
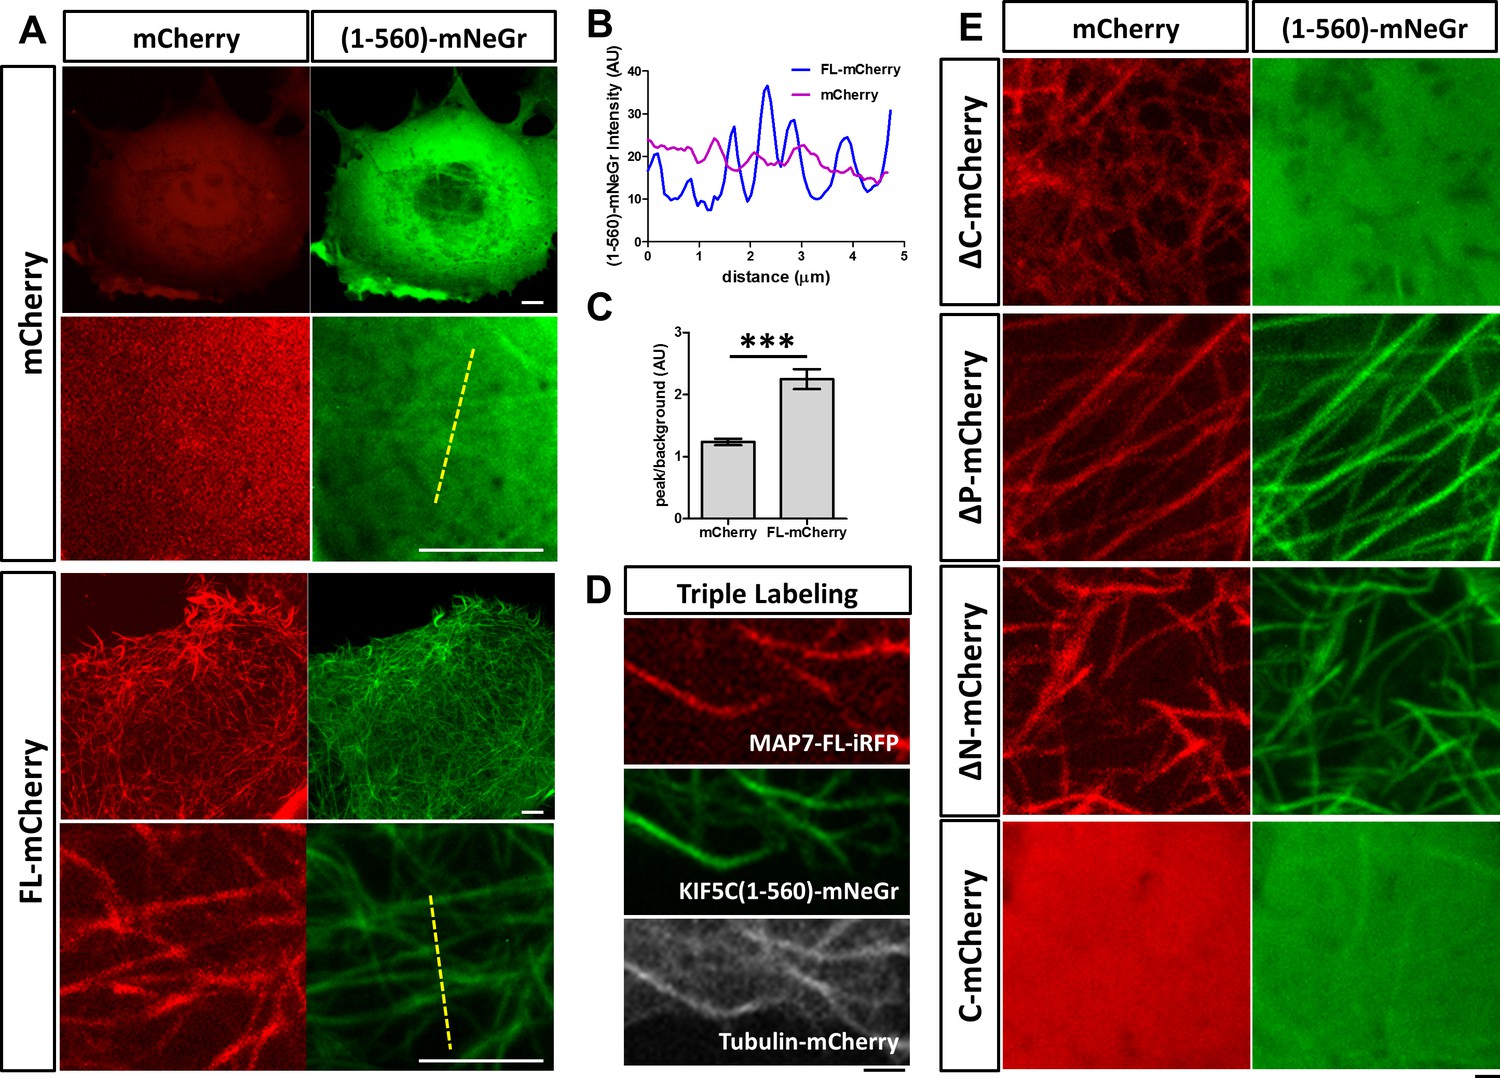
MAP7 enhances kinesin-1 binding to microtubules in COS cells.
(A) Confocal images of live COS cells expressing KIF5C(1-560)-mNeGr (green) with mCherry or MAP7-FL-mCherry (red). High magnification images are shown in the bottom panel of each condition. (B, C) Line scan analysis (B) of the KIF5C(1-560)-mNeGr fluorescence intensity from the dashed lines in (A), and comparison of the peak/background signals from the mNeGr fluorescence in cells expressing mCherry or MAP7-FL-mCherry (C). ***p=0.0004 from t-test (Mean ±SEM). n = 5 lines from one cell. (D) Confocal images of a region in a live COS cell triple transfected to express MAP7-FL-iRFP (red), KIF5C(1-560)-mNeGr (green), and tubulin-mCherry (white). (E) High magnification confocal images of COS cells expressing KIF5C(1-560)-mNeGr (green) with mCherry fusion proteins (red) of the indicated MAP7 fragments.
-
Figure 5—source data 1
Line scan data and quantification of peak/background ratio in Figure 5B,C.
- https://doi.org/10.7554/eLife.36374.015
Figure 6

Analysis of kinesin-1 domains for its recruitment to MAP7-bound microtubules.
(A) Domain structure of KIF5C, which includes motor head, stalk1, and stalk2 domains. The structures of various truncated constructs used in this study are illustrated by line drawings. (B) Confocal images of live COS cells expressing MAP7-FL-mCherry (red) with mNeGr fusions of the indicated KIF5C domains. (C) Sequential confocal images of KIF5C(1-560)-mNeGr (green) and MAP7-FL-iRFP (red) in live COS cells before (pre) and after photobleaching at various time points. (D) FRAP recovery plots for the mNeGr fusion proteins of the active motor KIF5C(1-560) and the stalk1 domain KIF5C(335-560), as well as MAP7-FL-iRFP. Solid lines are derived from non-linear curve fitting. (E, F) Comparison of the off-rate constant (koff) and the total recovery derived from curve fitting for the mNeGr fusion proteins of KIF5C(1-560) and KIF5C(335-560) on MAP7-FL-iRFP-bound microtubules. n = 182 for KIF5C(1-560) and 238 for KIF5C(335-560) from seven cells each condition. T-test (Mean ±SEM) for koff (E): p=0.03 and for recovery (F): p=0.65. *p<0.05; and ns: not significant. Scale bars: 2 μm.
-
Figure 6—source data 1
Data for the fluoresence recovery curve (D) and the kinetic parameters (E,F) in Figure 6.
- https://doi.org/10.7554/eLife.36374.017
Figure 7 with 3 supplements
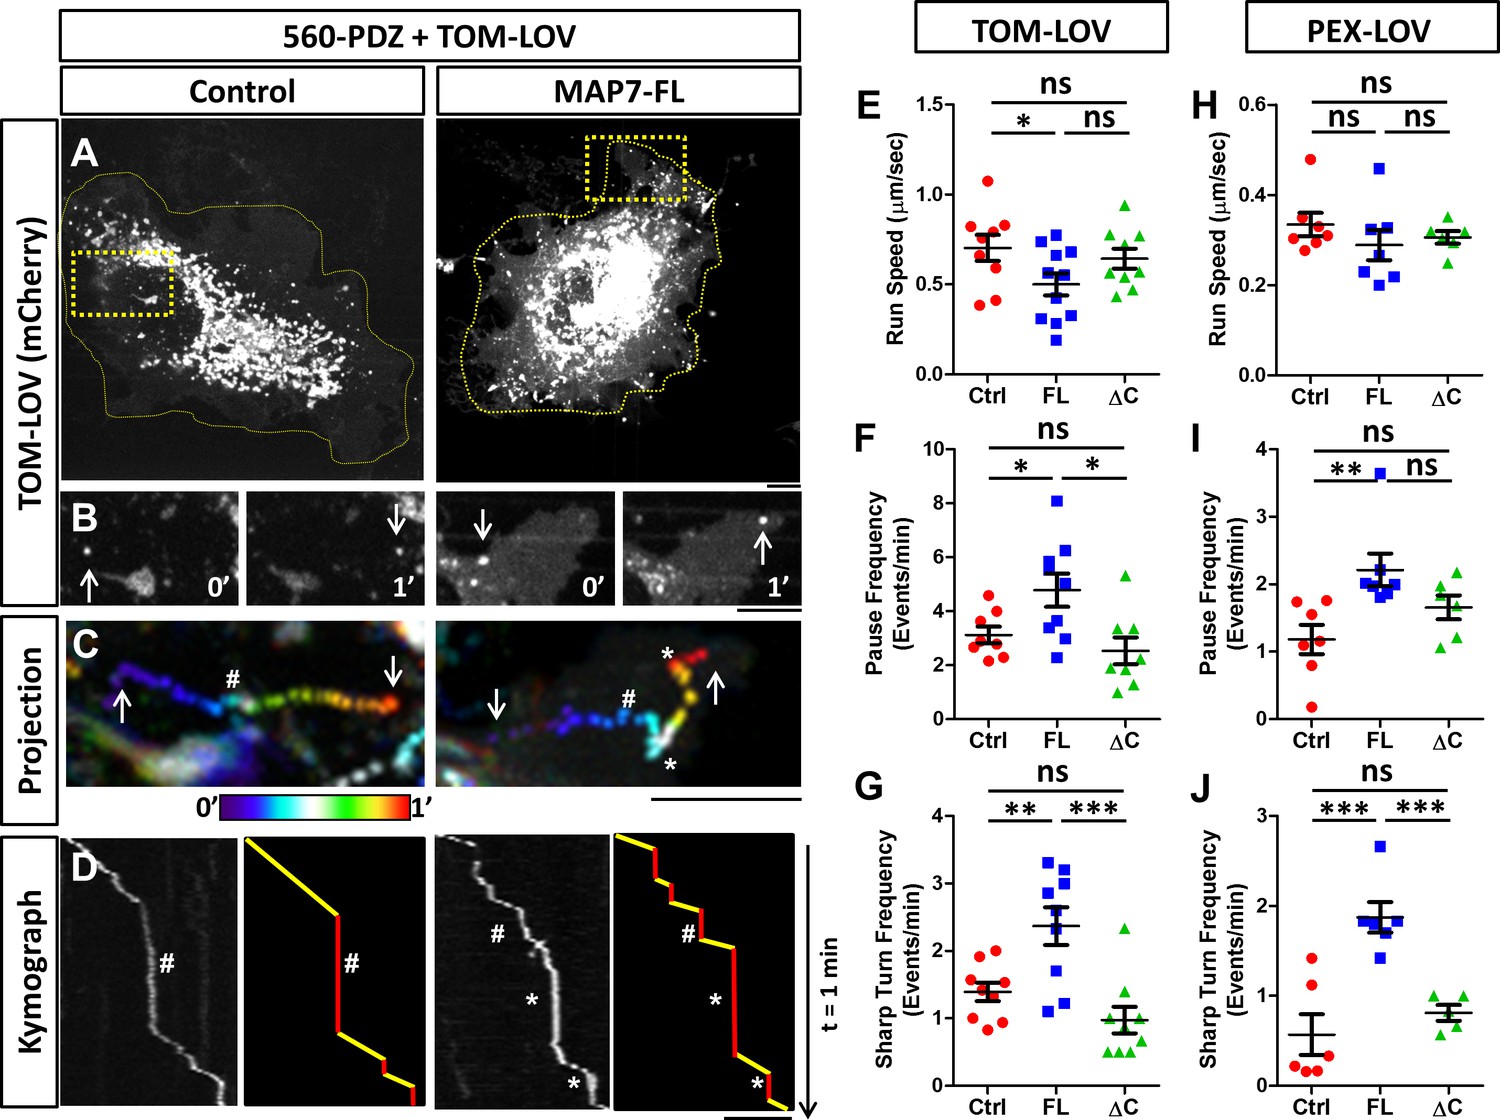
MAP7 affects kinesin-1-mediated transport in COS cells revealed by optogenetic activation of organelle movement.
(A, B) Analysis of TOM-LOV-labeled mitochondrial movement in COS cells expressing TOM-LOV and 560-PDZ together with the control iRFP or MAP7-FL-iRFP. High magnification TOM-LOV images of the boxed areas in (A) are shown at time 0’ and at time 1’ in (B). Arrows indicate the mitochondria analyzed below in (C, D). (C) Sequential images at 1-s intervals are projected with temporal color-coding to show the trajectories of motile mitochondria. Arrows indicate the beginning and the end of each trajectory. The two ends of the color bar represent 0’ and 1’ respectively. Asterisks (*) indicate pause followed by sharp turns and hashes (#) indicate pauses followed by straightruns. (D) Kymographs (left panel) of TOM-LOV-labeled mitochondria are generated based on the trajectories in (C) andeach run track is represented by line drawing (right panel) to display regions of movement (yellow) and regions of pausing (red). Asterisks (*) and hashes (#) indicate corresponding pauses in (C). (E–G) Comparisons of mitochondria run speed (E), pause frequency (F), and sharp turn frequency (G) between cells expressing TOM-LOV, 560-PDZ, and the iRFP control (ctrl), MAP7-FL-iRFP (FL), or MAP7-ΔC-iRFP (ΔC). n = 8 cells (>4 tracks per cell). T-test (Mean ±SEM) for (E): Ctrl-FL, p=0.04; Ctrl-ΔC, p=0.52; FL-ΔC, p=0.10; for (F): Ctrl-FL, p=0.04; Ctrl-ΔC, p=0.32; FL- ΔC, p=0.67; and for (G): Ctrl-FL, p=0.007; Ctrl-ΔC, p=0.10; FL-ΔC, p=0.0009. (H–J) Comparisons of peroxisome run speeds (H), pause frequency (I), and sharp turn frequency (J) between cells expressing PEX-LOV, 560-PDZ, and the iRFP control (ctrl), MAP7-FL-iRFP (FL), or MAP7-ΔC-iRFP (ΔC). n = 8 cells (>4 tracks per cell). T-test (Mean ±SEM) for (H): Ctrl-FL, p=0.31; Ctrl-ΔC, p=0.37; FL-ΔC, p=0.01; for (I): Ctrl-FL, p=0.008; Ctrl-ΔC, p=0.13; FL-ΔC, p=0.10; and for (J): Ctrl-FL, p=0.001; Ctrl-ΔC, p=0.38; FL- ΔC, p=0.006. *p<0.05, **p<0.005, ***p<0.001 and ns: not significant. Scale bars: 5 µm.
-
Figure 7—source data 1
Data for the comparasion of several movemen parameters in Figure 7E–J.
- https://doi.org/10.7554/eLife.36374.022
Figure 7—figure supplement 1
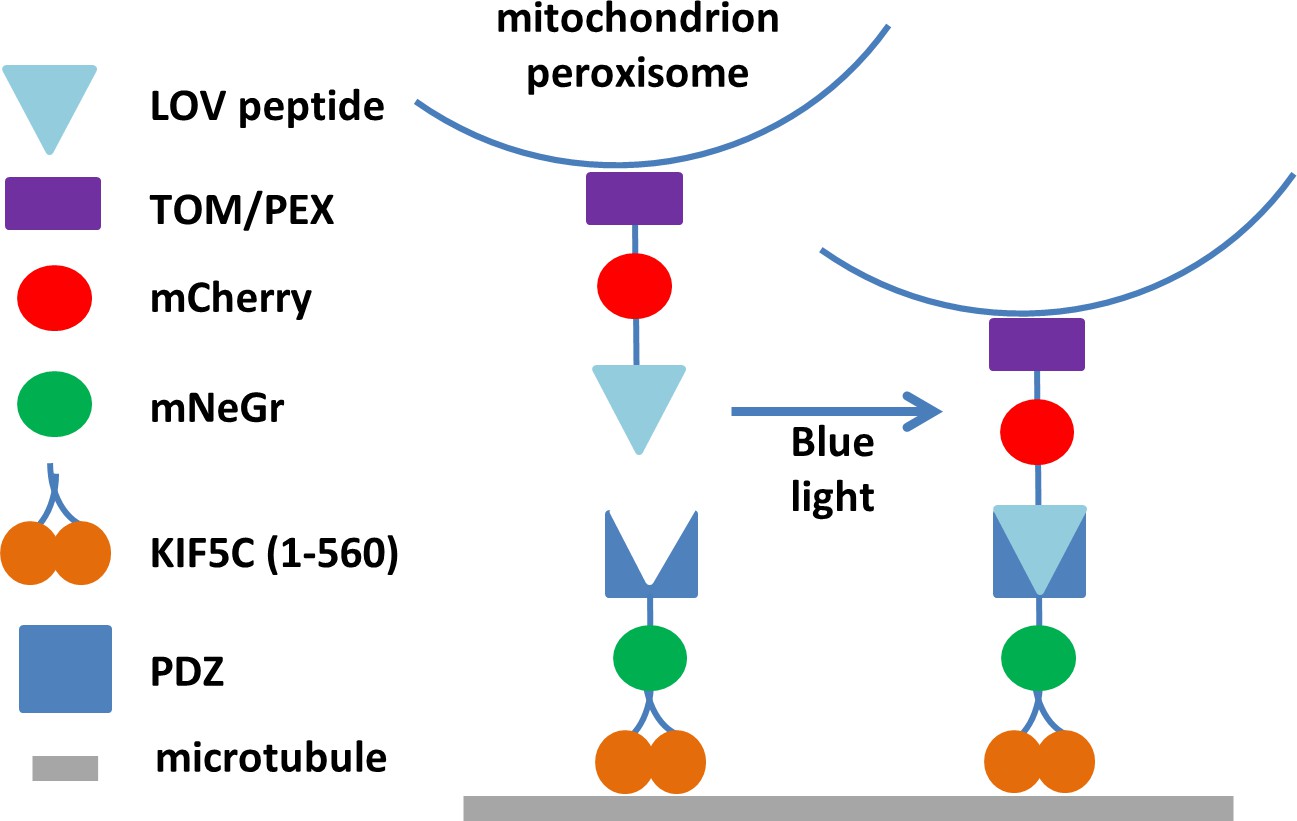
Construction of protein domains used in the optogenetic experiments.
https://doi.org/10.7554/eLife.36374.019
Figure 7—figure supplement 2
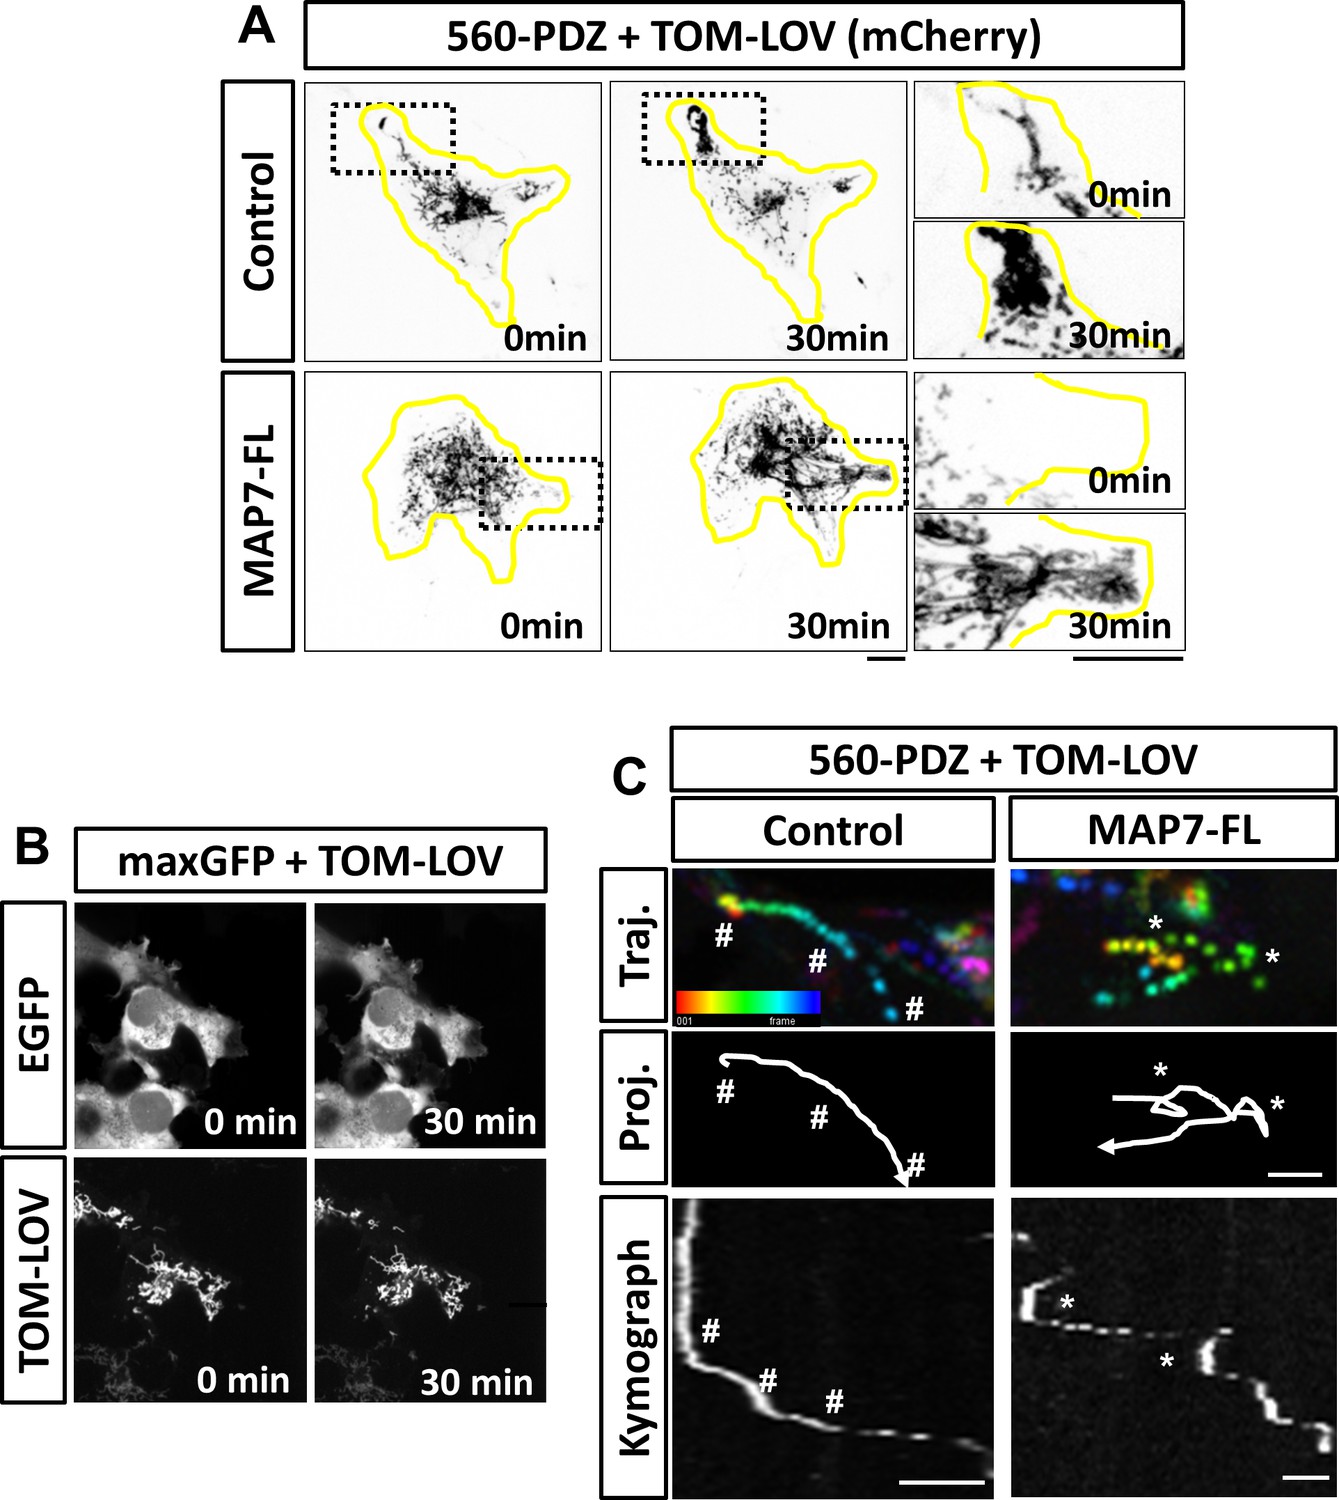
Optogenetic activation of kinesin-1-mediated mitochondrial movement in COS cells.
(A) Inverted images of TOM-LOV signal in COS cells co-transfected with 560-PDZ and TOM-LOV along with the iRFP control or MAP7-FL-iRFP. Images are acquired prior to (0 min) and after light stimulation (30 min). High magnification images of boxed regions of TOM-LOV signal are shown on the right. (B) Confocal images of GFP and TOM-LOV in COS cells co-expressing pMaxGFP (as control for 560-PDZ) and TOM-LOV prior to (0 min) and after light stimulation (30 min). (C) Examples of track switch behavior in COS cells expressing 560-PDZ and TOM-LOV along with the iRFP control or MAP7-FL-iRFP. Projected images with temporal color coding of TOM-LOV mitochondria are shown in the top panel (Traj.) and the corresponding line drawings of their trajectories are shown in the middle panel (Proj.). Arrowheads indicate the direction of movement. Kymographs of the movement are shown in the bottom panel. Asterisks (*) indicate pauses followed by sharp turns, and hashes (#) indicate pauses followed by smooth runs. Scale bars: 10 µm (A-B) and 2 µm (C).
Figure 7—figure supplement 3
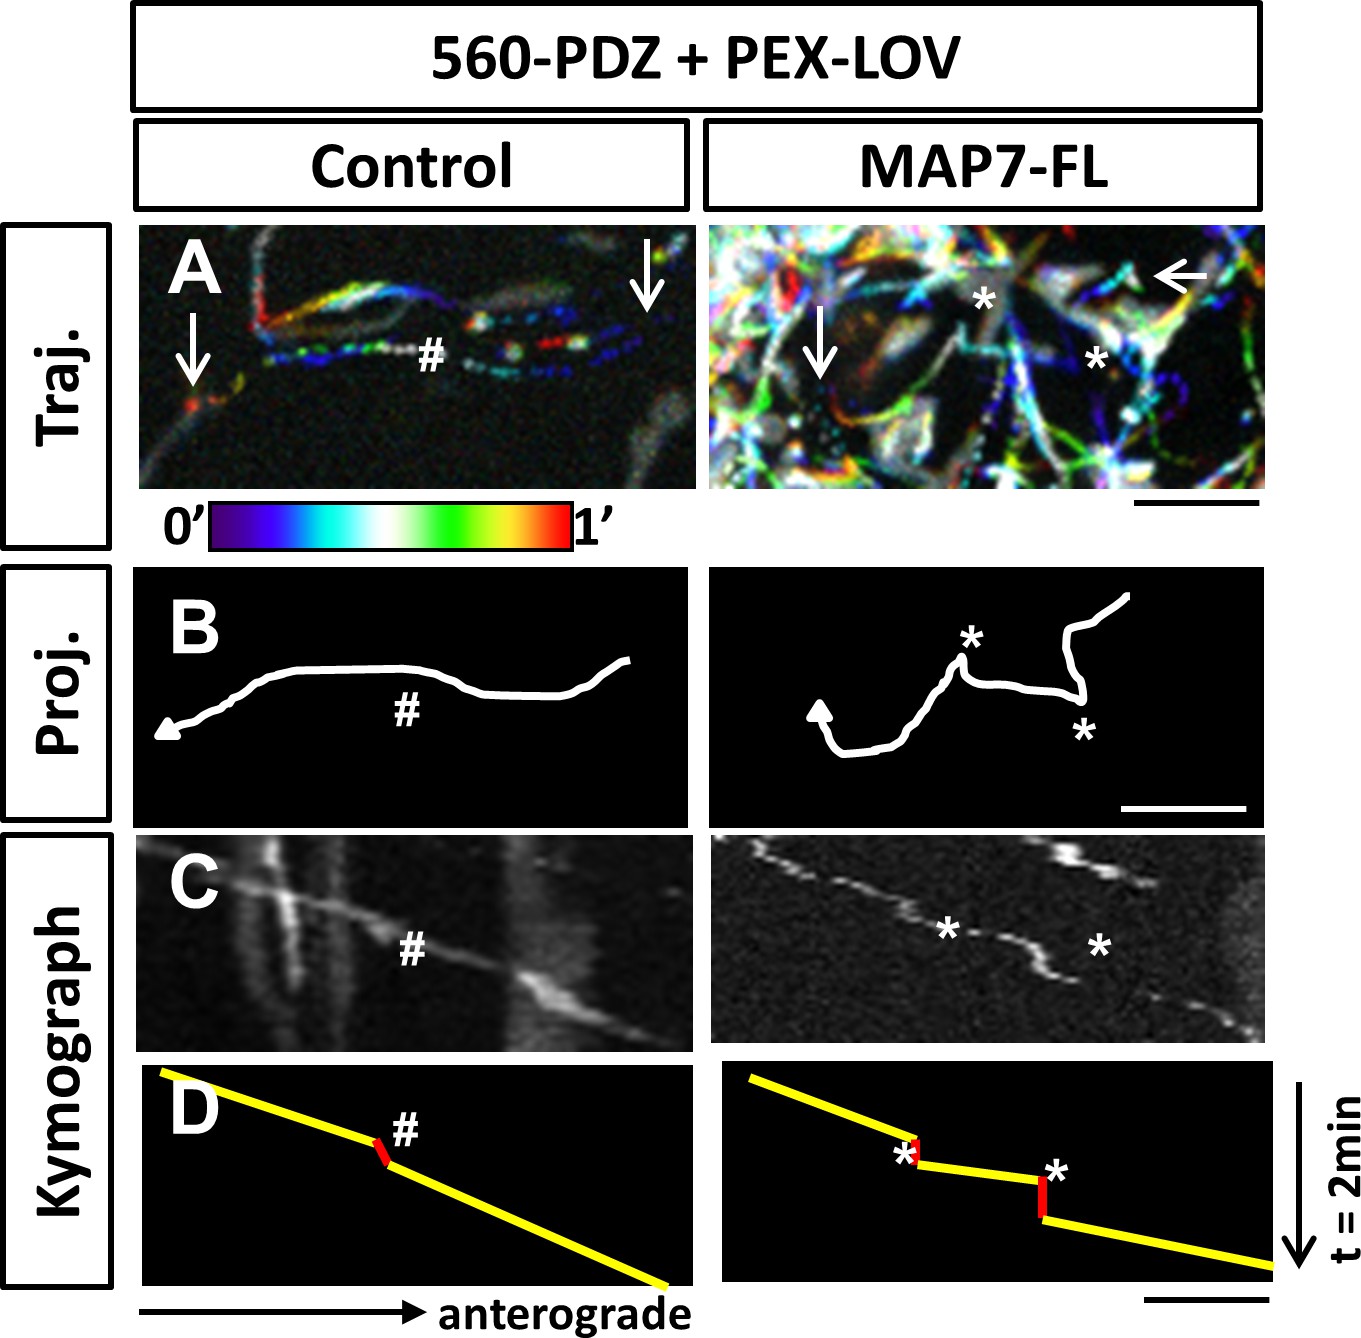
Optogenetic activation of kinesin-1-mediated peroxisome movement in COS cells.
(A) Projections with temporal color-coding of sequential images at 1-s intervals show motile peroxisome trajectories in COS cells expressing PEX-LOV, 560-PDZ, and the iRFP control or MAP7-FL-iRFP. Arrows indicate the beginning and the end of each trajectory. The two ends of the color bar represent 0’ and 1’ respectively. (B) Line drawings of the trajectories in (A) show track switching behavior in MAP7 but not in control-expressing cells. (C, D) Kymographs (C) of PEX-LOV-labeled peroxisomes are generated based on the trajectories in (A, B). Each run track in the kymograph is represented by line drawing (D) to display regions of movement (yellow) and regions of pausing (red). Asterisks (*) indicate pause followed by sharp turns and pound signs (#) indicate pauses followed by smooth runs. Scale bars: 5 µm.
Figure 8 with 2 supplements
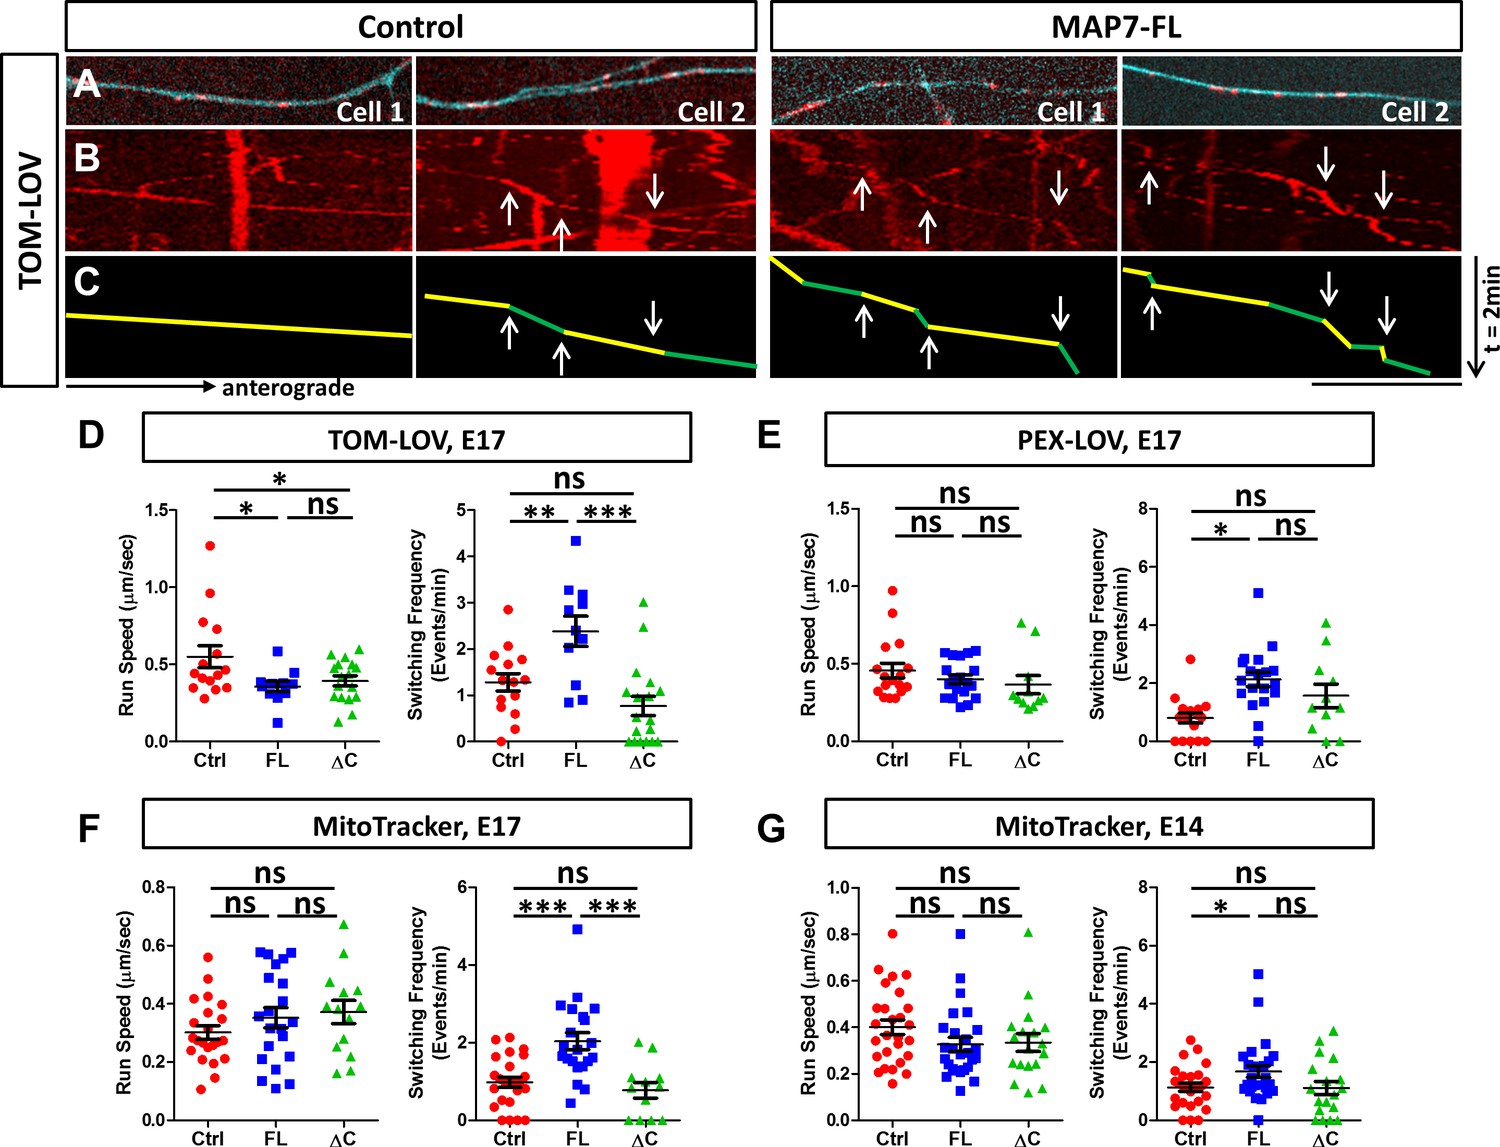
MAP7 induces changes in kinesin-mediated organelle movement in DRG axons.
(A) Representative images of TOM-LOV-labeled mitochondria (red) from DRG axons in cells expressing 560-PDZ and TOM-LOV with either the iRFP control or MAP7-FL-iRFP (cyan). (B, C) Kymographs (B) for the images shown in (A), and line drawings of representative runs with yellow and green segements of varying speeds (C). Changes in speed along a run are indicated by arrows. (D, E) Comparison of mitochondrion (D) or peroxisome (E) run speed and frequency of speed switching between E17 DRG axons expressing TOM-LOV (D) or PEX-LOV (E) along with 560-PDZ and the iRFP control (Ctrl), MAP7-FL-iRFP (FL), or MAP7-ΔC-iRFP (ΔC). n ≥ 11 cells per condition and n > 5 runs for each cell. T-test (Mean ±SEM) for (D): run speed: Ctrl-FL, p=0.04; Ctrl-ΔC, p=0.04; FL-ΔC, p=0.47; switching frequency: Ctrl-FL, p=0.005; Ctrl-ΔC, p=0.08; FL-ΔC, p=0.0002; and for (E): run speed: Ctrl-FL, p=0.30; Ctrl-ΔC, p=0.23; FL-ΔC, p=0.55; switching frequency: Ctrl-FL, p=0.0001; Ctrl-ΔC, p=0.06; FL-ΔC, p=0.21. (F, G) Comparison of run speed and speed switching frequency of MitoTracker-labelled mitochondria between E17 (F) or E14 (G) DRG neurons expressing the EGFP control (Ctrl), MAP7-FL-EGFP(FL), or MAP7-ΔC-EGFP(ΔC). n = 16 cells (>2 tracks per cell). T-test (Mean ±SEM) for (F): run speed: Ctrl-FL, p=0.23; Ctrl-ΔC, p=0.11; FL-ΔC, p=0.71; switching frequency: Ctrl-FL, p=0.001; Ctrl-ΔC, p=0.39; FL-ΔC, p=0.005; and for (G): run speed: Ctrl-FL, p=0.09; Ctrl-ΔC, p=0.19; FL-ΔC, p=0.88; switching frequency: Ctrl-FL, p=0.03; Ctrl-ΔC, p=0.93; FL-ΔC, p=0.076. *p<0.05, ***p<0.001 and ns: not significant. Scale bar: 10 µm.
-
Figure 8—source data 1
Data for the comparasion of run speed and switching frequency in Figure 8D–G.
- https://doi.org/10.7554/eLife.36374.026
Figure 8—figure supplement 1
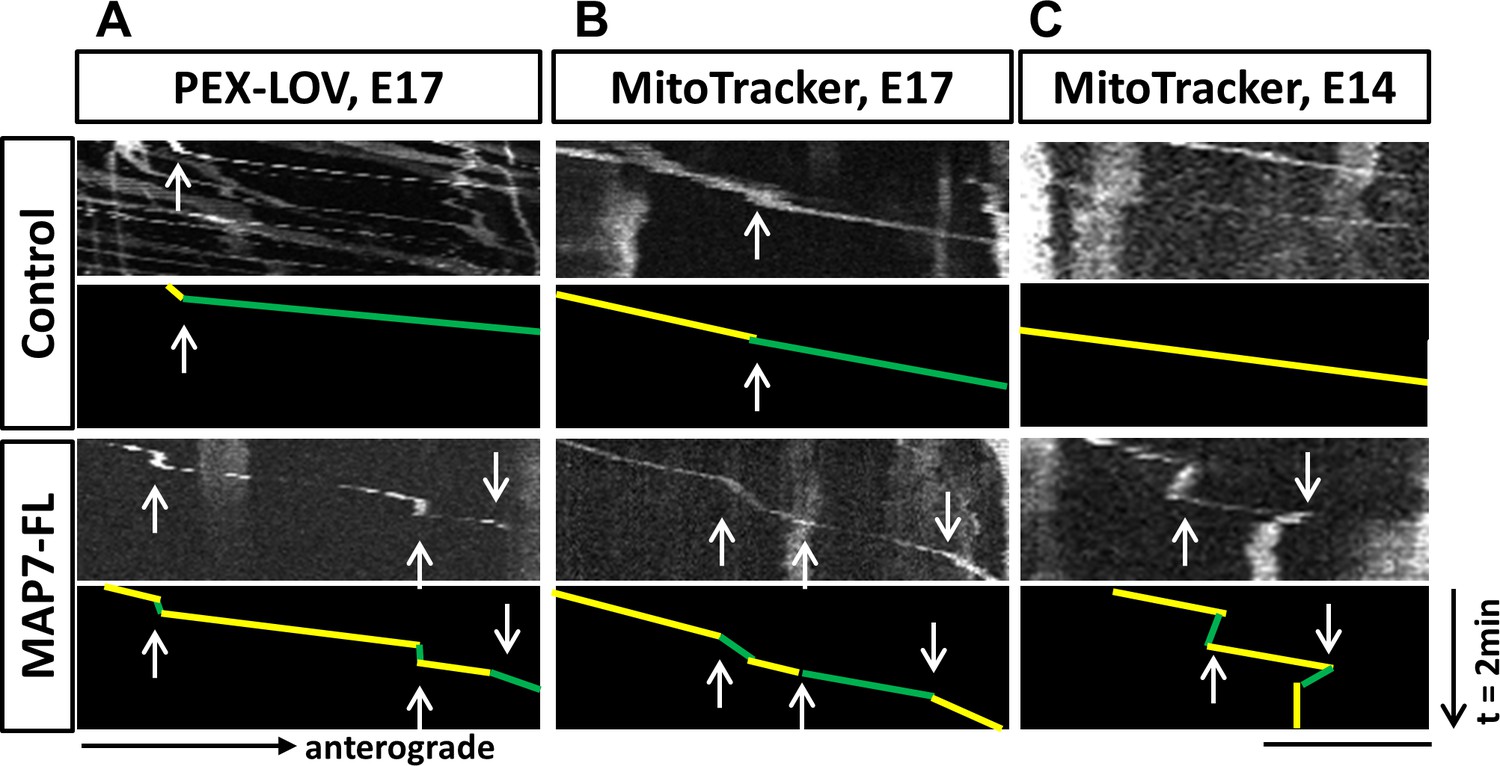
Behaviors of optogenetically activated peroxisome movement or endogenous MitoTracker-labeled mitochondrial movement in DRG axons.
Representative kymograph images (top panels) of PEX-LOV labeled peroxisome (A) or MitoTracker labelled mitochondria (B-C) in E17 (A-B) or E14 (C) DRG neurons expressing either the control or MAP7-FL. 560-PDZ is also expressed in PEX-LOV labeled neurons (A). The corresponding line drawings of representative runs are shown in the bottom panels with yellow and green lines representing changes of speeds(arrows). Scale bar: 10 µm.
Figure 8—figure supplement 2
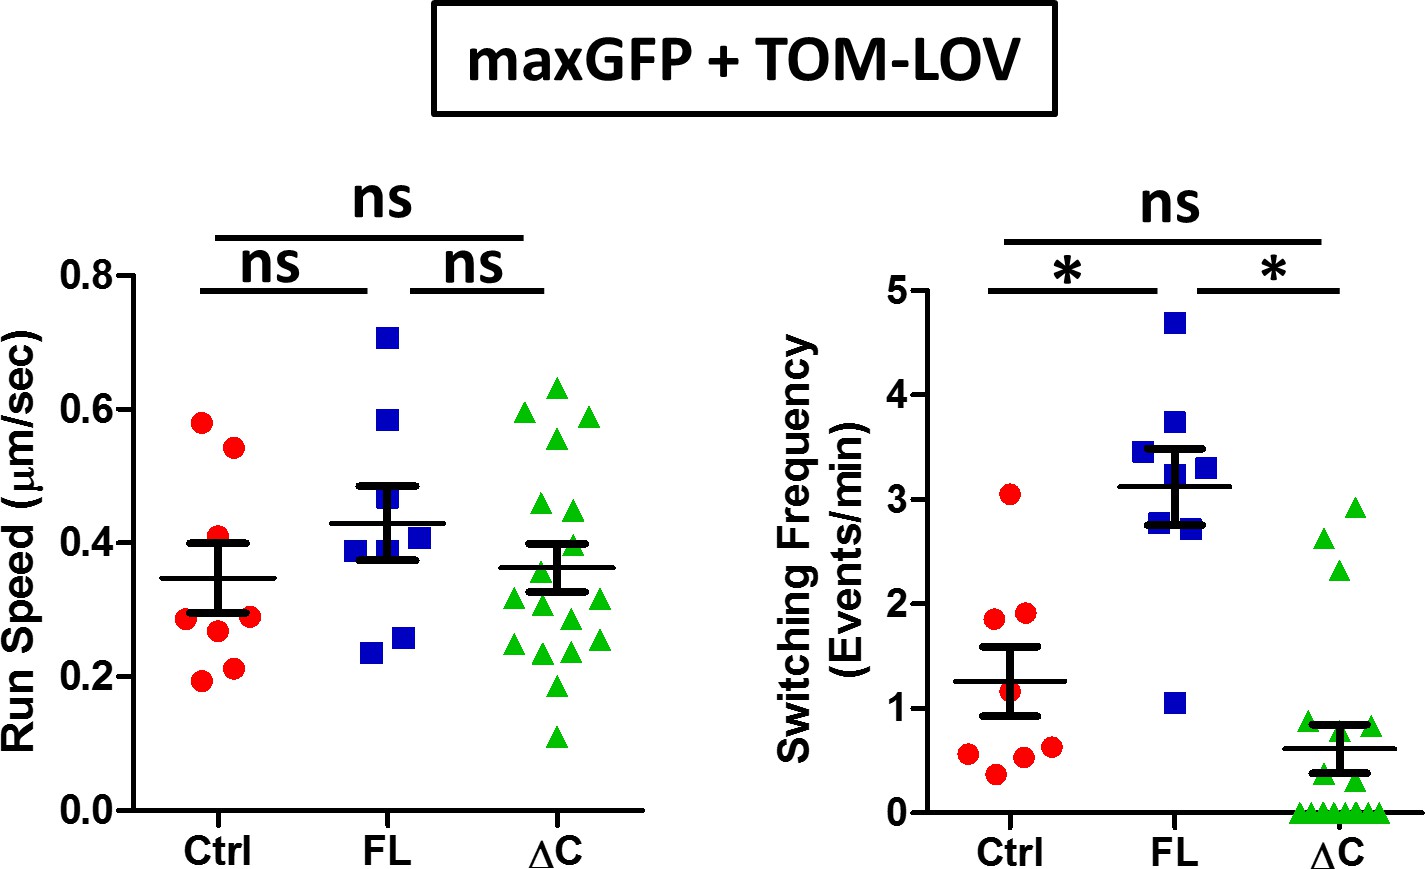
Comparisons of run speed and frequency of speed changes of TOM-LOV mitochondria in DRG axons.
Comparisons of the run speed and the frequency of speed switching of TOM-LOV labeled mitochondria in DRG axons expressing maxGFP (control for 560-PDZ) and TOM-LOV plus either the iRFP control (Ctrl), MAP7-FL-iRFP (FL) or MAP7-ΔC-iRFP (ΔC).
-
Figure 8—figure supplement 2—source data 1
Data for the comparison of run spped and switching frequency in Figure 8—figure supplement 2.
- https://doi.org/10.7554/eLife.36374.027
Tables
Key resources table
| Reagent type | Designation | Source or reference | Identifiers | Additional information |
|---|---|---|---|---|
| Strain, strain background (Rattus norvegicus) | Sprague Dawley (rat) | Charles River | ||
| Cell line (Cercopithecus aethiops) | COS-7 cell (monkey) | Lab stock | RRID:CVCL_0224 | |
| Recombinant DNA reagent | pEGFP-N3 | Clontech | GeneBank #U57609 | |
| Recombinant DNA reagent | MAP7-FL-EGFP | (Tymanskyj et al., 2017) | ||
| Recombinant DNA reagent | MAP7-∆N-EGFP | This paper | ||
| Recombinant DNA reagent | MAP7-∆C-EGFP | (Tymanskyj et al., 2017) | ||
| Recombinant DNA reagent | MAP7-∆P-EGFP | This paper | ||
| Recombinant DNA reagent | MAP7-N-EGFP | This paper | ||
| Recombinant DNA reagent | MAP7-P-EGFP | This paper | ||
| Recombinant DNA reagent | MAP7-C-EGFP | This paper | ||
| Recombinant DNA reagent | GST-MAP7-N | This paper | ||
| Recombinant DNA reagent | MAP7-P-mCherry-His | This paper | ||
| Recombinant DNA reagent | MAP7-C-mCherry-His | This paper | ||
| Recombinant DNA reagent | MAP7-FL-mCherry-His | This paper | ||
| Recombinant DNA reagent | MAP7-∆C -mCherry-His | This paper | ||
| Recombinant DNA reagent | MAP7-∆P-mCherry-His | This paper | ||
| Recombinant DNA reagent | MAP7-∆N -mCherry-His | This paper | ||
| Recombinant DNA reagent | iRFP-N3 | This paper | ||
| Recombinant DNA reagent | MAP7-FL-iRFP | This paper | ||
| Recombinant DNA reagent | MAP7-∆C-iRFP | This paper | ||
| Recombinant DNA reagent | KIF5C(1-560)-mNeGr | (Norris et al., 2015) | ||
| Recombinant DNA reagent | KIF5C(1-335)-mNeGr | This paper | ||
| Recombinant DNA reagent | KIF5C(335-560)-mNeGr | This paper | ||
| Recombinant DNA reagent | TOM-mCherry- LOVpep (TOM-LOV) | (van Bergeijk et al., 2015) | ||
| Recombinant DNA reagent | PEX-mCherry- LOVpep (PEX-LOV) | (van Bergeijk et al., 2015) | ||
| Recombinant DNA reagent | KIF5C(1-560)-PDZ- mNeGr (560-PDZ) | This paper | ||
| Recombinant DNA reagent | Tubulin-mCherry | (Shaner et al., 2004) | ||
| Antibody | α-tubulin (rabbit) | Abcam | # ab18251 RRID:AB_2210057 | 1:5000 |
| Antibody | neurofilament (RMO-270) (mouse) | ThermoFisher Scientific | # 13–0700 RRID:AB_2532998 | 1:1000 |
| Antibody | mCherry (rabbit) | Rockland | # 600-401-379 RRID:AB_2209751 | 1:2500 |
| Antibody | FLAG (rabbit) | Sigma | F7425 RRID:AB_439687 | 1:2500 |
| Antibody | C-terminal MAP7 (rabbit) | GeneTex | # GTX120907 RRID:AB_11170884 | 1:1000 |
| Antibody | GFP (chick) | Aves lab | #GFP-1020 RRID:AB_10000240 | 1:2000 |
| Antibody | Goat anti-Rabbit IgG, Alexa 680 | ThermoFisher Scientific | #A-21109 RRID: AB_2535758 | 1:1000 |
| Antibody | Alexa 488 Donkey anti-chicken IgY (IgG)(H + L) | Jackson ImmunoResearch | #703-545-155 RRID:AB_2340375 | 1:1000 |
| Antibody | Alexa 568 goat anti-rabbit IgG (H + L) | Invitrogen | #A11036 RRID:AB_10563566 | 1:1000 |
| Antibody | Cy3-AffiniPure Donkey Anti-Mouse IgG (H + L) | Jackson ImmunoResearch | #715-165-150 RRID:AB_2340813 | 1:1000 |
| Antibody | Peroxidase-AffiniPure Goat-Anti Mouse IgG | Jackson ImmunoResearch | #115-035-003 RRID:AB_10015289 | 1:2500 |
| Antibody | Peroxidase-AffiniPure Donkey Anti-Chicken IgY (IgG) (H + L) | Jackson ImmunoResearch | 703-035-155, RRID:AB_10015283 | 1:2000 |
| Recombinant proteins | GST-MAP7-N-FLAG | This paper | ||
| Recombinant proteins | MAP7-P-mCherry-His | This paper | ||
| Recombinant proteins | MAP7-C-mCherry-His | This paper | ||
| Commercial assay or kit | P3 primary cell transfection reagent | Lonza | V4XP-3012 | |
| Chemicals | MitoTracker Red CMXRos | ThermoFisher Scientific | M7512 | |
| Chemicals | Clarity Western ECL | BioRad | 1705060 | |
| Software | ImageJ/Fiji | NIH | RRID:SCR_003070 | |
| Software | GraphPad Prism | GraphPad Software, | RRID:SCR_002798 |
Additional files
-
Transparent reporting form
- https://doi.org/10.7554/eLife.36374.028
Download links
A two-part list of links to download the article, or parts of the article, in various formats.
Downloads (link to download the article as PDF)
Open citations (links to open the citations from this article in various online reference manager services)
Cite this article (links to download the citations from this article in formats compatible with various reference manager tools)
MAP7 regulates axon morphogenesis by recruiting kinesin-1 to microtubules and modulating organelle transport
eLife 7:e36374.
https://doi.org/10.7554/eLife.36374


