The cJUN NH2-terminal kinase (JNK) signaling pathway promotes genome stability and prevents tumor initiation
- University of Massachusetts Medical School, United States
- Histo-Scientific Research Laboratories, United States
- Howard Hughes Medical Institute, University of Massachusetts Medical School, United States
Figures
Figure 1 with 2 supplements
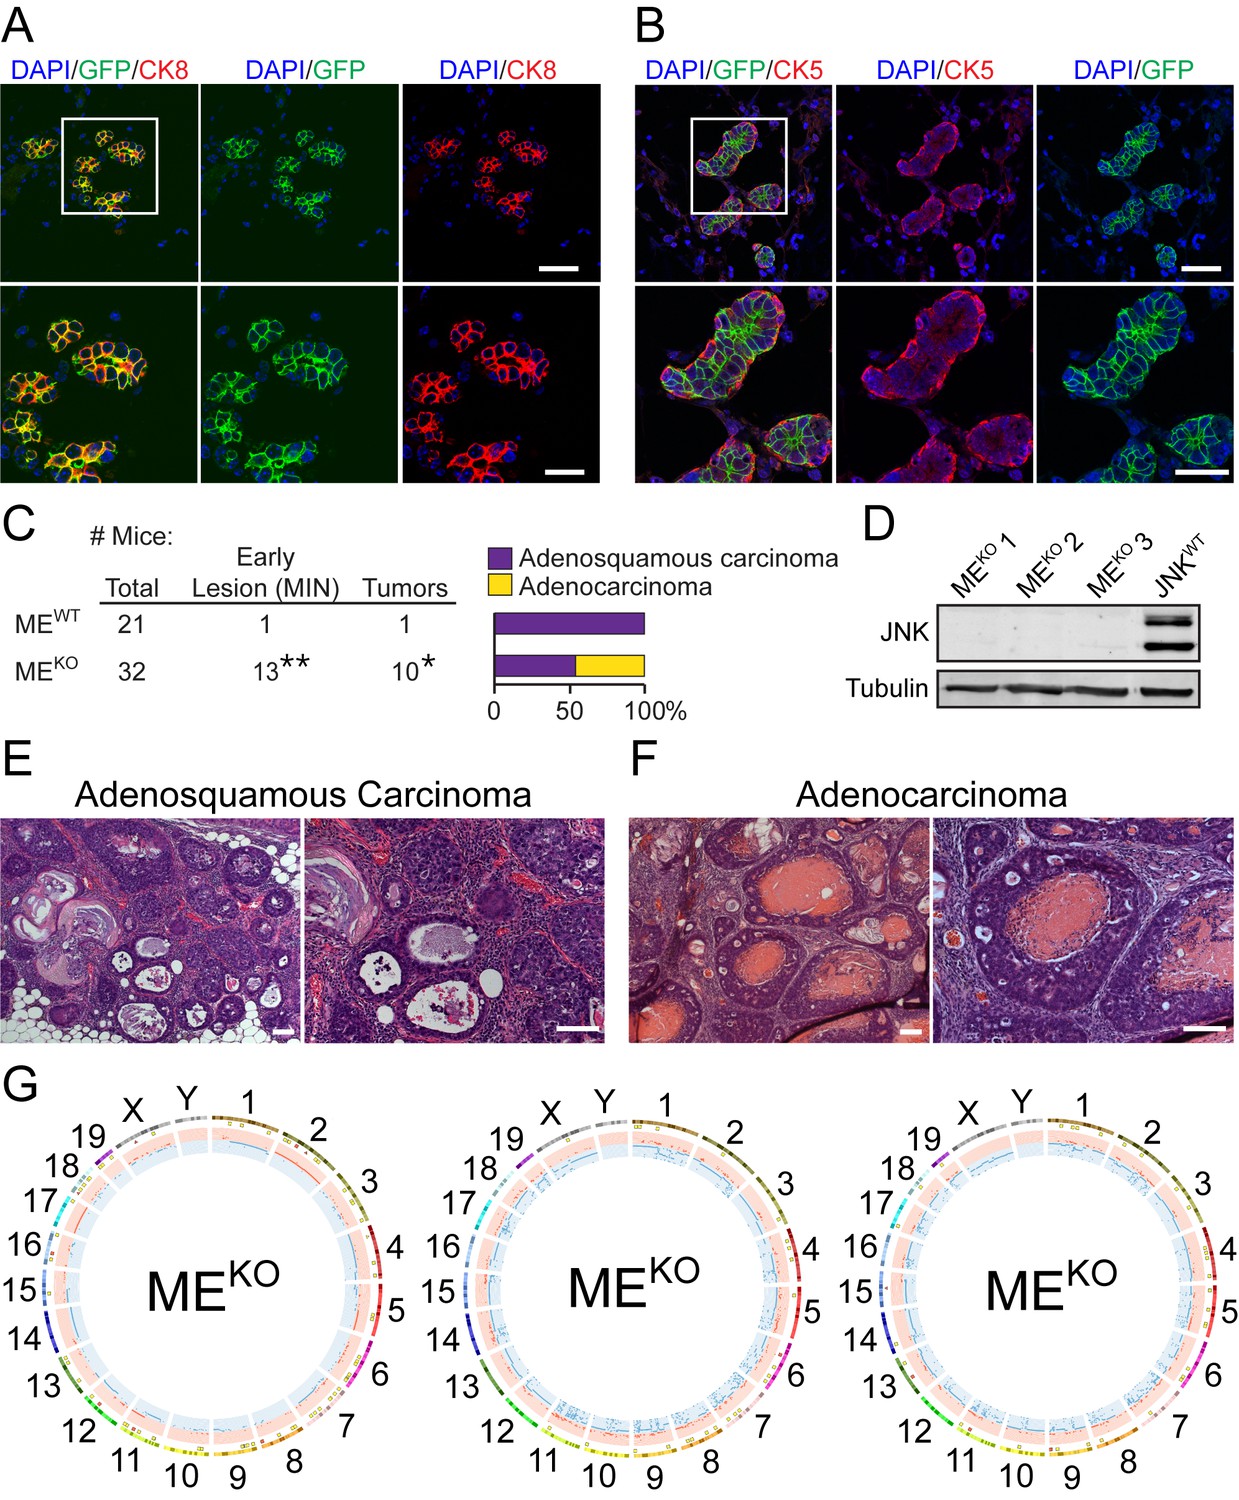
JNK deficiency in mammary epithelial cells causes genomic instability and tumor formation.
(A, B) Mammary gland tissue sections were prepared from parous Wap-Cre+/- Rosa26mTmG+/- female mice (n = 6) on day 21 post-weaning. These sections were stained with antibodies to cytokeratin 8 (CK8, red (A)) or cytokeratin 5 (CK5, red (B)), and GFP (green), and counterstained with DAPI (blue). Representative images are presented (upper panel, scale bar = 48 µm). Boxed area was magnified (lower panel, scale bar = 24 µm). (C) Summary of the study cohort showing the total number of Mapk8LoxP/LoxP Mapk9LoxP/LoxP (MEWT) and Wap-Cre+/- Mapk8LoxP/LoxP Mapk9LoxP/LoxP (MEKO) mice examined, the number of mice exhibiting mammary intraepithelial neoplasia (MIN) or tumors (*p=0.037, **p=0.0084; Fisher’s Exact Test) (left panel). The type of carcinoma is presented (right panel). (D) Extracts prepared from MEKO and Wap-Cre+/- Trp53LoxP/LoxP (JNKWT) tumor cells were subjected to immunoblot analysis using antibodies to JNK and α-Tubulin. The MEKO tumors examined were representative of adenocarcinoma (#1), tumors with characteristics of both adenocarcinoma and adenosquamous carcinoma (#2), and adenosquamous carcinoma (#3). (E, F) Representative hematoxylin and eosin (H and E) -stained sections of adenosquamous carcinomas (E) and adenocarcinomas (F) from MEKO female mice are presented. Scale bar = 100 µm. (G) Exome sequencing was performed on MEKO tumor cell lines (n = 3). Mammary tissue from a virgin female of the same genotype (Wap-Cre+/- Mapk8LoxP/LoxP Mapk9LoxP/LoxP) was used as the reference genome. Circos plots showing copy number variations (CNVs) in MEKO tumor cells are presented. The outermost ring shows chromosome ideograms. The next track indicates high (red) and moderate (yellow) impact single nucleotide variants and indels marked by rectangles and triangles, respectively. The innermost track shows chromosome amplifications and deletions, with red and blue lines indicating chromosomal fragments present at log2(ratio tumor/normal)>0.2 or log2(ratio tumor/normal)<−0.2, respectively.
-
Figure 1—source data 1
Spreadsheet of source data for Figure 1C.
- https://doi.org/10.7554/eLife.36389.006
-
Figure 1—source data 2
Source image data for Figure 1D.
Whole immunoblot scans are presented and the region used to construct Figure 1D is outlined.
- https://doi.org/10.7554/eLife.36389.007
Figure 1—figure supplement 1
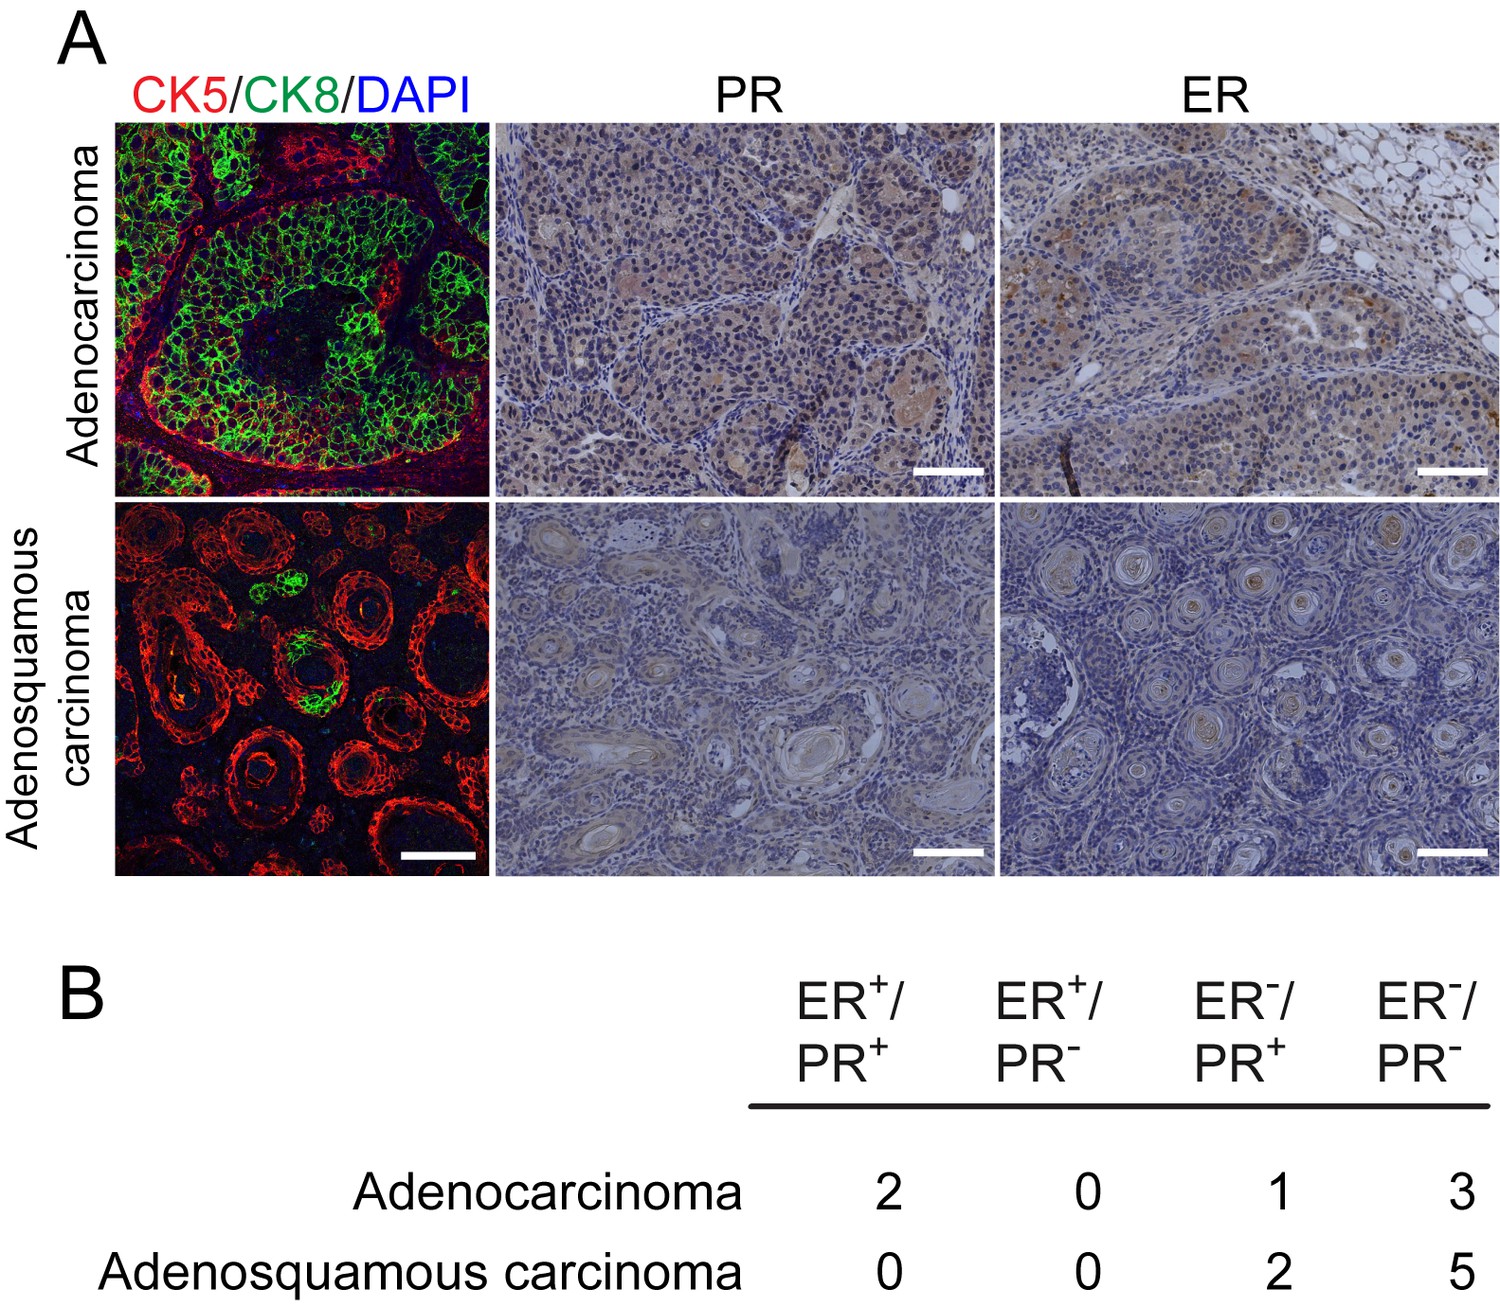
Expression of estrogen and progesterone receptors in breast tumors caused by JNK deficiency in the mammary epithelium.
(A, B) Representative adenocarcinoma (upper panel) and adenosquamous carcinoma (lower panel) sections stained for progesterone receptor (PR), estrogen receptor (ER) (Scale bar = 100 µm), and cytokeratin 8 (CK8, green) and cytokeratin 5 (CK5, red) (Scale bar = 50 µm) are presented. Immunofluorescent stains were counterstained with DAPI (left panels), and peroxidase-based staining was counterstained with hematoxylin (center and right panels) (A). Adenocarcinomas and adenosquamous carcinomas were scored for hormone receptor staining (B).
Figure 1—figure supplement 2
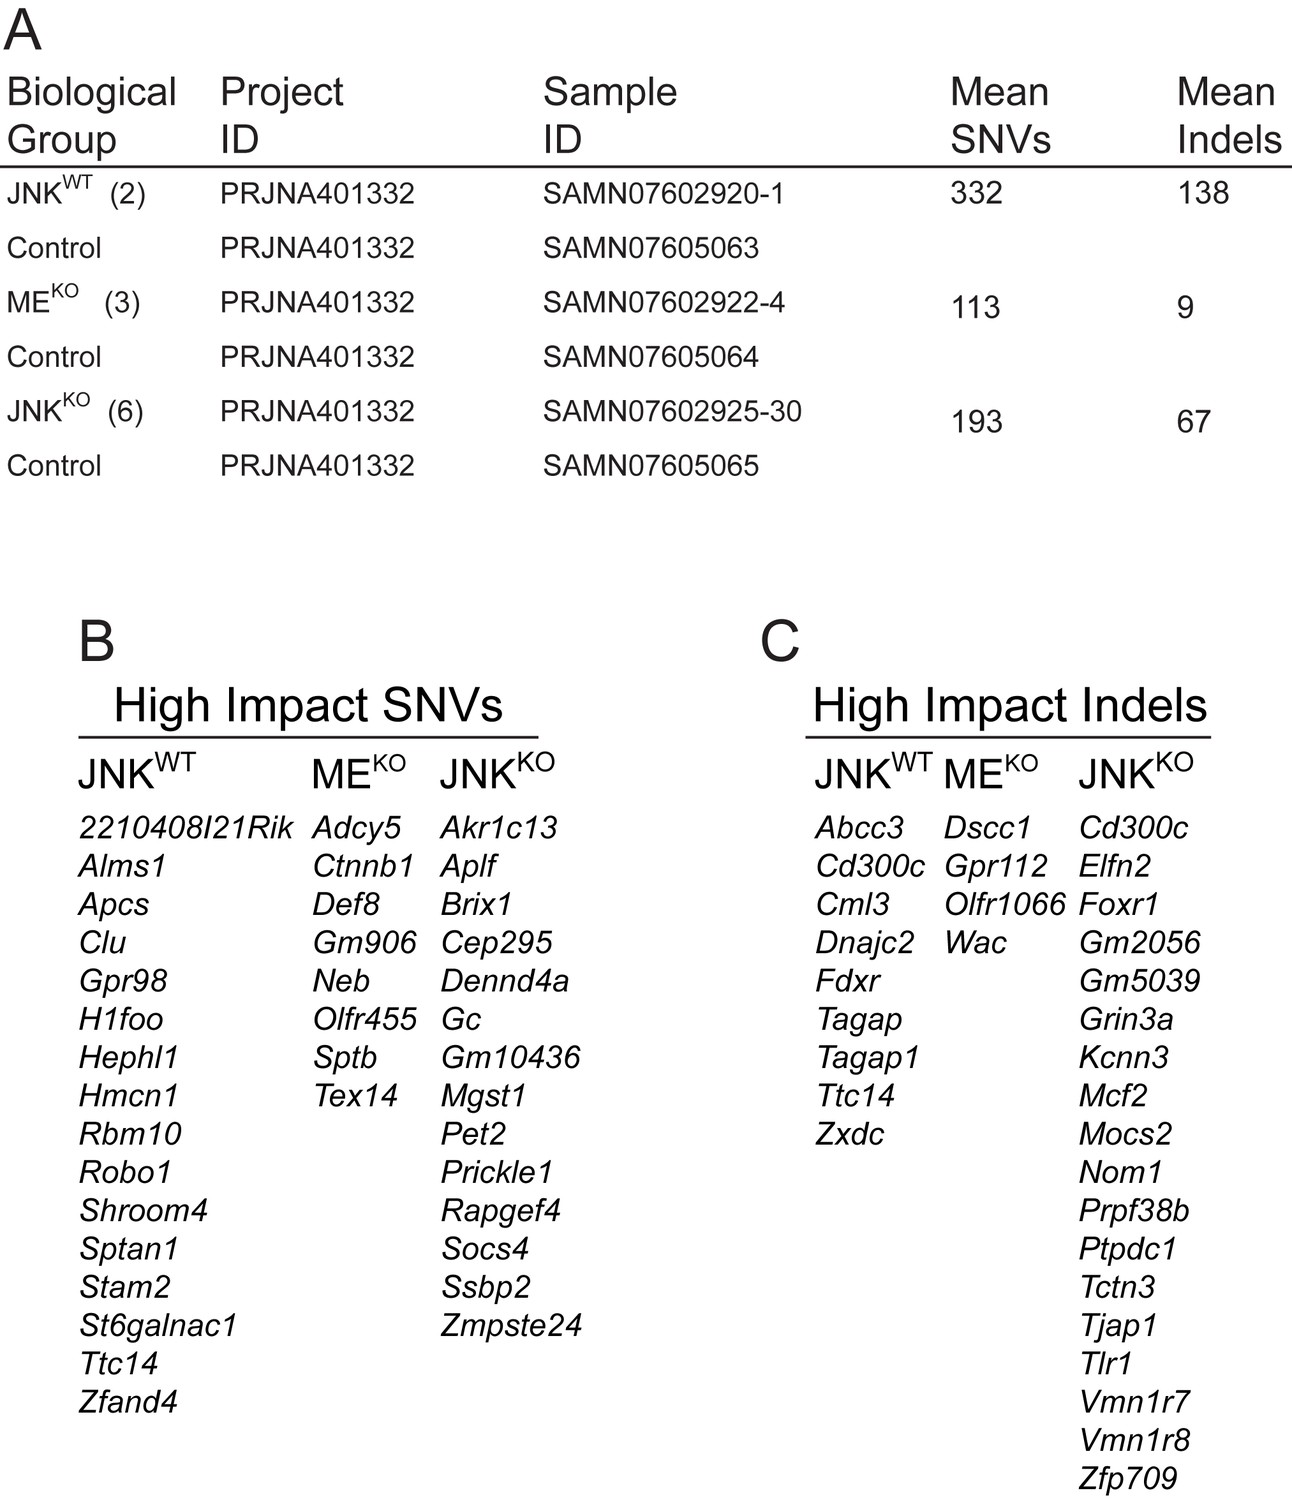
Summary of exome sequence data.
(A) Nomenclature Key: JNKWT (tumors from parous Wap-Cre+/- Mapk8+/+ Mapk9+/+ Trp53LoxP/LoxP mice); JNKKO (tumors from parous Wap-Cre+/- Mapk8LoxP/LoxP Mapk9LoxP/LoxP Trp53LoxP/LoxP mice); MEKO (tumors from parous Wap-Cre+/- Mapk8LoxP/LoxP Mapk9LoxP/LoxP mice); and Control (mammary epithelium of non-parous mice of the same genotype). The NCBI SRA accession information (Project ID and Sample ID) for the exome sequence data is presented. The mean number of single nucleotide variants (SNVs) and insertions/deletions (Indels) is shown for each tumor genotype. An examination of frequent nucleotide changes revealed that MEKO tumor cells favored G to A (2/3 tumor cell lines) and JNKKO favored C to T (4/6 tumor cell lines) replacements, but no favored replacements were identified in JNKWT tumor cells. (B, C) High impact SNVs (B) and Indels (C) identified in JNKWT (n = 2), MEKO (n = 3) and JNKKO (n = 6) cells are summarized. No well-established driver mutations were found among the high impact indels or SNVs identified and there were no recurring mutations within or across genotypes.
Figure 2 with 1 supplement
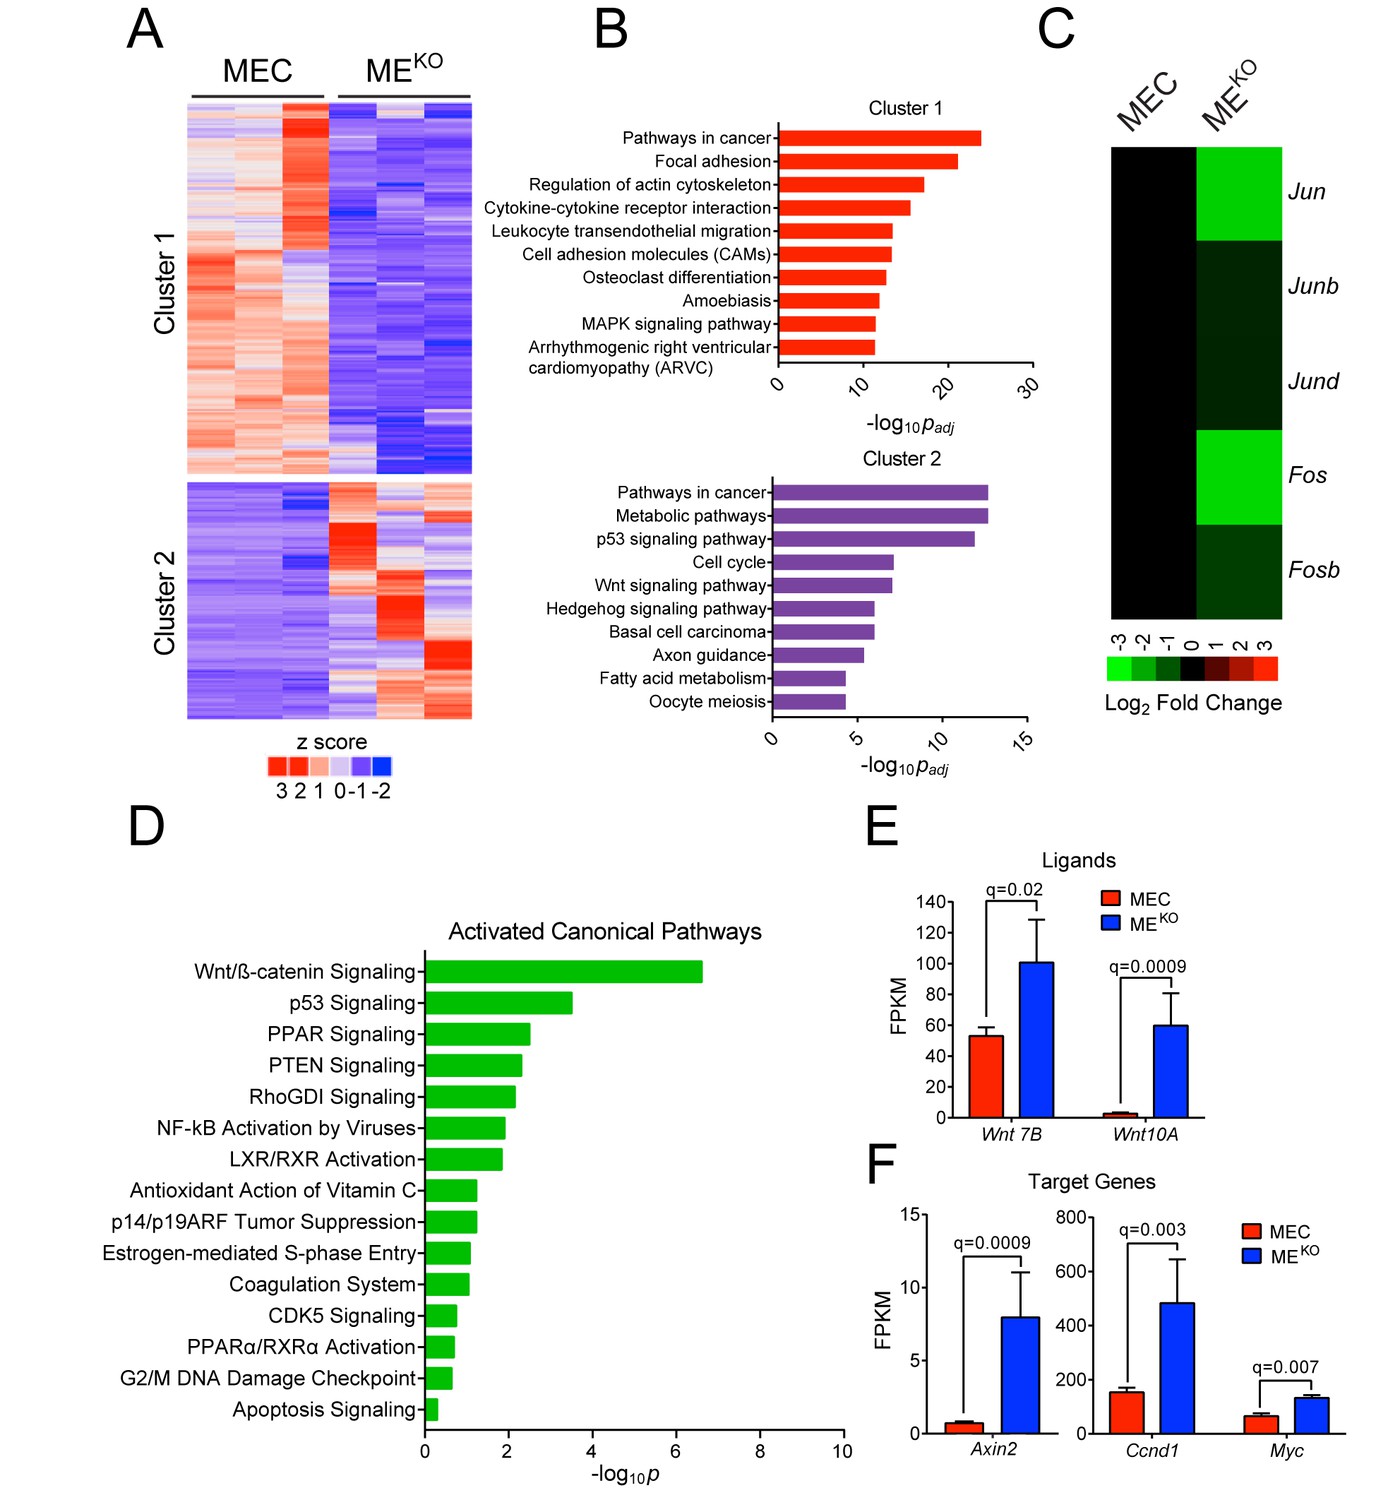
JNK deficiency promotes tumor-associated gene expression.
(A–D) RNA-seq analysis was performed using primary mammary epithelial cells (MEC, n = 3) and MEKO tumor cell lines (n = 3). K-means clustering was performed on differentially expressed genes and is presented as a heatmap (A). Pathway over-representation analysis using the KEGG database was performed on genes from each of the clusters. The pathways with the 10 lowest padj values are presented (B). The mean expression Jun, Junb, Jund, Fos, and Fosb mRNA is presented as a heatmap (C). Ingenuity Pathway Analysis of the RNA-seq data was used to predict signaling pathway activity (D). (E) Wnt7b and Wnt10a expression in MEC (n = 3) and MEKO tumor cells (n = 3) is presented as the mean fragments per kilobase of exon model per million mapped fragments (FPKM) ± SEM. (F) WNT target gene expression (Axin2, Ccnd1, and Myc) in MEC (n = 3) and MEKO (n = 3) cells is presented as the mean FPKM ± SEM.
-
Figure 2—source data 1
Spreadsheet of source data for Figure 2.
- https://doi.org/10.7554/eLife.36389.010
Figure 2—figure supplement 1
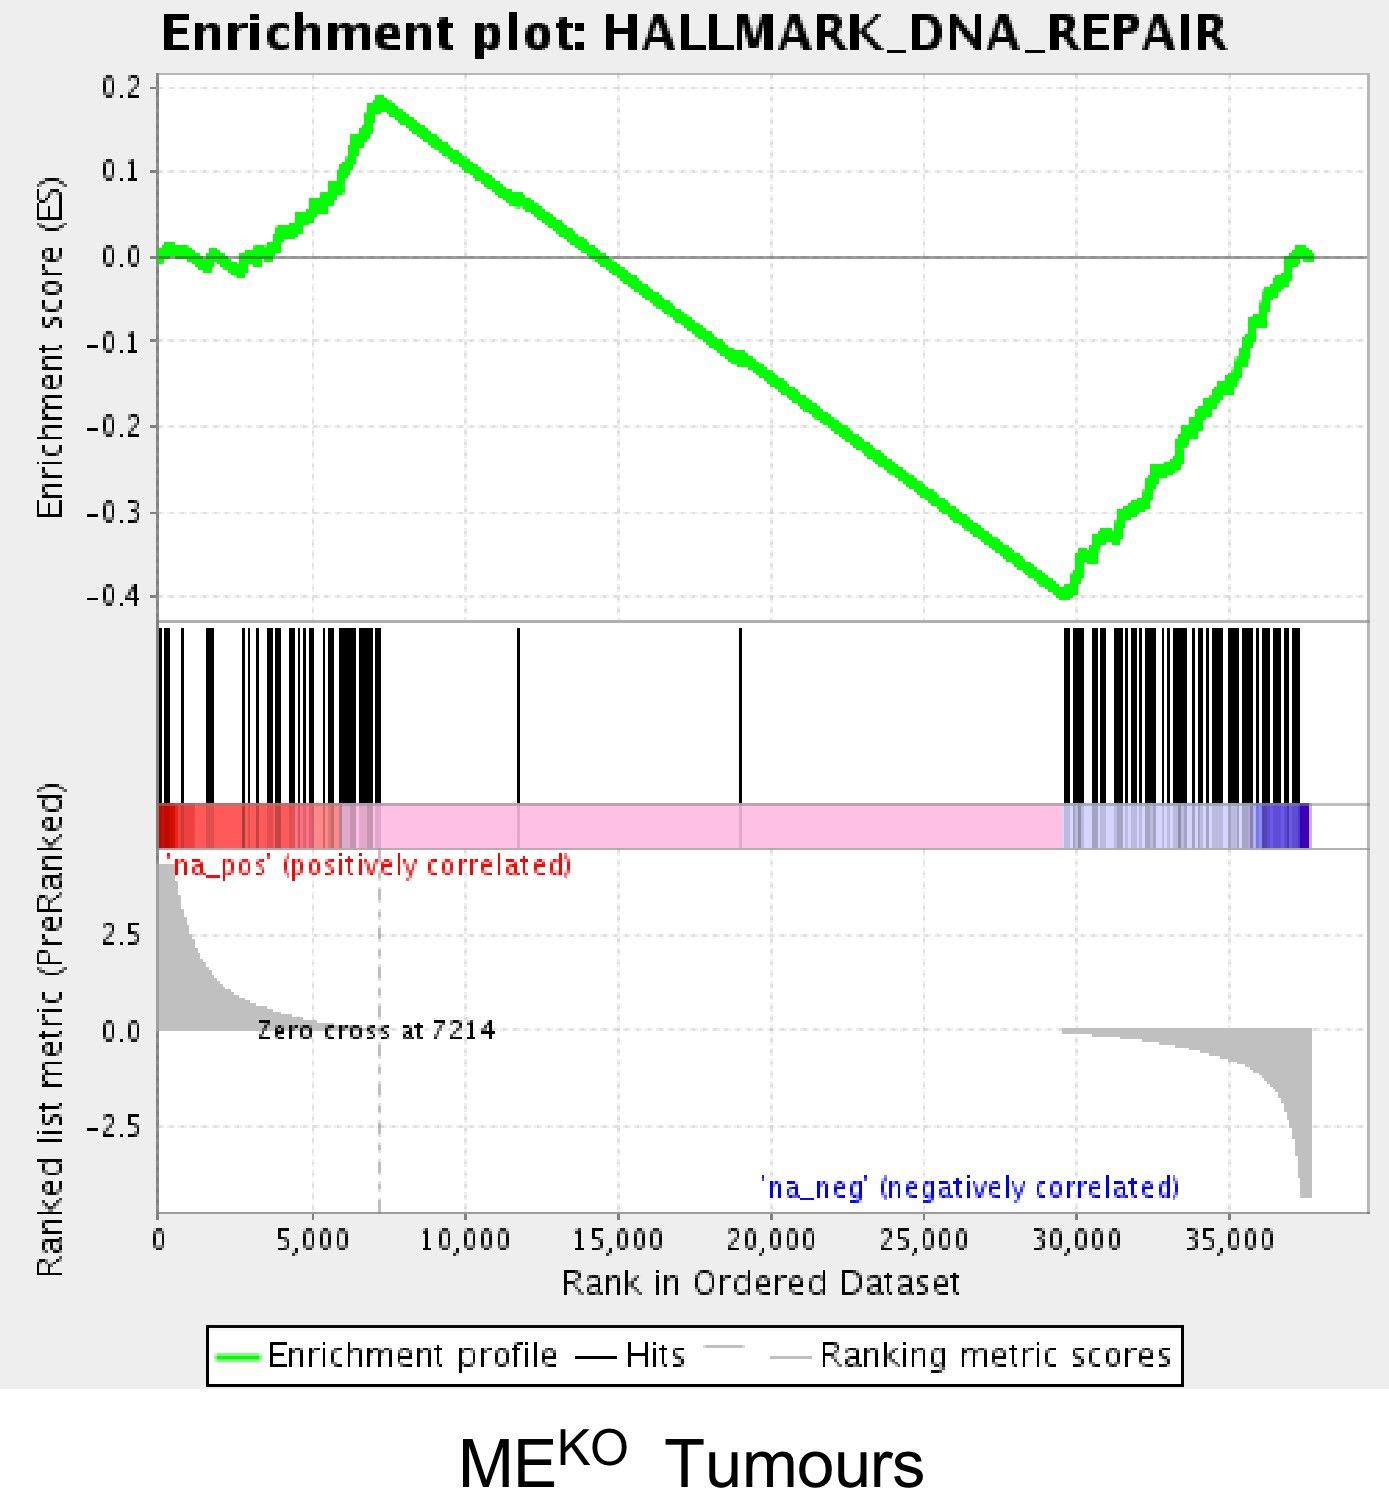
Gene set enrichment analysis demonstrates that JNK deficiency causes decreased expression of a ‘DNA Repair’ gene signature.
GSEA plot of a ‘DNA Repair’ gene signature by MEKO tumor cells compared with primary mammary epithelial cells (MEC) (p<0.01).
Figure 3 with 3 supplements

JNK deficiency accelerates tumor formation in a mouse model of breast cancer.
(A) Mammary tumor-free survival was monitored in cohorts of 26 Wap-Cre+/- Trp53LoxP/LoxP (JNKWT) mice and 32 Wap-Cre+/- Trp53LoxP/LoxP Mapk8LoxP/LoxP Mapk9LoxP/LoxP (JNKKO) mice. Animals euthanized before a palpable mammary tumor had formed were censored in the log-rank analysis. (B) Tissue sections were prepared from JNKWT mammary tumors (n = 11) and JNKKO mammary tumors (n = 35). Representative images of H and E-stained sections from JNKWT (upper panel) and JNKKO (lower panel) mice are presented. Scale bar = 100 µm. (C) Adenocarcinoma tissue sections from JNKWT mice (upper panel) and JNKKO mice (lower panel) were stained with antibodies to (from left to right) estrogen receptor (ER), progesterone receptor (PR), cytokeratins 5 (red) and 8 (green) (CK5 and CK8 respectively), PCNA (Scale bars = 50 µm), and cleaved caspase 3 (Scale bar = 100 µm). Immunofluorescent stains were counterstained with DAPI, and peroxidase-based staining was counterstained with hematoxylin. Representative images are presented. (D, E) Exome sequencing was performed on JNKWT (n = 2) and JNKKO (n = 6) tumor cell lines. Mammary tissue from a virgin female of the same genotype (Wap-Cre+/- Trp53LoxP/LoxP for JNKWT and Wap-Cre+/- Trp53LoxP/LoxP Mapk8LoxP/LoxP Mapk9LoxP/LoxP for JNKKO) was used as the reference genome. Representative Circos plots showing CNVs are presented for JNKWT (D) and JNKKO (E) tumor cells. The outermost ring shows chromosome ideograms. The next track indicates high (red) and moderate (yellow) impact single nucleotide variants and indels marked by rectangles and triangles, respectively. The innermost track shows chromosome amplifications and deletions, with red and blue lines indicating chromosomal fragments present at log2(ratio tumor/normal)>0.2 or log2(ratio tumor/normal)<−0.2, respectively.
-
Figure 3—source data 1
Spreadsheet of source data for Figure 3A.
- https://doi.org/10.7554/eLife.36389.015
Figure 3—figure supplement 1
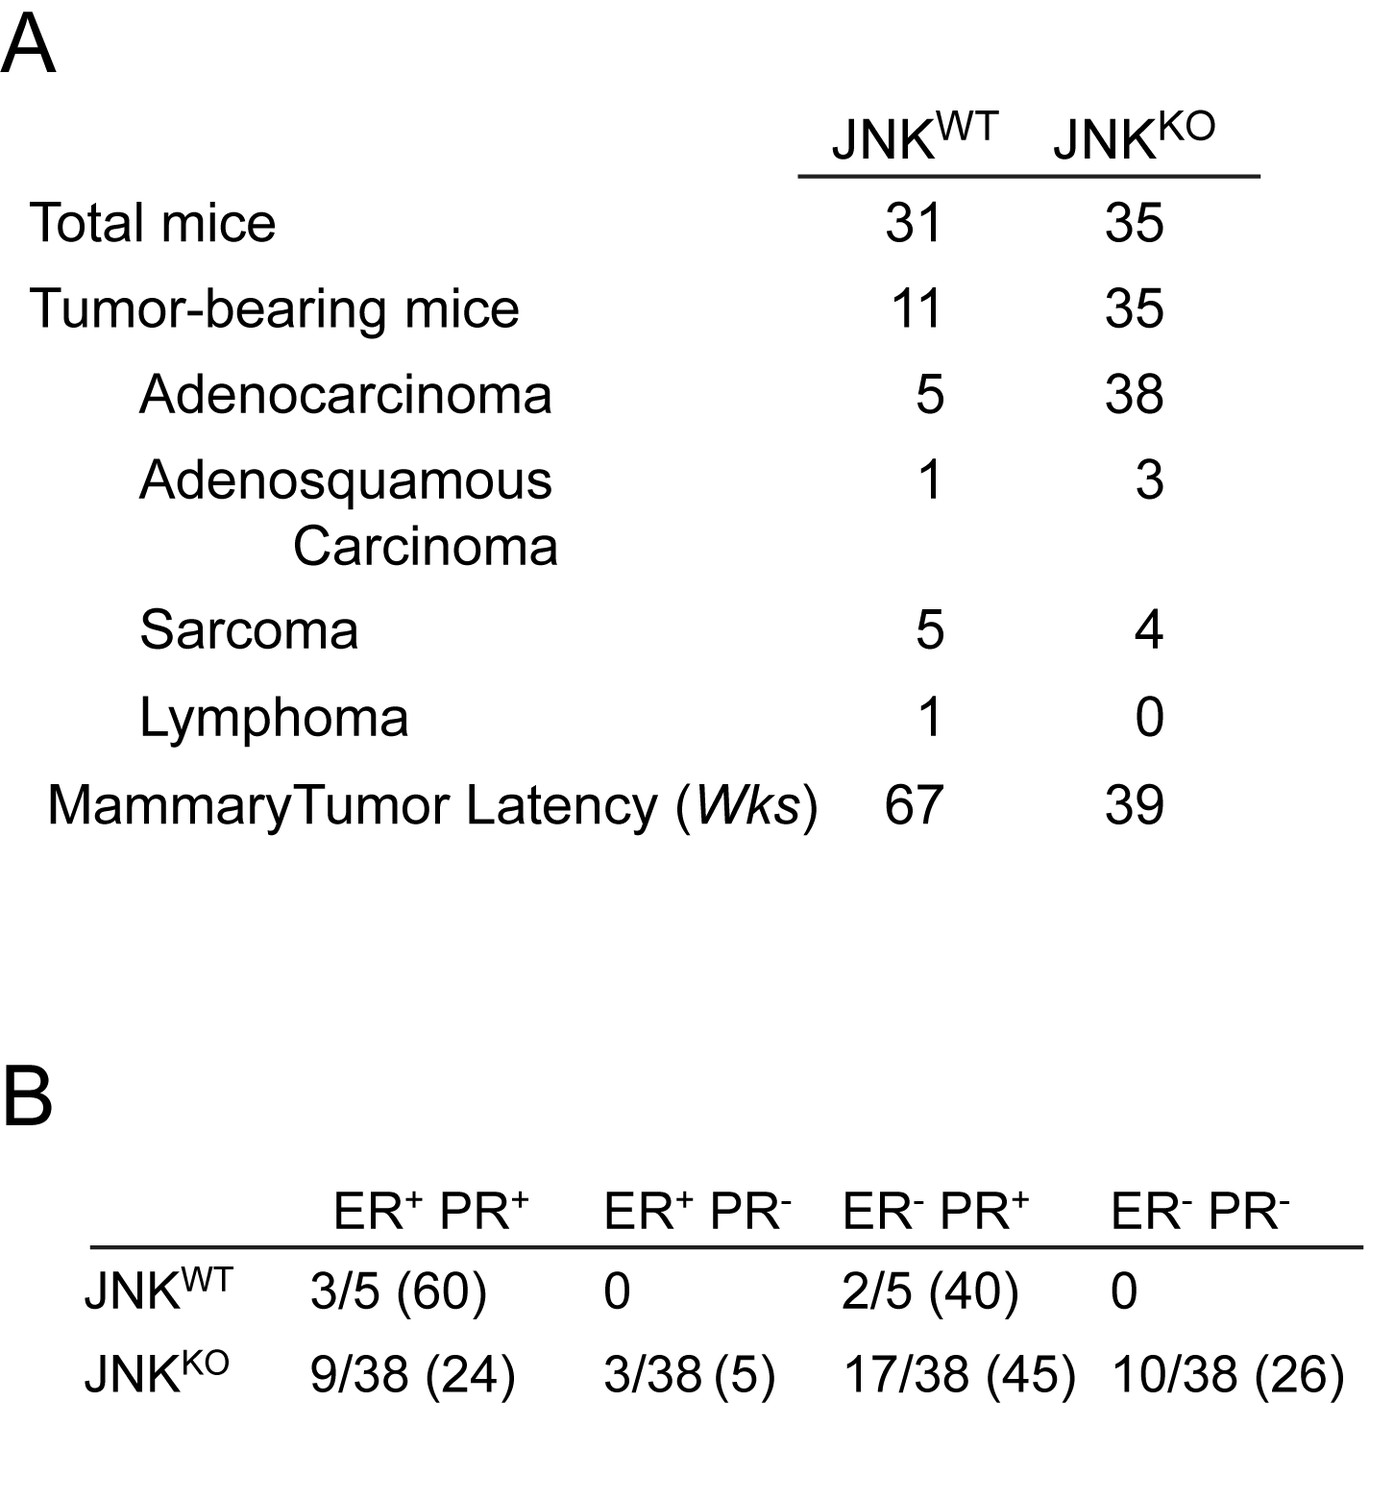
Tumors in JNKKO mice are primarily adenocarcinomas and display a spectrum of hormone receptor expression patterns.
(A) The JNKWT and JNKKO mouse cohorts are summarized. (B) Adenocarcinomas from JNKWT and JNKKO mice were stained for PR and ER and scored for expression. Numbers in parentheses indicate percentages.
Figure 3—figure supplement 2
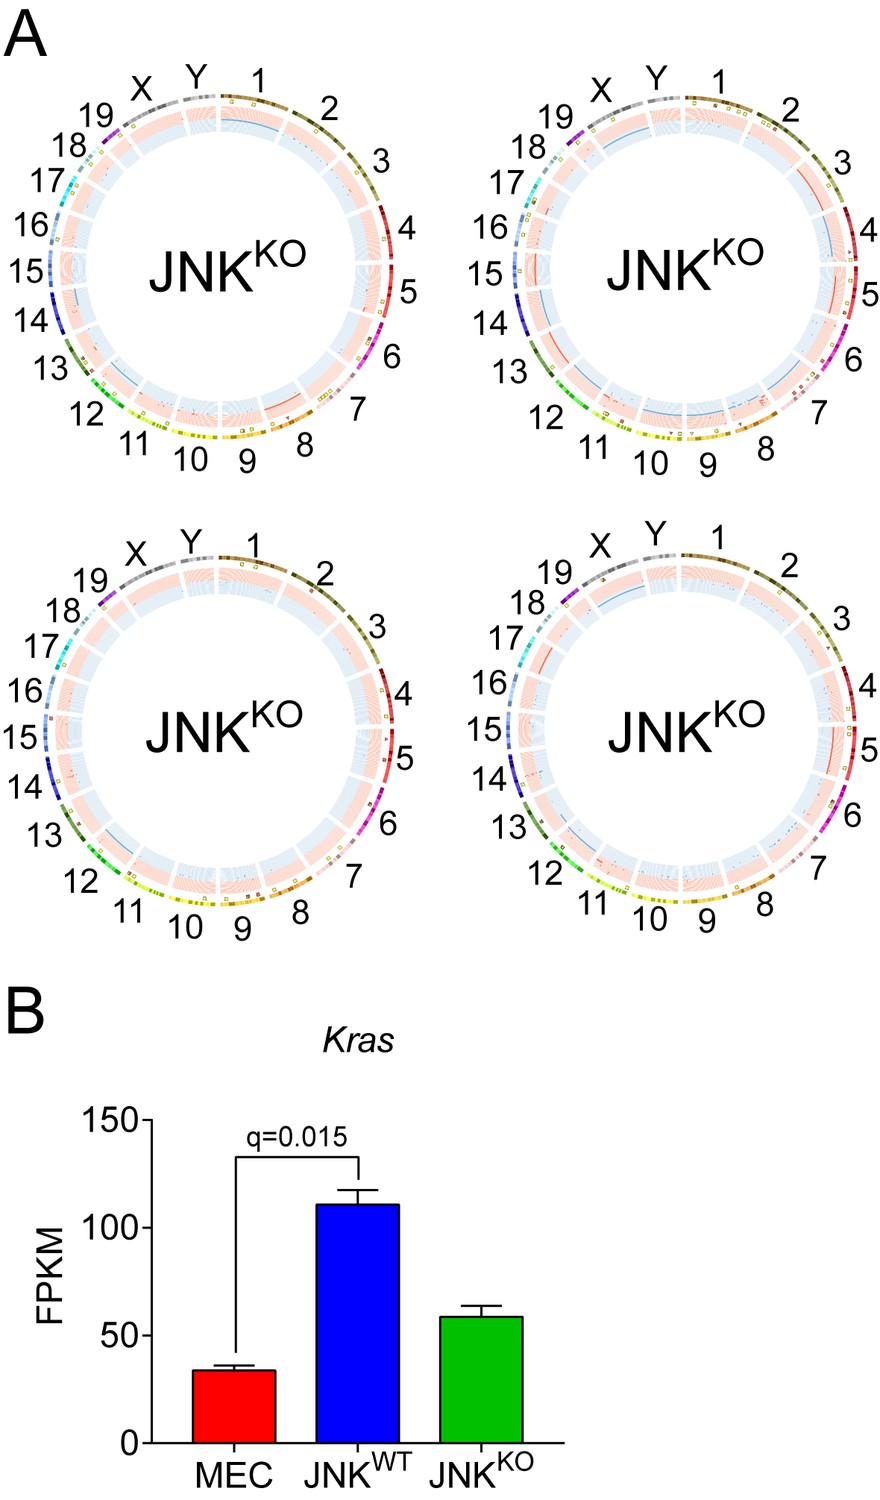
Exome sequencing of Control and JNK-deficient tumor cells.
(A) Circos plots showing copy number variations (CNVs) in additional JNKKO tumor cell lines are presented. Mammary tissue from a virgin female of the same genotype (Wap-Cre+/- Trp53LoxP/LoxP Mapk8LoxP/LoxP Mapk9LoxP/LoxP) was used as the reference genome. The outermost ring shows chromosome ideograms. The next track indicates high (red) and moderate (yellow) impact single nucleotide variants and indels marked by rectangles and triangles, respectively. The innermost track shows chromosome amplifications and deletions, with red and blue lines indicating chromosomal fragments present at log2(ratio tumor/normal)>0.2 or log2(ratio tumor/normal)<−0.2, respectively. (B) Kras expression in MEC (n = 3), JNKWT (n = 2), and JNKKO (n = 2) cells was measured by RNA sequencing and is presented as mean FPKM ± SEM.
-
Figure 3—figure supplement 2—source data 1
Spreadsheet of source data for Figure 3—figure supplement 2C.
- https://doi.org/10.7554/eLife.36389.016
Figure 3—figure supplement 3
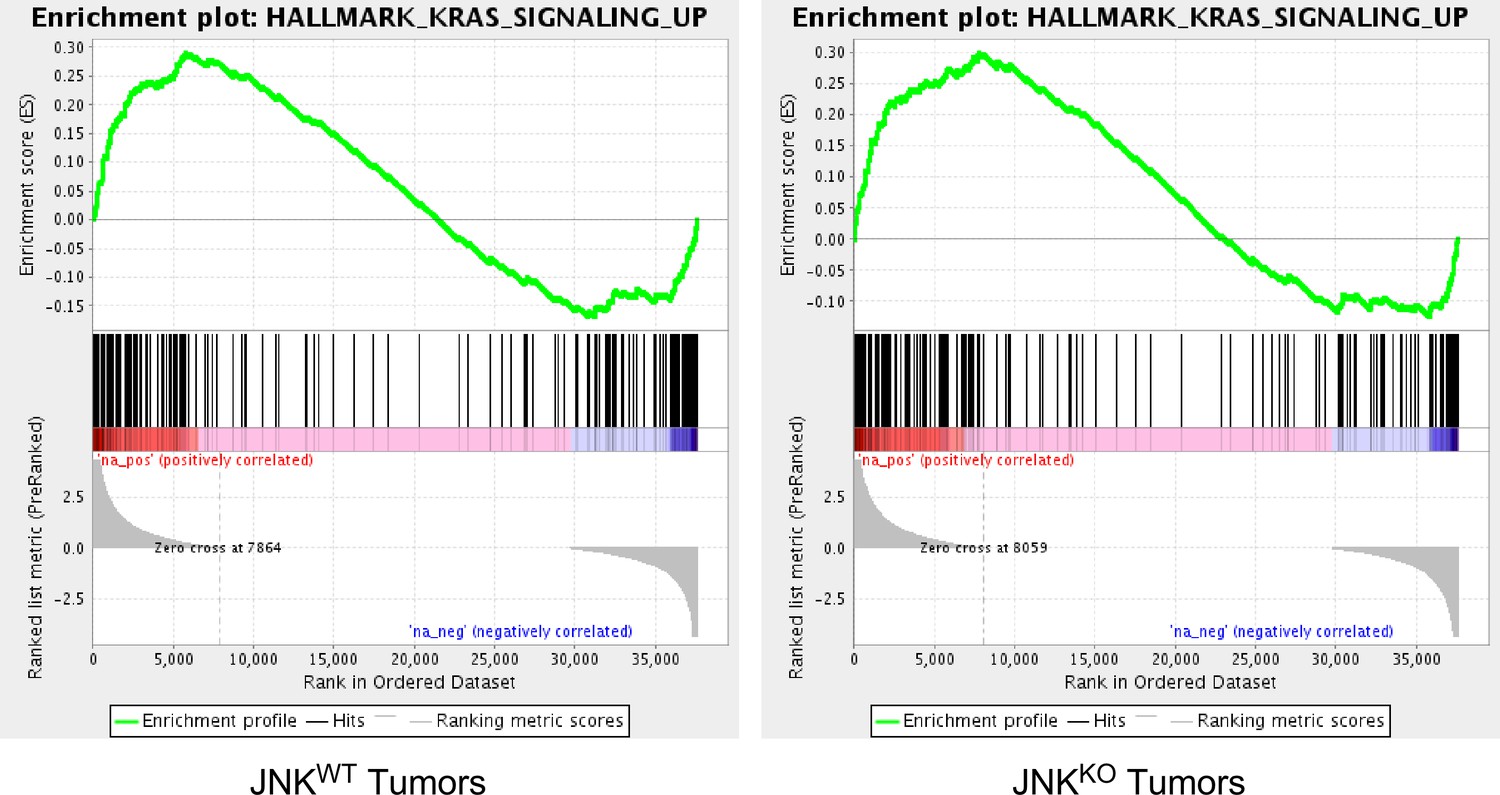
Gene set enrichment analysis demonstrates increased expression of a ‘KRAS Signaling’ gene signature in breast tumor cells.
GSEA plots of a ‘KRAS Signaling’ gene signature by JNKWT and JNKKO tumor cells compared with primary mammary epithelial cells (MEC) (p<0.01).
Figure 4 with 2 supplements
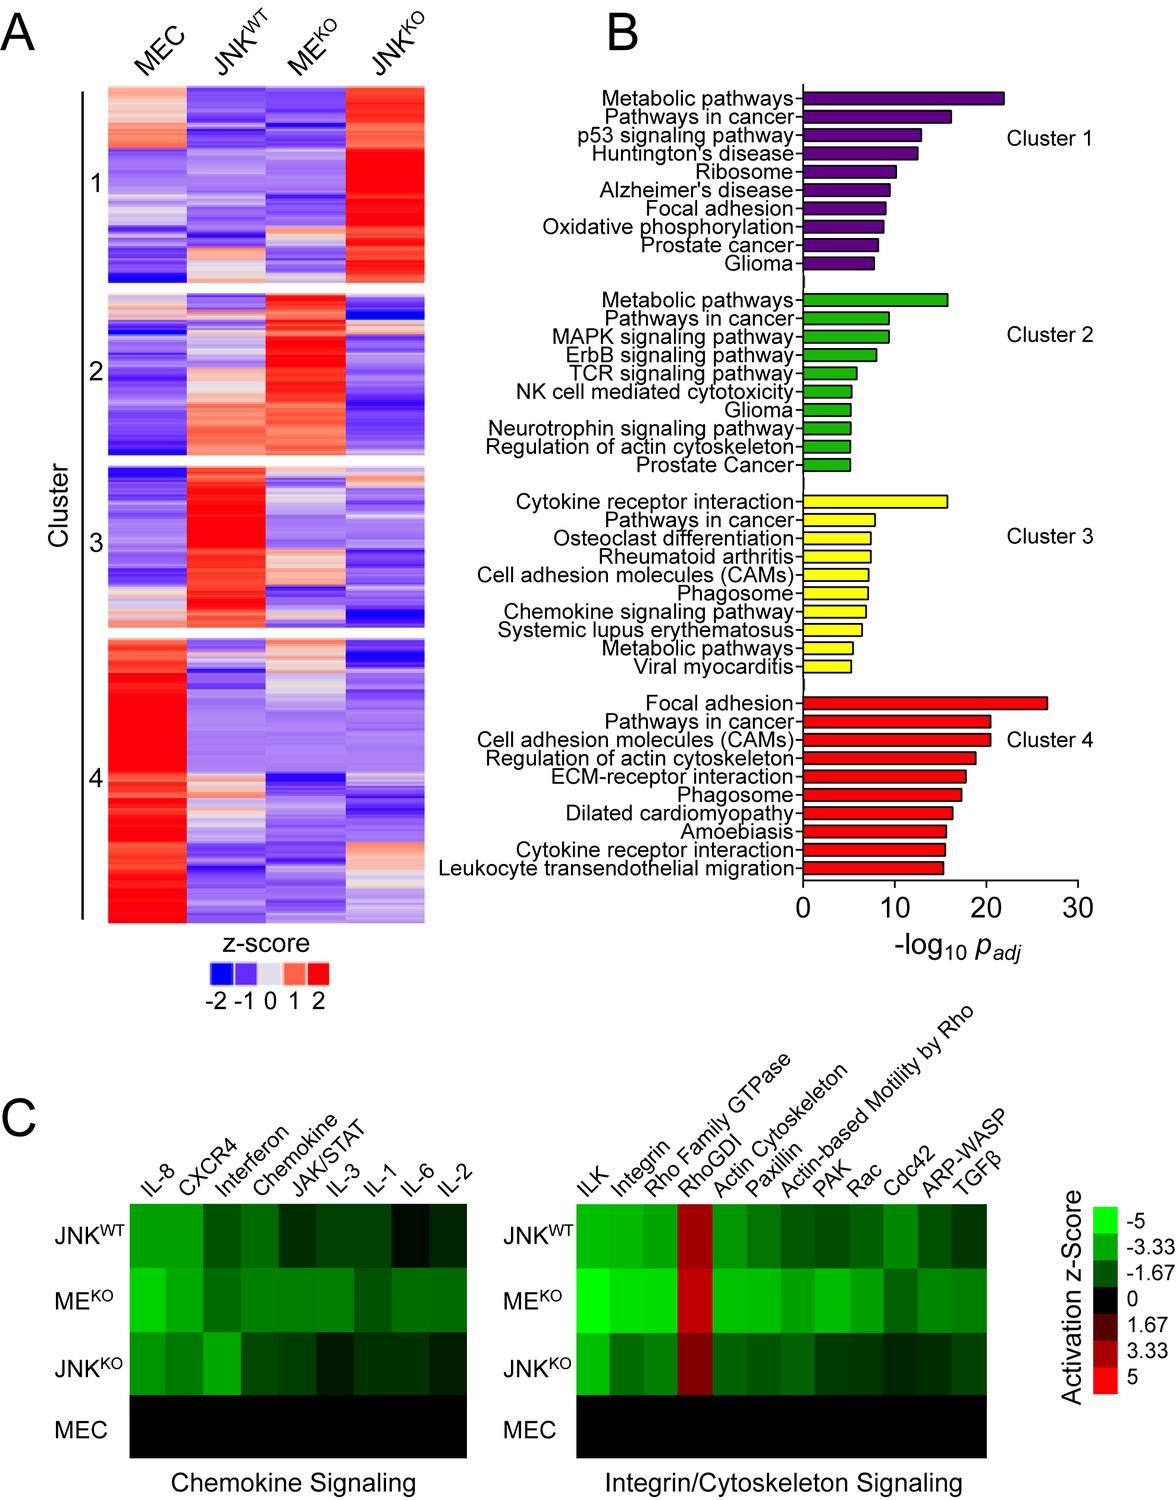
RNA-seq analysis demonstrates that a sub-set of tumor-associated gene expression requires JNK.
(A, B) RNA isolated from primary mammary epithelial cells (MEC, n = 3) and also JNKWT (n = 2), MEKO (n = 3), and JNKKO (n = 2) tumor cell lines was sequenced. The heatmap presents k-means clustering (k = 4) of genes differentially expressed in any of the pairwise comparisons (q < 0.05, |log2 Fold Change| > 0.75; mean) (A). Pathway over-representation analysis was performed on each of the four clusters using the KEGG database (B). The pathways with the lowest padj values for each cluster are presented. (C) Comparative analysis was performed on genes differentially expressed between MEC and the tumor cell lines using Ingenuity Pathway Analysis (IPA). Heatmaps show the predicted activation (Activation z-score) of canonical pathways involved in immune (left panel) and integrin/cytoskeleton (right panel) signaling (cutoff score = 1.31; equates to p=0.049 using Fisher’s Exact Test).
-
Figure 4—source data 1
Spreadsheet of source data for Figure 4.
- https://doi.org/10.7554/eLife.36389.020
Figure 4—figure supplement 1
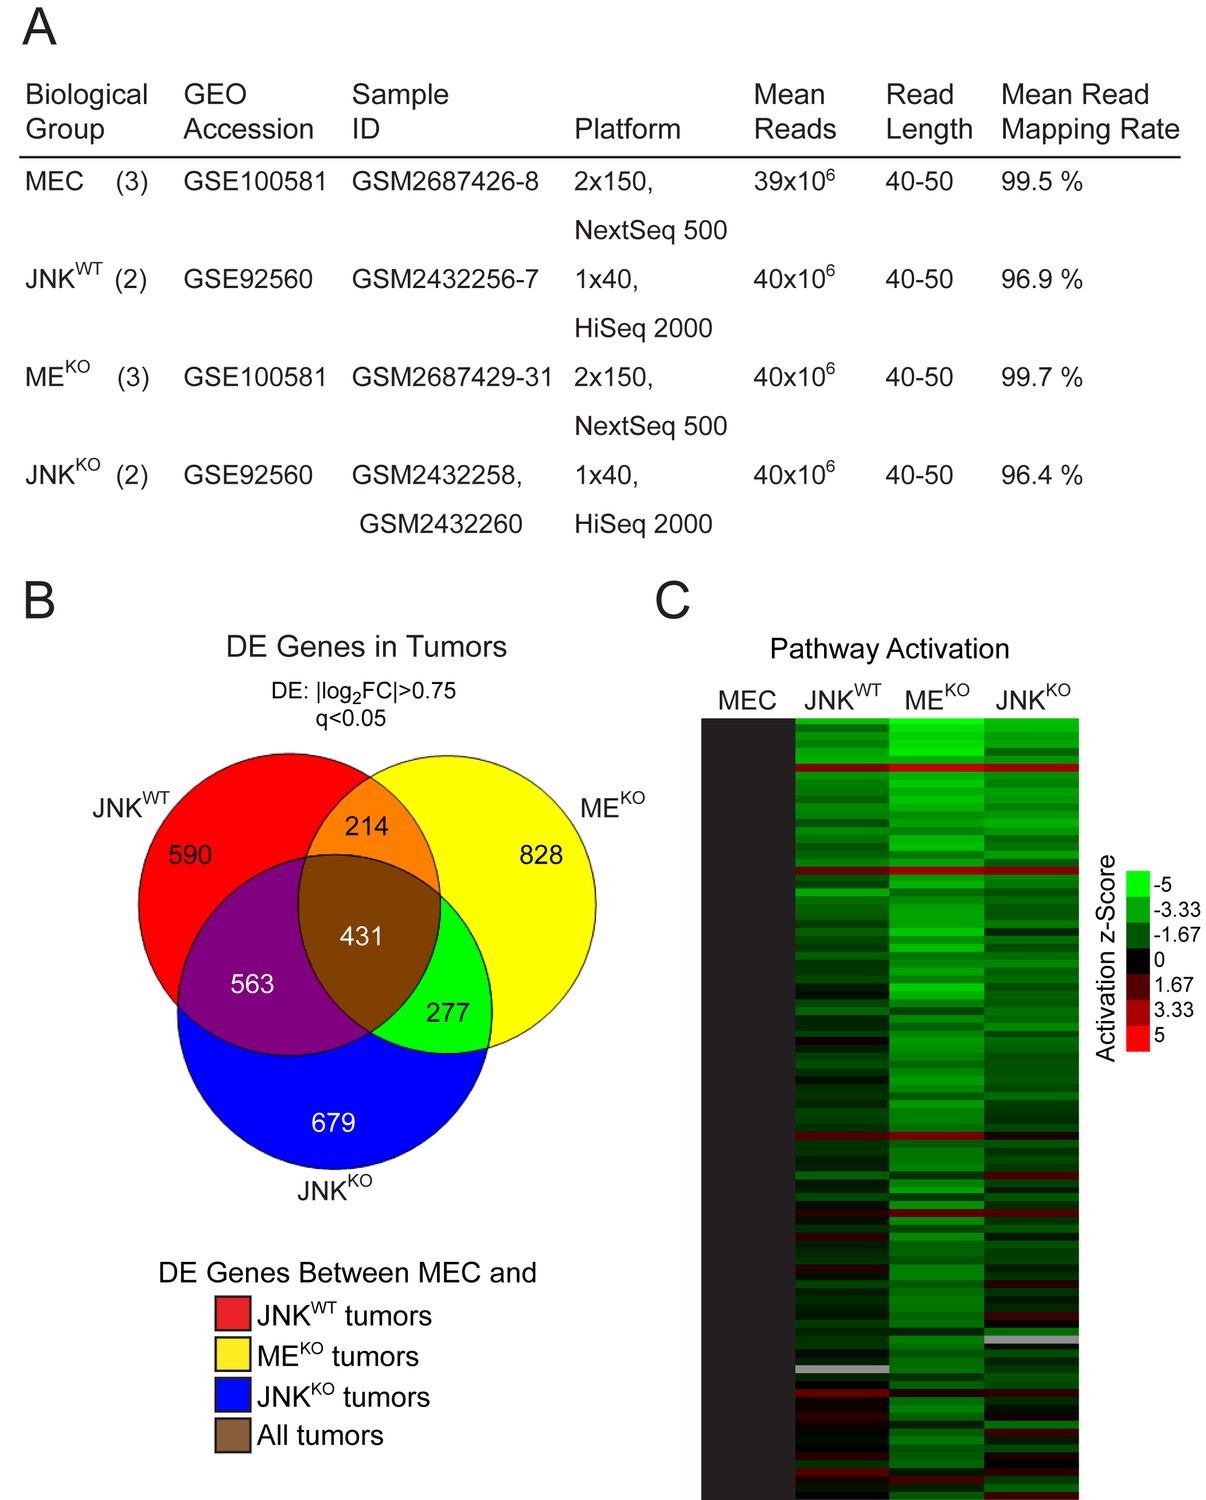
Gene expression analysis of control and JNK-deficient tumor cells.
(A) Summary of the RNA sequencing data together with database accession information (GEO accession numbers and Sample ID). The number of samples per biological group is shown in parentheses. (B) Venn diagram showing differentially expressed (DE) genes in JNKWT (n = 2), MEKO (n = 3), and JNKKO (n = 2) tumors compared to MEC (n = 3). (C) Ingenuity Pathway Analysis was used to predict pathway activation and inhibition in JNKWT (n = 2), MEKO (n = 3), and JNKKO (n = 2) tumor cells. The heatmap shows pathways ranked (top to bottom) by their score (total -log10p of Fisher’s Exact Test across the tumors). The top 100 pathways with lowest -log10p are shown. Coloring corresponds to the activation z-Score, with green representing inhibited pathways and red activated pathways. A cutoff of score = 1.31 was set (equates to p=0.049; Fisher’s Exact Test).
-
Figure 4—figure supplement 1—source data 1
Spreadsheet of source data for Figure 4—figure supplement 1.
- https://doi.org/10.7554/eLife.36389.021
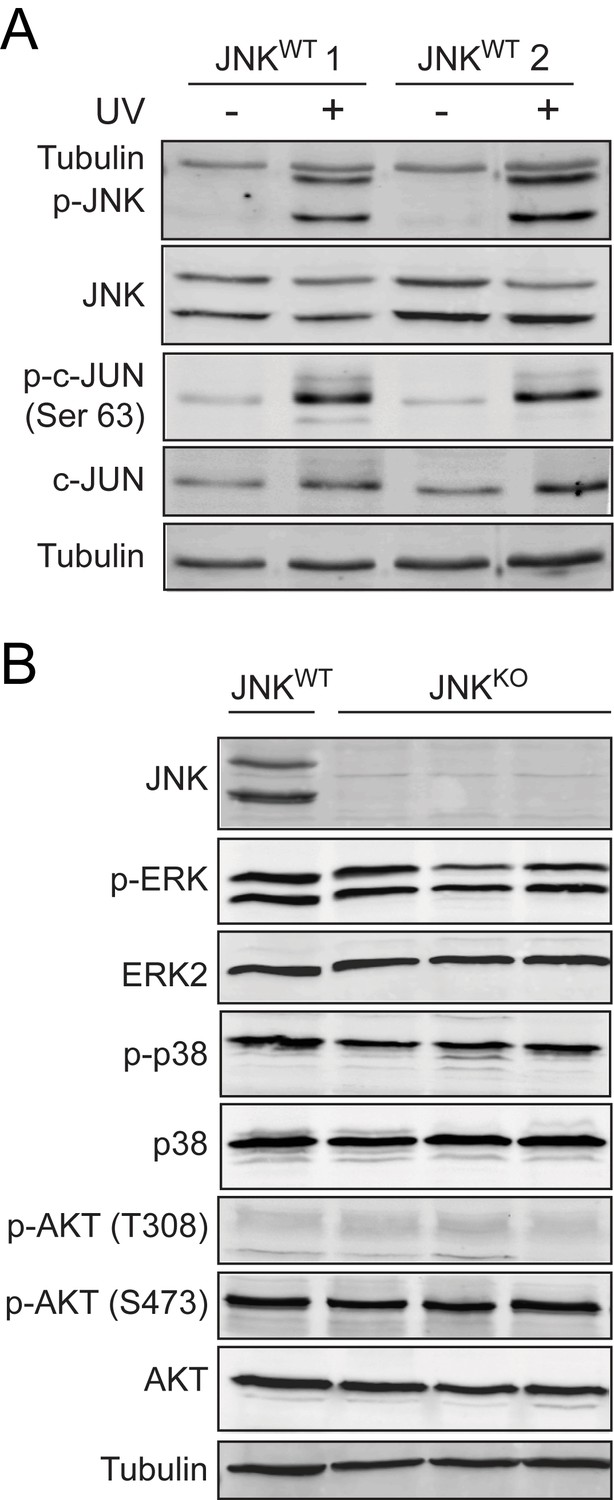
Figure 4—figure supplement 2
Comparison of signaling pathway activity in control and JNK-deficient tumor cells.
(A) Two independently-derived JNKWT tumor cell lines (JNKWT 1 and JNKWT 2) were left untreated (-) or were exposed (+) to 60 J/m2 ultraviolet light. Lysates from these cells were harvested at 30 min post-irradiation and were examined by immunoblot analysis by probing with antibodies to α-Tubulin, p-JNK, JNK, p-cJUN, and cJUN. (B) JNKWT (n = 2) and JNKKO (n = 6) tumor cell lines were cultured and protein lysates were prepared for immunoblot analysis. Lysates were probed for JNK, p-ERK, ERK2, p-p38, p38, p-AKT (T308), p-AKT (S473), AKT, and α-Tubulin. Representative blots showing one JNKWT cell line and three JNKKO cell lines are presented.
-
Figure 4—figure supplement 2—source data 1
Source image data for Figure 4—figure supplement 2A.
Whole immunoblot scans are presented and the region used to construct Figure 4—figure supplement 2A is outlined.
- https://doi.org/10.7554/eLife.36389.022
-
Figure 4—figure supplement 2—source data 2
Source image data for Figure 4—figure supplement 2B.
Whole immunoblot scans are presented and the region used to construct Figure 4—figure supplement 2B is outlined.
- https://doi.org/10.7554/eLife.36389.023
Figure 5 with 1 supplement
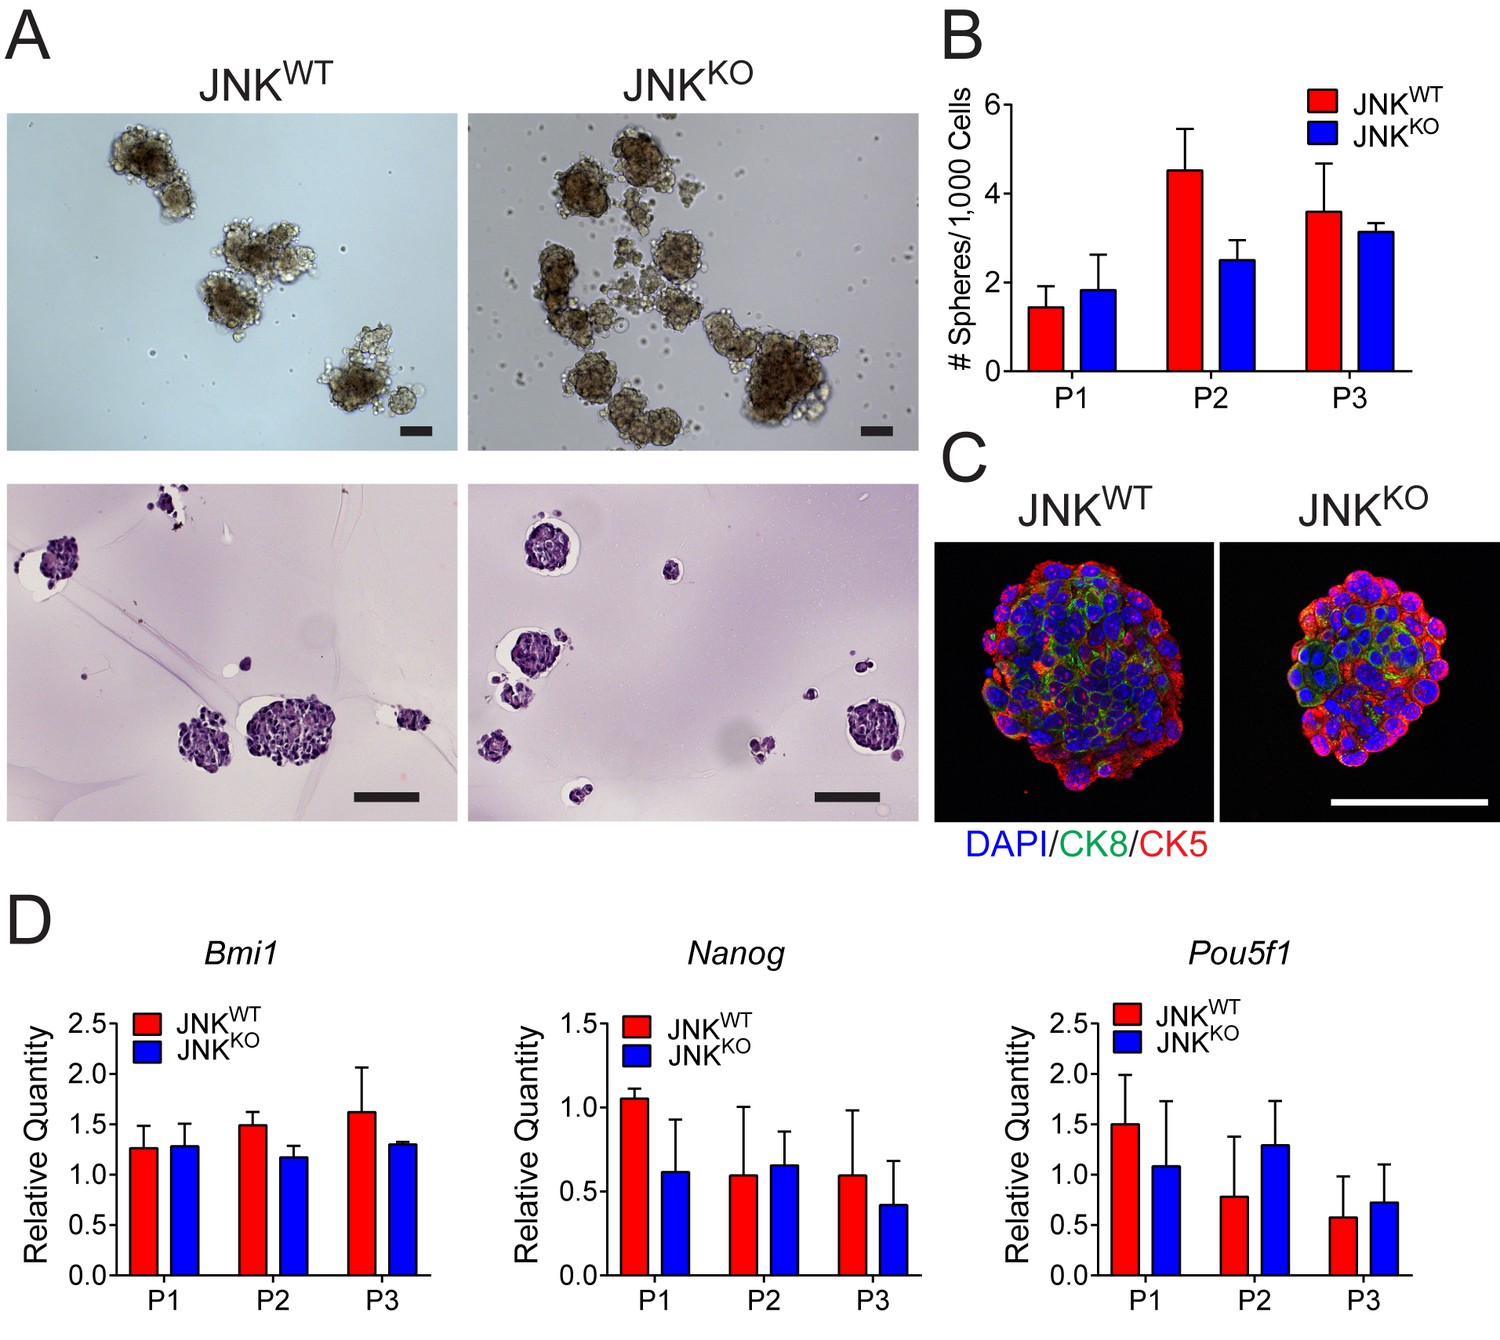
Stem cell populations are comparable in JNKWT and JNKKO tumor cells.
(A) JNKWT and JNKKO tumor cells formed mammospheres when grown in suspension. Two independent cell lines were tested for each genotype. Representative phase contrast (upper panel) and H and E-stained agarose-embedded sphere sections (lower panel) are presented. Representative images are presented. Scale bar = 100 µm. (B) The number of mammospheres formed per 1000 plated cells each passage (P) was quantitated for JNKWT and JNKKO tumor cells. Two independent cell lines were tested for each genotype. The data presented are the mean ± SEM (n = 3 independent experiments). No significant differences were observed (p>0.05). (C) Representative agarose-embedded mammosphere sections stained with antibodies to cytokeratin 5 (CK5, red) and cytokeratin 8 (CK8, green), and counterstained with DAPI are presented. Scale bar = 50 µm. (D) RNA was isolated from JNKWT and JNKKO tumor cell mammospheres at different passages to quantify mRNA expression of Bmi1, Nanog, and Pou5f1. Two independent cell lines were tested for each genotype. The data presented are the mean ± SEM (n = 2 independent experiments). No significant differences were observed (p>0.05).
-
Figure 5—source data 1
Spreadsheet of source data for Figure 5.
- https://doi.org/10.7554/eLife.36389.026
Figure 5—figure supplement 1
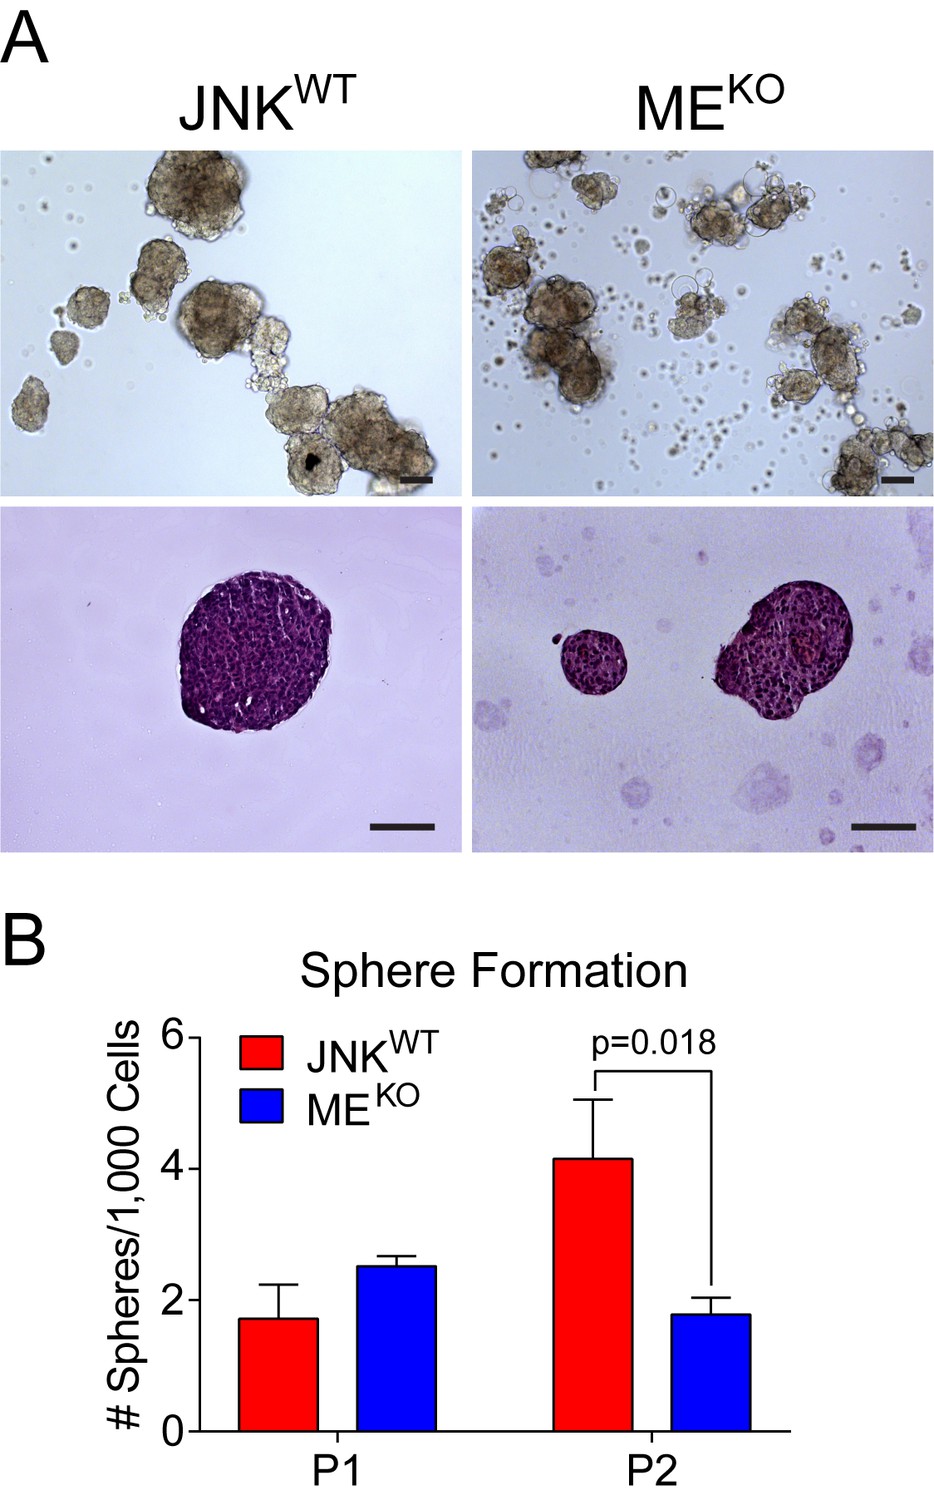
JNK-deficient tumor cells do not exhibit enhanced tumor stem cell activity.
(A) JNKWT (n = 2) and MEKO (n = 3) tumor cells grown in suspension formed mammospheres. Representative phase contrast (upper panel) and agarose-embedded H and E-stained sections (lower panel) are shown. Scale bar = 100 µm. (B) Sphere formation per 1000 tumor cells plated over two passages (P) was quantitated for two JNKWT cell lines and three MEKO cell lines (mean ± SEM; n = 3 independent experiments).
-
Figure 5—figure supplement 1—source data 1
Spreadsheet of source data for Figure 5—figure supplement 1B.
- https://doi.org/10.7554/eLife.36389.027
Figure 6
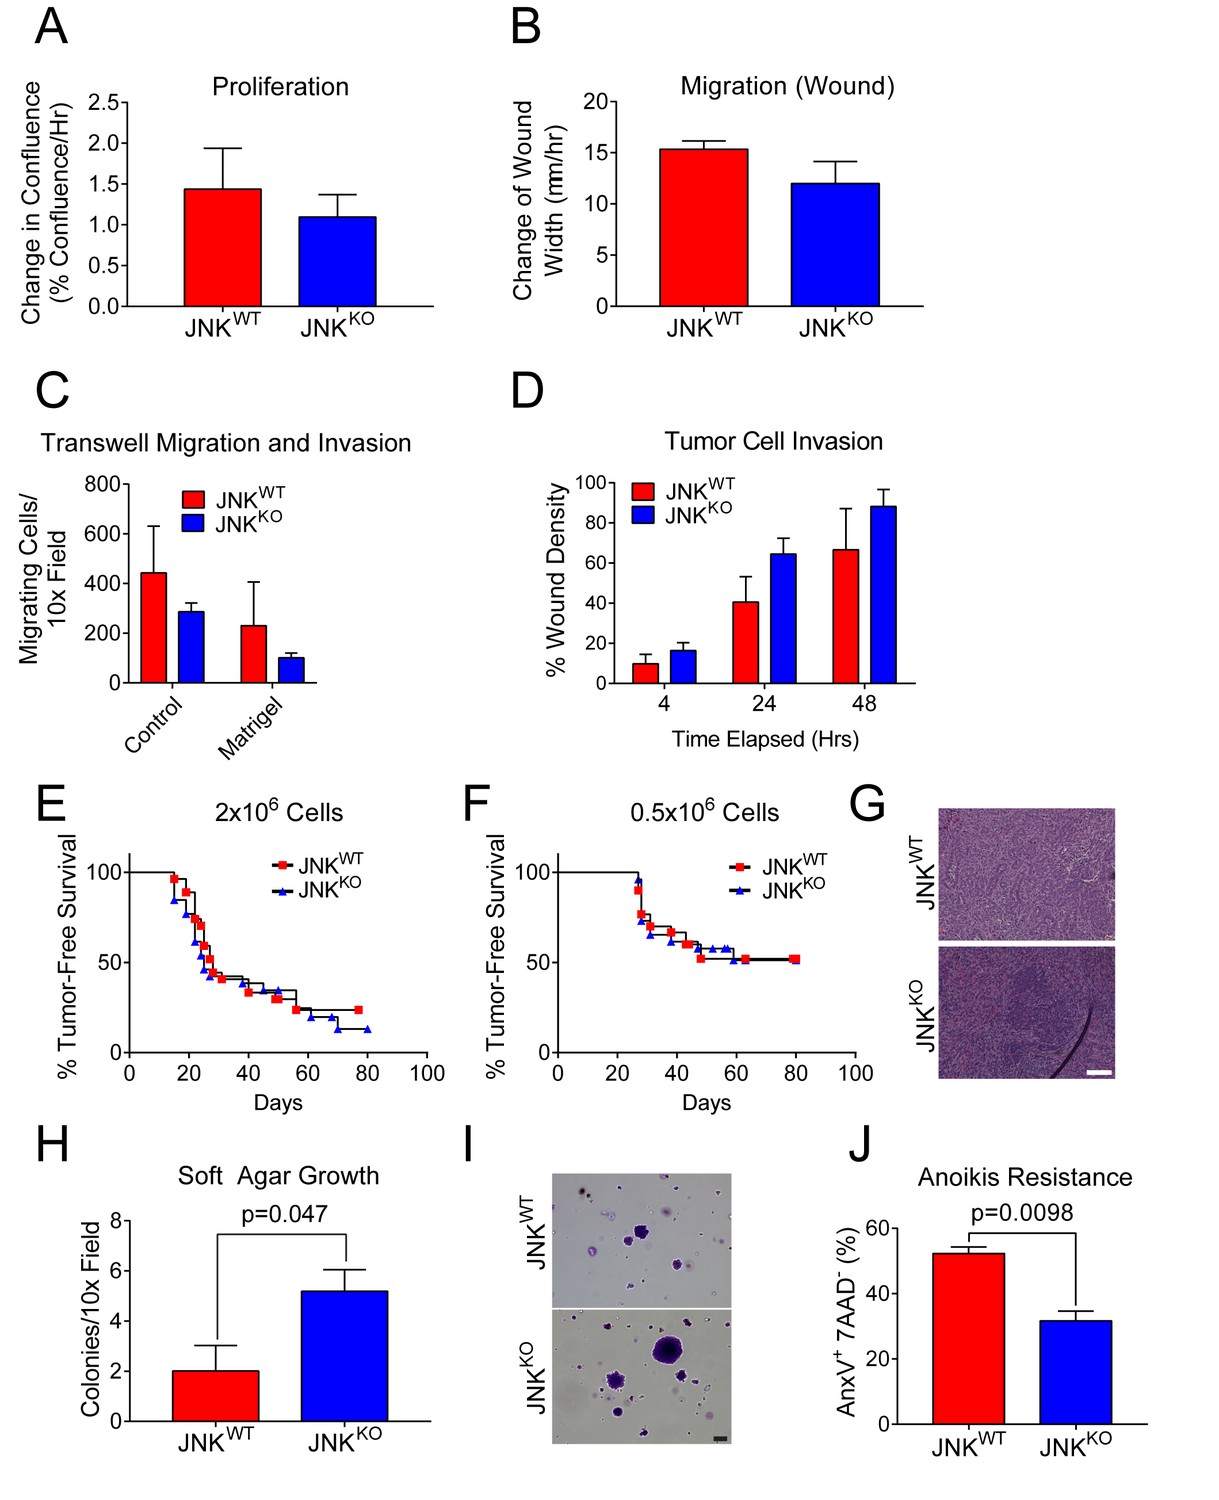
JNKWT and JNKKO tumor cells exhibit similar phenotypes.
(A) JNKWT (n = 2) and JNKKO (n = 6) tumor cell lines were cultured (8 hr) in growth media and the change in confluence was measured using an IncuCyte ZOOM (mean ± SEM). No significant differences (p>0.05) were observed. Similar data were obtained in four independent experiments. (B) Monolayers of JNKWT (n = 2) and JNKKO (n = 4) cells were wounded and cell migration rates were assessed by measuring the change in wound width 48 hr after wounding using an IncuCyte ZOOM (mean ± SEM). No significant differences (p>0.05) were observed. Similar data were obtained in two independent experiments. (C) JNKWT (n = 2) and JNKKO (n = 6) tumor cell chemotaxis in response to a serum gradient in the absence (Control) or presence of Matrigel was examined (mean ± SEM). No significant differences were observed (p>0.05). Similar data were obtained in two independent experiments. (D) Monolayers of JNKWT (n = 2) and JNKKO (n = 3) tumor cells were wounded, overlayed with 0.5 mg/ml collagen I in growth serum, and cultured for up to 48 hr in media containing 2% serum. Tumor cell migration into the collagen-filled wound was quantitated by measuring cell density in the initial wound area using an IncuCyte ZOOM (mean ± SEM). No significant differences were observed (p>0.05). Similar data were obtained in two independent experiments. (E–G) Orthotopic transplantation of JNKWT and JNKKO tumor cells (two independent cell lines per genotype) into the mammary fat pads of 26 (JNKWT) and 27 (JNKKO) syngeneic wild-type host mice was performed using 2 × 10⁶ tumor cells (E). Orthotopic transplantation of 0.5 × 10⁶ tumor cells was performed using 30 (JNKWT) and 26 (JNKKO) syngeneic wild-type host mice (F). No significant differences were observed (p>0.05). Representative H and E-stained tumor sections from JNKWT (upper panel) and JNKKO (lower panel) tumors are presented (G). Scale bar = 100 µm. (H, I) JNKWT (n = 2) and JNKKO (n = 4) tumor cell lines were cultured in soft agar and colony formation was quantitated (mean ± SEM) (H). Similar data were obtained from two independent experiments and representative images of crystal violet-stained colonies are presented (I). Scale bar = 100 µm. (J) Two JNKWT and five JNKKO tumor cell lines were cultured in suspension (24 hr) and apoptotic cells (7AAD- annexin V+) were quantitated by flow cytometry (mean ± SEM; n = 7 for JNKWT and n = 16 for JNKKO).
-
Figure 6—source data 1
Spreadsheet of source data for Figure 6.
- https://doi.org/10.7554/eLife.36389.029
Figure 7

JNK deficiency promotes early disease lesions.
(A) Eighteen weeks after gene deletion, tissue sections were prepared from mammary glands of JNKWT (n = 5) and JNKKO (n = 12) female mice. The mice were not matched for estrus cycle. Representative H and E-stained sections are presented. Scale bar = 100 µm. (B, C) Proliferation was examined in mammary glands at 18 weeks after gene ablation by staining tissue sections with an antibody to PCNA (JNKWT n = 4 mice, JNKKO n = 5 mice). Representative PCNA-stained and DAPI counter-stained glands are presented (B, Scale bar = 50 µm). The percent of PCNA+ cells was quantified (mean ± SEM) (C).
-
Figure 7—source data 1
Spreadsheet of source data for Figure 7.
- https://doi.org/10.7554/eLife.36389.031
Author response image 1

Mammospheres prepared from Control (left panel) and JNK-deficient (right panel) tumor cells were embedded in paraffin, sectioned, and stained with DAPI and an antibody to β-catenin.
We found that β-catenin was restricted to the cytoplasm of Control tumor cells, but β-catenin was detected in both the nucleus and cytoplasm of JNK-deficient tumor cells.
Additional files
-
Transparent reporting form
- https://doi.org/10.7554/eLife.36389.032
Download links
A two-part list of links to download the article, or parts of the article, in various formats.
Downloads (link to download the article as PDF)
Open citations (links to open the citations from this article in various online reference manager services)
Cite this article (links to download the citations from this article in formats compatible with various reference manager tools)
The cJUN NH2-terminal kinase (JNK) signaling pathway promotes genome stability and prevents tumor initiation
eLife 7:e36389.
https://doi.org/10.7554/eLife.36389


