The Aquilegia genome provides insight into adaptive radiation and reveals an extraordinarily polymorphic chromosome with a unique history
- Vienna BioCenter, Austria
- University of California, United States
- Masaryk University, Czech Republic
- Vienna Graduate School of Population Genetics, Austria
- Joint Genome Institute, United States
- HudsonAlpha Institute of Biotechnology, United States
- Centre of the Region Haná for Biotechnological and Agricultural Research, Czech Republic
- Harvard University, United States
Figures
Figure 1 with 1 supplement

Distribution of Aquilegia species.
There are ~70 species in the genus Aquilegia, broadly distributed across temperate regions of the Northern Hemisphere (grey). The 10 Aquilegia species sequenced here were chosen as representatives spanning this geographic distribution as well as the diversity in ecological habitat and pollinator-influenced floral morphology of the genus. Semiaquilegia adoxoides, generally thought to be the sister taxon to Aquilegia (Fior et al., 2013), was also sequenced. A representative photo of each species is shown and is linked to its approximate distribution.
Figure 1—figure supplement 1
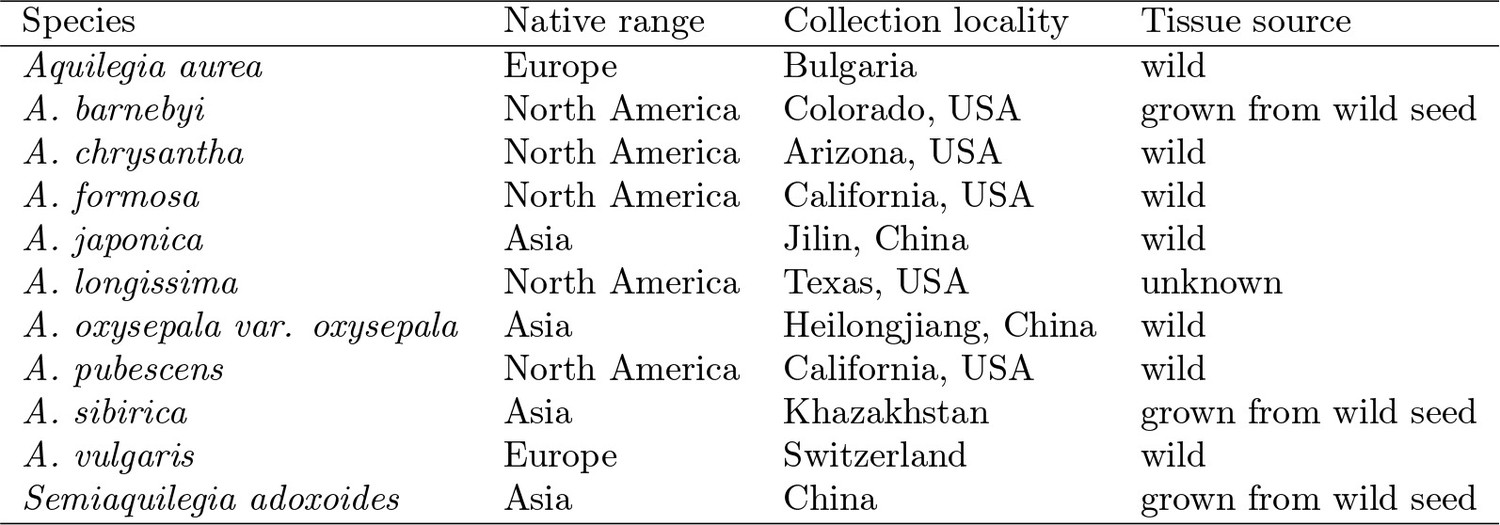
Origin of species samples used for sequencing.
https://doi.org/10.7554/eLife.36426.003
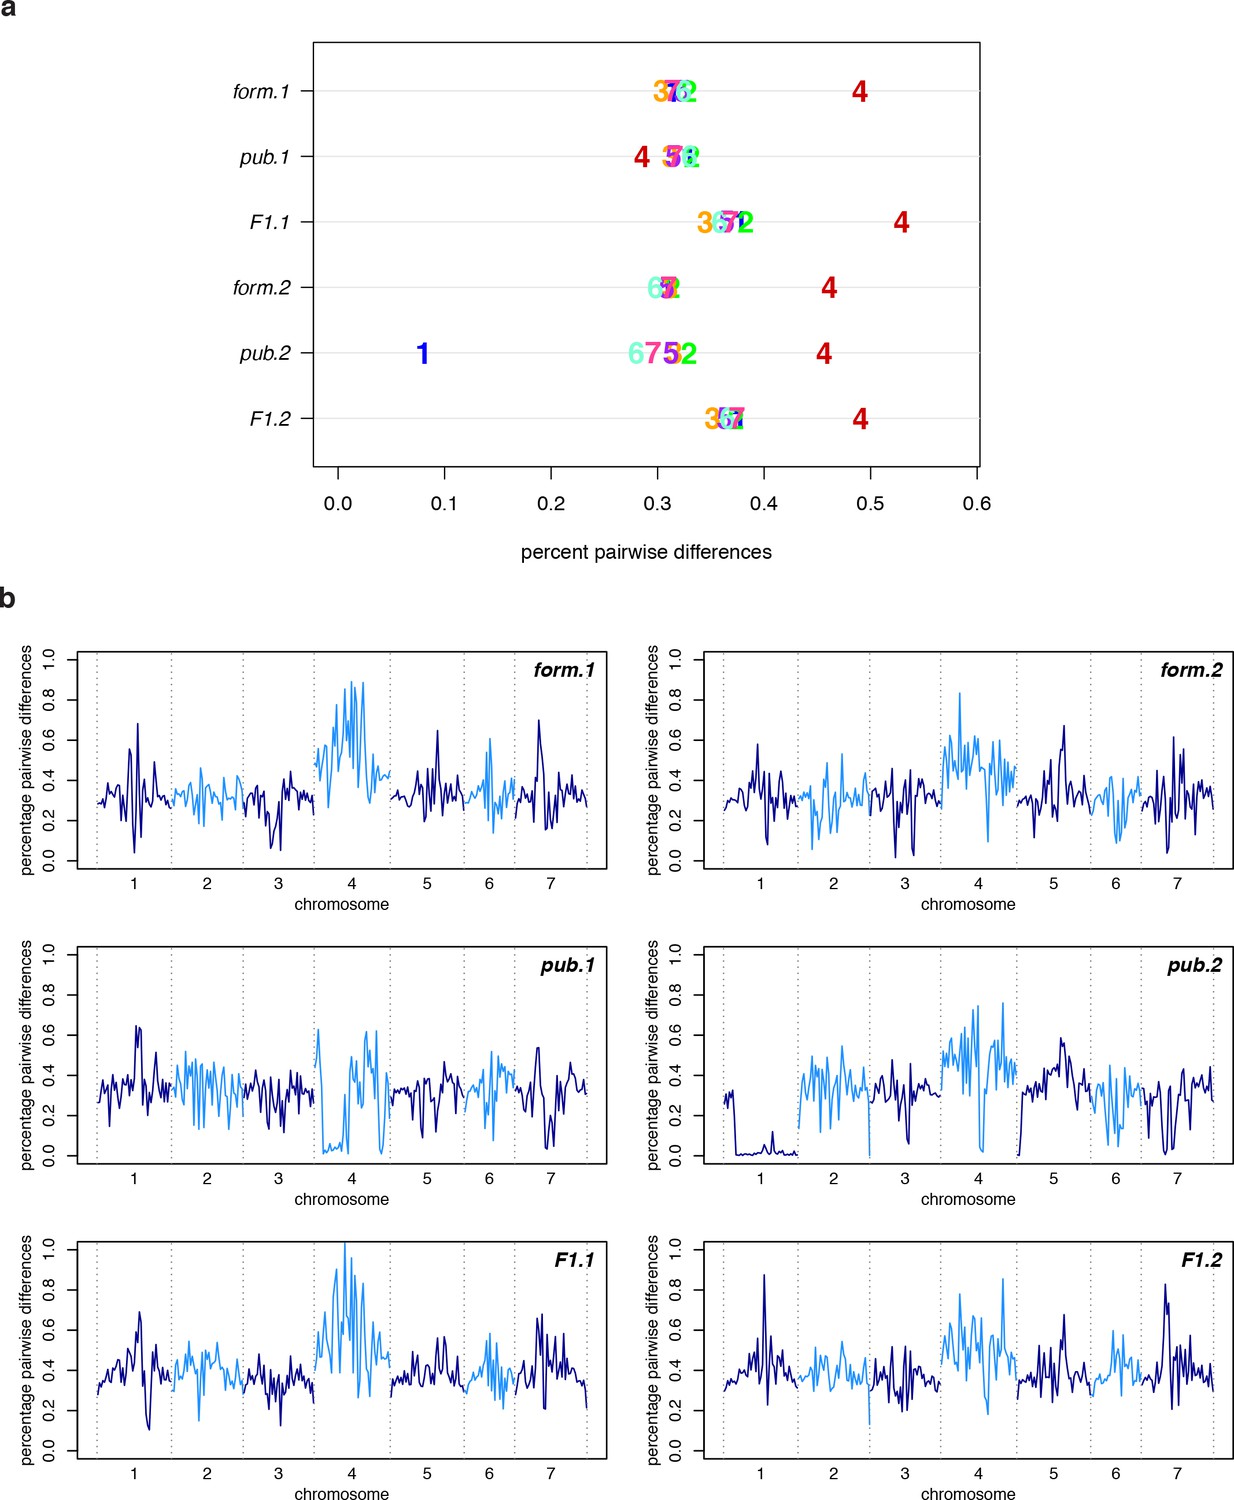
Figure 2 with 2 supplements

Polymorphism and divergence in Aquilegia.
(a) The percentage of pairwise differences within each species (estimated from individual heterozygosity) and between species (divergence). values between geographic regions are given on the lower half of the pairwise differences heatmap. Both heatmap axes are ordered according to the neighbor joining tree to the left. This tree was constructed from a concatenated data set of reliably-called genomic positions. (b) Polymorphism within each sample by chromosome. Per-chromosome values are indicated by the chromosome number.
Figure 2—figure supplement 1
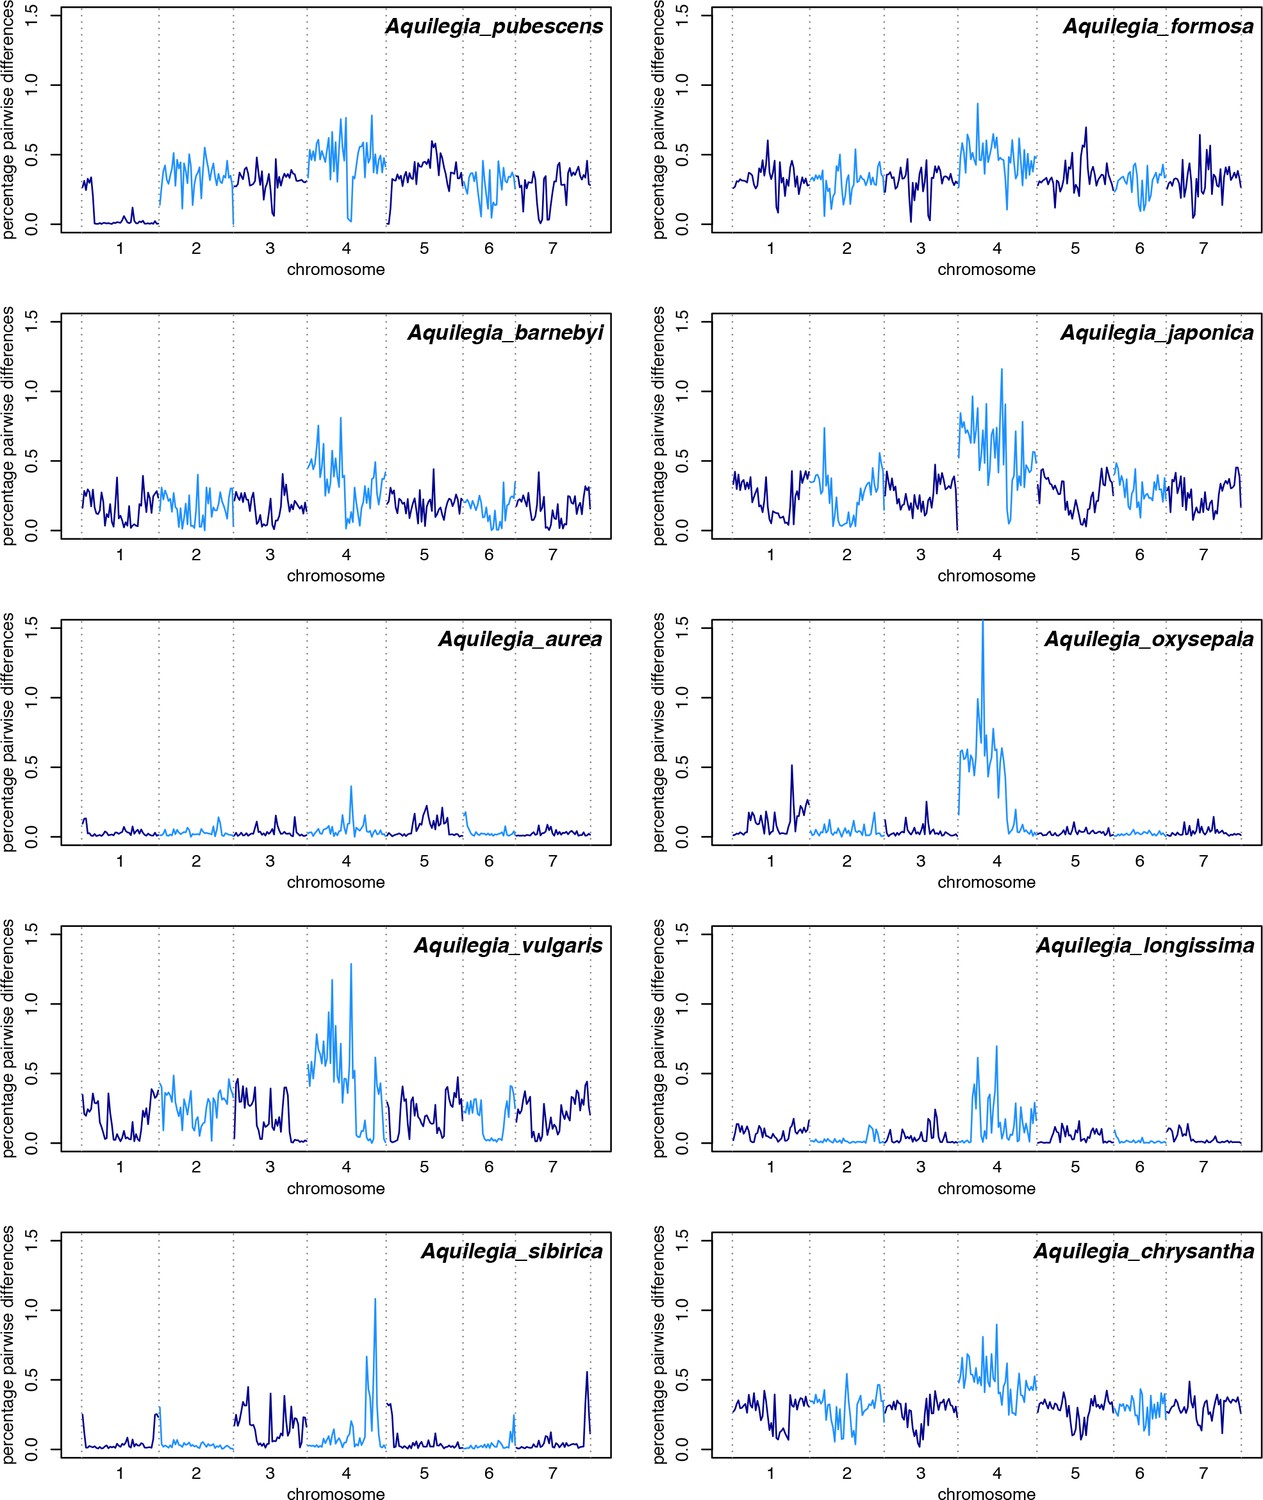
Polymorphism across the genome in all ten species samples.
https://doi.org/10.7554/eLife.36426.005
Figure 2—figure supplement 2
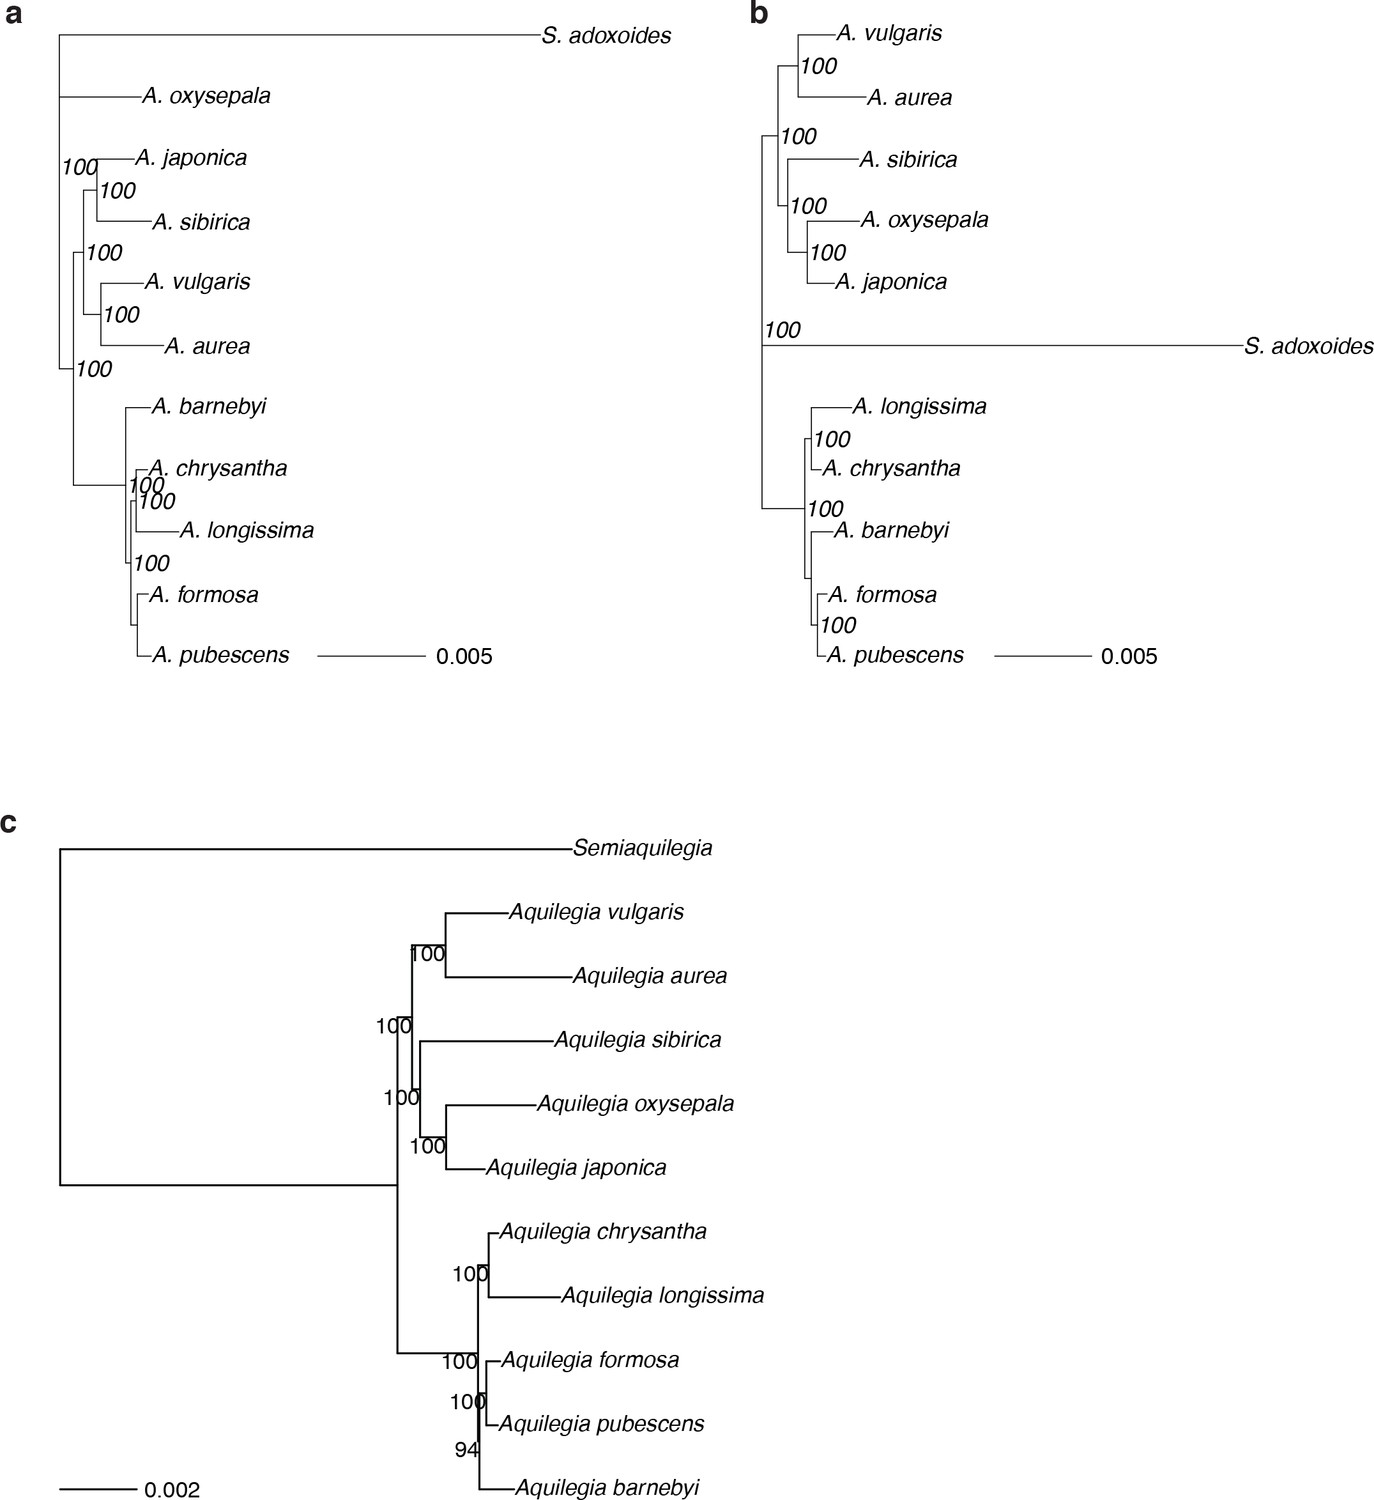
Species and chromosome trees of Aquilegia.
https://doi.org/10.7554/eLife.36426.006
Figure 3 with 3 supplements
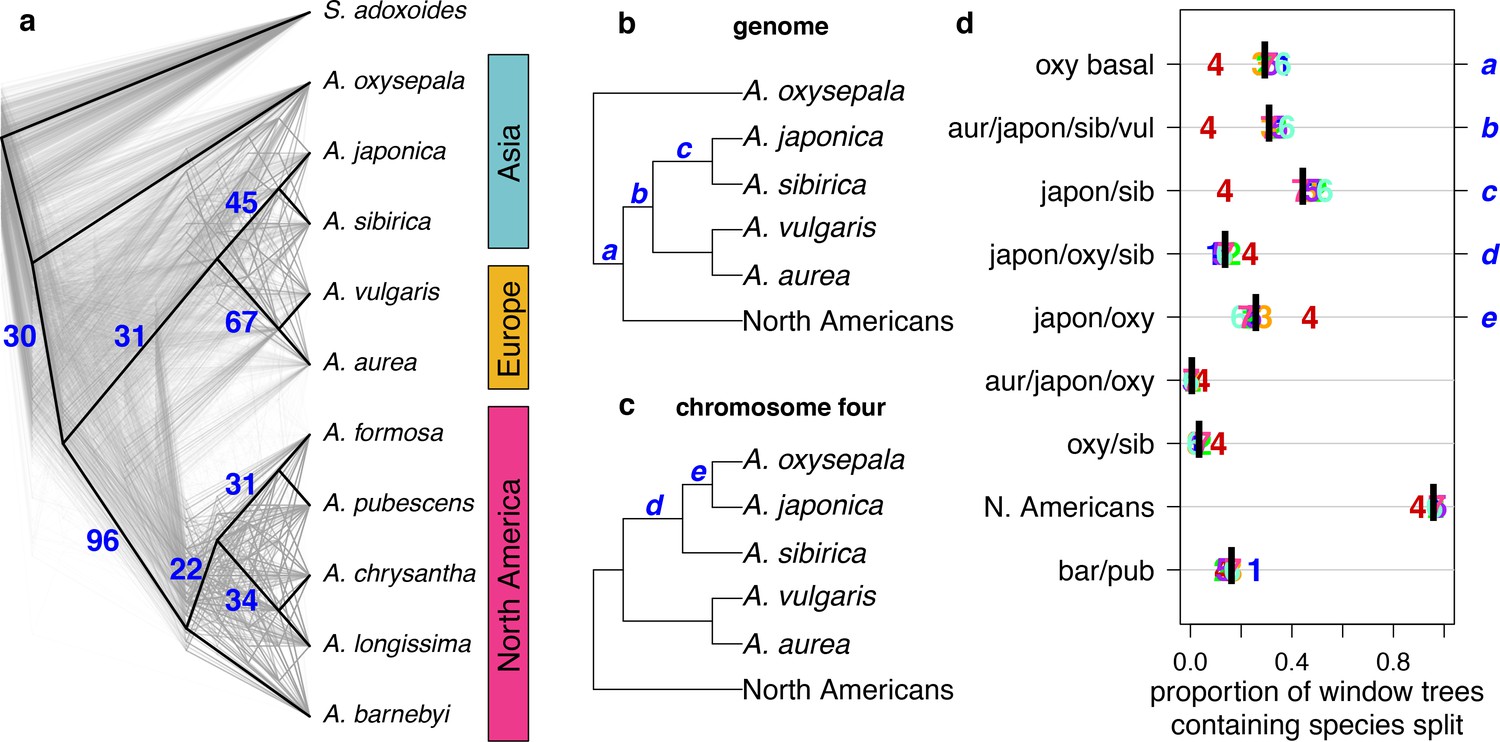
Discordance between gene and species trees.
(a) Cloudogram of neighbor joining (NJ) trees constructed in 100 kb windows across the genome. The topology of each window-based tree is co-plotted in grey and the whole genome NJ tree shown in Figure 2a is superimposed in black. Blue numbers indicate the percentage of window trees that contain each of the subtrees observed in the whole genome tree. (b) Genome NJ tree topology. Blue letters a-c on the tree denote subtrees a-c in panel (d). (c) Chromosome four NJ tree topology. Blue letters d and e on the tree denote subtrees d and e in panel (d). (d) Prevalence of each subtree that varied significantly by chromosome. Genomic (black bar) and per chromosome (chromosome number) values are given.
Figure 3—figure supplement 1
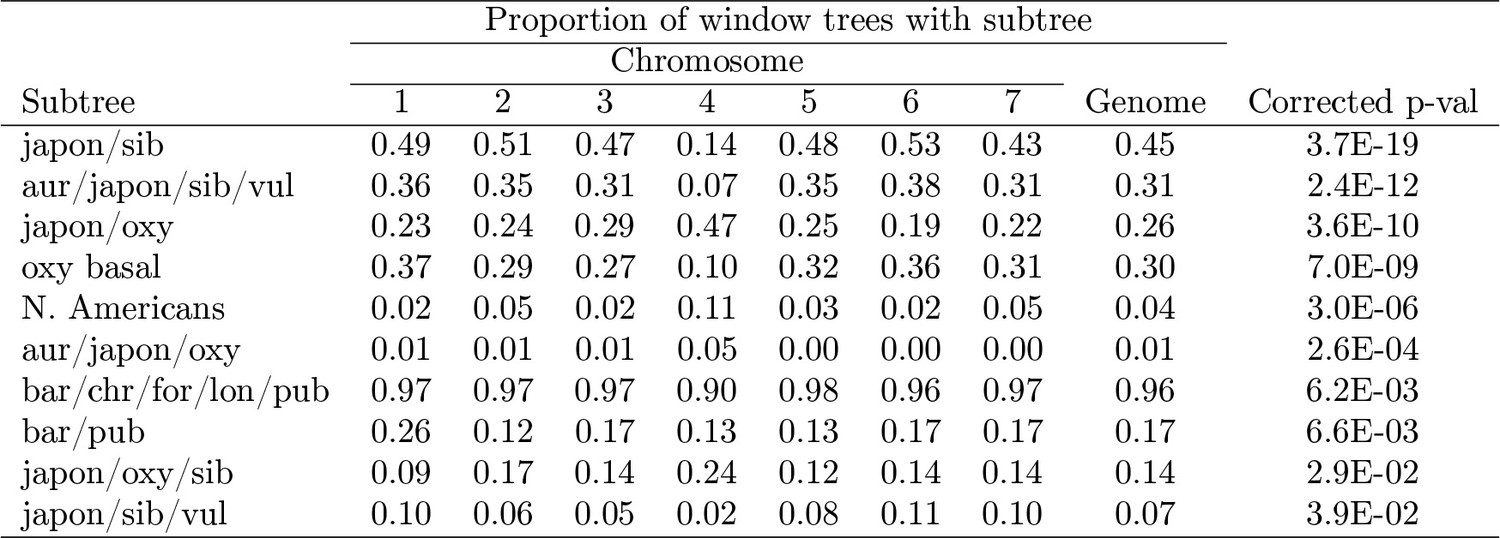
Proportion of significantly-varying subtrees by chromosome.
https://doi.org/10.7554/eLife.36426.008
Figure 3—figure supplement 2
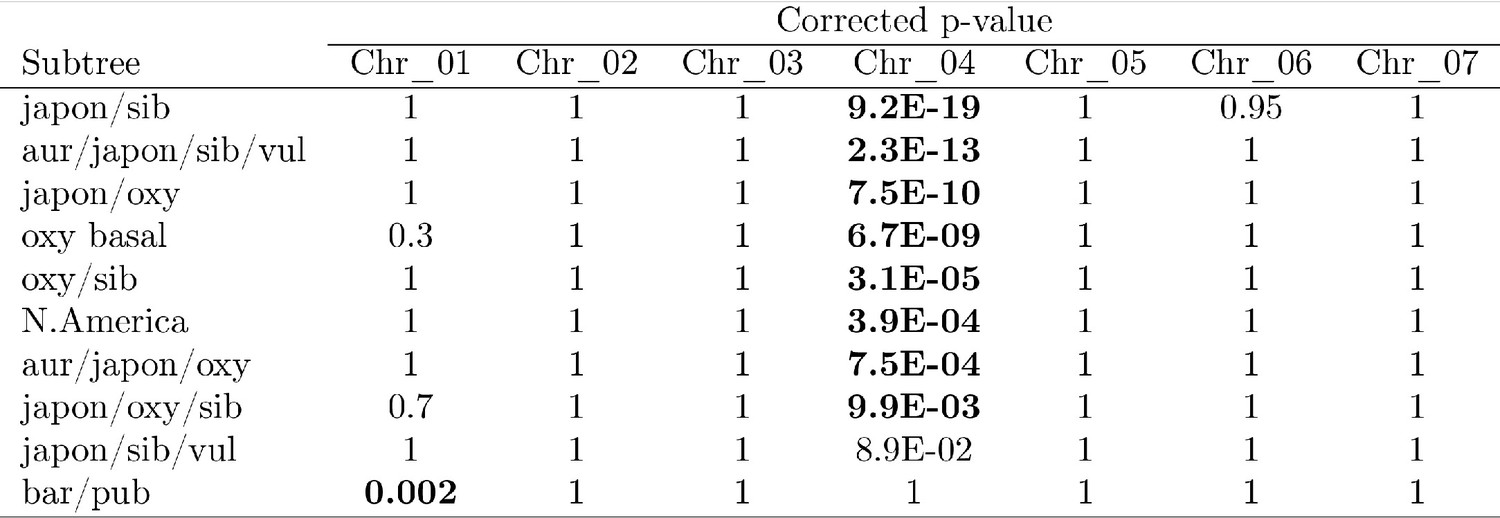
P-values of proportion tests by chromosome for significantly-different trees.
https://doi.org/10.7554/eLife.36426.009
Figure 3—figure supplement 3
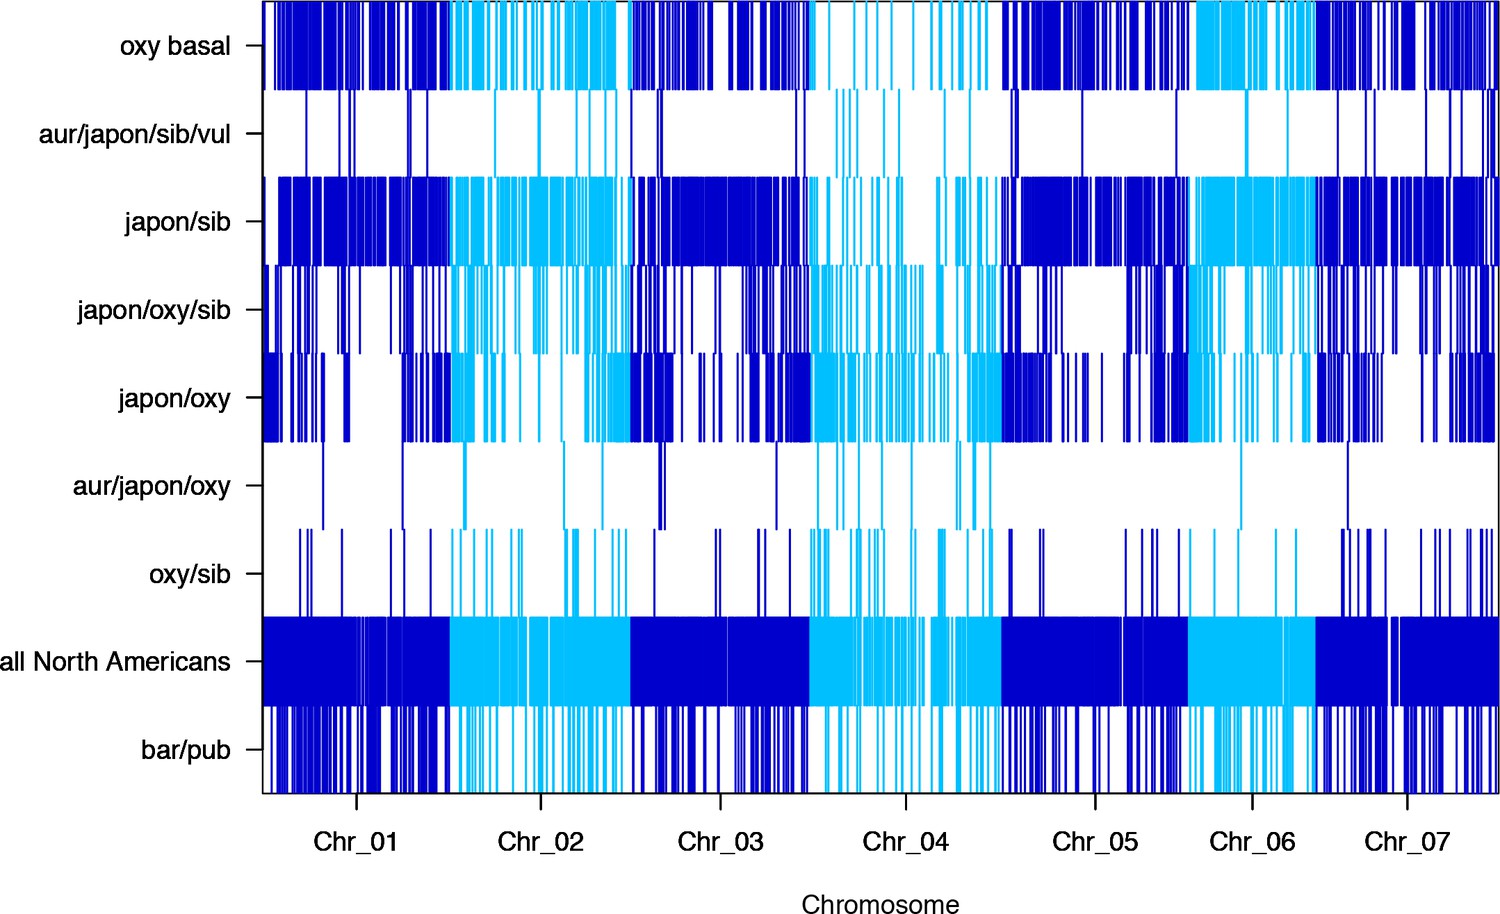
Subtree prevalence across chromosomes for the nine significantly-different subtrees.
https://doi.org/10.7554/eLife.36426.010
Figure 4 with 1 supplement
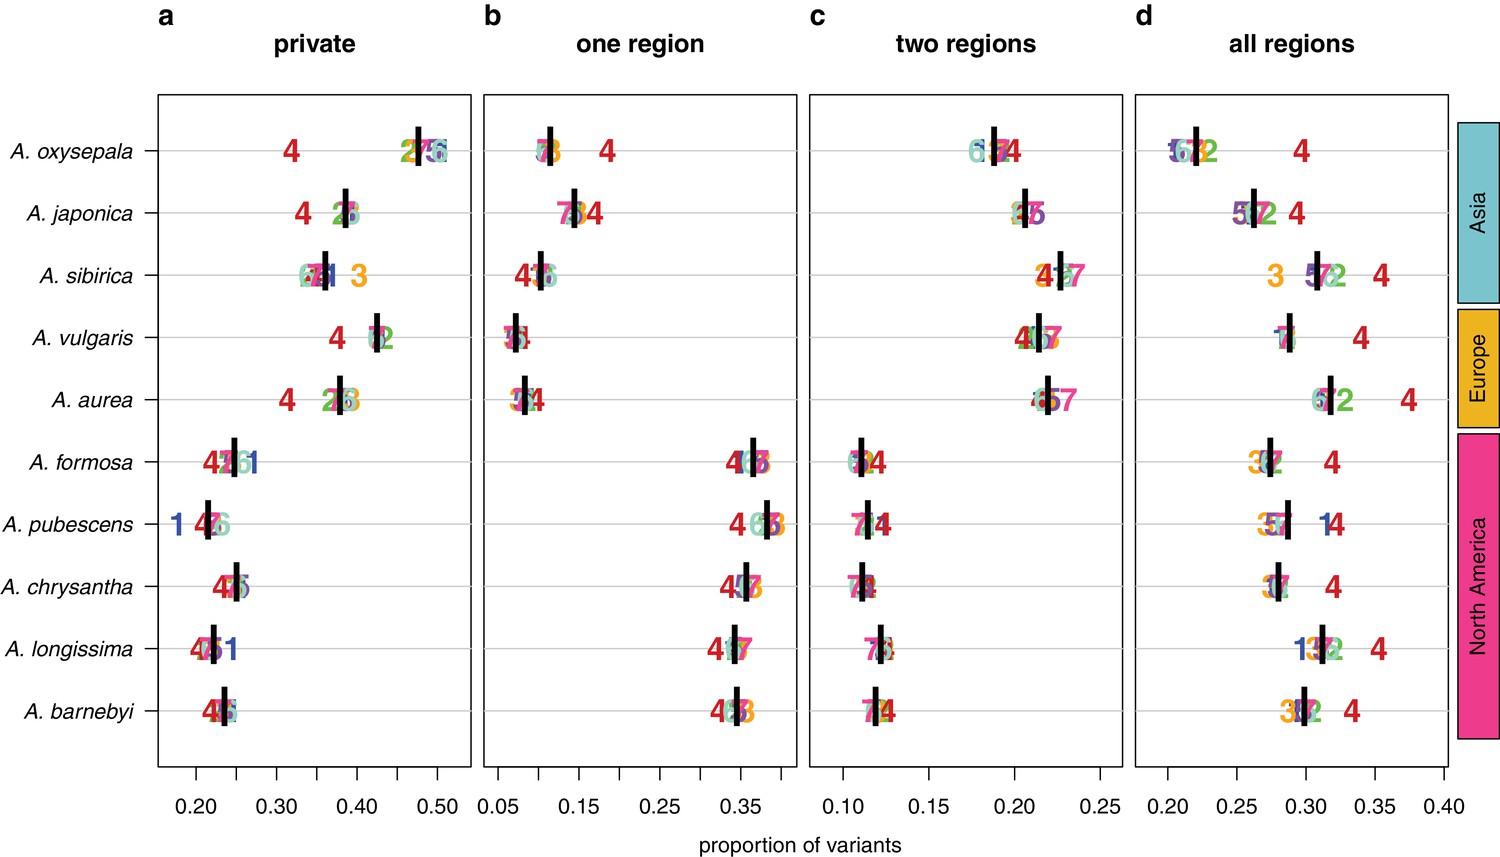
Sharing patterns of derived polymorphisms.
Proportion of derived variants (a) private to an individual species, (b) shared within the geographic region of origin, (c) shared across two geographic regions, and (d) shared across all three geographic regions. Genomic (black bar) and chromosome (chromosome number) values, for all 10 species.
Figure 4—figure supplement 1
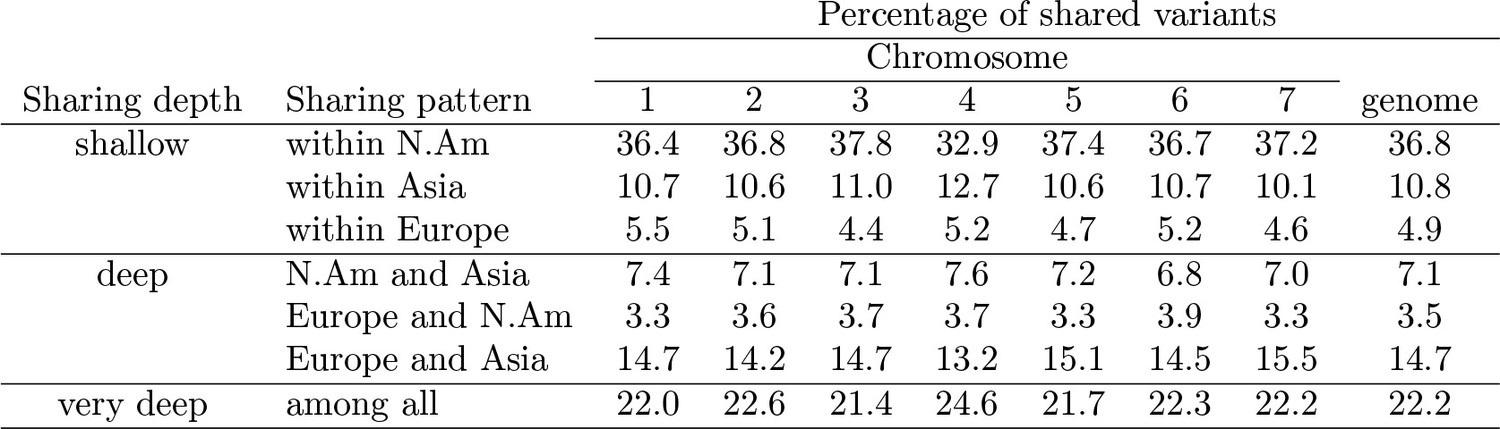
Sharing pattern percentages by pattern type.
https://doi.org/10.7554/eLife.36426.012
Figure 5
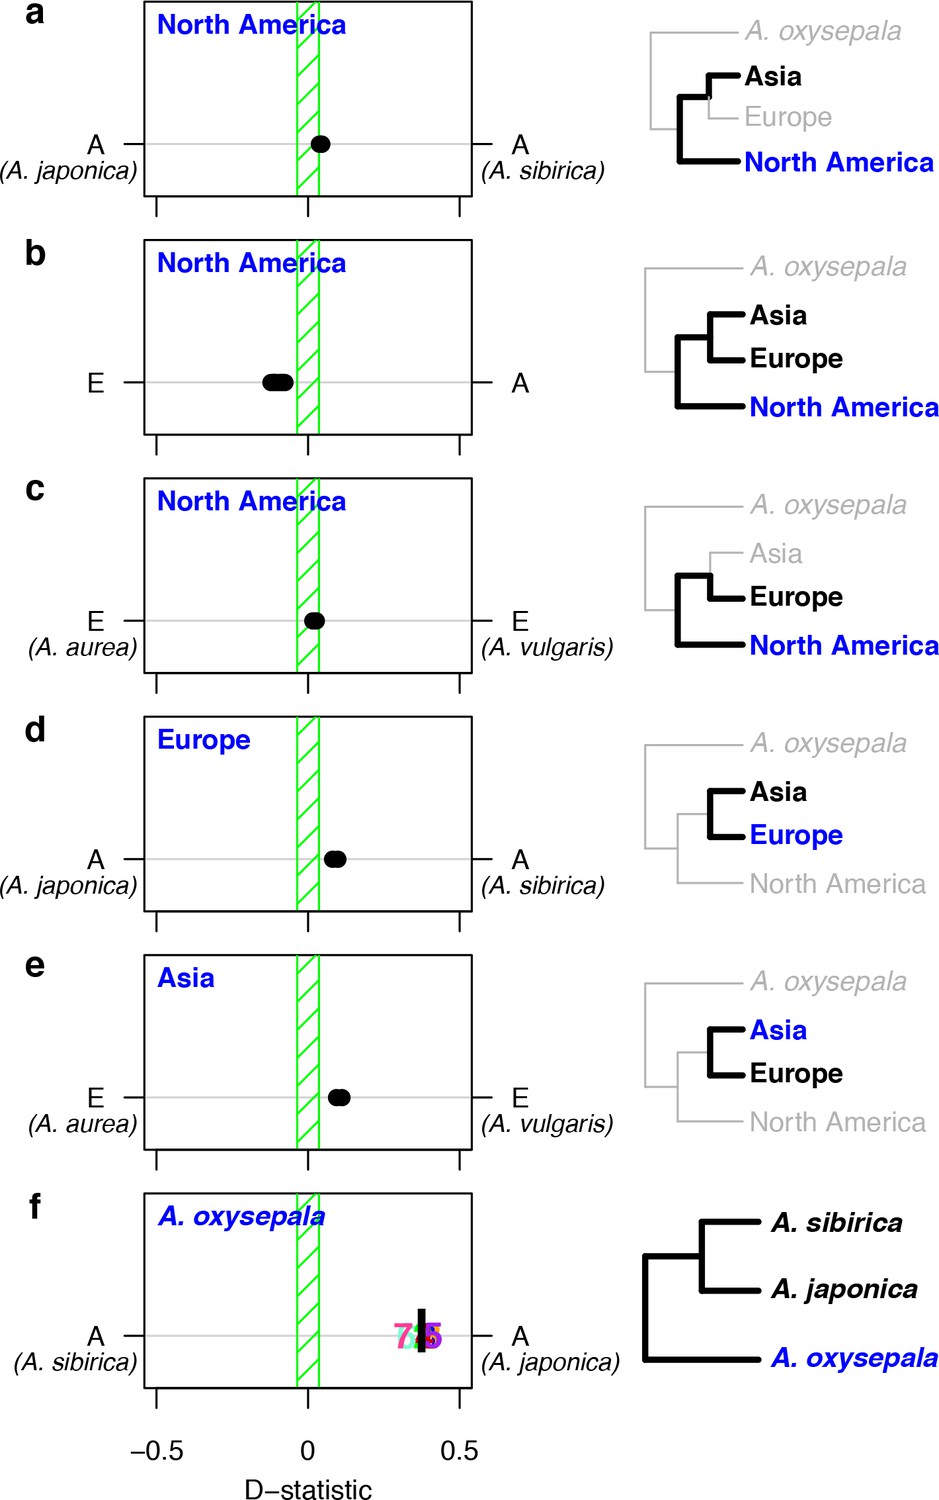
D statistics demonstrate gene flow during Aquilegia speciation.
D statistics for tests with (a–c) all North American species, (d) both European species, (e) Asian species other than A. oxysepala, and (f) A. oxysepala as H3 species. All tests use S. adoxoides as the outgroup. D statistics outside the green shaded areas are significantly different from zero. In (a–e), each individual dot represents the D statistic for a test done with a unique species combination. In (f), D statistics are presented by chromosome (chromosome number) or by the genome-wide value (black bar). In all panels, E = European and A = Asian without A. oxysepala. In some cases, individual species names are given when the geographical region designation consists of a single species. Right hand panels are a graphical representation of the D statistic tests in the corresponding left hand panels. Trees are a simplified version of the genome tree topology (Figure 2b), in which the bold sub tree(s) represent the bifurcation considered in each set of tests. H3 species are noted in blue while the H1 and H2 species are specified in black. (Figure 5—source data 1).
-
Figure 5—source data 1
(D statistics).
- https://doi.org/10.7554/eLife.36426.014
Figure 6 with 2 supplements
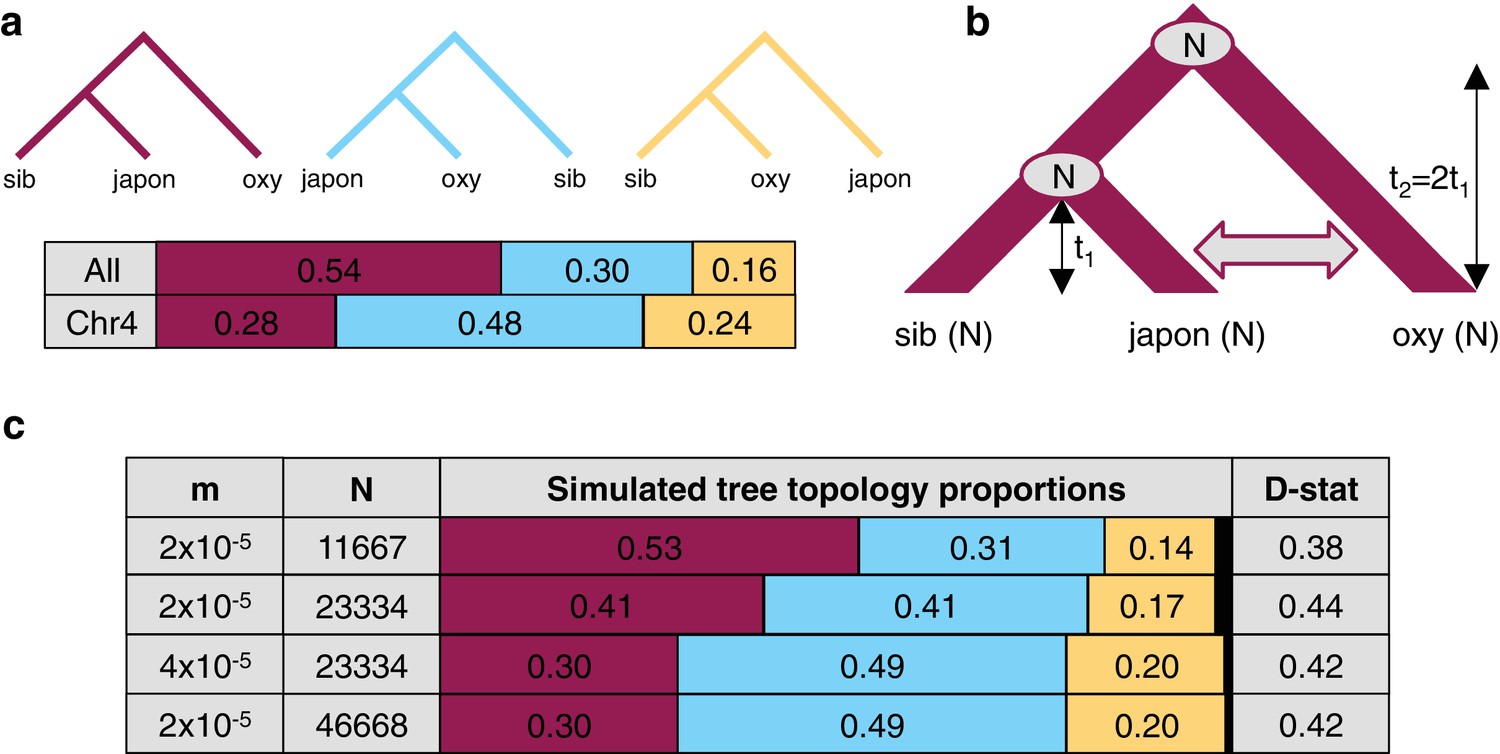
The effect of differences in coalescence time and gene flow on tree topologies.
(a) The observed proportion of informative derived variants supporting each possible Asian tree topology genome-wide and on chromosome four. Species considered include A. oxysepala (oxy), A. japonica (japon), and A. sibirica (sib). (b) The coalescent model with bidirectional gene flow in which A. oxysepala diverges first at time t2, but later hybridizes with A. japonica between t = 0 and t1 at a rate determined by per-generation migration rate, m. The population size (N) remains constant at all times. (c) The proportion of each tree topology and estimated D statistic for simulations using four combinations of m and Nvalues (t1 = 1 in units of N generations). The combination presented in the first row (m = 2x10⁻⁵ and N = 11667) generates tree topology proportions that match observed allele sharing proportions genomewide. Simulations with increased m and/or N (rows 3–4) result in proportions which more closely resemble those observed for chromosome four. Colors in proportion plots refer to tree topologies in (a), with black bars representing the residual probability of seeing no coalescence event. While this simulation assumes symmetric gene flow, similar results were seen for models incorporating both unidirectional and asymmetric gene flow (Figure 6—figure supplements 1 and 2).
Figure 6—figure supplement 1
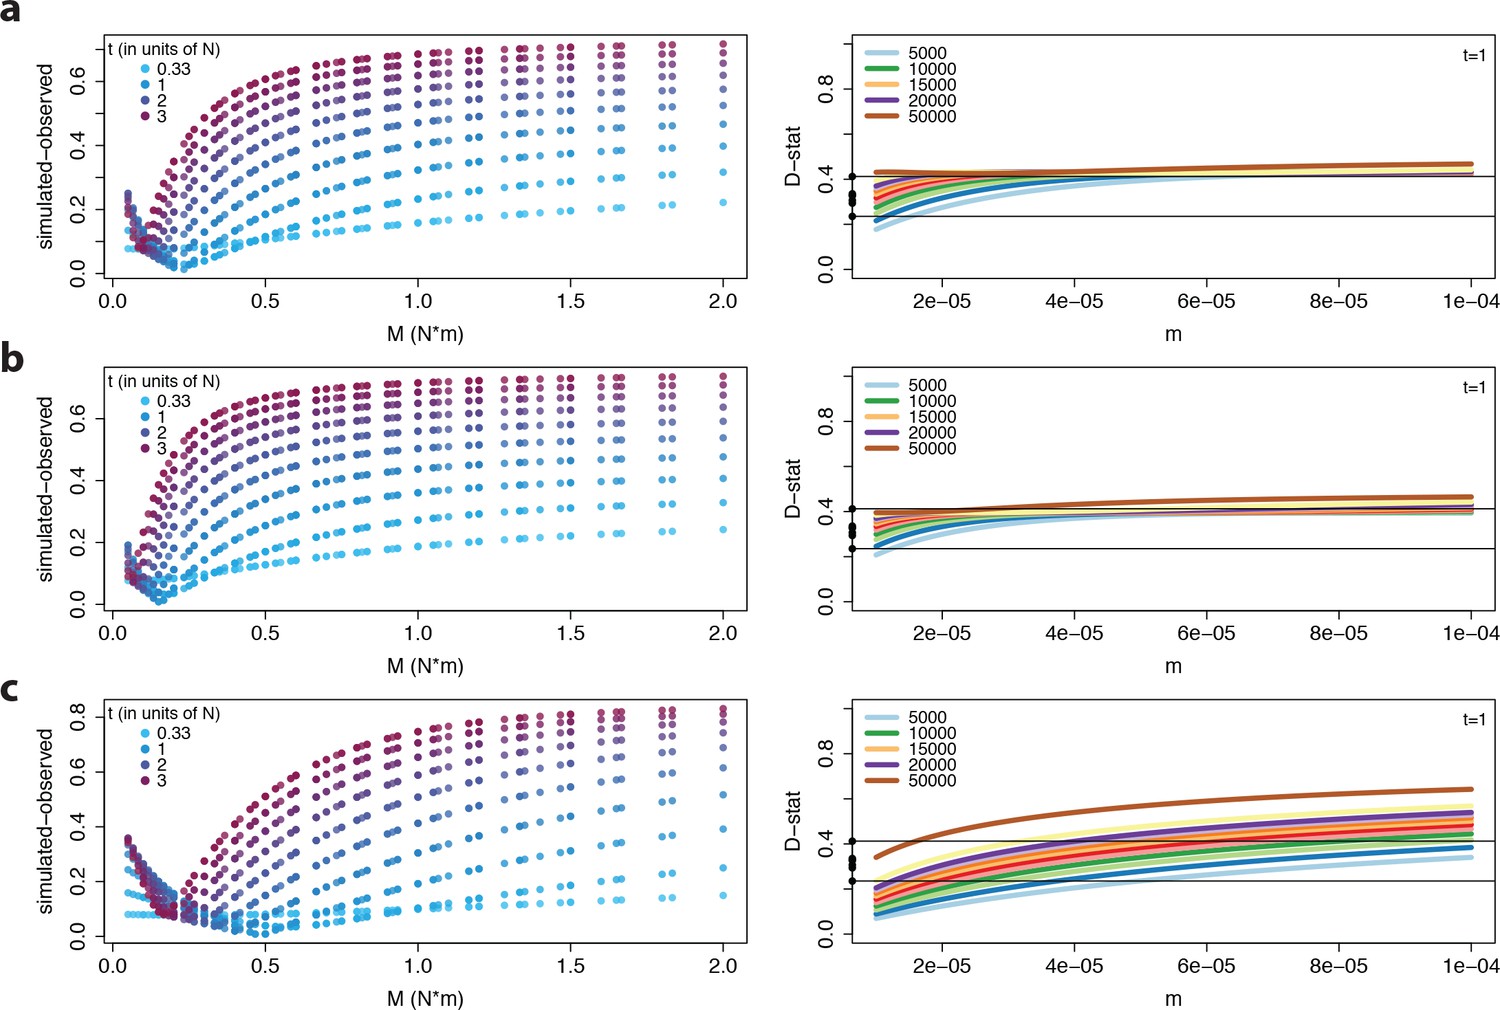
Model output for all three gene flow scenarios.
https://doi.org/10.7554/eLife.36426.016
Figure 6—figure supplement 2

Tree topology proportions simulated under assymmetric and unidirectional models.
https://doi.org/10.7554/eLife.36426.017
Figure 7 with 2 supplements
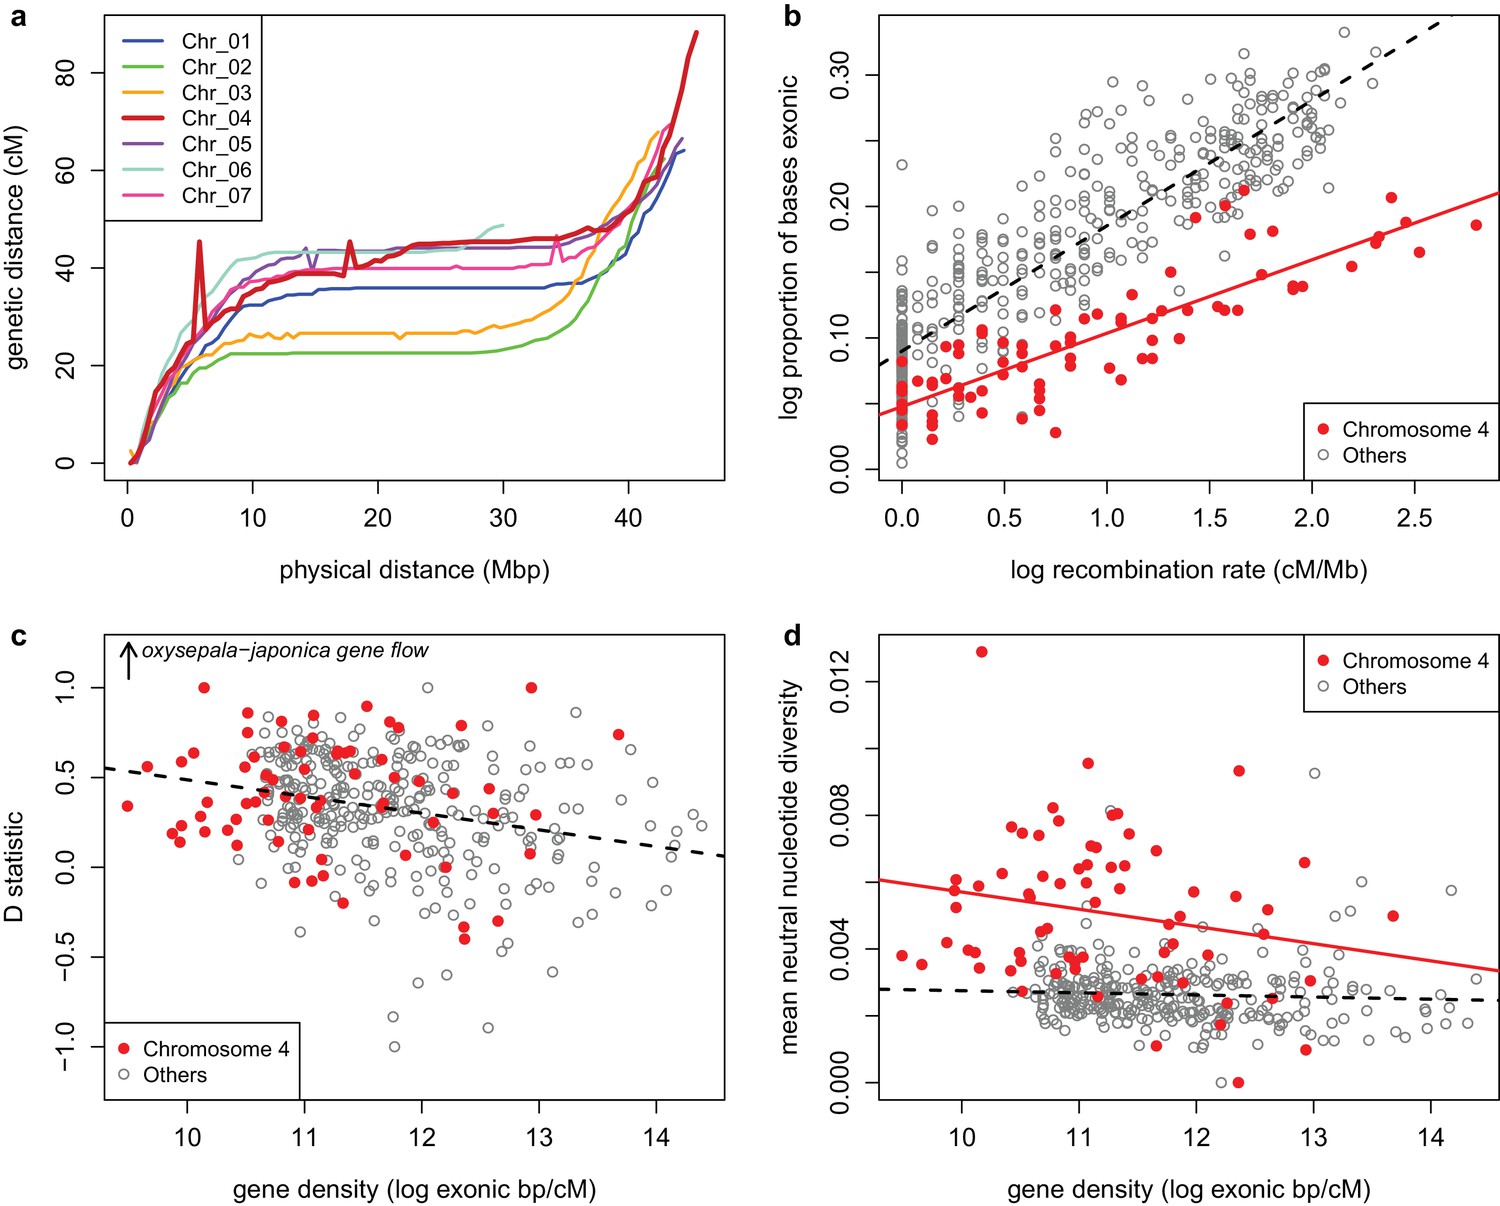
Recombination and selection on chromosome four (a) Physical vs.
genetic distance for all chromosomes calculated in an A. formosa x A. pubescens mapping population. High nucleotide diversity on chromosome four was also observed in parental plants of this population (Figure 7—figure supplement 1. (b) Relationship between gene density (proportion exonic) and recombination rate (main effect p-value < 2 x 10-16, chromosome four effect p-value < 2 x 10-16, interaction p-value < 1.936 x 10⁻¹¹, adjusted R2 = 0.8045). (c) Relationship between gene density and D statistic for A. oxysepala and A. japonica gene flow. (d) Relationship between gene density and mean neutral nucleotide diversity. Figure 7—source data 1.
-
Figure 7—source data 1
(Physical and genetic distance for A.formosa x A.pubescens markers).
- https://doi.org/10.7554/eLife.36426.021
Figure 7—figure supplement 1
Polymorphism in the A. formosa x A. pubescens mapping population.
https://doi.org/10.7554/eLife.36426.019
Figure 7—figure supplement 2

Distribution of gene expression values by chromosome.
https://doi.org/10.7554/eLife.36426.020
Figure 8 with 1 supplement
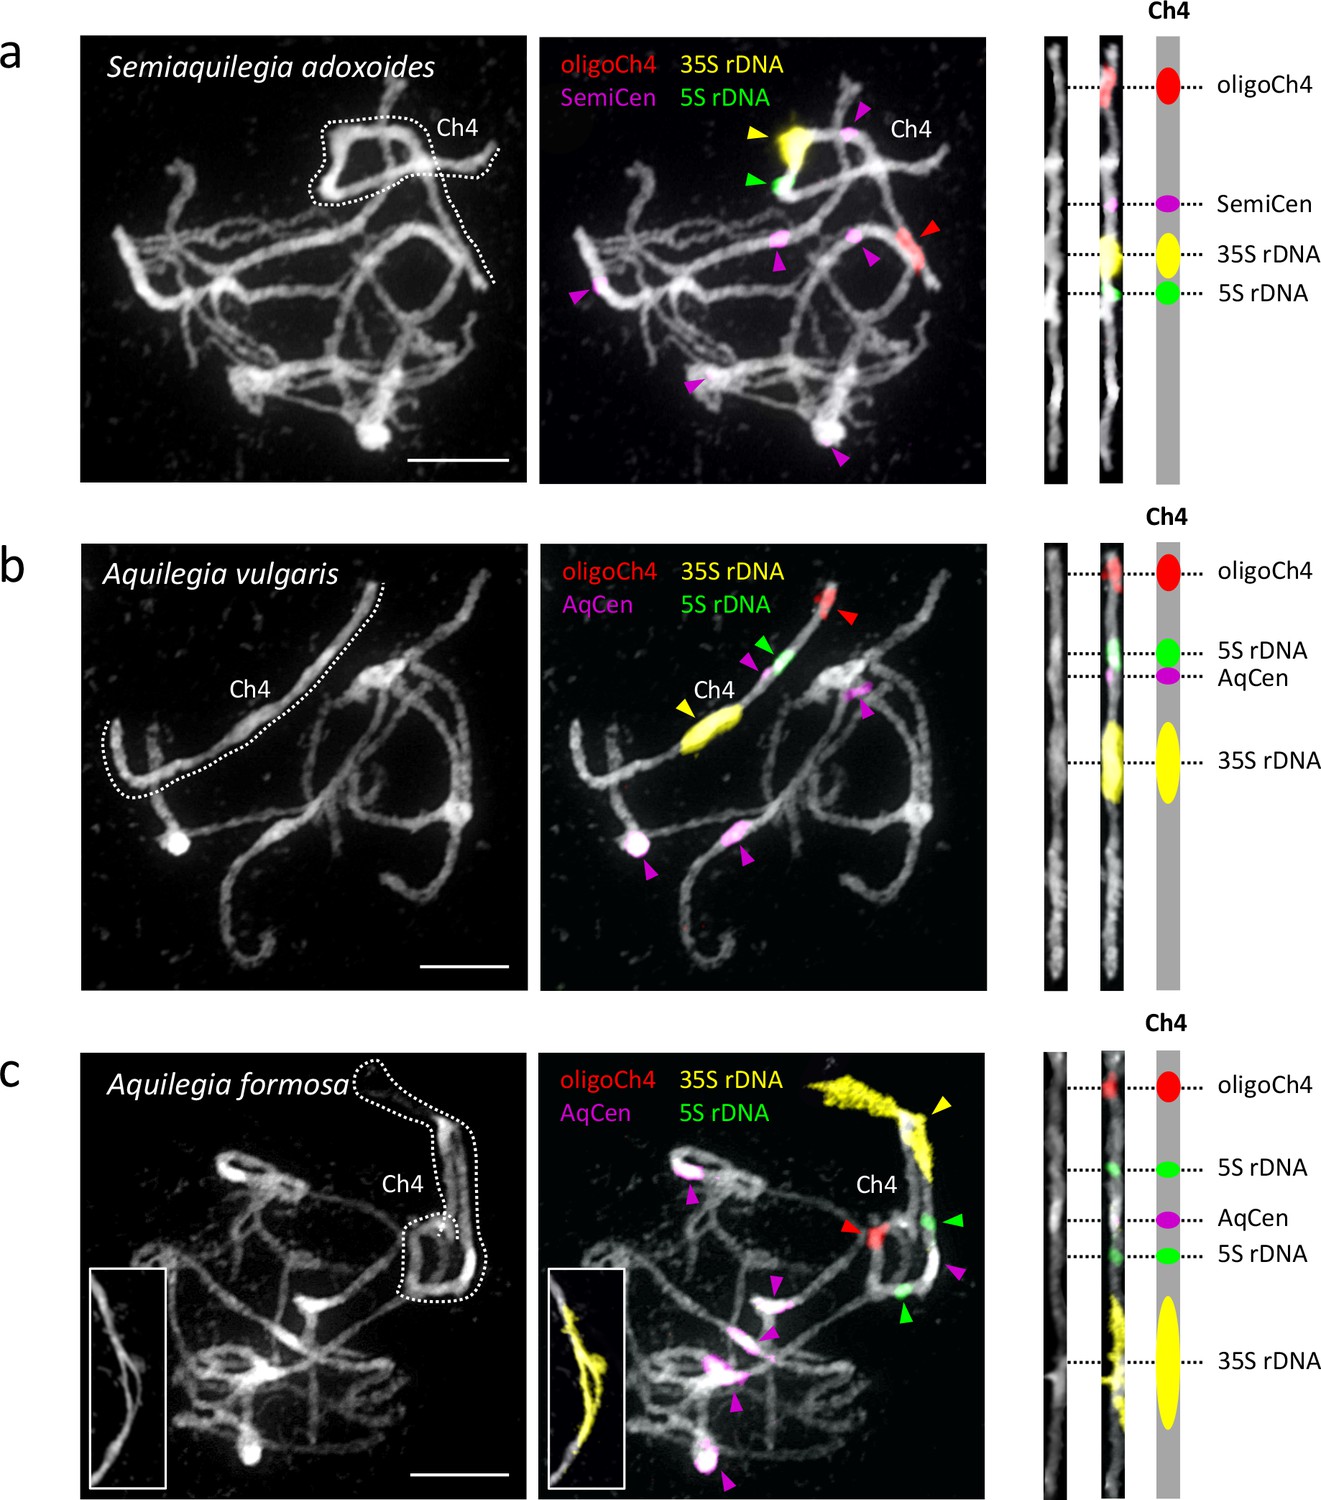
Cytogenetic characterization of chromosome four in Semiaquilegia and Aquilegia species.
Pachytene chromosome spreads were probed with probes corresponding to oligoCh4 (red), 35S rDNA (yellow), 5S rDNA (green) and two (peri)centromeric tandem repeats (pink). Chromosomes were counterstained with DAPI. Scale bars = 10 μm.
Figure 8—figure supplement 1
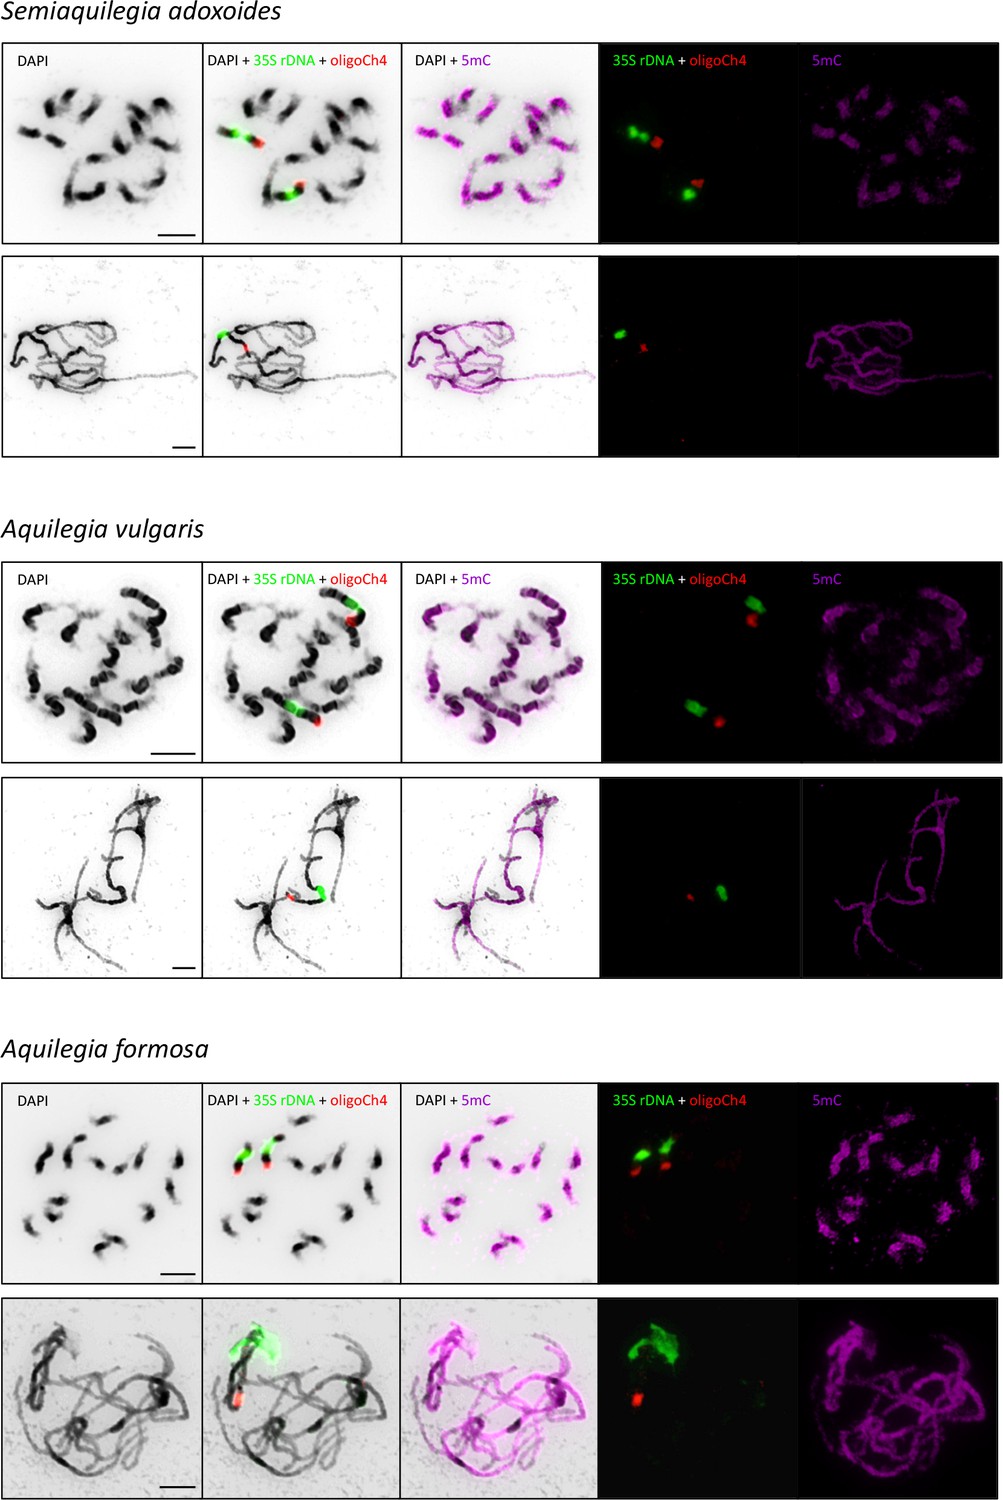
Immunodetection of anti-5mC antibody.
https://doi.org/10.7554/eLife.36426.026Tables
Table 1
GO term enrichment on chromosome four
https://doi.org/10.7554/eLife.36426.022| GO | Corrected P-value | Number on Chr_04 | Percent of Chr_04 genes | GO term | |
|---|---|---|---|---|---|
| Observed | Expected | ||||
| 0043531 | 140 | 9 | 7.57 | ADP binding | |
| 0016705 | 179 | 39 | 9.68 | Oxidoreductase activity, actingon paired donors, withincorporation or reduction of molecular oxygen | |
| 0004497 | 158 | 32 | 8.55 | Monooxygenase activity | |
| 0005506 | 181 | 46 | 9.79 | Iron ion binding | |
| 0020037 | 186 | 53 | 10.06 | Heme binding | |
| 0010333 | 39 | 4 | 2.11 | Terpene synthase activity | |
| 0016829 | 39 | 5 | 2.11 | Lyase activity | |
| 0055114 | 247 | 149 | 13.36 | Oxidation-reduction process | |
| 0016747 | 44 | 16 | 2.38 | Transferase activity,transferring acyl groups other than amino-acyl groups | |
| 0000287 | 42 | 15 | 2.27 | Magnesium ion binding | |
| 0008152 | 137 | 83 | 7.41 | Metabolic process | |
| 0006952 | 32 | 10 | 1.73 | Defense response | |
| 0004674 | 23 | 5 | 1.24 | Protein serine/threoninekinase activity | |
| 0016758 | 44 | 18 | 2.38 | Transferase activity, transferringhexosyl groups | |
| 0005622 | 14 | 42 | 0.76 | Intracellular | |
| 0008146 | 9 | 1 | 0.49 | Sulfotransferase activity | |
| 0016760 | 12 | 2 | 0.65 | Cellulose synthase(UDP-forming) activity | |
Table 2
Content of the A. coerulea v3.1 reference by chromosome
https://doi.org/10.7554/eLife.36426.023| Chromosome | Genome | |||||||
|---|---|---|---|---|---|---|---|---|
| 1 | 2 | 3 | 4 | 5 | 6 | 7 | ||
| Number of genes | 5041 | 4390 | 4449 | 3149 | 4786 | 3292 | 4443 | 29550 |
| Genes per Mb | 112 | 102 | 104 | 69 | 107 | 108 | 102 | 100 |
| Mean gene length (bp) | 3629 | 3641 | 3689 | 3020 | 3712 | 3620 | 3708 | 3580 |
| Percent repetitive | 38.9 | 41.1 | 39.1 | 54.2 | 39.4 | 39.3 | 40.6 | 42.0 |
| Percent genes withHIGH effect variant | 25.3 | 23.8 | 23.6 | 32.3 | 24.1 | 22.1 | 23.6 | 24.7 |
| Percent GC | 36.8 | 37.0 | 36.9 | 37.0 | 37.1 | 36.8 | 36.8 | 37.0 |
Table 3
Population genetics parameters for Semiaquilegia by chromosome
https://doi.org/10.7554/eLife.36426.024| | Percent pairwise differences | |||||||
|---|---|---|---|---|---|---|---|---|
| Chromosome | Genome | |||||||
| 1 | 2 | 3 | 4 | 5 | 6 | 7 | ||
| Polymorphism within Semiaquilegia | 0.079 | 0.085 | 0.081 | 0.162 | 0.076 | 0.078 | 0.071 | 0.082 |
| Divergence between Aquilegia and Semiaquilegia | 2.46 | 2.47 | 2.47 | 2.77 | 2.48 | 2.47 | 2.47 | 2.48 |
Additional files
-
Supplementary file 1
Genomic libraries included in the A. coerulea genome assembly and their respective assembled sequence coverage levels in the A. coerulea v3.1 release
- https://doi.org/10.7554/eLife.36426.027
-
Supplementary file 2
Summary statistics of the output of the whole genome shotgun assembly prior to screening, removal of organelles and contaminating scaffolds and chromosome-scale pseudomolecule construction
- https://doi.org/10.7554/eLife.36426.028
-
Supplementary file 3
Final summary assembly statistics for chromosome-scale assembly
- https://doi.org/10.7554/eLife.36426.029
-
Supplementary file 4
Placement of the individual BAC clones and their contribution to the overall error rate
- https://doi.org/10.7554/eLife.36426.030
-
Supplementary file 5
RNAseq data sets used for gene annotation
- https://doi.org/10.7554/eLife.36426.031
-
Supplementary file 6
Ratio of polymorphism or divergence on each chromosome versus genome-wide for each species
- https://doi.org/10.7554/eLife.36426.032
-
Supplementary file 7
Robustness of nucleotide diversity patterns to copy number variant detection methods
- https://doi.org/10.7554/eLife.36426.033
-
Supplementary file 8
Repeat family prevalence and permutation results in the A. coerulea v3.1 genome release
- https://doi.org/10.7554/eLife.36426.034
-
Supplementary file 9
K-mer based estimates of genome size and repetitive sequence proportion
- https://doi.org/10.7554/eLife.36426.035
-
Supplementary file 10
Mean and median coverage by species
- https://doi.org/10.7554/eLife.36426.036
-
Supplementary file 11
Proportion of sites removed by each filter - initial filtration without Semiaquilegia
- https://doi.org/10.7554/eLife.36426.037
-
Supplementary file 12
Proportion of sites removed by each filter - final filtration with Semiaquilegia
- https://doi.org/10.7554/eLife.36426.038
-
Supplementary file 13
Number of derived variants by species
- https://doi.org/10.7554/eLife.36426.039
-
Supplementary file 14
Transition matrix for the Five-State Markov process
- https://doi.org/10.7554/eLife.36426.040
-
Supplementary file 15
Transition matrix for the Eight-State Markov process
- https://doi.org/10.7554/eLife.36426.041
Download links
A two-part list of links to download the article, or parts of the article, in various formats.
Downloads (link to download the article as PDF)
Open citations (links to open the citations from this article in various online reference manager services)
Cite this article (links to download the citations from this article in formats compatible with various reference manager tools)
The Aquilegia genome provides insight into adaptive radiation and reveals an extraordinarily polymorphic chromosome with a unique history
eLife 7:e36426.
https://doi.org/10.7554/eLife.36426


